
 Submit a Paper
 Propose a Special lssue
 Open Access
ARTICLE

Overbooking-Enabled Task Scheduling and Resource Allocation in Mobile Edge Computing Environments
1 School of Computer, Henan University of Engineering, Zhengzhou, 451191, China
2 School of Computer Science and Technology, Henan Polytechnic University, Jiaozuo, 454000, China
3 School of Computer, Hubei University of Arts and Science, Xiangyang, 441053, China
4 School of Software Engineering, Anyang Normal University, Anyang, 455000, China
5 School of Computer and Information Engineering, Henan Normal University, Xinxiang, 453003, China
6 The Publicity Department, Zhengzhou University of Technology, Zhengzhou, 450044, China
* Corresponding Author: Jialei Liu. Email:
Intelligent Automation & Soft Computing 2023, 37(1), 1-16. https://doi.org/10.32604/iasc.2023.036890
Received 15 October 2022; Accepted 23 November 2022; Issue published 29 April 2023
 View Full Text
 Download PDF
Abstract
Mobile Edge Computing (MEC) is proposed to solve the needs of Internet of Things (IoT) users for high resource utilization, high reliability and low latency of service requests. However, the backup virtual machine is idle when its primary virtual machine is running normally, which will waste resources. Overbooking the backup virtual machine under the above circumstances can effectively improve resource utilization. First, these virtual machines are deployed into slots randomly, and then some tasks with cooperative relationship are offloaded to virtual machines for processing. Different deployment locations have different resource utilization and average service response time. We want to find a balanced solution that minimizes the average service response time of the IoT application while maximizing resource utilization. In this paper, we propose a task scheduler and exploit a Task Deployment Algorithm (TDA) to obtain an optimal virtual machine deployment scheme. Finally, the simulation results show that the TDA can significantly increase the resource utilization of the system, while reducing the average service response time of the application by comparing TDA with the other two classical methods. The experimental results confirm that the performance of TDA is better than that of other two methods.Keywords
With the development of Internet of Things (IoT) applications, IoT technology, and IoT communication technology, users can experience various applications on IoT terminals, such as virtual reality, augmented reality and artificial intelligence [1]. Although this brings a good experience to users, it also brings new challenges to the processing performance, storage capacity, and timeliness of IoT devices. Mobile Edge Computing (MEC) is designed to meet the needs of IoT users for high resource utilization, high reliability and low latency of service requests [2]. IoT applications located on the mobile side can be divided into several tasks with dependencies [3], and MEC can provide a variety of time-critical and resource-intensive services for IoT users nearby [4]. Reliability and service response time are very important factors to measure the quality of service (QoS) [5], due to a large number of virtual machines running in the edge network, it is unrealistic to assure that all virtual machines can work normally [6].
There is no way to avoid virtual machine failures in MEC, this also results in unreliable many edge networks [7]. In MEC environment, QoS plays a crucial role, there may be some unpredictable fault events in MEC [8,9], and there is some connection between these failures. For example, if an edge cloud in MEC fails, any switch and edge server in the edge cloud are both unavailable, if a switch fails, any edge server connected to the switch is unavailable, all virtual machines on the edge server are also unavailable. Therefore, it is very necessary to enhance the reliability of MEC services [10]. The reliability of MEC can be greatly improved by utilizing virtual machine replication [11] or redundancy methods. Among them, When the operation of the primary virtual machine fails, the backup virtual machine of the primary virtual machine takes over and continues to work normally. However, when the primary virtual machine is working normally, the backup virtual machine is in an idle state, this will consume additional resources and reduce resource utilization [12].
Overbooking these backup virtual machines in idle state can increase resource utilization. Supposing that each server is virtualized into several slots, each primary virtual machine uses a separate slot, while one or more backup virtual machines can use a common slot, this can greatly increase resource utilization [13]. An application is composed of multiple tasks with a cooperative relationship [14]. If the tasks are unreasonably deployed on the virtual machine, it may cause unbalanced resource allocation among edge servers, decrease resource utilization [15], and network congestion may occur in severe cases, this cannot realize the low latency requirements of some applications [16]. Therefore, how to deploy tasks to minimize the average service response time of the application and maximize the resource utilization is the goal of this paper.
We introduced Task Scheduler (TS) to solve the above problems. First, a random algorithm is used to randomly place virtual machines in slots according to the placement rules, and then the applications are handed over to TS for processing. TS first sorts applications according to their priorities, and then considers that different task deployment schemes have different resource utilization, deployment scheme risks, and average service response time of applications. Finally, the Task Deployment Algorithm (TDA) is used to get an optimal task deployment strategy to achieve the minimum average service response time of the application and the maximum system resource utilization within the risk range of the system deployment scheme.
Our main contributions are as follows:
• We propose overbooking of backup virtual machines to deal with the waste of resources. In addition, we propose three models, one is a risk model, it is used to evaluate the overall deployment scheme risk corresponding to different deployment schemes of virtual machines, another is a service response time model that measures the average completion time of an application, and the last is a resource utilization model that measures the overall resource allocation of the system.
• Based on the above three models, we propose our optimization objective, that is, minimizing the average service response time of an application while maximizing resource utilization, and turning it into a single-objective optimization problem. Finally, this paper proposes TDA to maximize the joint optimization value.
• We set up a MEC environment, and carry out simulation experiments in this environment. The final results show that our method outperforms the other two more classical methods.
The rest of this article is structured as follows. Section 2 studies and analyzes the related literature; Section 3 presents the problem and establishes the model; Section 4 defines the problem; Section 5 proposes corresponding solutions to the above problems; Section 6 sets up the experimental environment and the analyzes the results; Section 7 summarizes the whole article.
On the basis of ensuring system reliability, reasonable deployment of tasks to increase resource utilization and reduce the average service response time of applications. These are important challenges that MEC faces and call on many researchers to conduct research [17]. Zhao et al. [18] proposed the Harmonic and First-Fit algorithms, these two algorithms can solve the deployment problem of virtual machines. In addition, they also proposed least reliable first and reduced density greedy algorithms. These four algorithms can improve resource utilization. Liu et al. [19] proposed a task offloading method for reliability enhancement and differential tasks to optimize the trade-off between bandwidth consumption and reliability. The final simulation results show that this method can effectively increase the system reliability and resource utilization. Li et al. [20] proposed an energy-aware edge server placement algorithm based on particle swarm optimization to optimize resource utilization. And they used the data set to conduct experiments, the results show that the algorithm can reduce energy consumption by about 10% and improve resource utilization by about 15% compared with other representative algorithms. These methods only consider the optimization of resource utilization, but not the optimization of latency. In addition, these methods do not consider the overbooking of backup virtual machines. Rahman et al. [21] proposed a combined partial computation offload and resource allocation algorithm based on deep learning, and can obtain the optimal value of task offload and resource allocation. Simulation results verify the effectiveness of the algorithm.
Kavitha et al. [22] proposed a latency-aware concurrent data management method in MEC. This method optimizes data based on differential evolution, and data can be allocated precisely. Finally, it is confirmed by simulation experiments that it can optimize resource utilization and service response time. Li et al. [23] proposed a distributed game theory task offloading assignment algorithm. They regard the task assignment problem as a game to maximize resource utilization within the application deadline. Finally, experiments show that the algorithm can significantly improve the system resource utilization within the range of most task offloading delays. Rodrigues et al. [24] proposed a method using virtual machine deployment and transmission power limitation, combined with a heuristic algorithm to decrease latency and increase resource utilization. Ren et al. [25] exploited an optimal joint communication and computing resource allocation algorithm to improve resource utilization and reduce latency. Although these methods consider the joint optimization of delay and resource utilization, they do not consider that the application can be processed by a middleware to achieve the optimization of the target. Zhang et al. [26] proposed an available embedded framework for aware virtual data center, this is equivalent to a middleware, the middleware calculates physical hardware components and specified resource requirements to increase availability and generate higher revenue. Although this paper considers the use of virtual data center as a middleware to increase the availability of resources, it does not take into account the joint optimization of resource utilization and the average service response time of the application.
In the research and integration of recent literature, we noticed that these documents did not apply the concept of overbooking to the placement of virtual machines. In addition, these documents did not consider the use of a middleware to deploy tasks, thereby jointly optimizing resource utilization and the average service response time of applications [27]. Combining these shortcomings [28], in this paper, we first adopt RFF to put virtual machines into slots, and some backup virtual machines can be overbooked during the placement process. Then we exploit TS to schedule the application, and determined an optimal deployment scheme through the TDA method to maximize resource utilization while minimizing the average service response time of the application.
In this section we propose TS (as shown in Fig. 1), and study the principle of TS. The TS-based MEC system model diagram is shown in Fig. 2. The system in Fig. 2 contains multiple edge clouds (ECs), and the MEC network is interconnected by a fiber-optic network in a full mesh topology. Each edge cloud consists of a number of servers and switches. Each server can be virtualized into multiple slots, each slot can place a primary virtual machine or multiple backup virtual machines, and each virtual machine (VM1 or VM2) can only host one task (T1 or T2).
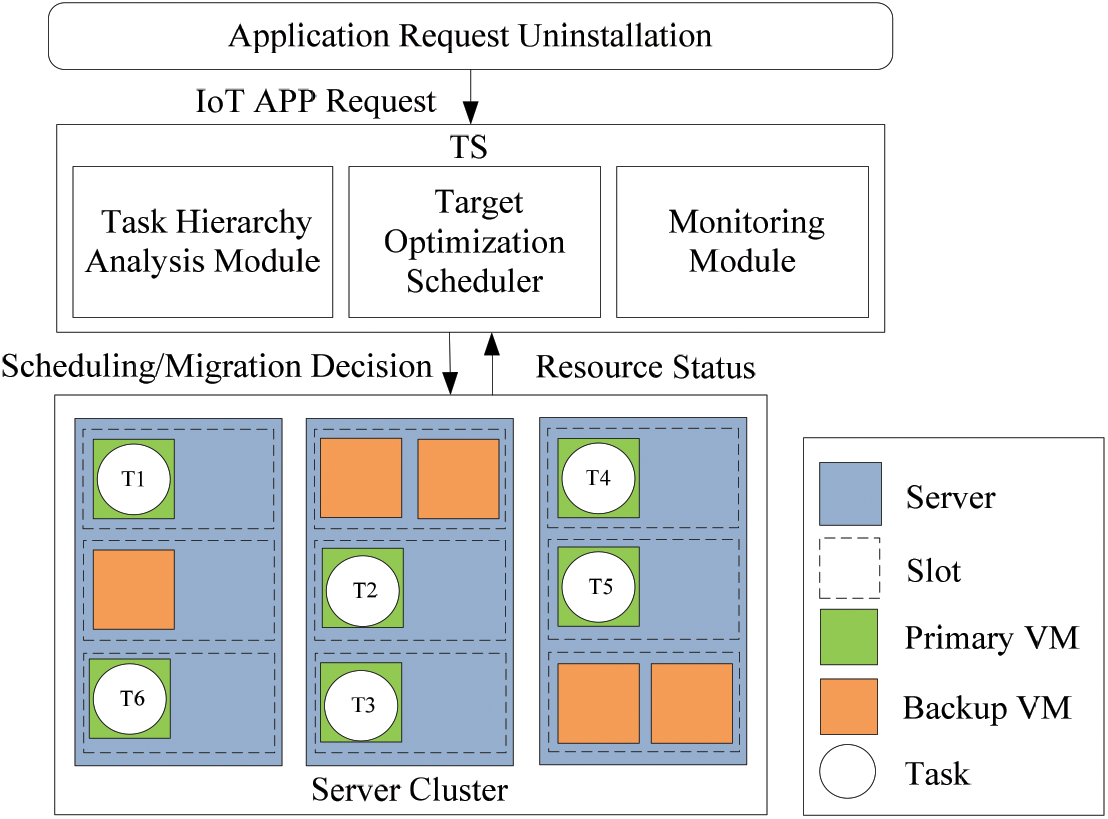
Figure 1: TS architecture diagram
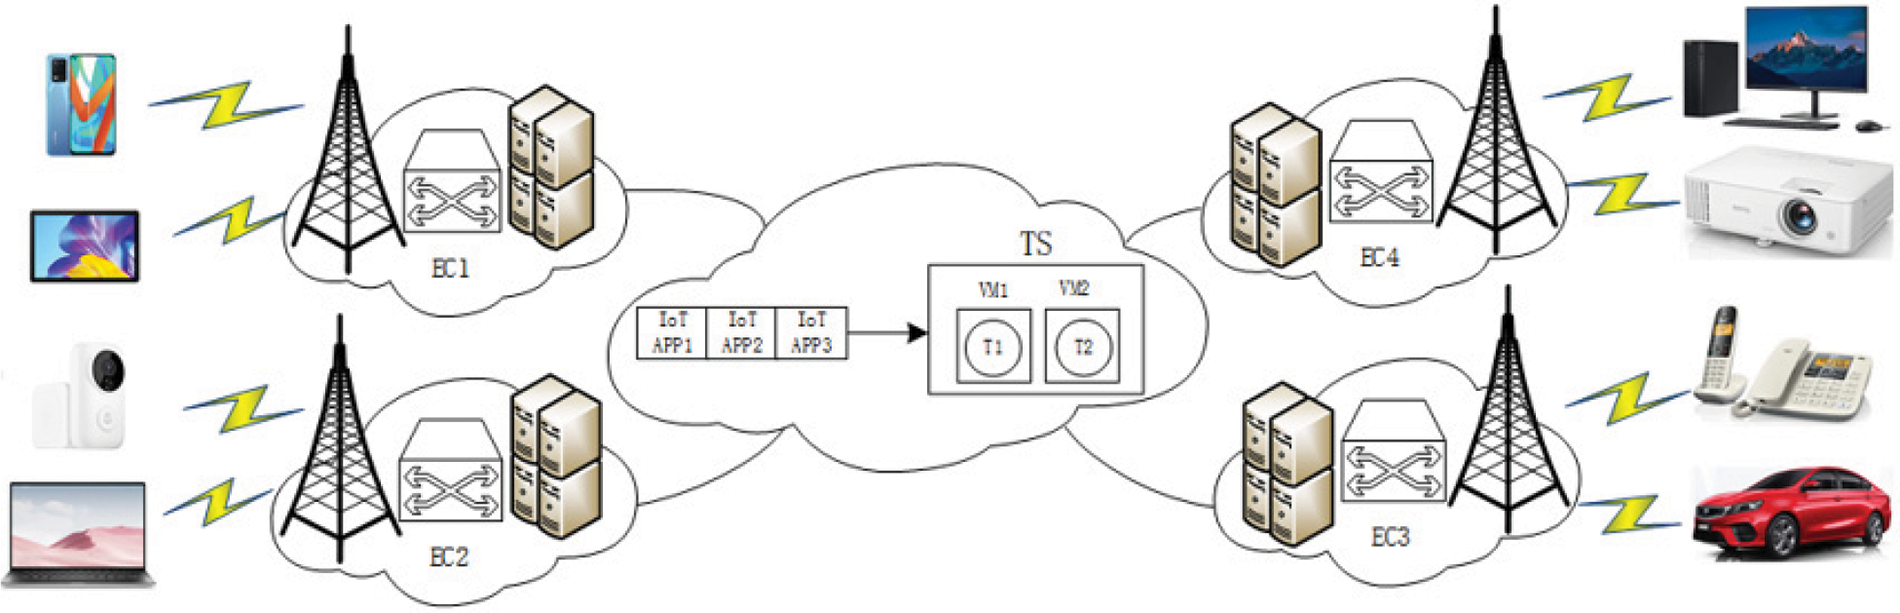
Figure 2: TS-based MEC system model
Every IoT application constitutes of multiple tasks with cooperative relationships, these tasks are modeled as a directed acyclic graph, there are dependencies between these different tasks, as shown in Fig. 3. Task T2 (T3) can be processed only after task T1 is completed and the result is sent to T2 (T3), and only when tasks T2, T3 are completed and their results are sent to T4, T5 and T5, T6, T7 can be processed. The arrows indicate the dependencies between tasks.
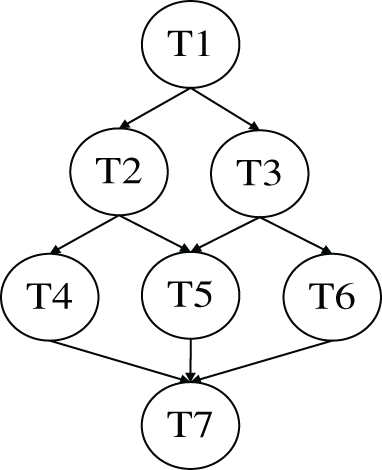
Figure 3: Directed acyclic graph of applications
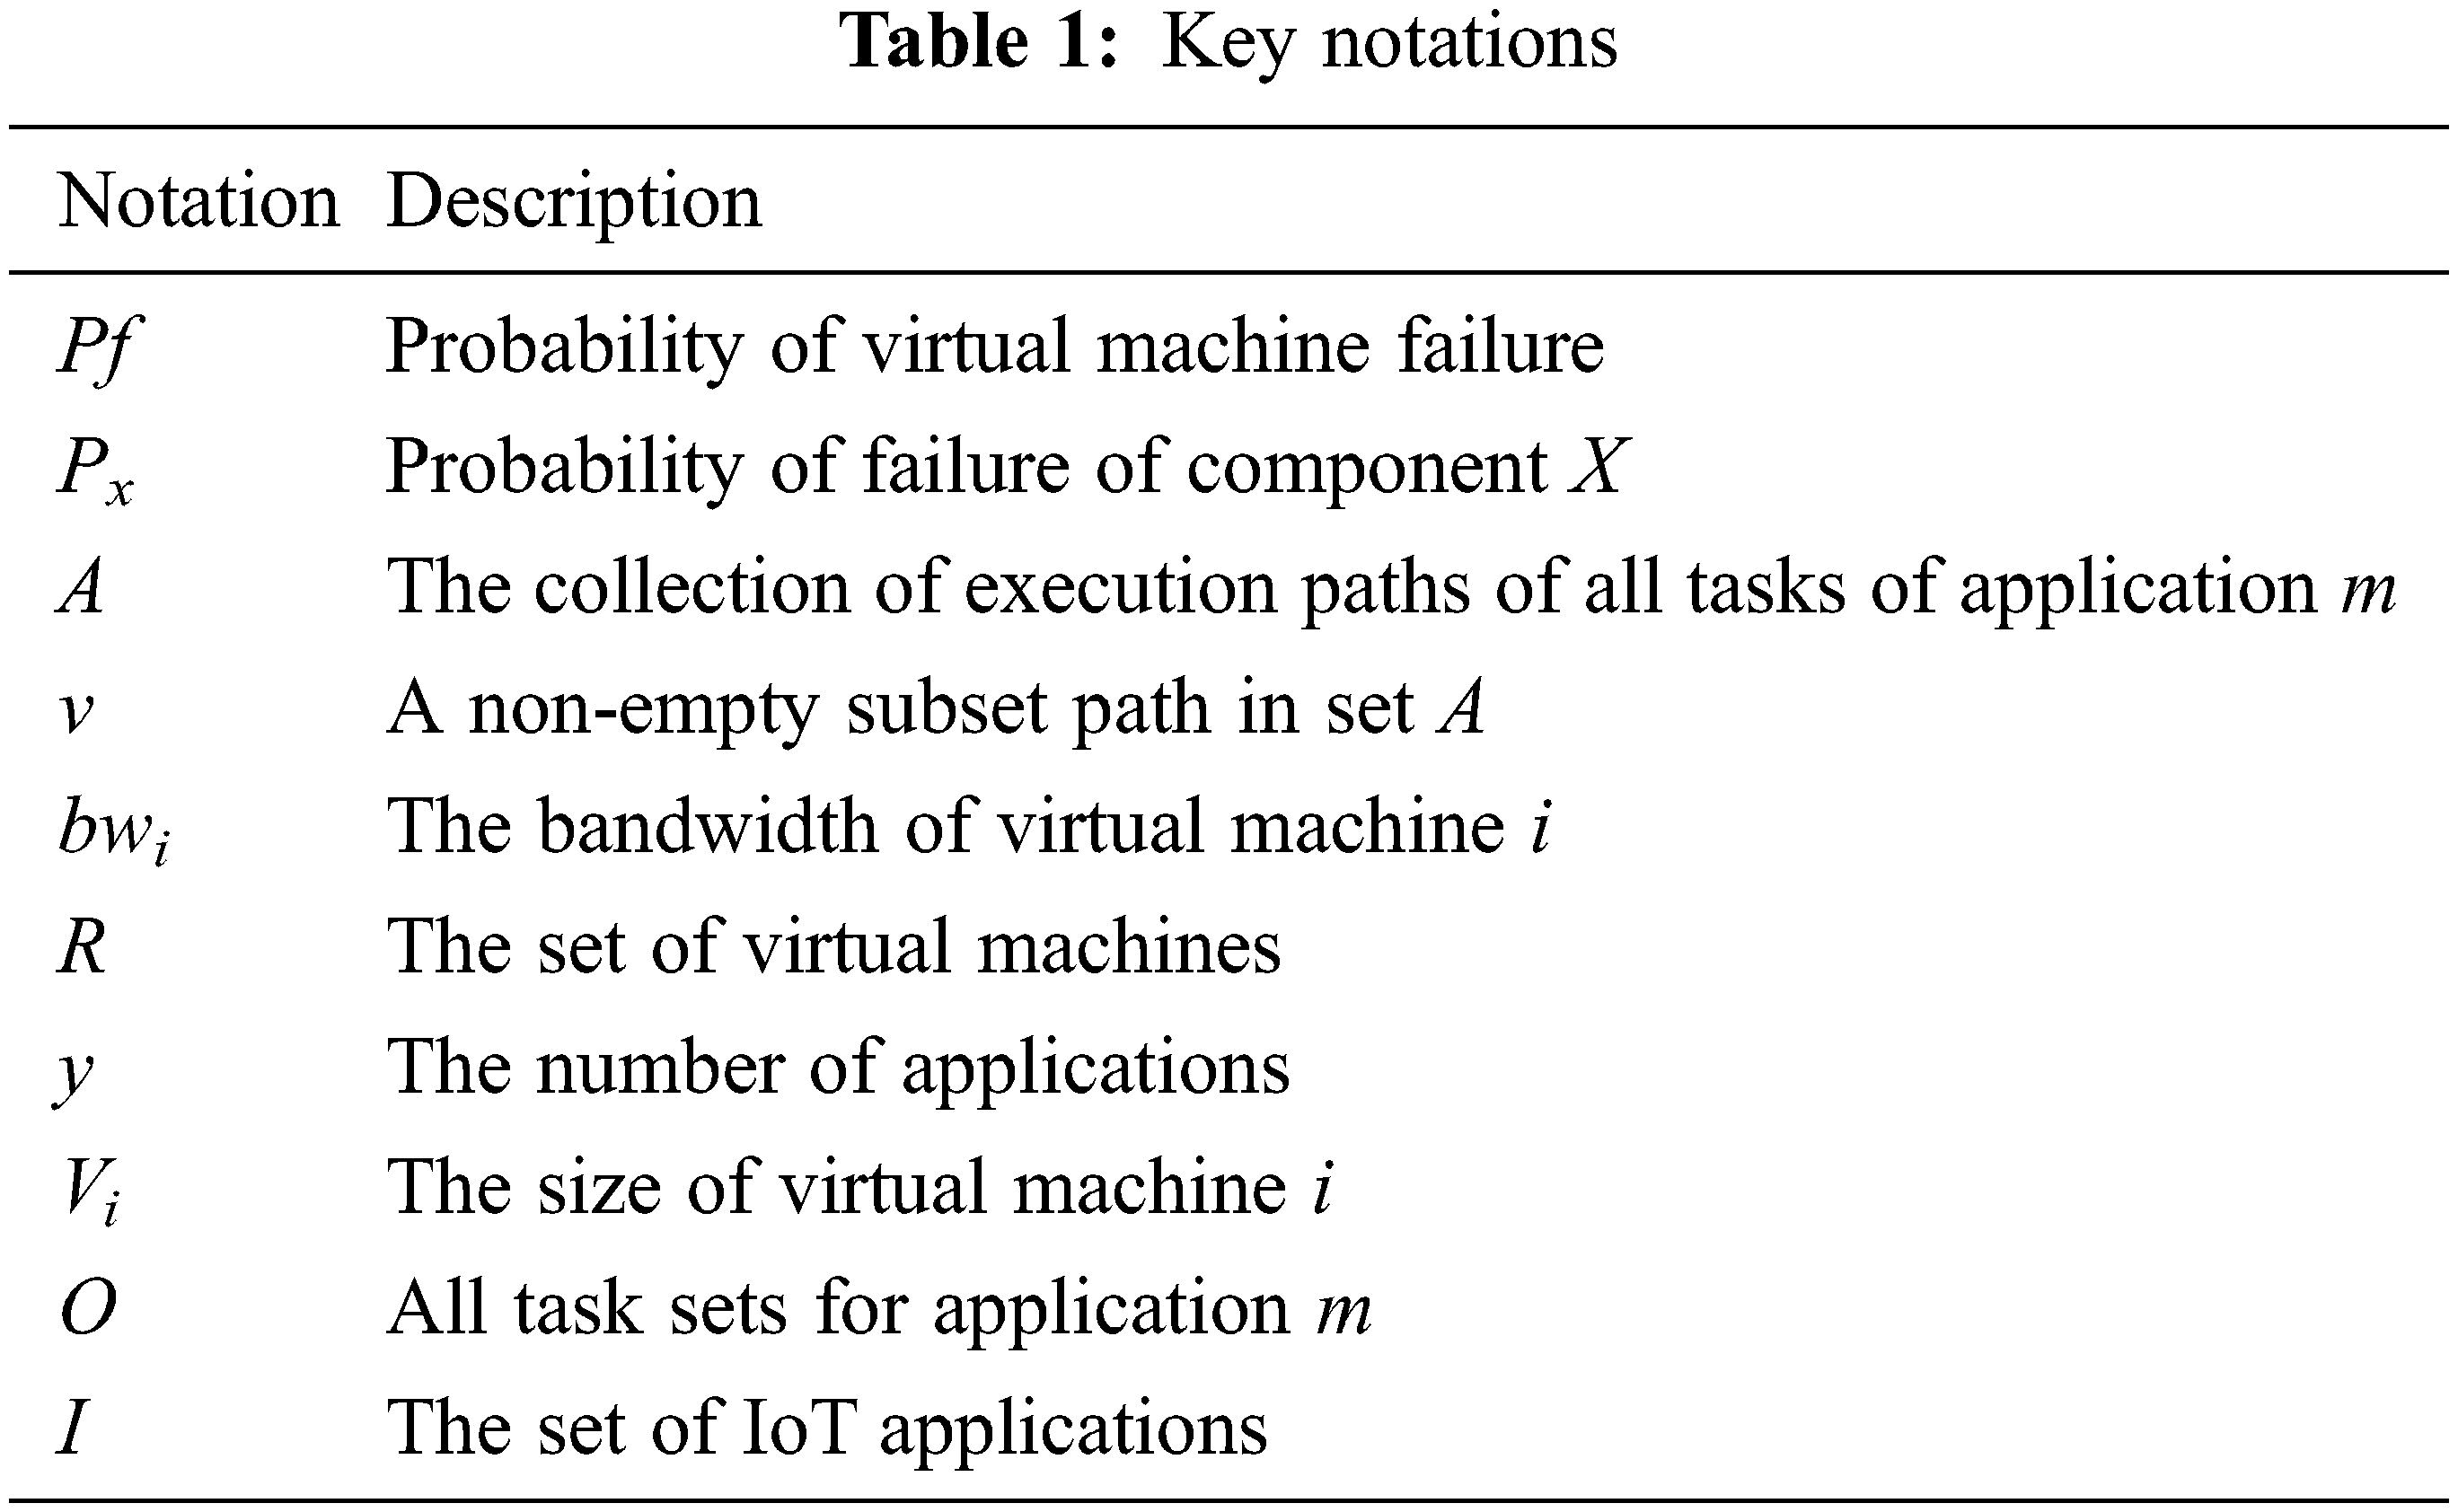
First, we exploit a random algorithm to place the virtual machine in the slot of the edge server, and then hand over the IoT applications (IoT APP1, IoT APP2, IoT APP3) to the TS for processing, the completion deadlines of applications are different, and their priorities are also different. The shorter the deadline, the higher the priority. The TS offloads the application to different virtual machines for processing according to the priority order of the application. The TS architecture diagram is shown in Fig. 1. It is divided into three modules, namely the monitoring module, the task level analysis module and the target optimization scheduling module. The monitoring module is responsible for detecting the usage of physical resources. The task hierarchy analysis module is responsible for dividing the uninstalled application into multiple tasks, analyzing the relationship between tasks, and determining the priority of task deployment. Finally, the target optimization scheduling module determines a set of optimal task deployment plans according to the data provided by the monitoring module, that is to minimize the average response time of the application while maximizing resource utilization. In addition, the risk of the overall deployment scheme of the system should also be considered. To attack these problems, we introduce a risk model, a service response time model and a resource utilization model. To facilitate viewing, we show the key notations of the context in Table 1.
In MEC, the task is offloaded and handed over to the virtual machine in the edge cloud environment for processing. Assuming that the fault rate of every virtual machine is independent of each other, the probability of each virtual machine failure is calculated using formulation (1), and the probability of each component working normally is calculated using formulation (2):
Among them, Ped indicates the fault rate of the edge cloud, Psw indicates the fault rate of switches in the edge cloud, and Pse indicates the fault rate of the edge server connected to the switch in the edge cloud.
MTBFED, MTBFSW and MTBFSE represent the average time between failures of edge cloud, switch and edge server categories respectively. MTBF represents the average value of the two fault occurrence periods of the system, MTTR represents the average time taken by the system from occurrence to repair failure. The virtual machine placement rules need to be followed when the virtual machine is placed in the slot.
Virtual machine placement rules: If a primary virtual machine is placed in a slot with a high fault rate, it is easy to fail. Therefore, the backup virtual machine that takes over the primary virtual machine can only be placed in a slot with a low fault rate, and the backup virtual machine must have a single slot. If a primary virtual machine is placed in a low fault rate slot, the backup virtual machine that takes over the primary virtual machine can be placed in a high fault rate slot or a low fault rate slot, and these backup virtual machines can enjoy one slot at a certain overbooking rate.
This paper mainly studies the 1 + 1 system (i.e., 1 task corresponds to 1 primary virtual machine + 1 backup virtual machine). If there are n tasks, a total of 2n virtual machines are required. The systematic risk model is calculated using formulation (6).
The formulation is expressed as the product of the probability of all failures of the primary virtual machine and the backup virtual machine processing n tasks. Since each primary virtual machine occupies a slot, n primary virtual machines need to occupy n slots. For backup virtual machines, some of them need to occupy a single slot, and some share a slot within the range of the overbooking rate. The number of these slots is n′, Pk indicates the fault rate of the slot where the primary virtual machine processing n tasks is located, and Pk′ indicates the fault rate of the slot where the backup virtual machine processing n tasks is located. It can be seen from this formulation that the fewer the number of slots occupied by these virtual machines, the higher the probability that the virtual machines will fail as a whole. This is because when a slot fails, it is easy to cause all virtual machines located in the slot to fail.
3.2 Service Response Time Model
For the application, the service response time consists of the following three parts: (1) The transmission delay required to offload the service request for IoT to the nearby MEC server; (2) The processing time and processing delay of the application; (3) The communication time generated when tasks located on different servers communicate with each other.
IoT applications and edge cloud access through orthogonal frequency division multiple access to achieve wireless communication between them.
BW and N represent the bandwidth and noise power of the link between application m and edge cloud ed, respectively. dm indicates the data size of the application to be transferred. The transmission delay tm for IoT devices to offload applications to edge servers can be calculated using formulation (8).
In addition, the communication between tasks located on different edge servers will cause communication delay. The time required for the j-th virtual machine to process task q of the m-th application tmqj is equal to lmq/cj, where lmq represents the directive length of the q-th task, and cj represents the processing power of virtual machine j. The calculation process of the overall processing time Tmqj of the task is calculated using formulation (9), it is composed of processing time tmqj and processing delay dmqj.
Application m is composed of multiple tasks with a cooperative relationship. The execution paths of these tasks are different and the time spent is different. The time taken to complete the longest path is the service response time used to complete the application, it consists of the transmission time of an application and the longest path of the application’s maximum task processing time and communication time between tasks, the specific calculation process can be determined by formulation (10). Since the amount of data feeding back the results of the application is very small, the time to return data to IoT users is negligible.
Among them, A represents the set of paths of all tasks of application m, and v represents a non-empty subset path in set A. βmqz and
3.3 Resource Utilization Model
First, the virtual machine needs to be placed in the slot on the basis of the virtual machine placement rules, and then the task is offloaded to the virtual machine. The model of system resource utilization U is calculated using formulation (11), it is equal to the total number of virtual machines processing tasks divided by the total number of slots occupied by these virtual machines. Among them, 2n represents the total number of virtual machines processing tasks, and S represents the total number of slots occupied by these virtual machines.
This section mainly introduces the joint optimization objective function. In MEC, the primary virtual machine needs to process tasks and maintain communication, while the backup virtual machine only needs to keep the data of its main virtual machine synchronized at regular intervals. If the virtual machines processing tasks are not on the same edge server, the communication time between them is mainly determined by the bandwidth of the virtual machine in the sending state and the data size of the tasks that the virtual machine needs to process. The total bandwidth of the edge server is fixed. If the bandwidth required to process a task of an application increases, the bandwidth required for other tasks located on that server will decrease, the communication time of IoT applications corresponding to these tasks increases. In addition, the virtual machines that process tasks are deployed in different locations in the edge server, and the corresponding system deployment solutions have different risks and resource utilization. The more slots for deploying this part of virtual machines, the lower the risk, but at the same time, the resource utilization will decline. Therefore, we should look for a trade-off solution to solve these problems.
The optimization goal of this paper is to maximize resource utilization while minimizing the average service response time of the application. This is a multi-objective optimization problem, the problem is transformed into a single objective optimization problem by using the method of weighted value, where y represents the number of applications, as shown in formulation (12), where θ is an adjustable weight factor, which ranges from 0 to 1.
Formulation (13) indicates that the sum of the capacities of all virtual machines cannot be more than the capacity of the slots containing these virtual machines, Vi represents the size of the i-th virtual machine, xia represents slot a for placing the i-th virtual machine, and Ca represents the maximum capacity of slot a; Formulation (14) indicates that each virtual machine can only be placed in one slot; Formulation (15) indicates that each task can only be placed in one slot, Vmq indicates the size of the q-th task of application m, ximq represents the size of the i-th virtual machine that processes the q-th task, O represents all task sets of application m, and I represents IoT application set; Formulation (16) indicates that the size of every task cannot more than the size of the virtual machine where the task is deployed, and Li represents the maximum capacity of the i-th virtual machine; Formulation (17) indicates that the fault rate of each slot to place virtual machines cannot exceed the maximum fault rate allowed by the system; Formulation (18) indicates that the risk of the total placement scheme of the system cannot exceed the maximum risk value.
In this section, the first virtual machine is randomly placed in the slot. If the slot cannot hold the virtual machine, it will continue to select other slots until it is successfully placed in the slot, and then perform the same operations successively until all virtual machines are placed in the slot. Secondly, we analyze the application of TS and its impact on the average service response time of the application and the resource utilization of the system, and propose TDA, this method considers the application’s task in the virtual machine should be how to deploy to ensure the maximum value of the joint optimization objective F, as shown in Algorithm 1.
The algorithm first initializes all parameters and sorts them according to application deadline priority, with smaller deadlines having higher priority. Second, the third and fourth lines determine the level of division according to the top-to-bottom order of the task directed acyclic graph, and traverse these tasks. For example: use Am to represent the number of task structure layers of application m (m ∈ 1, 2, … y), the top task needs to send data to the next layer task that has a cooperative relationship with it, and the bottom task is used to receive data that has a cooperative relationship with it. The data sent by the upper-layer task of the collaboration relationship, the middle-layer task can both send data and receive data. Line 5 represents the traversal of each layer of the task. Lines 6–11 represent the priority judgment of top-level tasks and the methods used to deploy these tasks.
The top-level tasks of the application (Am = 1) are sorted in descending order according to Q, and tasks with large Q are prioritized, as shown in formulation (19).
Among them,
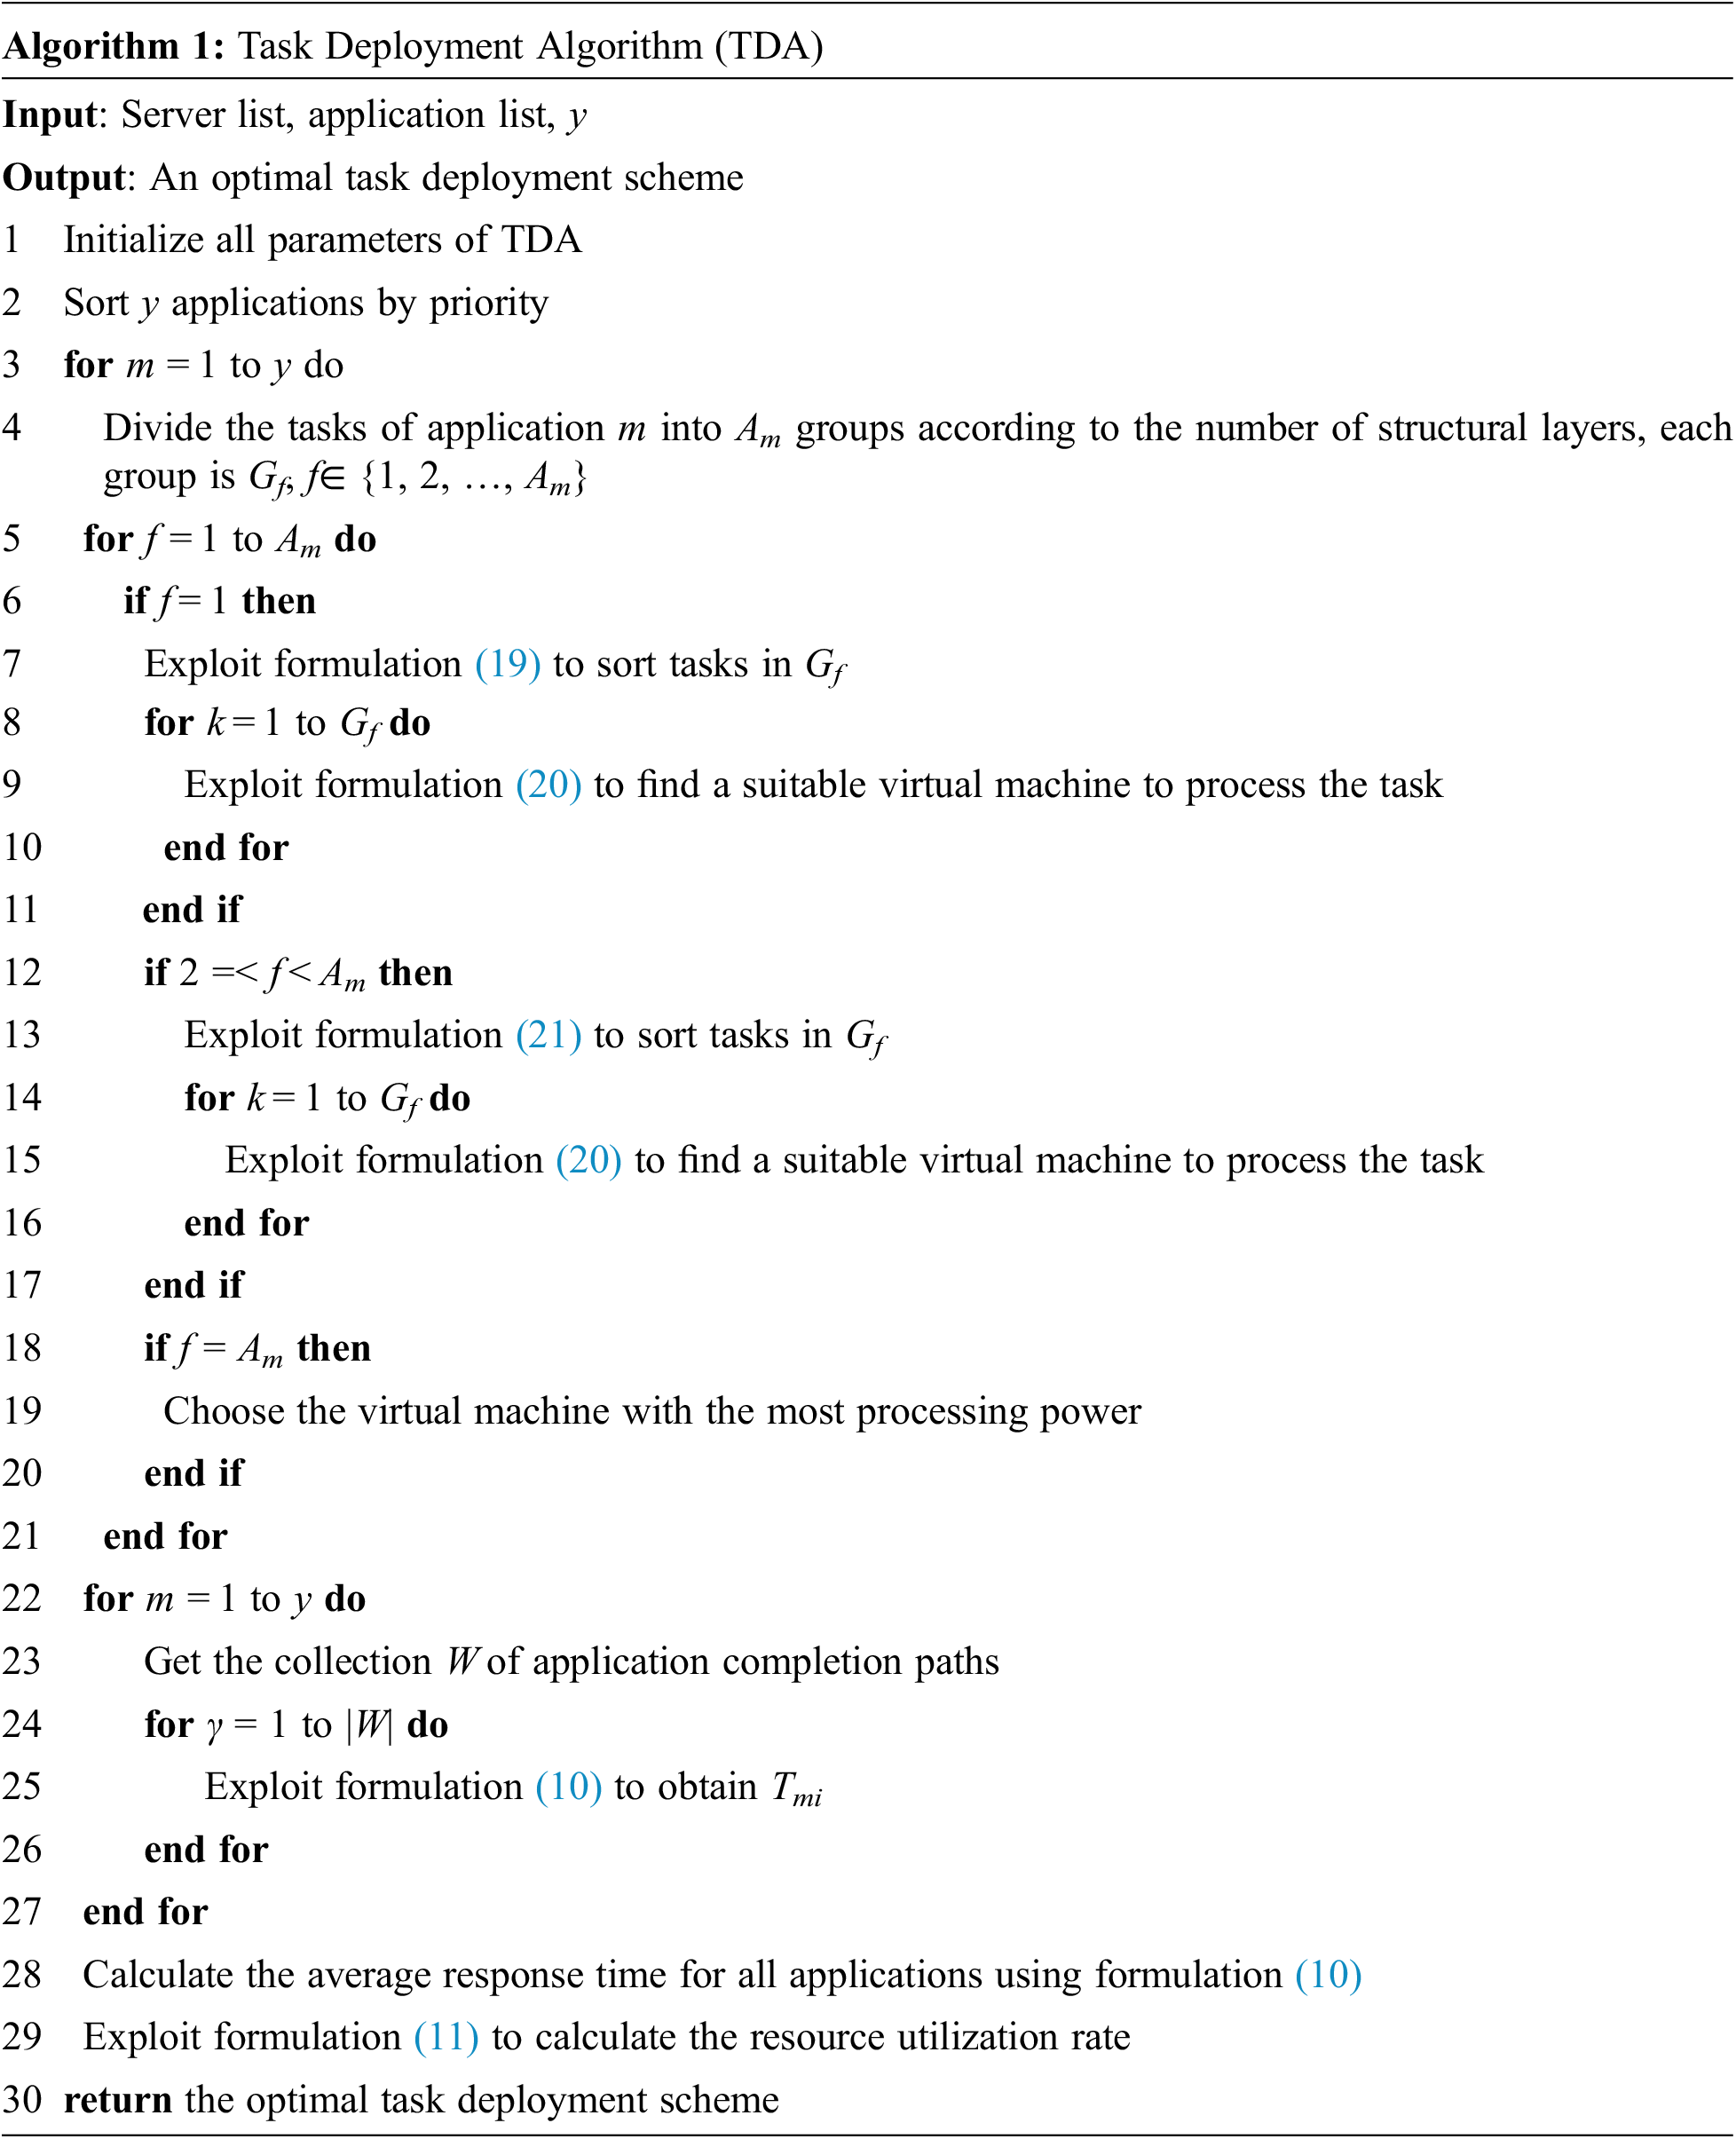
Then, the appropriate virtual machine is selected for placement by formulation (20). It comprehensively considers two optimization goals of application completion time and resource utilization. First of all, considering that the completion time of an application is related to the processing time of a single task and the amount of data sent, when selecting a virtual machine, it is necessary to comprehensively consider the processing capability cj and bandwidth bwi of the virtual machine, where ρ is an adjustable trade-off factor. Secondly, the size of the resource utilization U depends on the location of the backup virtual machine. When the backup virtual machine processing the task occupies a single slot, the resource utilization is significantly reduced. Conversely, when multiple backup virtual machines occupy one slot, the resource utilization increases. It is assumed that h = 0.1 when the backup virtual machine processing the task occupies a single slot, and h = 0 otherwise.
Lines 12–17 represent the deployment of middle-layer tasks. The priorities of middle-layer tasks are also sorted in descending order according to formulation (19), and middle-layer tasks at the same level need to select virtual machines with similar B values for deployment (i.e., because the completion time of the application is determined by the longest path, and load balancing can be achieved when the path gap is small). Lines 18–20 are the deployment of the underlying tasks, the underlying tasks are sorted according to formulation (21), it is shown below.
Formulation (21) takes into account that the completion time of the application depends on the path with the longest time. When deploying the bottom r tasks, the time Tr consumed by the path where the current task is calculated (Tr consists of the processing time of the deployed task and the sending time of the data). Sort the tasks that have calculated Tr in descending order, when selecting the virtual machine to be deployed, it is consistent with the top-level task. Considering that the underlying task only receives tasks and does not need to consider the bandwidth of the virtual machine, when the underlying task chooses to deploy a virtual machine, the one with the largest virtual machine processing capability is prioritized for deployment.
Lines 22–29 comprehensively consider the optimization goal of the entire system. It takes into account the average service response time and system resource utilization of all applications, and finally obtains an optimal task deployment plan. The time complexity of TDA is O(n2).
This chapter first describes the configuration information of the experimental environment, then conducts simulation experiments, and compares the TDA with RFF and GA methods. Finally, the performance of these methods is evaluated.
We implemented the experiments using Java 1.8, eclipse tools, source code to create a MEC simulation environment in a machine with Intel Core i5-8250U@1.60 GHz and 8 GB of memory, the environment consists of 50 edge clouds, 400 virtual machines, and 252 switches and edge servers. The edge clouds are connected to each other through a full mesh optical network. Each server assumes 3 slots for placing virtual machines. The bandwidth value of every virtual machine is randomly picked from the range of [10, 50] Mbps, and their processing power is a value randomly selected from [0.5 × 10⁶, 106] instructions per second. The MTTR value is set to 50, and the values of MTBFED, MTBFSW and MTBFSE are randomly picked from [5, 20], [5, 50], [5, 100], respectively. Each IoT application is a 4-layer directed acyclic graph consisting of 7 tasks. The data size of each application is a randomly selected value from the [100, 300] KB range. Assuming that the value of the transmit power of every device is 100 mW, the channel gain between the IoT device and the edge cloud is 20−4, the channel bandwidth is 5 MHz, and the noise power is 10−10 mW. The processing delay of each task is a value randomly selected from the interval [2, 6] ms. The instruction length of every task is a value picked from [500, 5000]. The data size of the sending task is a value randomly picked from [1, 2] Mb. The value of Pfmax is set to 0.8, the value of Pmax is set to 0.1, the slots with fault rate greater than 0.5 are defined as high-risk slots, and the overbooking rate e is assumed to be 2.
Through the above configuration of the experimental environment, TDA is compared with the other two methods to evaluate its performance.
RFF (Random First Fit): According to the order of tasks from top to bottom, randomly select virtual machines that meet the constraints to deploy each task.
GA (Greedy Algorithm) [29]: According to the order of tasks from top to bottom, each time the smallest virtual machine that can put down tasks is selected to deploy each task.
Then compare with RFF and GA in resource utilization, average service response time and algorithm time complexity, and analyze the performance of TDA. In addition, the influence of parameters on the experimental results is also very important. The parameters used in this paper include the number of virtual machines and IoT applications. In order to study the influence of σ in TDA algorithm on the optimization objective under different values, we set the values of the adjustable factor σ to 0.1, 0.5, and 0.9 (i.e., TDA1 (0. 1), TDA2 (0.5), and TDA3 (0.9)), respectively.
6.2 Experimental Results and Performance Evaluation
According to Fig. 4, with the increase of virtual machines, the average service response time of TDA (including TDA1, TDA2 and TDA3) applications first decreases and then increases. As the number increases, the types of virtual machines available also increase. The virtual machine with good processing capability and large bandwidth is preferred to process tasks. In addition, the probability of tasks being deployed on the same edge server will also increase, this effectively reduces task processing time and communication time between tasks. When the number of virtual machines reaches 1000, the average service response time of the application increases. This is because there are two optimization goals in this paper, one is the average service response time of the application, and the other is resource utilization. After the total number of virtual machines achieves 1000, this method starts to focus on optimizing resource utilization, while the consideration of service response time is not so thoughtful, which will increase the service response time.
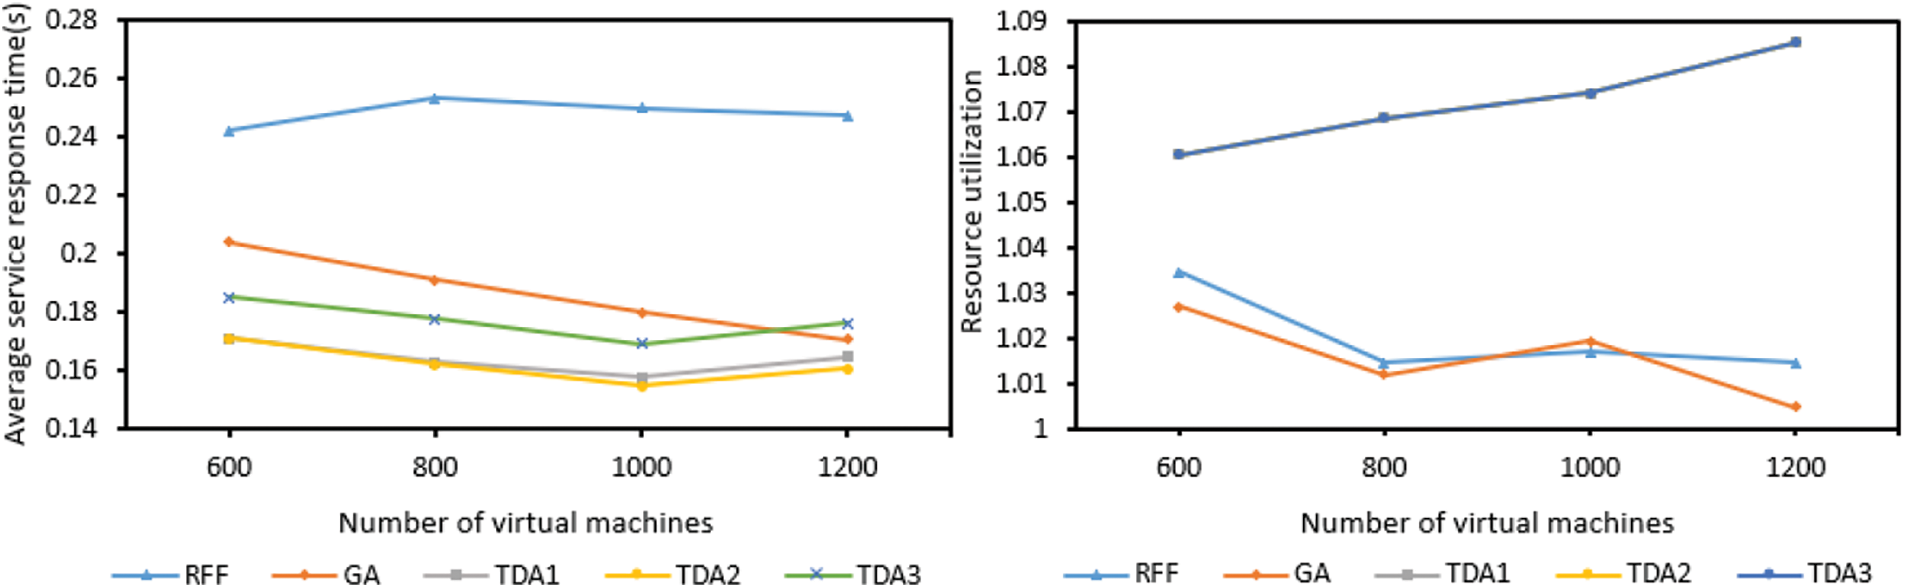
Figure 4: The effect of different number of virtual machines
After the total number of virtual machines achieves 1000, the growth rate of resource utilization is significantly accelerated, this further validates the above statement. The average service response time of RFF increases first and then decreases. This is because the number of virtual machines at the beginning is limited, the processing power and bandwidth of virtual machines used to offload tasks may be small, resulting in an ever increasing average service response time for an application and a decreasing resource utilization. When the total number of virtual machines achieves 800, with the increase of virtual machines, the types of virtual machines that can be selected also increase, and virtual machines with good processing capability and large bandwidth are preferred to process tasks, so the average service response time has been decreasing, and resource utilization has increased. The average service response time of GA has been decreasing because a better virtual machine can always be found among the current virtual machines to optimize the latency. The resource utilization of TDA is the largest and has been increasing (only TDA1 is shown here because the resource utilization of TDA1, TDA2 and TDA3 are consistent, TDA2 and TDA3 are covered by TDA1). As the number of virtual machines increases, the opportunity to select a virtual machine sharing slot with other virtual machines through formulation (20) will also increase, and the resource utilization will increase. Since GA only cares about the present and not the long-term, it always chooses the best virtual machine at present, but it is not necessarily the best among all virtual machines, so its resource utilization sometimes increases and sometimes decreases. In general, with the increase of virtual machines, the TDA method is obviously better than the other two methods in optimizing the resource utilization and the average service response time of the application.
According to Fig. 5, the average service response time of TDA (including TDA1, TDA2, TDA3) has been rising slightly, this is due to the increase of IoT applications, the number of virtual machines to choose from is getting smaller and smaller, and the remaining virtual machines may not have much processing power and bandwidth, the average service response time of the application is getting larger and larger, and the average service response time of the GA and RFF applications has been increasing because of the above reasons.
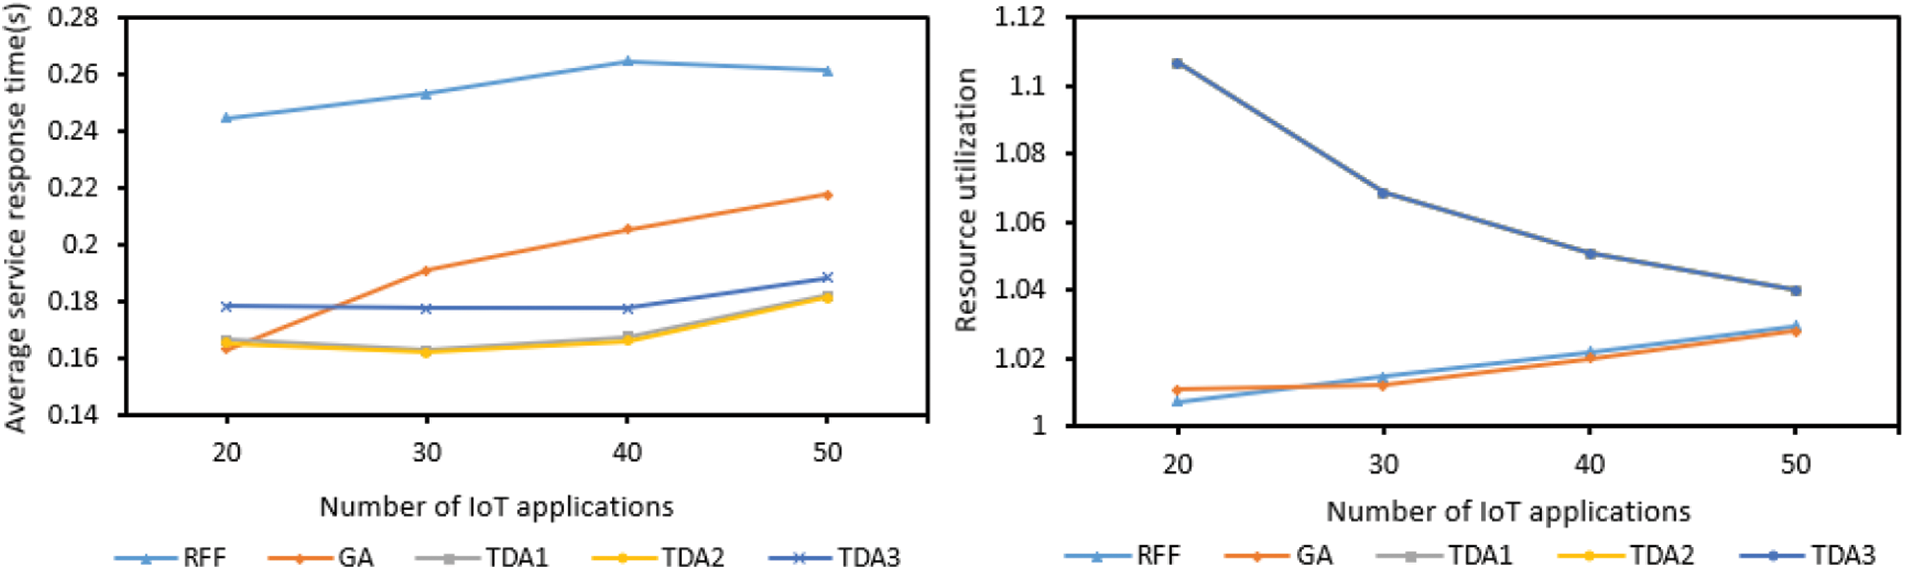
Figure 5: The impact of the number of IoT applications
The average service response time of the RFF application is the largest because it is randomly placed, and its optimization effect on the service response time is not as good as the other two methods. The average service response time of the GA is the smallest at the beginning, because it has just started to select the best virtual machine at present to deploy the task. The virtual machine has well optimized the service response time. With the increase of the number of IoT applications, more and more tasks need to be processed, and the number of optimal virtual machines currently available for selection is becoming less and less. As a result, the average service response time of GA has been increasing.
As can be seen from the figure, the average service response time of TDA is the smallest overall. The resource utilization of TDA has been decreasing (only TDA1 is shown here because the resource utilization of TDA1, TDA2 and TDA3 are consistent, TDA2 and TDA3 are covered by TDA1), this is because TDA tends to select multiple virtual machines in the process of selecting virtual machines one slot is shared, but as the number of IoT applications increases, there are fewer and fewer slots that meet the conditions, and some tasks can only be offloaded to a virtual machine that occupies a single slot, this in turn leads to a reduction in resource utilization. For RFF and GA, with the increase of Internet of Things applications, the virtual machine resources remain unchanged, and the resource utilization rate will increase as the number of virtual machines used for tasks increases. But on the whole, with the increase of IoT applications, the TDA method is obviously better than the other two methods in optimizing resource utilization and average service response time of applications.
According to Fig. 6, with the increase of virtual machines, the optimization goals of several methods generally increase. This is because as the number of virtual machines increases, so does the number of available virtual machines. The optimization target value of this method is also increasing. In addition, with the increase of IoT applications, the optimization target value of TDA is decreasing (TDA1 is covered by TDA2), while the other two methods are increasing. This is because with the increase of IoT applications, there are fewer virtual machines for TDA to choose, which leads to a decrease in the optimization target value. For the other two methods, with the increase of IoT applications, the virtual machine resources remain unchanged, the virtual machines used by the task increase, and the probability of the task being deployed on the same server increases, these in turn lead to a reduction in the optimization target value. But whether it is with the increase of virtual machines or the increase of Internet of Things applications, the optimization target value of TDA is higher than the other two methods, because TDA fully considers how to maximize resource utilization while minimizing applications average service response time. RFF does not consider these two optimization goals, so its value is the smallest, while GA only considers the reduction of the average service response time of the optimized application, and does not consider the optimization of resource utilization. The time complexity of these three algorithms is O(n2).
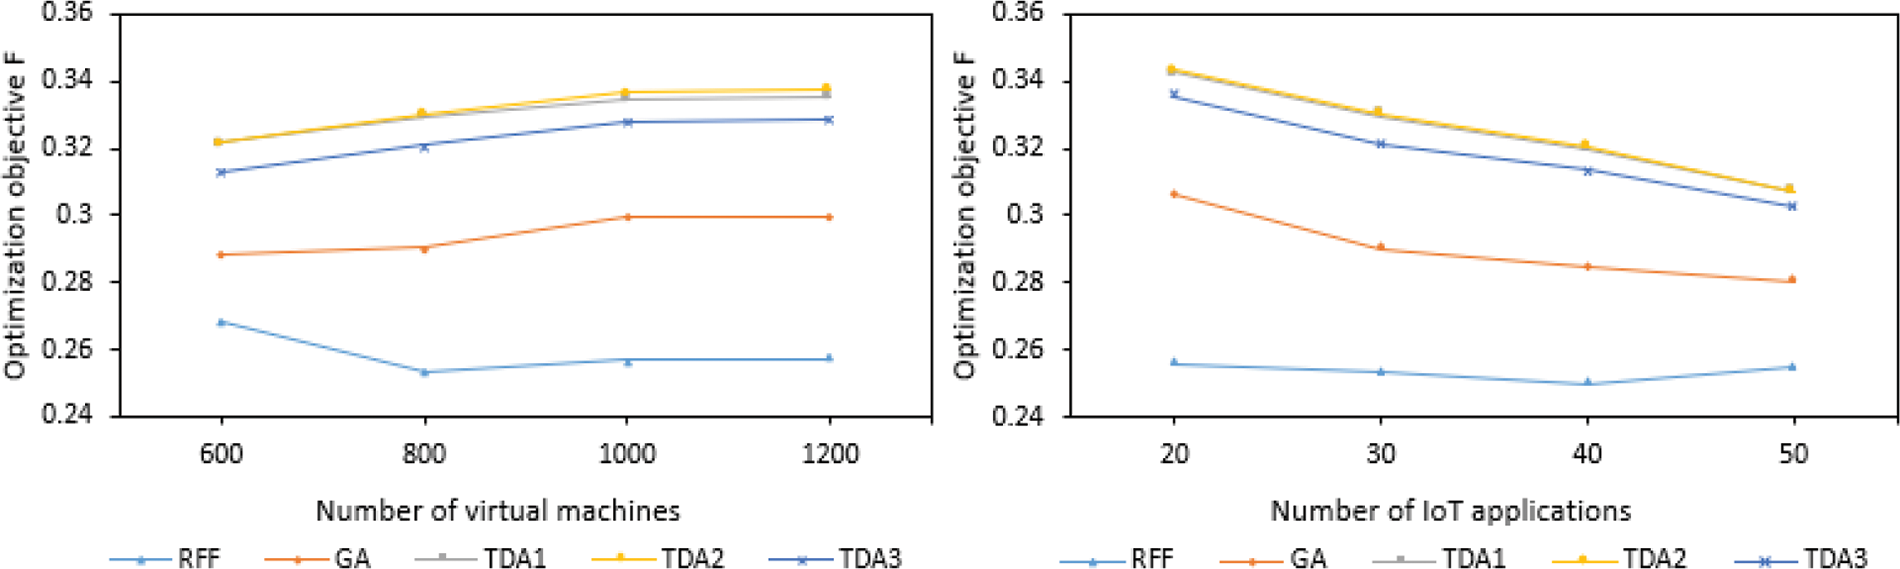
Figure 6: The influence of three methods on the optimization objective function F
In this paper, we proposed the scheme of overbooking. Which firstly made a suitable overbooking of some backup virtual machine and deployed it into the slot to increase resource utilization. We also investigated how to offload the tasks reasonably to maximize the system’s resource utilization while minimizing the application’s average service response time. In response to this problem, we designed a TS, it can process IoT applications according to TDA method, and finally obtain an optimal task deployment scheme. Finally, we conducted simulation experiments, and the results show that this method is superior to other methods.
In future work, we will appropriately increase the overbooking rate within the availability range. In addition, we will also consider computational migration, when a backup virtual machine in an oversubscribed state is activated, the needs of other virtual machines located in the slot are migrated to other slots.
Acknowledgement: We would sincerely want to thank the peoples who are supported to do this work and reviewing committee for their estimable feedbacks.
Funding Statement: This research is partially supported by the National Natural Science Foundation of China under Grant No. 62173126, the National Natural Science Joint Fund project under Grant No. U1804162, the Key Science and Technology Research Project of Henan Province under Grant No. 222102210047, 222102210200 and 222102320349, the Key Scientific Research Project Plan of Henan Province Colleges and Universities under Grant No. 22A520011 and 23A510018, the Key Science and Technology Research Project of Anyang City under Grant No. 2021C01GX017.
Conflicts of Interest: The authors declare that they have no conflicts of interest to report regarding the present study.
References
1. L. Renforth, R. Giussani and M. Mendiola, “A smart condition monitoring system for HV networks with artificial intelligence, augmented reality and virtual reality,” in 2018 IEEE Petroleum and Chemical Industry Technical Conf. (PCIC 2018), Beijing, China, pp. 115–120, 2018. [Google Scholar]
2. L. Y. Qi, Y. H. Yang, X. K. Zhou, W. Rafique and J. H. Ma, “Fast anomaly identification based on multi-aspect data streams for intelligent intrusion detection toward secure industry 4.0,” IEEE Transactions on Industrial Informatics, vol. 18, no. 9, pp. 6503–6511, 2022. [Google Scholar]
3. H. Zhao, Z. W. Liu, J. S. Tang, B. Gao, Y. F. Zhang et al., “Memristor-based signal processing for edge computing,” Tsinghua Science and Technology, vol. 27, no. 3, pp. 455–471, 2022. [Google Scholar]
4. S. Nath and J. Wu, “Deep reinforcement learning for dynamic computation offloading and resource allocation in cache-assisted mobile edge computing systems,” Intelligent and Converged Networks, vol. 1, no. 2, pp. 181–198, 2020. [Google Scholar]
5. M. Satyanarayanan, P. Bahl, R. Caceres and N. Davies, “The case for VM-based cloudlets in mobile computing,” IEEE Pervasive Computing, vol. 8, no. 4, pp. 14–23, 2009. [Google Scholar]
6. H. S. Mondal, M. T. Hasan, T. K. Karmokar and S. Sarker, “Improving quality of service in cloud computing architecture using fuzzy logic,” in 2018 Int. Conf. on Advances in Electrical Engineering (ICAEE 2018), Hammamet, Tunisia, pp. 742–763, 2018. [Google Scholar]
7. F. Wang, G. S. Li, Y. L. Wang, W. Rafique, M. R. Khosravi et al., “Privacy-aware traffic flow prediction based on multi-party sensor data with zero trust in smart city,” ACM Transactions on Internet Technology, 2022. https://doi.org/10.1145/3511904 [Google Scholar] [CrossRef]
8. A. K. Sandhu, “Big data with cloud computing: Discussions and challenges,” Big Data Mining and Analytics, vol. 5, no. 1, pp. 32–40, 2022. [Google Scholar]
9. C. Yan, Y. K. Zhang, W. Y. Zhong, C. Zhang and B. G. Xin, “A truncated SVD-based ARIMA model for multiple QoS prediction in mobile edge computing,” Tsinghua Science and Technology, vol. 27, no. 2, pp. 315–324, 2022. [Google Scholar]
10. S. Gupta, G. Karanth, N. Pentapati and V. B. Prasad, “A web based framework for liver disease diagnosis using combined machine learning models,” in 2020 Int. Conf. on Smart Electronics and Communication (ICOSEC 2020), Hangzhou, China, pp. 148–159, 2020. [Google Scholar]
11. J. Zhong, W. L. Guo and Z. H. Wang, “Study on network failure prediction based on alarm logs,” in 2016 Int. Conf. on Big Data and Smart City (ICBDSC 2016), Muscat, Oman, pp. 1–7, 2016. [Google Scholar]
12. F. Y. Li, X. Y. Yu, R. Ge, Y. L. Wang, Y. Cui et al., “BCSE: Blockchain-based trusted service evaluation model over big data,” Big Data Mining and Analytics, vol. 5, no. 1, pp. 1–14, 2022. [Google Scholar]
13. A. Choudhury and B. Sikdar, “Modeling & analysis of redundancy-based fault tolerance for permanent faults in chip multiprocessor cache,” in 2018 Int. Conf. on VLSI Design and 2018 17th Int. Conf. on Embedded Systems (VLSID 2018), Delhi, India, pp. 115–120, 2018. [Google Scholar]
14. R. Tse and M. Campbell, “Human–robot communications of probabilistic beliefs via a dirichlet process mixture of statements,” in 2018 Int. Conf. on VLSI Design and 2018 17th Int. Conf. on Embedded Systems (VLSID 2018), Delhi, India, pp. 1–19, 2018. [Google Scholar]
15. C. Catlett, P. Beckman, N. Ferrier, H. Nusbaum, M. E. Papka et al., “Measuring cities with software-defined sensors,” Journal of Social Computing, vol. 1, no. 1, pp. 14–27, 2020. [Google Scholar]
16. L. Z. Kong, L. N. Wang, W. W. Gong, C. Yan, Y. C. Duan et al., “LSH-Aware multitype health data prediction with privacy preservation in edge environment,” World Wide Web Journal, vol. 25, no. 5, pp. 1793–1808, 2022. [Google Scholar]
17. Z. Tong, F. Ye, M. Yan, H. Liu and S. Basodi, “A survey on algorithms for intelligent computing and smart city applications,” Big Data Mining and Analytics, vol. 4, no. 3, pp. 155–172, 2021. [Google Scholar]
18. L. P. Zhao, L. F. Lu, Z. Jin and C. Yu, “Online virtual machine placement for increasing cloud provider’s revenue,” IEEE Transactions on Services Computing, vol. 10, no. 2, pp. 273–285, 2017. [Google Scholar]
19. J. L. Liu, A. Zhou, C. H. Liu, T. G. Zhang, L. Y. Qi et al., “Reliability-enhanced task offloading in mobile edge computing environments,” IEEE Internet of Things Journal, vol. 13, no. 9, pp. 10382–10396, 2022. [Google Scholar]
20. Y. Z. Li and S. G. Wang, “An energy-aware edge server placement algorithm in mobile edge computing,” in 2018 IEEE Int. Conf. on Edge Computing (EDGE 2018), San Francisco, CA, USA, pp. 66–73, 2018. [Google Scholar]
21. G. M. S. Rahman, T. Dang and M. Ahmed, “Deep reinforcement learning based computation offloading and resource allocation for low-latency fog radio access networks,” Intelligent and Converged Networks, vol. 1, no. 3, pp. 243–257, 2020. [Google Scholar]
22. B. Kavitha, A. Vallikannu and K. Sankaran, “Delay-aware concurrent data management method for IoT collaborative mobile edge computing environment,” Microprocessors and Microsystems, vol. 74, no. 1, pp. 103021, 2020. [Google Scholar]
23. Z. Li, J. Qin and W. Wen, “Delay-guaranteed task allocation in mobile edge computing with balanced resource utilization,” in 2020 Int. Conf. on High Performance Compilation, Computing and Communications (HP3C 2020), Aizu-Wakamatsu, Japan, pp. 35–41, 2020. [Google Scholar]
24. T. G. Rodrigues, K. Suto, H. Nishiyama and N. Kato, “Hybrid method for minimizing service delay in edge cloud computing through VM migration and transmission power control,” IEEE Transactions on Computers, vol. 66, no. 5, pp. 810–819, 2017. [Google Scholar]
25. J. K. Ren, G. D. Yu, Y. L. Cai and Y. H. He, “Latency optimization for resource allocation in mobile-edge computation offloading,” IEEE Transactions on Wireless Communications, vol. 17, no. 8, pp. 5506–5519, 2017. [Google Scholar]
26. Q. Zhang, M. F. Zhani, M. Jabri and R. Boutaba, “Venice: Reliable virtual data center embedding in clouds,” in 2014 IEEE Conf. on Computer Communications (INFOCOM 2014), Toronto, Canada, pp. 128–135, 2014. [Google Scholar]
27. X. Xue, S. F. Wang, L. J. Zhang, Z. Y. Feng and Y. D. Guo, “Social learning evolution (SLEComputational experiment-based modeling framework of social manufacturing,” IEEE Transactions on Industrial Informatics, vol. 15, no. 6, pp. 3343–3355, 2019. [Google Scholar]
28. X. Xue, Z. Chen, S. Wang, Z. Feng, Y. Duan et al., “Value entropy: A systematic evaluation model of service ecosystem evolution,” IEEE Transactions on Services Computing, vol. 15, no. 4, pp. 1760–1773, 2022. [Google Scholar]
29. K. Alse, M. Lahoti, M. Verma and I. Sridhar, “GATutor: A guided discovery-based tutor for designing greedy algorithm,” in 2016 IEEE Seventh Int. Conf. on Technology for Education (T4E 2016), Warangal, India, pp. 61–68, 2016. [Google Scholar]
Cite This Article
 Copyright © 2023 The Author(s). Published by Tech Science Press.
This work is licensed under a Creative Commons Attribution 4.0 International License , which permits unrestricted use, distribution, and reproduction in any medium, provided the original work is properly cited.
 Downloads
 Citation Tools