
 Submit a Paper
 Propose a Special lssue
 Open Access
ARTICLE

HIUNET: A Hybrid Inception U-Net for Diagnosis of Diabetic Retinopathy
Vignan’s Foundation for Science, Technology & Research, Guntur, 522213, India
* Corresponding Author: S. Venkatramaphanikumar. Email:
Intelligent Automation & Soft Computing 2023, 37(1), 1013-1032. https://doi.org/10.32604/iasc.2023.038165
Received 30 November 2022; Accepted 20 February 2023; Issue published 29 April 2023
 View Full Text
 Download PDF
Abstract
Type 2 diabetes patients often suffer from microvascular complications of diabetes. These complications, in turn, often lead to vision impairment. Diabetic Retinopathy (DR) detection in its early stage can rescue people from long-term complications that could lead to permanent blindness. In this study, we propose a complex deep convolutional neural network architecture with an inception module for automated diagnosis of DR. The proposed novel Hybrid Inception U-Net (HIUNET) comprises various inception modules connected in the U-Net fashion using activation maximization and filter map to produce the image mask. First, inception blocks were used to enlarge the model’s width by substituting it with primary convolutional layers. Then, aggregation blocks were used to deepen the model to extract more compact and discriminating features. Finally, the downsampling blocks were adopted to reduce the feature map size to decrease the learning time, and the upsampling blocks were used to resize the feature maps. This methodology ensured high prominence to lesion regions compared to the non-lesion regions. The performance of the proposed model was assessed on two benchmark competitive datasets called Asia Pacific Tele-Ophthalmology Society (APTOS) and KAGGLE, attaining accuracy rates of 95% and 92%, respectively.Keywords
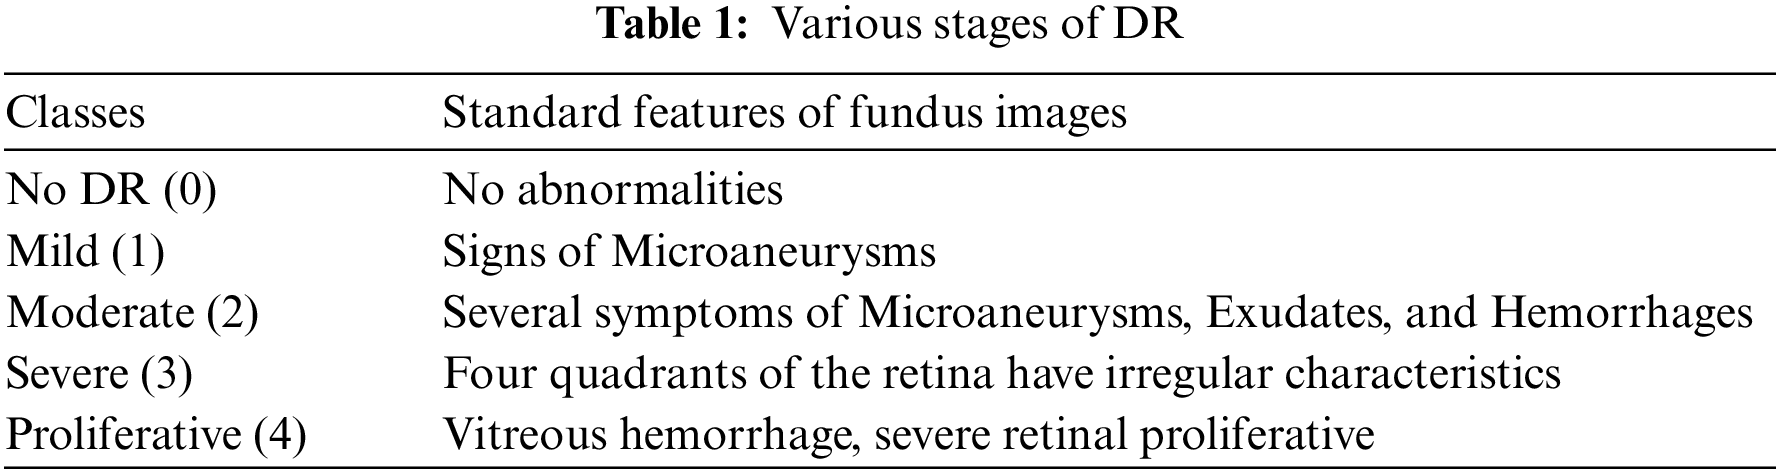
Medical image segmentation has gained immense attention from academics pursuing image processing, mainly owing to its advantages in medical image analysis [1]. Diabetes affects millions of individuals worldwide, and afflicted people from age 20 to 74 years alike can develop Diabetic Retinopathy (DR) due to hysterical diabetes [2]. Two tools for evaluating the severity of diabetic eye disease are the Early Treatment DR study grading system and the International Clinical Diabetic Retinopathy (ICDR) disease severity scale [3]. The ICDR scale is a conventional clinical scale used to evaluate the severity of DR. Artificial Intelligence (AI) identifies and grades the severity of DR into no DR, mild, non-proliferative DR (NPDR), moderate NPDR, severe NPDR, or proliferative DR [4]. Various types of lesions, including microaneurysms (MAs), hemorrhages (HMs), and exudates (EXs), whether soft or hard, can be indicative of DR [5]. Small blood vessels in the retina can grow and become MAs, which appear as red spots with sharp edges. EXs are the lipids and lipoproteins that accumulate along the leaking capillaries inside the retina that appear as yellow or white spots of variable sizes. Table 1 expounds on the typical characteristics of the various types of DR. White spots in the retina are induced by protein leakage from blocked blood vessels. EX can be either soft or hard. HM are blood deposits that appear as red dots with irregular edges caused by faulty or thin blood vessels. Automated image segmentation extracts the features from the fundus images for retinal blood vessels [6]. To date, several methods for classifying arteries and veins in fundus images have been extensively reviewed [7]. The authors proposed the separation of Escherichia coli from blood cells [8]. The authors introduced a framework that offers a defensive model against adversarial training, the speckle-noise attack, and a feature fusion strategy that maintains the classification with accurate labeling [9]. The authors presented the hemorrhage detection from the 3D images [10]. The authors have proposed the detection of DR using a fusion of textural and ridgelet features of retinal images [11]. As the manual classification of DR is time-consuming and expensive, even for experienced experts, automated diagnosis has become commonplace. AI-assisted diagnosis precisely determines the severity of DR in a shorter time and enables better treatment to reduce cases of blindness effectively. Over the years, several automated systems and models have been developed to diagnose DR with Deep Learning taking the lead. Owing to their reliable DR classification, these strategies are now being widely explored.
Compared to traditional segmentation approaches [12], deep learning methods became quite popular due to their better performance [13]. The deep learning models developed for better performance using better hardware and Graphics Processing Units (GPUs) such as Alex Net [14], Visual Geometry Group (VGG) [15], Deep Lab [16], Google Net [17], Residual network [18], and Dense Net [19]. In the domain of computer vision, these network models are pretty compelling. Although extensive studies have verified the competence of network models such as AlexNet and VGG, none are cost-effective. In contrast to the previous models, the Google Net architecture introduced an “Inception module” to create a better, minimalist computer network architecture [17]. This module mainly increases the rate at which computing resources are used in its width and depth of layers while maintaining the budget. U-Net architectures have achieved outstanding results in various medical image segmentation applications. U-Net is a Convolutional Neural Network (CNN) containing a contracting and expansive path. Convolution layers create segmentations by extracting representative information from input images [20]. The main objective here was to increase the effectiveness of DR autonomous identification systems. A potential method proposed for detecting DR in its early stages based on Deep CNN (DCNN) capacity to classify retinal images.
High efficiency and robustness are essential in the diagnosis of medical images. However, properly segmenting disease boundaries is challenging due to their arbitrary shape, color, and location. Deep learning models with low generalization ability are limited in handling segmentation and prediction of the severity of DR. The existing U-Net models have low interpretability and confidence in decision-making.
Despite high computational complexity, these existing systems present limited accuracy in categorizing the severity levels of DR. Hence, to tackle this challenge, we propose a Hybrid Inception U-Net with low computational complexity and a high generalization ability for accurate prediction and categorization of DR severity. Inception blocks are designed to extract discriminating features from the input by using varied convolutional filter sizes with various scales.
The primary aim of this study is to introduce a novel CNN architecture for the detection of DR, modeled on the U-Net, that uses inception block concatenations to pass information between layers while outperforming the current extraction techniques. The salient contributions of the proposed work are as follows:
• Design and development of Hybrid Inception U-Net (HIUNET) to increase the efficiency in segmenting DR under variations against color, shape, and location. The proposed HIUNET indicates where dilated convolution ends, and the proposed model’s encoding part aims to enlarge the receptive field.
• Application of custom pre-processing techniques to reduce noise at the edges of lesions.
• Extensive experimentation; executed on APTOS and KAGGLE datasets.
The existing U-Net systems are limited in accuracy in categorizing the various severity levels of DR. Conventional hand-crafted Deep Learning models are still inept in classifying the severity of DR, based on images, despite their high computational complexity. Though deep ensemble models yield better accuracy with high-resolution images, low-resolution images compromise its accuracy curtailing its potential in generalized disease prediction.
• To cover this challenge, we have proposed a Hybrid Inception U-Net with limited computational complexity and high generalization ability to yield better accuracy in categorizing diabetic severity prediction.
• Inception blocks in the proposed work extract discriminating features from the input using various convolutional filter sizes with varied scales. The blocks enlarge the model’s width by substituting it with primary convolutional layers. Then, aggregation blocks deepen the model to extract more compact and discriminating features.
• Finally, the downsampling blocks reduced the feature map size to decrease the learning time, and the upsampling blocks resized the feature maps. This methodology ensured high contrast of lesions to the non-lesion regions.
Subsequent sections present a structured and detailed explanation of the model. While Section 2 is a systematic survey of conventional practices and deep learning approaches implemented in DR diagnosis, Section 3 presents the proposed HIUNET model for DR. Section 4 stipulates the evaluation of the proposed system, and Section 5 concludes this report.
Traditional image classification uses three primary approaches to encode scale, rotate, and illumination variations: Histogram of Oriented Gradients (HoG) [21], Scale-Invariant Feature Transform (SIFT) [22], and Local Binary Pattern (LBP) [23]. Until feature extraction, Hessian-matrix-based candidate selection was used [24], and after that, the Support Vector Machine (SVM) classifier was in use. A previous study extracted hybrid features for DR classification [25]. In another study, a multilayer perception neural network obtains the components for categorization [26]. Eventually, an algorithm for MA detection was developed for image analysis [27]. It attained 83.62% sensitivity for three images with 39 injuries. The detection of red lesions method has also been proposed, wherein the lesions were labeled as candidates [28]. The structures of the candidates’ blood vessels were subtracted to reduce false positives. It increased the sensitivity by 94% and specificity by 87% when tested on 89 images. However, the disadvantage of this approach was a longer computation time, as it took three minutes per image. Pre-processing techniques, such as correlation, have also been applied to identify bleeding images [29], with a sensitivity of 85%. The disadvantage of this model was a high false positive rate, with four false positives per image.
The identification of MA was accomplished when the traversal segment enrapt on maximum pre-processing pixels [30]. The set of features used for the Bayesian classification includes statistical measures and changes in cross-section orientation. MA was detected through two approaches [31]. Morphological operations and the classifier of Naive Bayes were used for coarse and fine segmentation, respectively. Eighteen MA features were obtained for classification, giving an 85.68% sensitivity, 99.99% specificity, a precision of 83.34%, and an accuracy of 99.99%. Some studies have shown that MAs can be detected by finding blobs (regions of interest) using two approaches [32,33]. One method was for MA extraction, and the other was for ensemble-based MA detection. In terms of performance, this model was competitive compared to other individual detectors. Another study proposed Radon transform (RT) and a multi-overlapping windows algorithm To detect MAs [34]. Here, three different databases were used for performance evaluation. The model gained 94% sensitivity and 75% specificity for the Mashhad dataset. However, for the second local database, the model exhibited 100% specificity and 70% specificity. Another study used automated technology to detect DR based on fundus images [35]. A retrospective analysis was done from the eye check DR screening project using non-mydriatic images. Referable DR (RDR) was detected with 84% sensitivity and 64% specificity. For detecting DR lesions, a previous study proposed a deep convolutional network analysis (DCNN) [36]. Another study presented a DCNN model using traditional machine learning algorithms, with 94% area under the curve, 93% sensitivity, and 87% specificity, determined using the Messidor-2 and E-Ophtha datasets [37]. The authors proposed a study for identifying DR [38]. Their sensitivity and specificity for RDR were 90.5% and 91.6%, respectively, while for Sight Threatening Diabetic Retinopathy (STDR) were 100% and 91.1%. To effectively detect microaneurysms, the authors developed a hybrid text/image method [39]. This model had a precision of 99.7% and a recall of 87.8%, which compares favorably to state-of-the-art algorithms. The identification of early DR has also been discussed [40]. In this paper, the author further extracted features using Principal Component Analysis (PCA) and Radon transform and classified the components using a hierarchical system of classifiers. The proposed method analysis was done on diaretDB1, and sensitivity of 92.32% and 88.06%, respectively, were achieved.
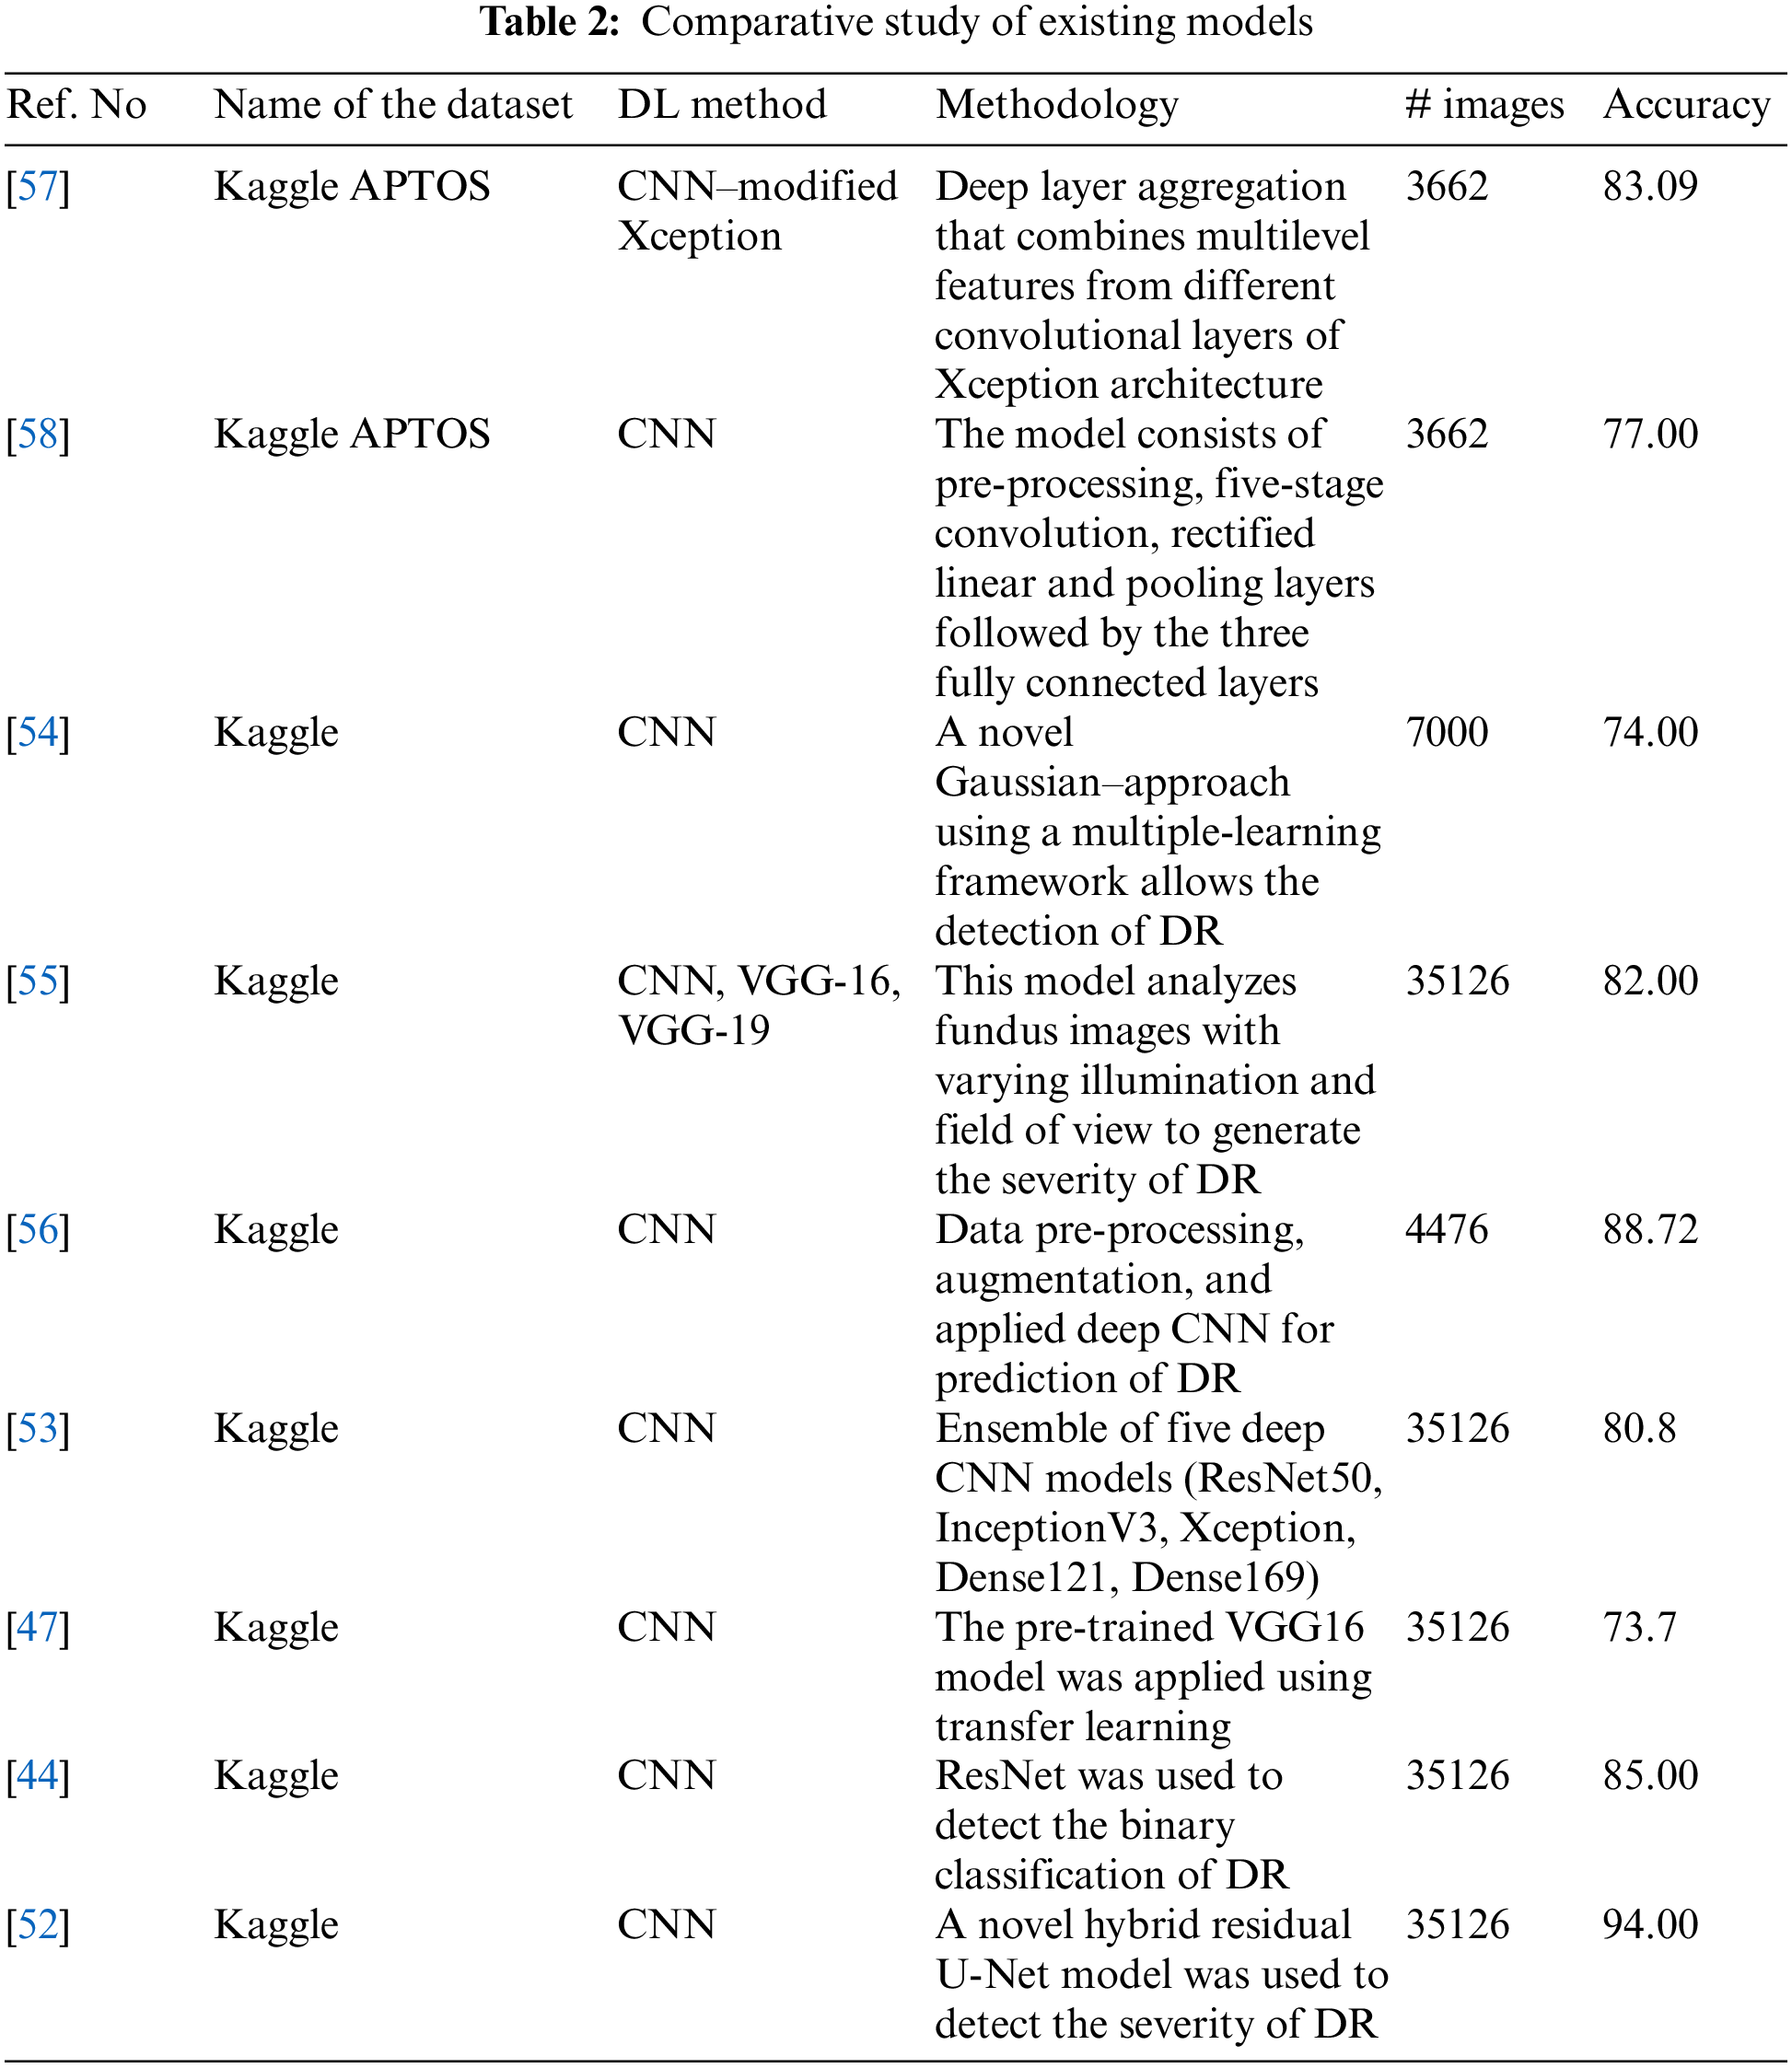
As the CNN AlexNet became popular in many functional applications, the focus shifted to CNN architectures [8]. Put forward a five-stage deep CNN as proposed for DR screening [41]. For detecting DR in the early stages, a deep CNN architecture with PCA is developed [42]. A CNN architecture was suggested by the authors in which data augmentation is done to identify features such as MA, EX, and HA in over 5,000 fundus images with 95% sensitivity and 75% accuracy [43]. The authors proposed a ResNet architecture, and it was reviewed for the arrangement of fundus images into normal and abnormal images, achieving 85% accuracy and 86% sensitivity [44]. The authors presented a Siamese network to detect the automated grading of DR in which input images are separated into small patches and extracted from the local-level features [45]. The authors presented an ensemble-based system dedicated to DR and diabetic macular edema. It achieved an accuracy of 90.07% for the five-class DR task and 96.85% accuracy for three-class diabetic macular edema [46]. Houby presented a CNN model using transfer learning to detect and stage classification and got accuracies of 86.5, 80.5, 63.5, and 73.7 for 2-class, 3-class, 4-class, and 5-class classifications, respectively [47]. A DCNN methodology with applied data augmentation obtained an accuracy of 94.5% [48]. The authors presented five CNN-based designs of AlexNet, GoogleNet, InceptionV4, Inception ResNetV2, and ResNetXt-50 models to detect DR [49]. The authors put forward a deep network patch-based approach and achieved a sensitivity of 0.940-95% CI [50]. Das, Biswas, and Bandyopadhyay presented a small and large dataset in which machine learning and deep learning are used to separate and analyze the features [51]. The authors presented an innovative approach to detect and classify DR using hybrid residual U-Net [52,53] The authors obtained an accuracy of 80.8% in an ensemble concept using the Kaggle dataset. The author presented a CAD system to detect DR [54]. The authors presented different models, such as VGG16, VGG19, and CNN, to detect DR with the help of illumination and field of view and achieved 80% to 83% accuracy [55]. A study presented a diagnosis of DR from fundus images, followed by pre-processing of the fundus images, data augmentation, and finally, application to the deep convolutional neural network. The team achieved an accuracy of 88.72% [56]. The performance of a proposed model was reported to achieve an accuracy of 83.09% using modified Xception architecture [57]. In a study, the authors proposed identifying the DR using pre-processing, convolution, rectified linear, pooling, and fully connected layers [58]. Potential treatment methods using fuzzy hypersoft mappings for identifying disease have also been used [59]. Comparative study of existing models can be shown in Table 2.
3 Severity Prediction of Diabetic Retinopathy Using HIUNET
To surpass earlier models, we proposed Hybrid Inception U-Net (HIUNET), amalgamated with customized Inception and U-Net models. KAGGLE and APTOS datasets containing 35126 and 3662 DR images, respectively, were used in this study. The DR images were classified into normal (no DR), mild, moderate, severe, and proliferative. The schematic overview of the whole paper is shown in Fig. 1.
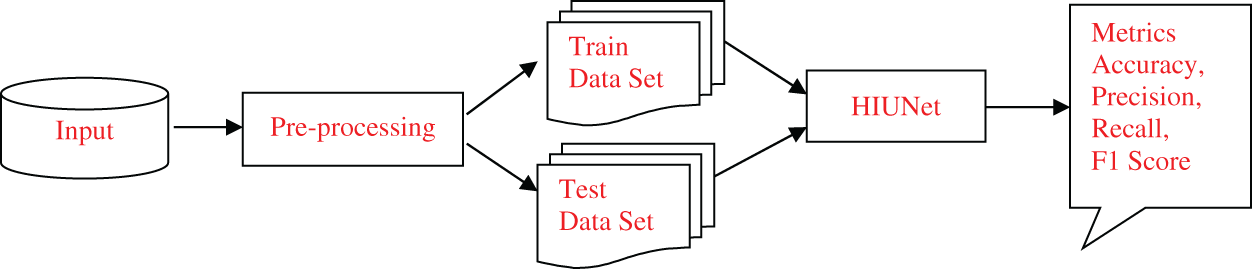
Figure 1: The schematic overview of the proposed model
Generally, the images captured from different devices follow specific techniques developed by different organizations to produce the specification of images. Pre-processing is the principal technique that makes different devices familiar with the features of DR images. The process of pre-processing is as follows:
The images in the dataset are not uniform. To make them uniform, they are cropped.
The images are resized for efficient training of the models, as each image contains a different resolution.
The edges of the resized images are molded circularly.
After the images are cropped, they have different resolutions and lighting conditions. So, a smoothing technique is performed using Gaussian blur to remove noise from the images using Eq. (1), as shown in Fig. 2.
where p is the horizontal axis, q is the vertical axis, and σ is the standard deviation of the Gaussian distribution.
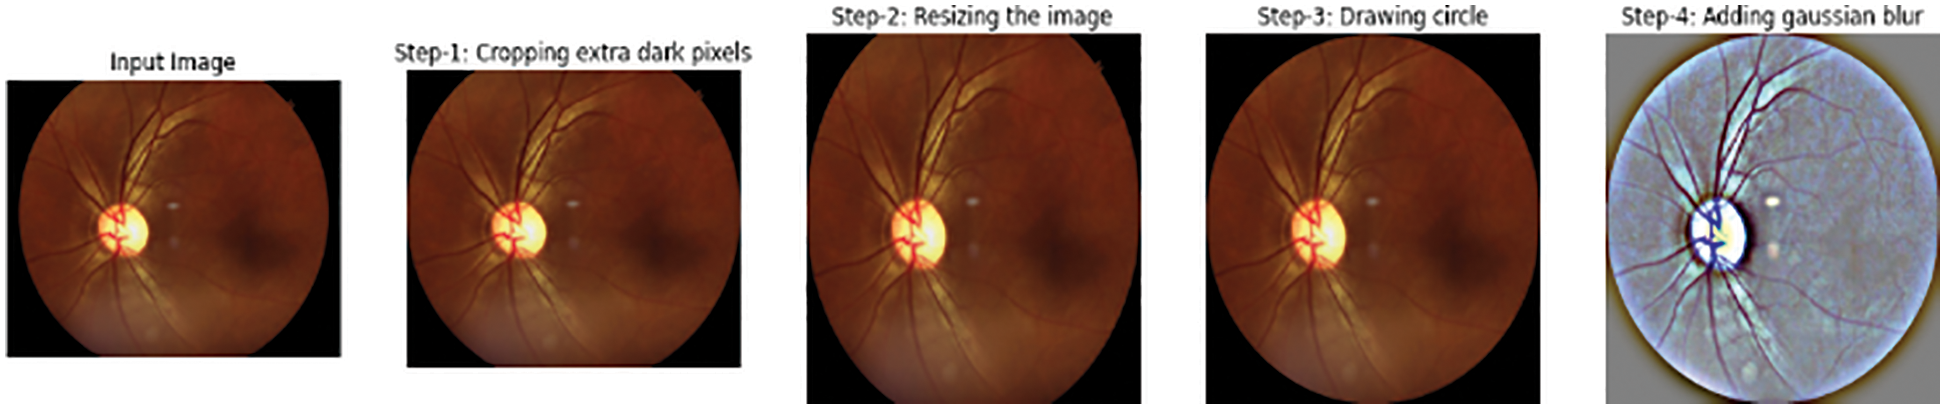
Figure 2: (a) Input, (b) Cropped, (c) Resized, (d) Circle drawn, (e) Gaussian
This study proposed a novel hybrid Inception U-Net (HIUNET). This architecture consists of a contracting and expansive path. In regular inception, the original block can be modified as Modified Inception block 1 and Modified Inception block 2. These blocks were further split into four inception modules, namely, Inception Module 1, Inception Module 2, Inception Module 3, and Inception Module 4, as shown in Fig. 3. The original Inception block comprises 1 × 1 convolution, 3 × 3 convolution, 5 × 5 convolution, and 3 × 3 max pooling. During training to reduce the calculation time and dimensions before each branch, a 1 × 1 convolution was added. The results obtained from the four branches are fused by acquiring feature information at different scales. During the convolution, adopting 1 × 1, 3 × 3, and 5 × 5 layers, set the convolution stride to 1 and the padding pixel to 0, 1, and 2, respectively.
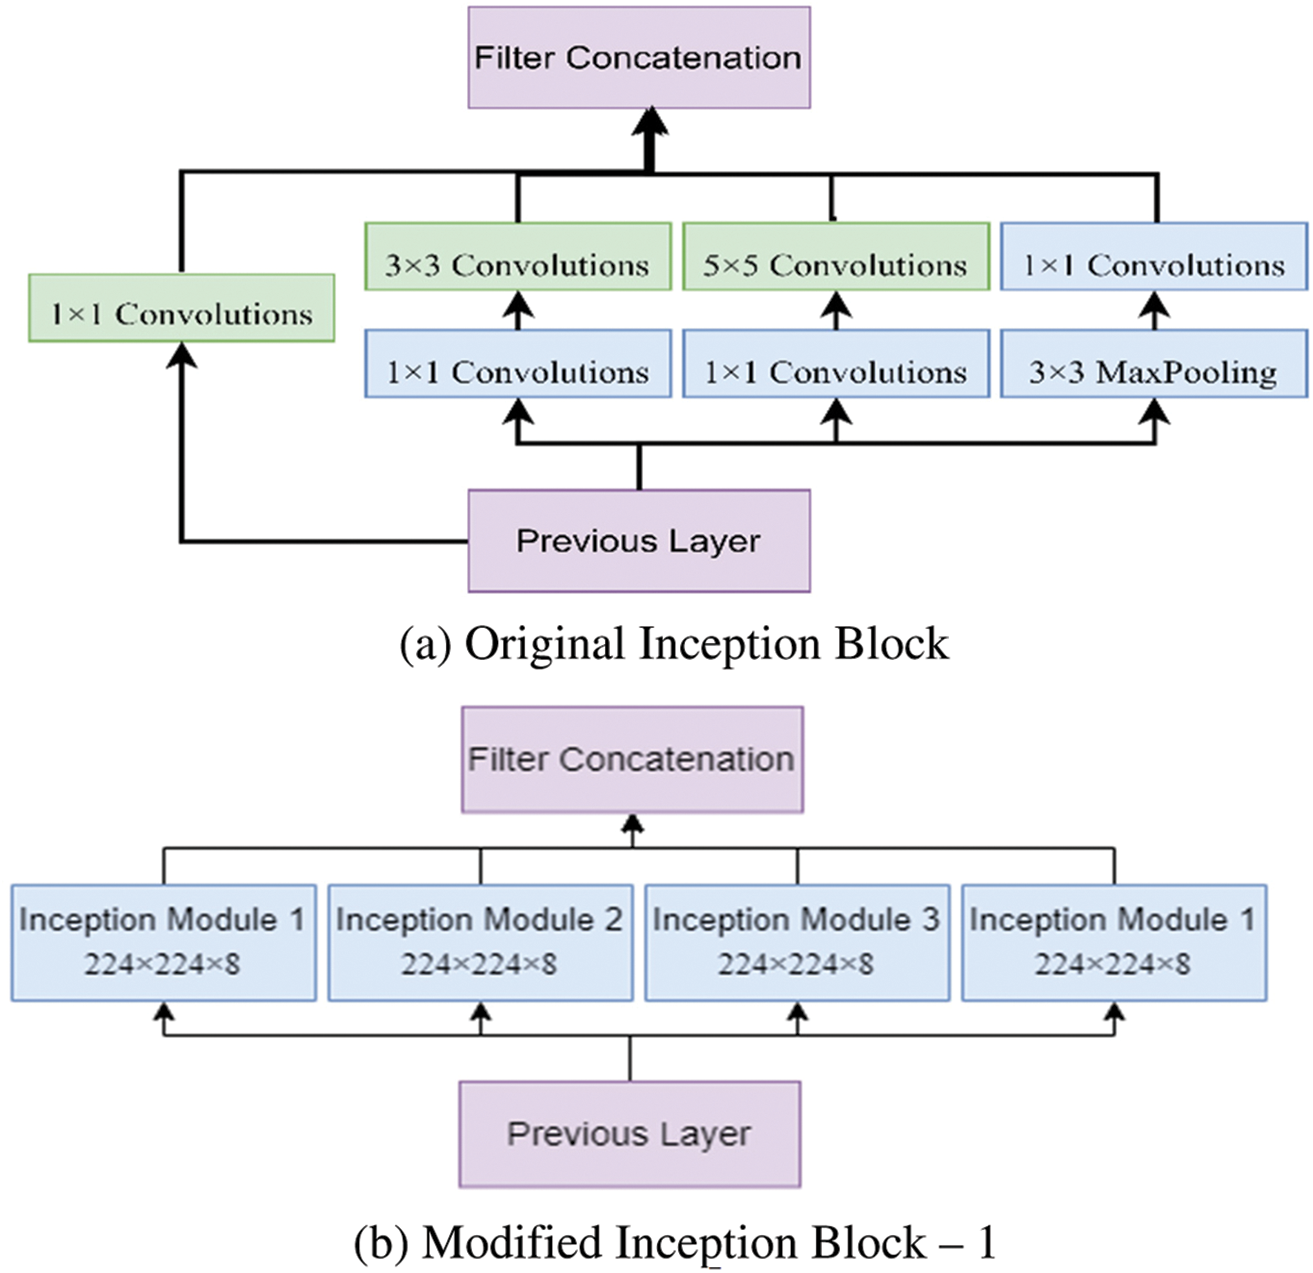
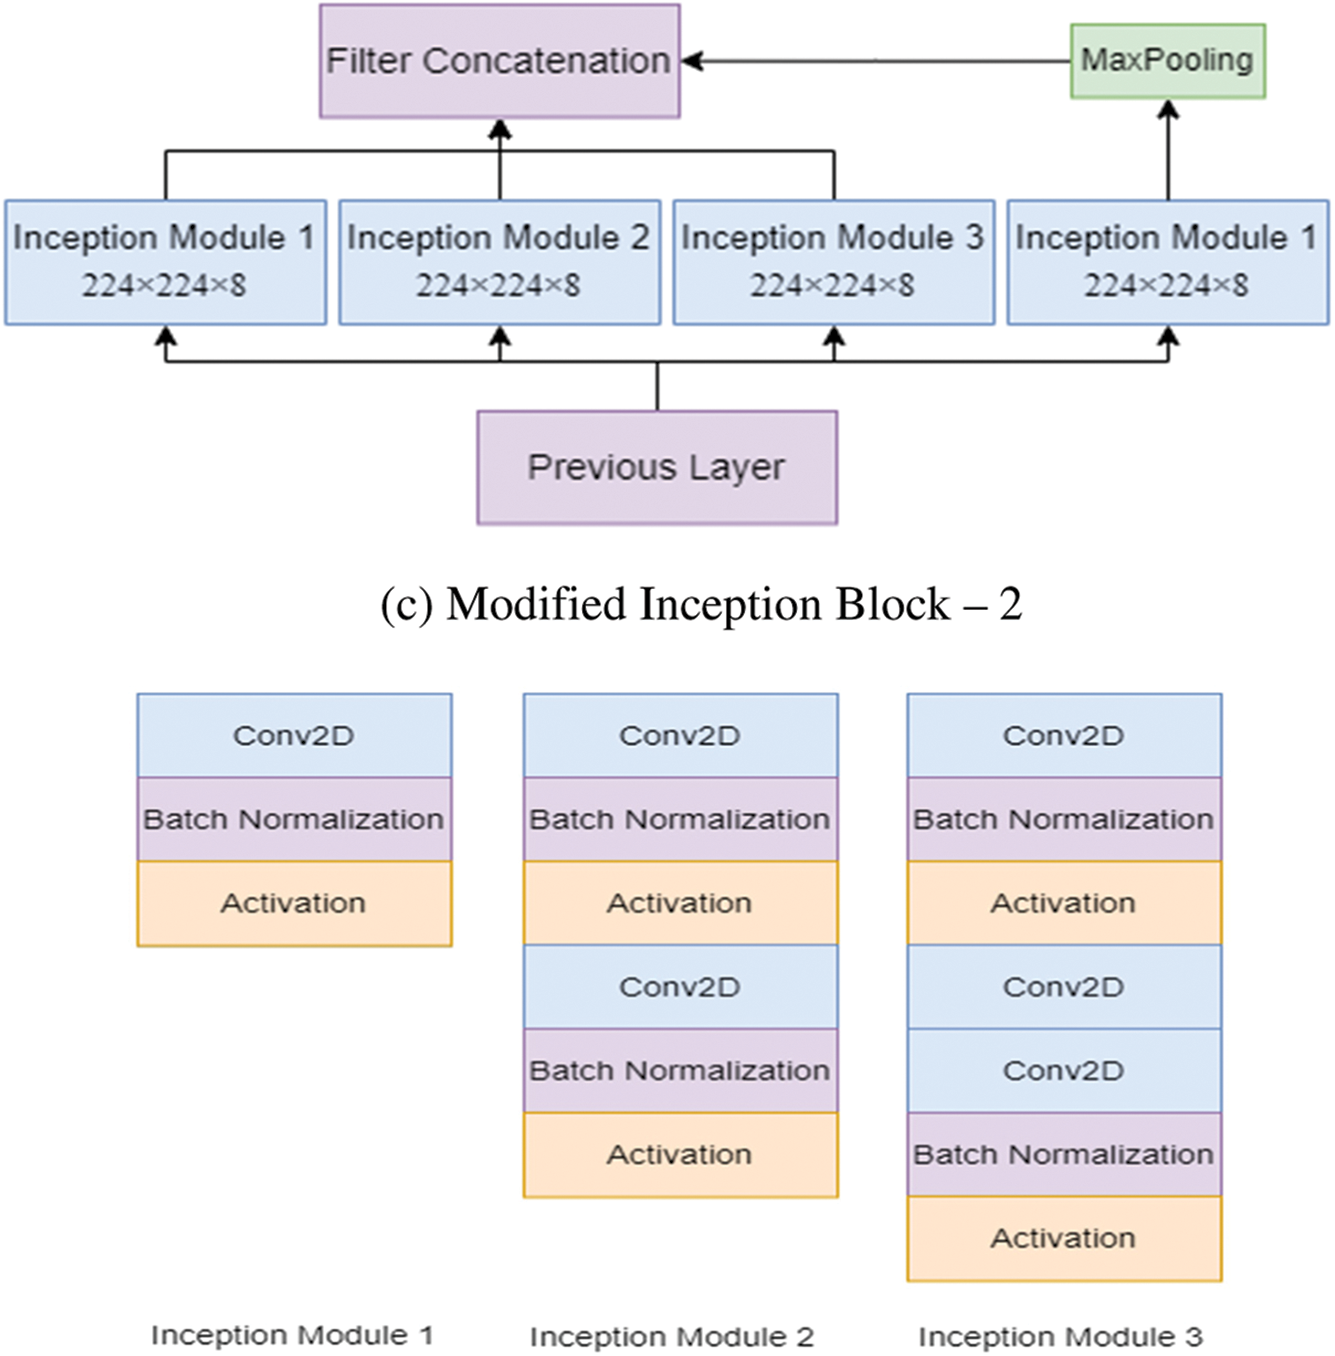
Figure 3: The modified inception modules
After processing, the features thus obtained with similar dimensions were fused to get the final feature set. In this study, two modified Inception blocks, which further comprised three Inception Modules, were used. The inception module 1 consists of convolution, batch normalization, and activation. The inception module 2 consists of convolution, batch normalization, activation, convolution, batch normalization, and activation. Inception module 3 consists of convolution, batch normalization, activation, convolution, convolution, batch normalization, and activation. The input images are processed with 3 × 3 different Inception modules to obtain the feature map with increased channels. The modified Inception block-2 gets good results compared to Inception block-1 because, in Inception block-2, a 3 × 3 max pooling layer is used to reduce feature information and redundant information. This process ensures the extraction of meaningful feature information. This max pooling layer reduces overfitting and computational cost. Thus, Inception block-2 gets good results compared to Inception block-1.
Fig. 4 shows the functioning of the actual Inception U-Net architecture. In pixel-based image segmentation, U-Net is the prominent CNN architecture in the classification task. In the proposed work, inception blocks were integrated into U-Net and customized convolution layers to realize high accuracy in severity prediction. Initially, the width of the network is enlarged by adding parallel filters of different sizes to the primary U-Net model. In the proposed model, only parallel layers were used to reduce the number of parameters and computational complexity. In this proposed model, as shown in Fig. 5, we designed the downsampling/contraction and the upsampling/expansion paths for pattern recognition and returned the output in the input size. The model was customized to reduce the input using switch normalization. This technique automatically adapts different reduction operations, such as batch norm, instance norm, and layer norm. Appropriate padding was used by all convolutions. An activation function ReLu was used for intermediate convolutions, including inception and sigmoid for the output. The input images are processed with 3 × 3 sized filters in Inception modules to obtain the feature map with increased channels. The modified Inception block-2 produces good results compared to Inception block-1 because in Inception block-2 (MIU-Net), a 3 × 3 max pooling layer is used to reduce redundant feature information and extract meaningful features. Further, max pooling aids in reducing overfitting and computational costs. Thus, Modified Inception block-2 gets good results when compared to Inception block-1.
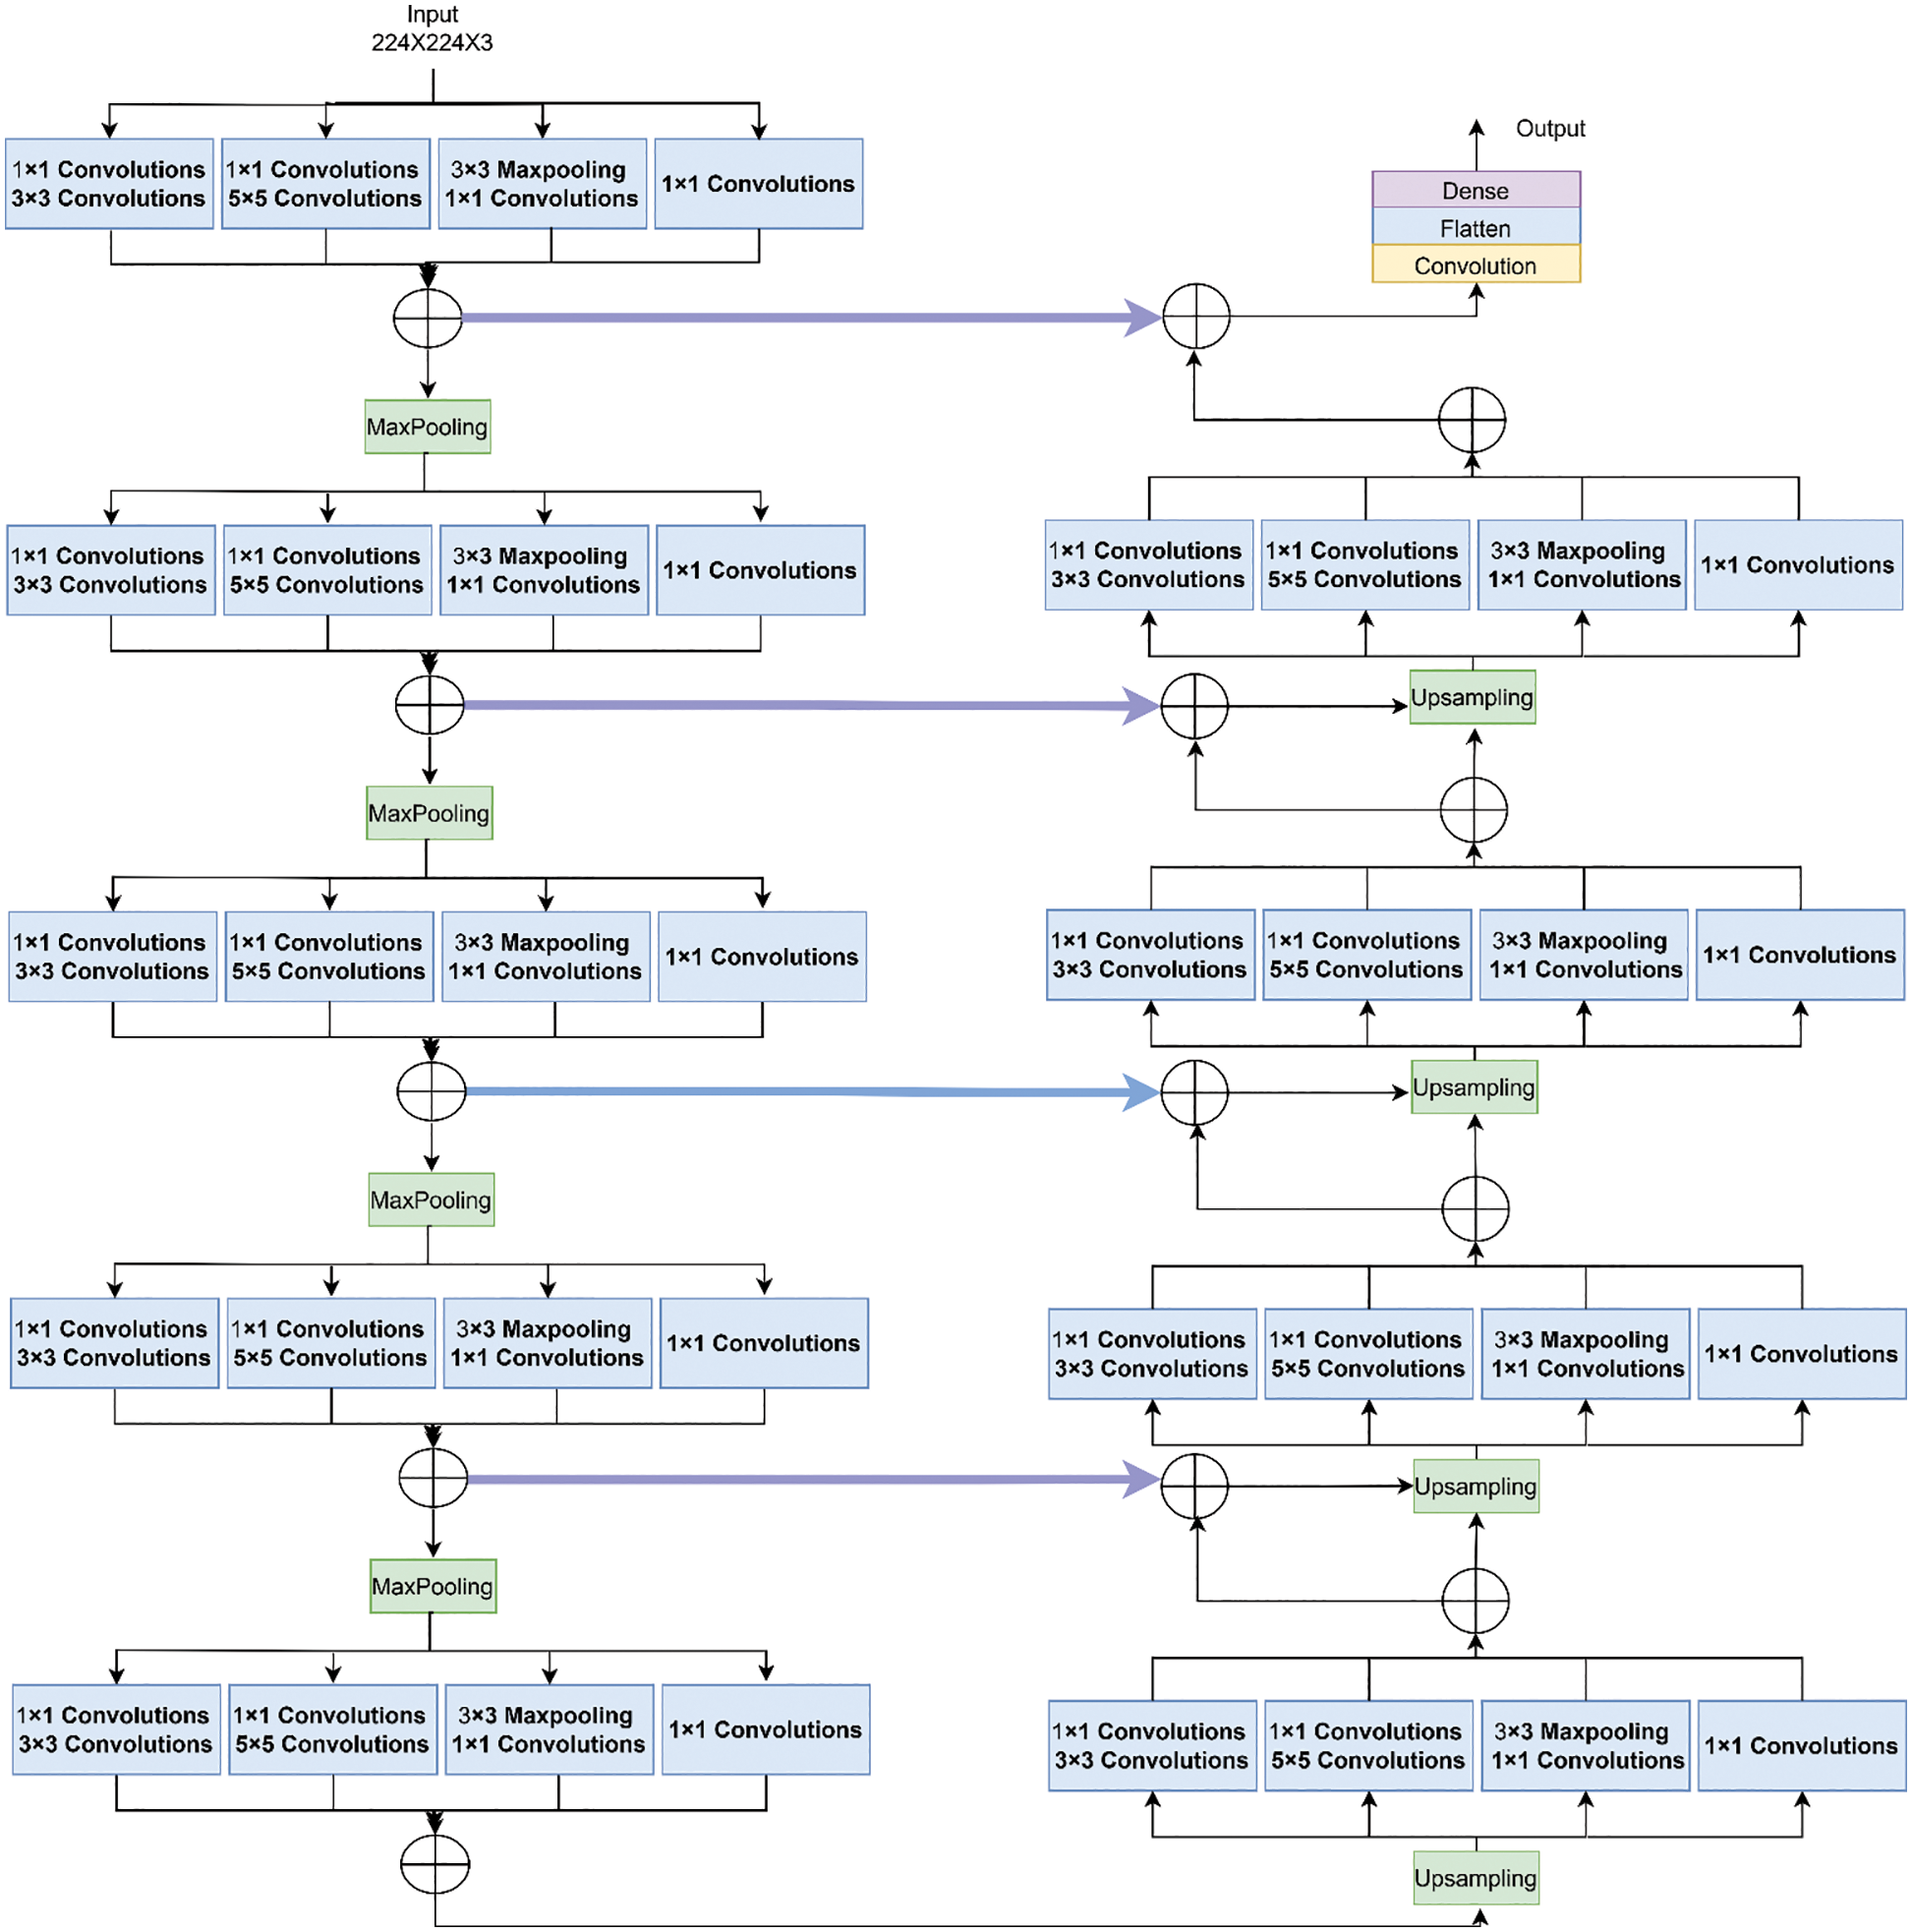
Figure 4: Architecture of inception U-net (IUNET)
Figure 5: Architecture of the proposed hybrid inception U-Net (HIUNET)
It comprises 3 × 3 convolutions, followed by an activation function named ReLu and batch normalization. Then, 2 × 2 max pooling is done to reduce the spatial dimensions. The analysis path is shown in Eq. (2):
Here, the image size was reduced to 224 × 224 × 32. The feature channels were doubled after the completion of each downsampling step.
It receives the contracting path’s output, which serves as this path’s input. After upsampling, the image size was decreased to 28 × 28 × 512, followed by a 2 × 2 transpose convolution wherein the feature channels were halved. The expanding route up samples the feature map at each stage. Concatenation with the feature map obtained from the contracting path was followed by 3 × 3 convolution and ReLu. Finally, a 1 × 1 convolution was used to map the channels to the desired number of classes.
3.2.3 Merging of Expanding and Contracting Paths
Concatenating the prior outputs is the fundamental goal of establishing the identity block link between the contraction and expansion paths. The difference between regular and identical blocks is that batch normalization is implemented after each convolution block. Due to the limited feature map, the identity blocks are preserved at the network’s center, and smaller kernels are used in favor of bigger ones to save time and resources. Assume batch normalization as DB layer, mp × p (•) for the max-pooling layer, and bp × p stands for a p * p convolution layer. The ∘ sign, which denotes concatenation, follows the proposed residual module. lIR stands for the bottleneck layer. The performance of the suggested residual module is described in Eq. (3):
The (l + 1)th layer of the identity block generates the output as shown in Eq. (4):
Combining the feature maps results in [x0, x1,…, xl].
3.2.4 Downsampling and Upsampling Blocks
These blocks are employed to increase and decrease the maps’ size and improve accuracy. Let
The term for the upsampling block is shown in Eq. (6):
As inputs, the trained images are employed. After each residual block, the number of channels doubles. The feature map was reduced by half after downsampling, showing a direction toward contraction. The feature map’s channel number was cut in half, and its size was doubled after upsampling since the residual block was on an extended path.
4 Experimental Results and Discussions
Using pre-trained models from the APTOS and KAGGLE datasets, the proposed model analysis was carried out using HIUNET.
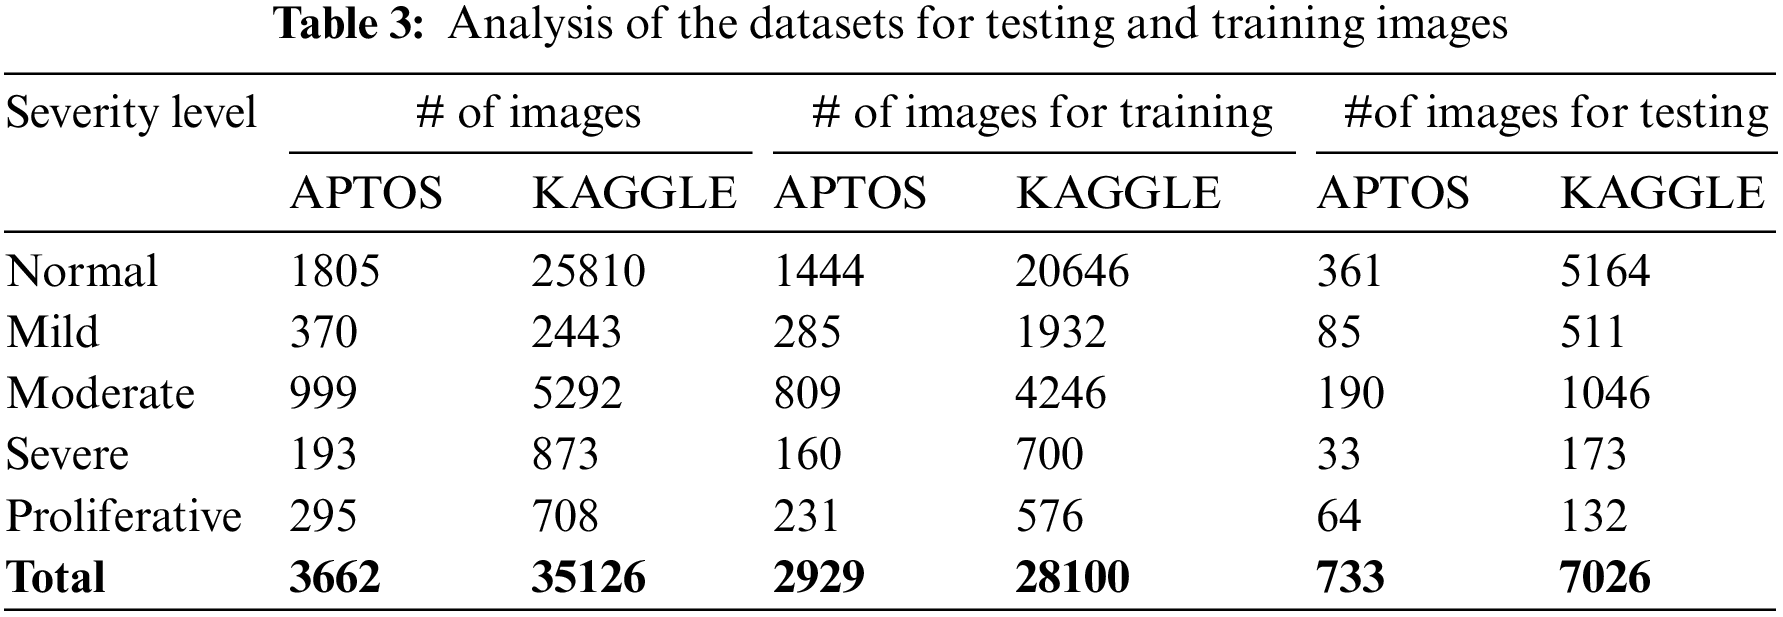
This study’s APTOS and KAGGLE datasets comprised 3662 and 35126 samples separated into five classes. From APTOS, 733 samples were used for performance assessment, while 2929 samples were used for model creation in Table 3. For KAGGLE, 7026 samples were used for performance assessment, while 28100 samples were used for model creation.
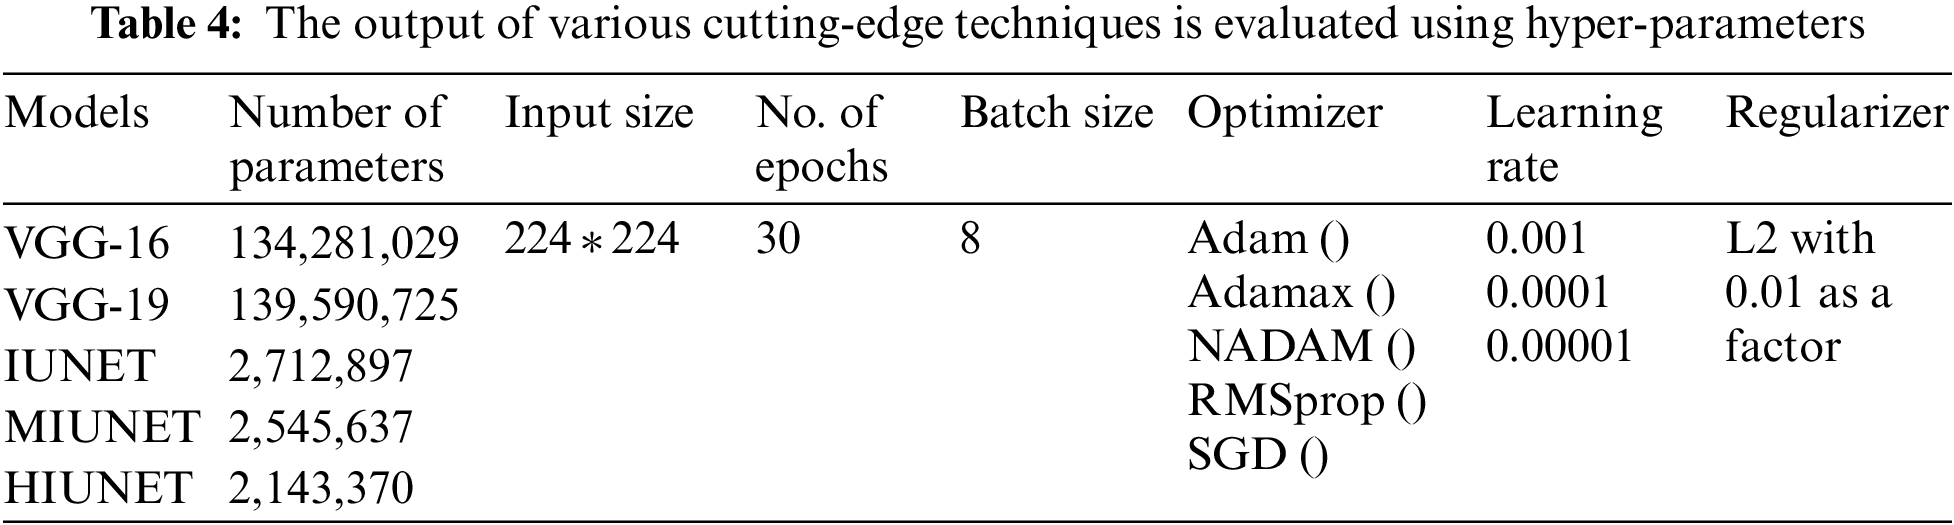
Hyperparameter tuning is selecting a collection of parameters to learn an algorithm. The learning process is managed using its value. To generalize data patterns, a model needs constraints, weights, and learning rates. These measurements are called hyperparameters. The performance of the proposed model is improvised through hyper-parameter tuning. In the proposed work, parameters are tweaked through manual search and optimization achieved through the following list of hyper-parameters in Table 4, along with the size of the input image, different optimizers, different learning rates, batch size, and the number of epochs.
4.3 Pre-Trained Models’ Performance Evaluation
The APTOS and KAGGLE datasets in this study were pre-processed. Pre-trained models VGG-16 and VGG-19 were applied. With a learning rate of 0.0001 for both extension to the Adaptive Moment estimation (Adamax) and Stochastic Gradient Descent (SGD), the VGG-16 model has 134,281,029 trainable parameters, with 91% and 81% accuracy rates, respectively. With learning rates of 0.001, 0.0001, and 0.00001 for Adamax, Adaptive Moment estimation (Adam), Nesterov-Accelerated Adaptive Moment Estimation (NADAM), and SGD, respectively, VGG-19 has 139,590,725 trained parameters, with an accuracy rate of 91%. There are 2,712,897 parameters in the IUNET Model. With learning rates of 0.0001 and 0.00001 for Adam and Adamax, respectively, IUNET exhibits a 94% accuracy rate. In contrast, with learning rates of 0.001, 0.001, and 0.00001 for NADAM, RMSProp, and SGD, respectively, it exhibits an 84% accuracy rate. The MIUNET model has 2,545,637 trainable parameters. With Adamax and NADAM, the MIUNET obtained an accuracy rate of 93% at a learning rate of 0.001, while with SGD, it reached an accuracy rate of 84% at a learning rate of 0.00001. We proposed a novel HIUNET model with 2,143,370 trainable parameters. With learning rates of 0.0001 and 0.0001 for Adam and SGD, the proposed HIUNET model achieved accuracy rates of 95% and 86%, respectively. The HIUNET model outperformed the pre-trained models in terms of accuracy. The APTOS dataset was applied to different models with different learning rates.
The models’ results are shown in Fig. 6. After pre-processing, the models were tested against the KAGGLE dataset. With learning rates of 0.0001 and 0.001 for NADAM and SGD optimizers, the VGG-16 model achieved accuracy rates of 90% and 84%, respectively. Furthermore, with learning rates of 0.0001 for Adamax and 0.0001 for the Root Mean Squared Propagation (RMSprop) optimizer, the VGG-19 model achieved accuracy rates of 90% and 83%, respectively. The IUNET model obtained a 90% accuracy rate with learning rates of 0.001 and 0.0001 for RMSprop and an 84% accuracy rate with a learning rate of 0.001 for NADAM.
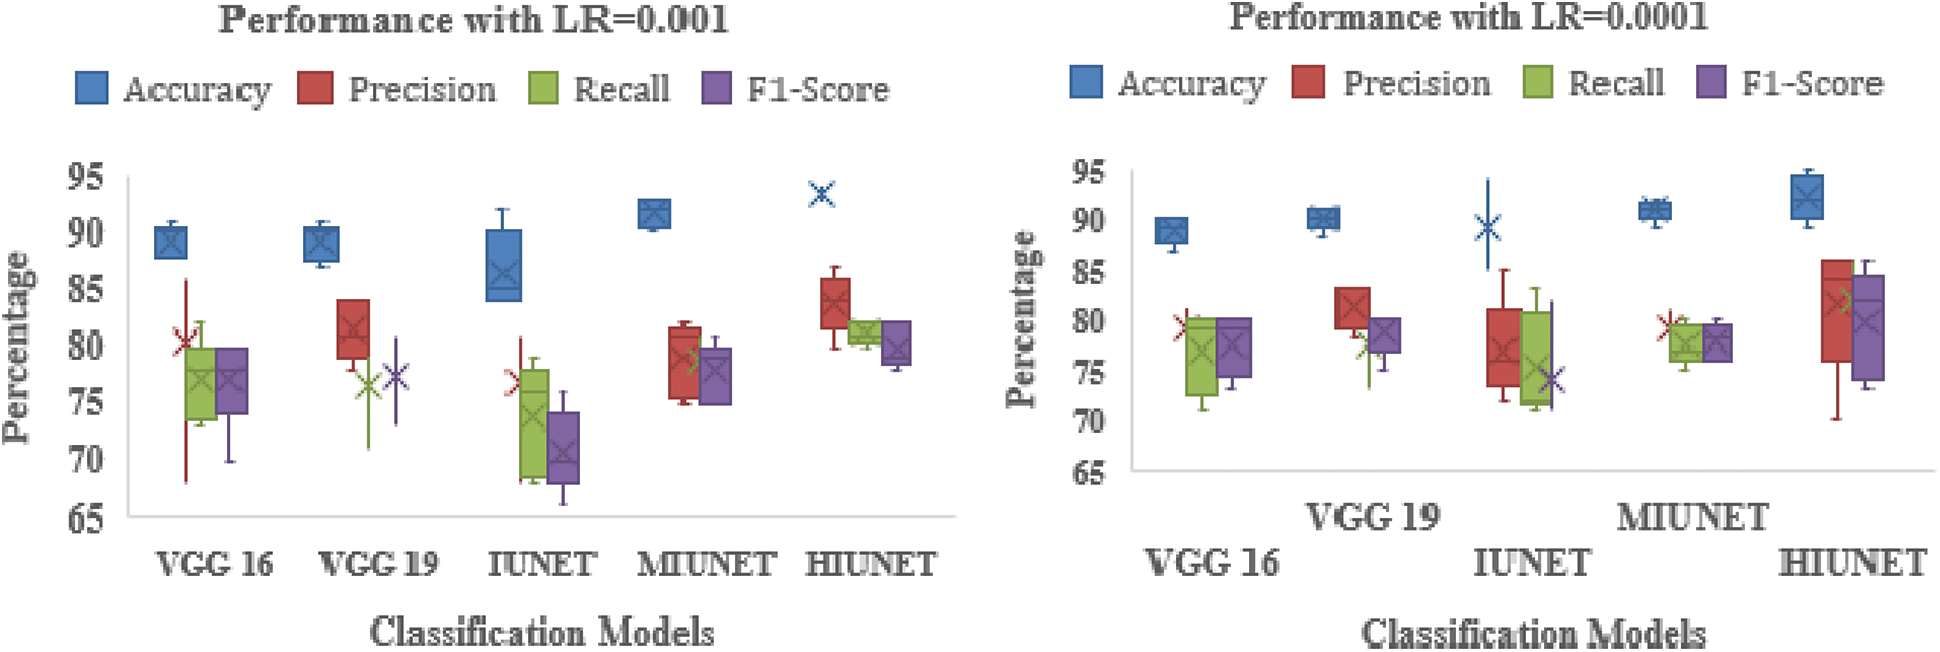
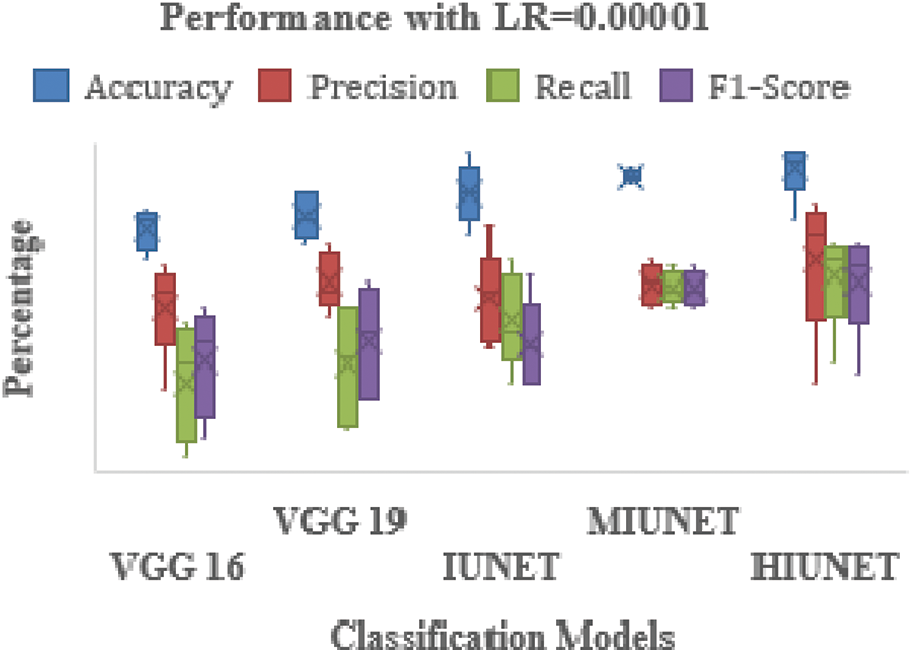
Figure 6: Performance comparison of the proposed method with various classifiers on the APTOS dataset
The MIUNET model achieved a 90% accuracy rate with learning rates of 0.00001, 0.001, and 0.00001 for Adam, NADAM, and RMSprop, respectively, and 87% accuracy with a learning rate of 0.001 for SDG. The results for all the models are shown in Fig. 7.
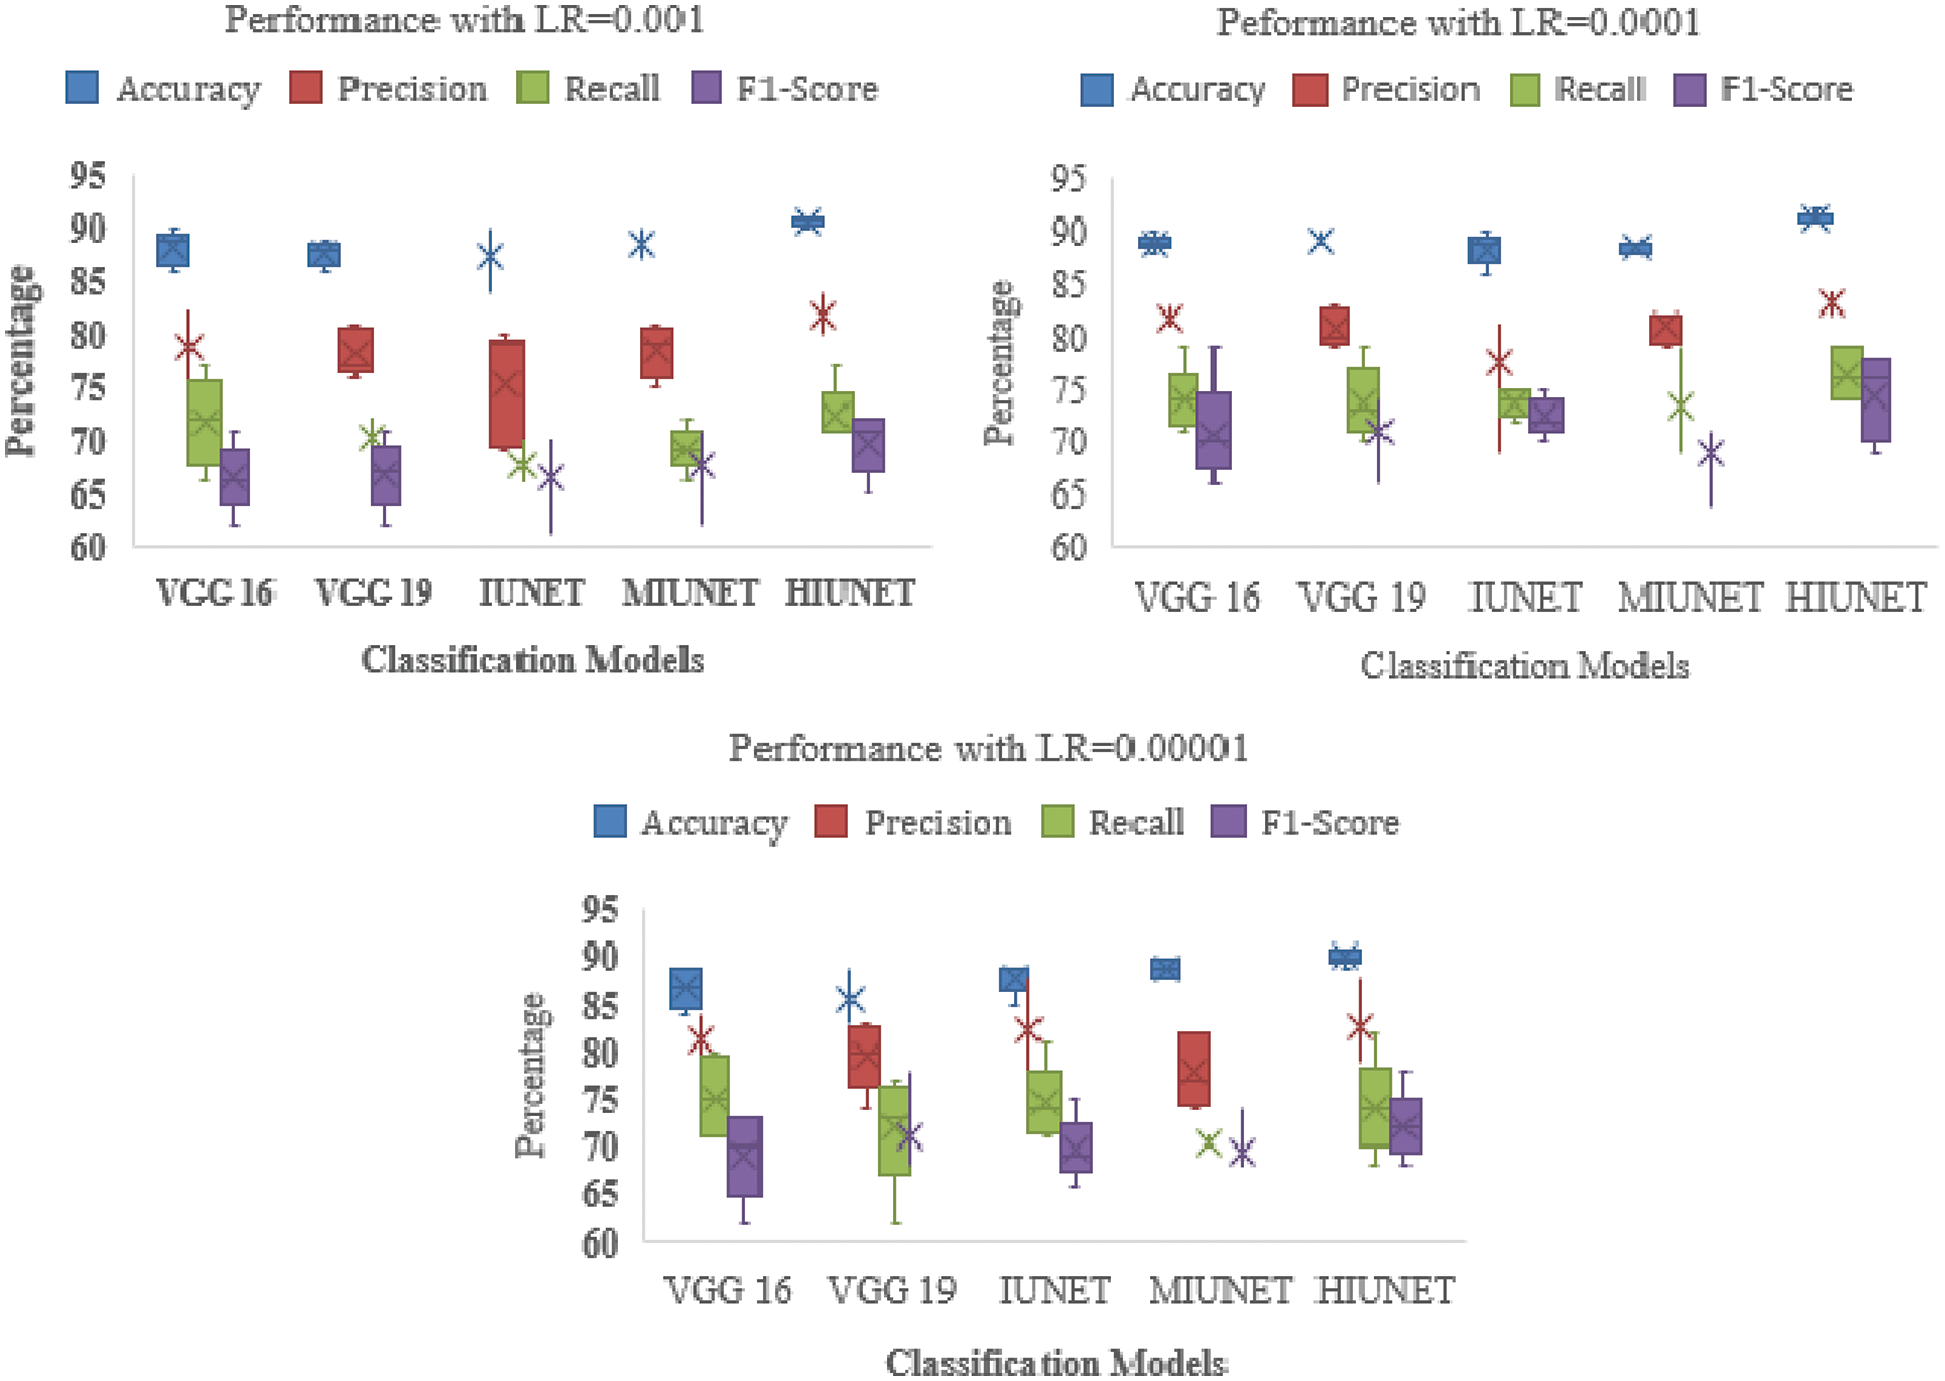
Figure 7: Performance comparison of the proposed method with various classifiers on the Kaggle dataset
Our proposed HIUNET model achieved a 92% accuracy rate with a learning rate of 0.0001 for Adam but only a 90% accuracy rate with learning rates of 0.00001, 0.001, and 0.00001 for Adamax, NADAM, and SGD, respectively. Again, our proposed HIUNET model outperformed the pre-trained models in terms of accuracy. The KAGGLE dataset was applied to different models with different learning rates.
Our proposed HIUNET model had 2,143,370 trainable parameters. Compared to VGG-16 (134,281,029), VGG-19 (139,590,725), IUNET (2,712,897), and MIUNET (2,545,637), our model had significantly fewer trainable parameters (23,544,837). Even with fewer parameters, our suggested HIUNET model beat the state-of-the-art techniques, obtaining an accuracy rate of 95% on the ATPOS dataset and 92% on the KAGGLE dataset. The performance of CNN models is based on their learning rate. A higher learning rate accelerates the learning process and increases the loss function, while a lower learning rate causes the loss function to decrease steadily.
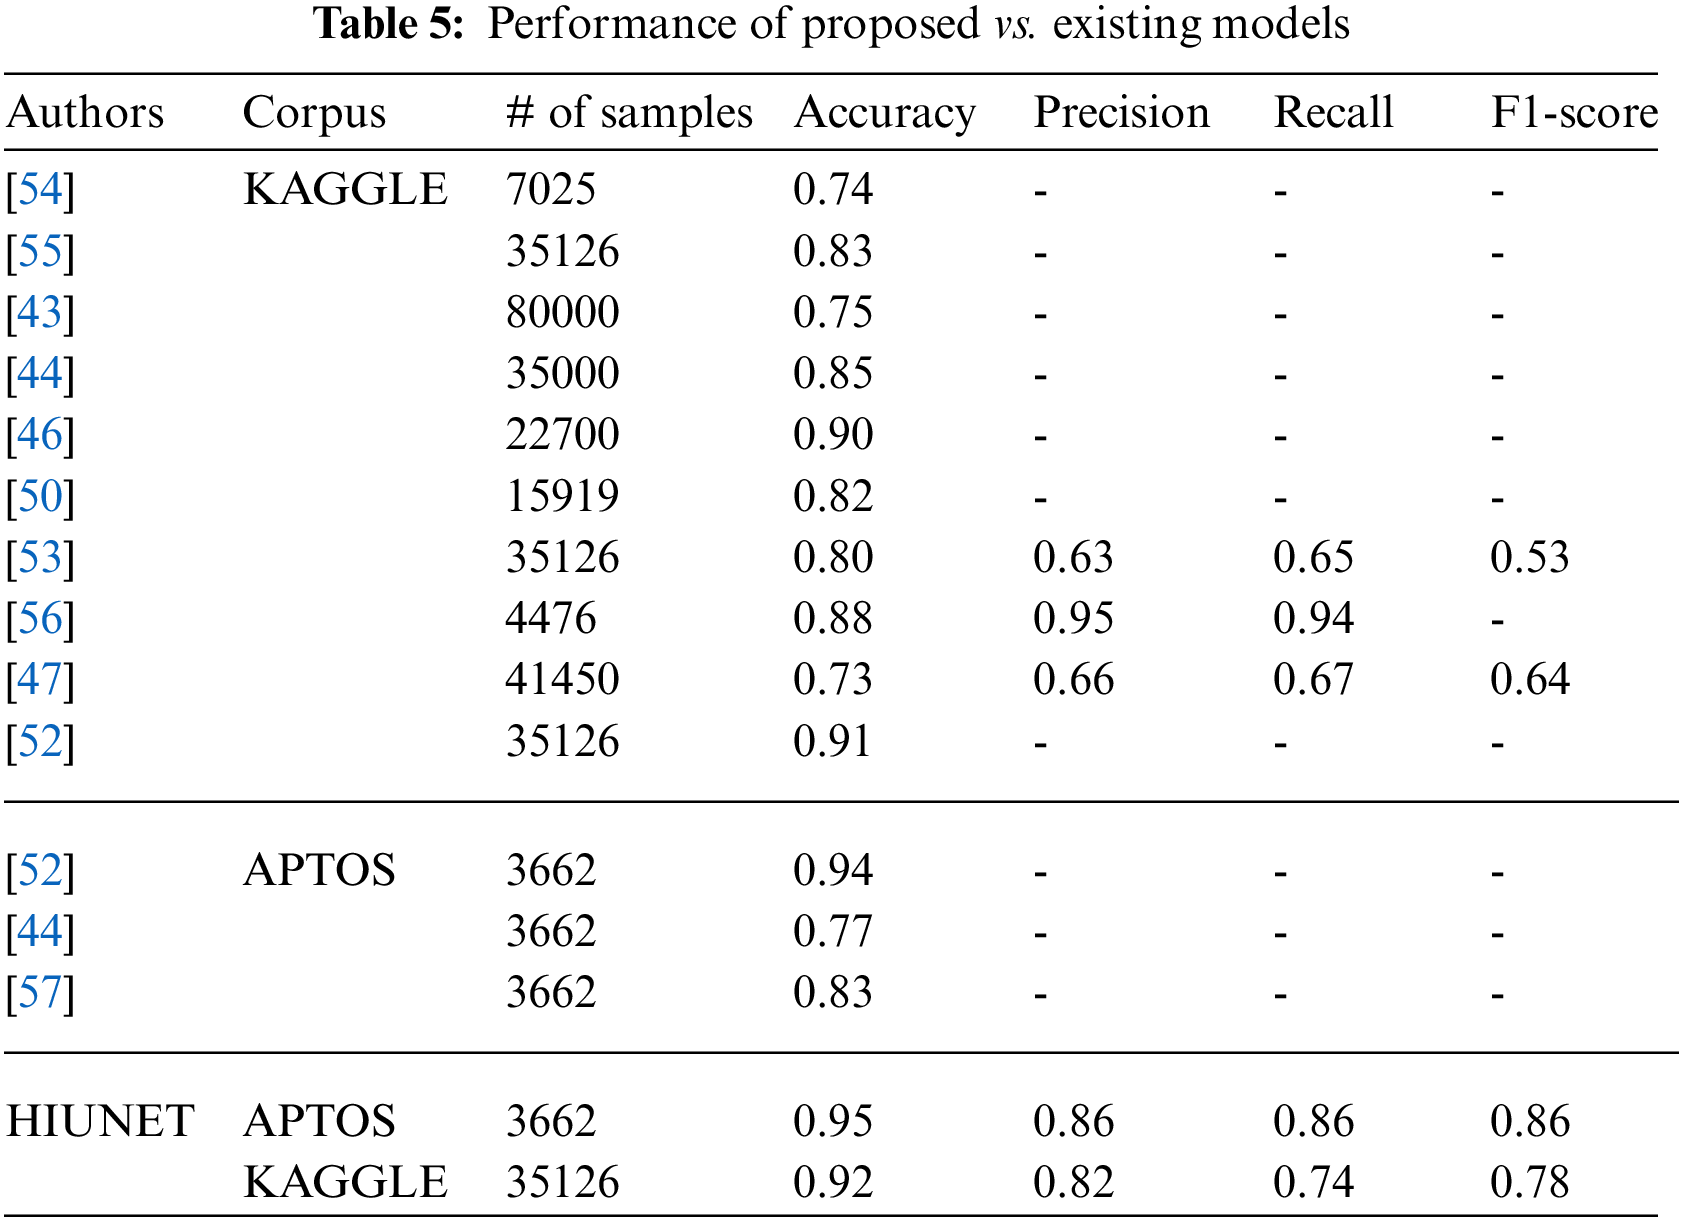
An optimum learning rate must be chosen to minimize the loss function in classification problems. Adamax, as an optimizer, with a learning rate of 0.00001, yields a higher performance when compared to the remaining hyperparameters. The result obtained from the proposed HIUNET model is even better than the existing models. The APTOS and KAGGLE datasets were used to train our model, which attained 95% and 92% accuracy rates, respectively, outperforming the current models described in Table 5.
The proposed study has failed to predict correct class labels for the low-contrast images and could not pan out poorly segmented pupil images. However, there is a score to improve the generalization capability of the proposed work.
DR is a microvascular complication, and early detection of DR can prevent permanent blindness. In this work, a novel Hybrid Inception U-Net was proposed for high-precision automated DR diagnosis. In the proposed model, only parallel layers were used to reduce the number of parameters and computational complexity. Further, the model followed the downsampling/contraction and the upsampling/expansion paths to detect DR with the actual input size. The proposed model has obtained the feature map with increased channels, and the input images are processed with 3 × 3 sized filters in Inception modules. The modified Inception block-2 has yielded better results when compared to Inception block-1 due to the presence of a 3 × 3 max pooling layer to reduce redundant feature information and extract meaningful features. The proposed model has high generalization and effectively highlights lesions more than previously achieved. Our proposed HIUNET model labels the images according to their severity. On APTOS and KAGGLE, our proposed model’s accuracy rates were 95% and 92%, respectively. The suggested model is anticipated to be extremely helpful for ophthalmologists in identifying precise DR severity in a relatively shorter time.
Funding Statement: The authors received no specific funding for this study.
Conflicts of Interest: The authors declare they have no conflicts of interest to report regarding the present study.
References
1. A. Srinivasan and S. Sundaram, “Applications of deformable models for in-depth analysis and feature extraction from medical images-A review,” Pattern Recognition and Image Analysis, vol. 23, no. 2, pp. 296–318, 2013. [Google Scholar]
2. L. P. Aiello, “The potential role of PKC β in diabetic retinopathy and macular edema,” Survey of Ophthalmology, vol. 47, no. SUPPL. 2, pp. 263–269, 2002. [Google Scholar]
3. E. Treatment and D. Retinopathy, “Grading diabetic retinopathy from stereoscopic color fundus photographs—An extension of the modified airlie house classification: Etdrs report number 10,” Ophthalmology, vol. 98, no. 5, pp. 786–806, 1991. [Google Scholar]
4. J. Krause, V. Gulshan, E. Rahimy, P. Karth, K. Widner et al., “Grader variability and the importance of reference standards for evaluating machine learning models for diabetic retinopathy,” Ophthalmology, vol. 125, no. 8, pp. 1264–1272, 2018. [Google Scholar] [PubMed]
5. P. Venkatesh, R. Sharma, N. Vashist, R. Vohra and S. Garg, “Detection of retinal lesions in diabetic retinopathy: Comparative evaluation of 7-field digital color photography versus red-free photography,” International Ophthalmology, vol. 35, no. 5, pp. 635–640, 2015. [Google Scholar] [PubMed]
6. A. A. Abdulsahib, M. A. Mahmoud, H. Aris, S. S. Gunasekaran and M. A. Mohammed, “An automated image segmentation and useful feature extraction algorithm for retinal blood vessels in fundus images,” Electronics, vol. 11, no. 9, pp. 1–24, 2022. [Google Scholar]
7. A. A. Abdulsahib, M. A. Mahmoud, M. A. Mohammed, H. H. Rasheed, S. A. Mostafa et al., “Comprehensive review of retinal blood vessel segmentation and classification techniques: Intelligent solutions for green computing in medical images, current challenges, open issues, and knowledge gaps in fundus medical images,” Network Modelling Analysis in Health Informatics and Bioinformatics, vol. 10, no. 1, pp. 1–32, 2021. [Google Scholar]
8. C. L. Kumar, A. V. Juliet, B. Ramakrishna, S. Chakraborty, M. A. Mohammed et al., “Computational microfluidic channel for separation of escherichia coli from blood-cells,” Computers, Materials & Continua, vol. 67, no. 2, pp. 1369–1384, 2021. [Google Scholar]
9. S. Lal, S. U. Rehman, J. H. Shah, T. Meraj, H. T. Rauf et al., “Adversarial attack and defence through adversarial training and feature fusion for diabetic retinopathy recognition,” Sensors, vol. 21, no. 11, pp. 1–21, 2021. [Google Scholar]
10. S. Maqsood, R. Damaševičius and R. Maskeliūnas, “Hemorrhage detection based on 3D cnn deep learning framework and feature fusion for evaluating retinal abnormality in diabetic patients,” Sensors, vol. 21, no. 11, pp. 1–21, 2021. [Google Scholar]
11. L. K. Ramasamy, S. G. Padinjappurathu, S. Kadry and R. Damaševičius, “Detection of diabetic retinopathy using a fusion of textural and ridgelet features of retinal images and sequential minimal optimization classifier,” PeerJ Computer Science, vol. 7, no. 1, pp. 1–21, 2021. [Google Scholar]
12. G. Litjens, T. Kooi, B. Bejnordi, A. Setio, F. Ciompi et al., “A survey on deep learning in medical image analysis,” Medical Image Analysis, vol. 42, no. 1, pp. 60–88, 2017. [Google Scholar] [PubMed]
13. H. Zhu, Y. Zhang, M. Li, A. Ashok and K. Ota, “Exploring deep learning for efficient and reliable mobile sensing,” IEEE Network, vol. 32, no. 4, pp. 6–7, 2018. [Google Scholar]
14. A. Krizhevsky, I. Sutskever and G. E. Hinton, “ImageNet classification with deep convolutional neural networks,” Communications of the ACM, vol. 60, no. 6, pp. 84–90, 2017. [Google Scholar]
15. K. Simonyan and A. Zisserman, “Very deep convolutional networks for large-scale image recognition,” in 3rd Int. Conf. Learn. Represent. ICLR 2015-Conf. Track Proc., San Diego, CA, USA, pp. 1–14, 2015. [Google Scholar]
16. L. C. Chen, G. Papandreou, I. Kokkinos, K. Murphy and A. L. Yuille, “Semantic image segmentation with deep convolutional nets and fully connected CRFs,” in 3rd Int. Conf. Learn. Represent. ICLR 2015-Conf. Track Proc., San Diego, CA, USA, vol. 40, no. 4, pp. 834–848, 2015. [Google Scholar]
17. C. Szegedy, W. Liu, Y. Jia, P. Sermanet, S. Reed et al., “Going deeper with convolutions,” in Proc. IEEE Comput. Soc. Conf. Comput. Vis. Pattern Recognit., Boston, MA, USA, vol. 07-12-June, pp. 1–9, 2015. [Google Scholar]
18. K. He, X. Zhang, S. Ren and J. Sun, “Deep residual learning for image recognition,” in Proc. IEEE Comput. Soc. Conf. Comput. Vis. Pattern Recognit., Las Vegas, NV, USA, vol. 2016-Decem, pp. 770–778, 2016. [Google Scholar]
19. G. Huang, Z. Liu, L. Van Der Maaten and K. Q. Weinberger, “Densely connected convolutional networks,” in Proc.-30th IEEE Conf. Comput. Vis. Pattern Recognition, CVPR 2017, Honolulu, HI, USA, vol. 2017-Janua, pp. 2261–2269, 2017. [Google Scholar]
20. L. Chen, P. Bentley, K. Mori, K. Misawa, M. Fujiwara et al., “DRINet for medical image segmentation,” IEEE Transactions on Medical Imaging, vol. 37, no. 11, pp. 2453–2462, 2018. [Google Scholar] [PubMed]
21. T. Surasak, I. Takahiro, C. H. Cheng, C. E. Wang and P. Y. Sheng, “Histogram of oriented gradients for human detection in video,” in Proc. 2018 5th Int. Conf. Bus. Ind. Res. Smart Technol. Next Gener. Information, Eng. Bus. Soc. Sci. ICBIR 2018, Bangkok, Thailand, pp. 172–176, 2018. [Google Scholar]
22. J. Redmon, S. Divvala, R. Girshick and A. Farhadi, “You only look once: Unified, real-time object detection,” in Proc. IEEE Comput. Soc. Conf. Comput. Vis. Pattern Recognit., Las Vegas, NV, USA, vol. 2016-Decem, pp. 779–788, 2016. [Google Scholar]
23. T. Ahonen, A. Hadid and M. Pietikäinen, “Face description with local binary patterns: Application to face recognition,” IEEE Transactions on Pattern Analysis and Machine Intelligence, vol. 28, no. 12, pp. 2037–2041, 2006. [Google Scholar] [PubMed]
24. S. S. Rubini and A. Kunthavai, “Diabetic retinopathy detection based on eigenvalues of the hessian matrix,” Procedia Computer Science, vol. 47, pp. 311–318, 2015. [Google Scholar]
25. M. R. K. Mookiah, U. R. Acharya, R. J. Martis, C. K. Chua, C. M. Lim et al., “Evolutionary algorithm based classifier parameter tuning for automatic diabetic retinopathy grading: A hybrid feature extraction approach,” Knowledge-Based Systems, vol. 39, pp. 9–22, 2013. [Google Scholar]
26. A. P. Bhatkar and G. U. Kharat, “Detection of diabetic retinopathy in retinal images using mlp classifier,” in Proc.-2015 IEEE Int. Symp. Nanoelectron. Inf. Syst. iNIS 2015, Indore, India, pp. 331–335, 2016. [Google Scholar]
27. G. Quellec, M. Lamard, P. M. Josselin, G. Cazuguel, B. Cochener et al., “Optimal wavelet transform for the detection of microaneurysms in retina photographs,” IEEE Transactions on Medical Imaging, vol. 27, no. 9, pp. 1230–1241, 2008. [Google Scholar] [PubMed]
28. M. Esmaeili, H. Rabbani, A. M. Dehnav and A. Dehghani, “A new curvelet transform based method for extraction of red lesions in digital color retinal images,” in Proc.-Int. Conf. Image Process. ICIP, Hong Kong, China, pp. 4093–4096, 2010. [Google Scholar]
29. J. P. Bae, K. G. Kim, H. C. Kang, C. B. Jeong, K. H. Park et al., “A study on hemorrhage detection using hybrid method in fundus images,” Journal of Digital Imaging, vol. 24, no. 3, pp. 394–404, 2011. [Google Scholar] [PubMed]
30. I. Lazar and A. Hajdu, “Retinal microaneurysm detection through local rotating cross-section profile analysis,” IEEE Transactions on Medical Imaging, vol. 32, no. 2, pp. 400–407, 2013. [Google Scholar] [PubMed]
31. A. Sopharak, B. Uyyanonvara and S. Barman, “Simple hybrid method for fine microaneurysm detection from non-dilated diabetic retinopathy retinal images,” Computerized Medical Imaging and Graphics, vol. 37, no. 5–6, pp. 394–402, 2013. [Google Scholar] [PubMed]
32. K. M. Adal, D. Sidibe, S. Ali, E. Chaum, T. P. Karnowski et al., “Automated detection of microaneurysms using scale-adapted blob analysis and semi-supervised learning,” Computer Methods and Programs in Biomedicine, vol. 114, no. 1, pp. 1–10, 2013. [Google Scholar]
33. B. Antal and A. Hajdu, “Computerized medical imaging and graphics improving microaneurysm detection in color fundus images by using context-aware approaches,” Computerized Medical Imaging and Graphics, vol. 37, no. 5–6, pp. 403–408, 2013. [Google Scholar]
34. M. Tavakoli, R. Pourreza, H. Pourreza and A. Mehdizadeh, “A complementary method for automated detection of microaneurysms in fl uorescein angiography fundus images to assess diabetic retinopathy,” Pattern Recognition, vol. 46, no. 10, pp. 2740–2753, 2013. [Google Scholar]
35. M. D. Abràmoff, M. Niemeijer, M. S. A. Suttorp-Schulten, M. A. Viergever, S. R. Russell et al., “Evaluation of a system for automatic detection of diabetic retinopathy from color fundus photographs in a large population of patients with diabetes,” Diabetes Care, vol. 31, no. 2, pp. 193–198, 2008. [Google Scholar]
36. G. Quellec, K. Charrière, Y. Boudi, B. Cochener and M. Lamard, “Deep image mining for diabetic retinopathy screening,” Medical Image Analysis, vol. 39, no. 1, pp. 178–193, 2017. [Google Scholar] [PubMed]
37. R. Gargeya and T. Leng, “Automated identification of diabetic retinopathy using deep learning,” Ophthalmology, vol. 124, no. 7, pp. 962–969, 2017. [Google Scholar] [PubMed]
38. D. S. W. Ting, C. Y. Cheung, G. Lim, G. S. W. Tan, N. D. Quang et al., “Development and validation of a deep learning system for diabetic retinopathy and related eye diseases using retinal images from multiethnic populations with diabetes,” Journal of the American Medical Association, vol. 318, no. 22, pp. 2211–2223, 2017. [Google Scholar] [PubMed]
39. L. Dai, R. Fang, H. Li, X. Hou, B. Sheng et al., “Clinical report guided retinal microaneurysm detection with multi-sieving deep learning,” IEEE Transactions on Medical Imaging, vol. 37, no. 5, pp. 1149–1161, 2018. [Google Scholar] [PubMed]
40. R. Rosas-Romero, J. Martínez-Carballido, J. Hernández-Capistrán and L. J. Uribe-Valencia, “A method to assist in the diagnosis of early diabetic retinopathy: Image processing applied to detection of microaneurysms in fundus images,” Computerized Medical Imaging and Graphics, vol. 44, no. 1, pp. 41–53, 2015. [Google Scholar] [PubMed]
41. M. Shaban, Z. Ogur, A. Mahmoud, A. Switala, A. Shalaby et al., “A convolutional neural network for the screening and staging of diabetic retinopathy,” PLoS One, vol. 15, no. 6 June, pp. 1–13, 2020. [Google Scholar]
42. M. Mohammedhasan and H. Uğuz, “A new early stage diabetic retinopathy diagnosis model using deep convolutional neural networks and principal component analysis,” Traitement du Signal, vol. 37, no. 5, pp. 711–722, 2020. [Google Scholar]
43. H. Pratt, F. Coenen, D. M. Broadbent, S. P. Harding and Y. Zheng, “Convolutional neural networks for diabetic retinopathy,” Procedia Computer Science, vol. 90, no. July, pp. 200–205, 2016. [Google Scholar]
44. M. T. Esfahani, M. Ghaderi and R. Kafiyeh, “Classification of diabetic and normal fundus images using new deep learning method,” Leonardo Electronic Journal of Practices and Technologies, vol. 17, no. 32, pp. 233–248, 2018. [Google Scholar]
45. V. Deepa, C. S. Kumar and T. Cherian, “Automated grading of diabetic retinopathy using CNN with hierarchical clustering of image patches by siamese network,” Physical and Engineering Sciences in Medicine, vol. 45, no. 2, pp. 623–635, 2022. [Google Scholar] [PubMed]
46. B. Harangi, J. Toth, A. Baran and A. Hajdu, “Automatic screening of fundus images using a combination of convolutional neural network and hand-crafted features,” in Proc. Annu. Int. Conf. IEEE Eng. Med. Biol. Soc. EMBS, Berlin, Germany, pp. 2699–2702, 2019. [Google Scholar]
47. E. M. F. El Houby, “Using transfer learning for diabetic retinopathy stage classification,” Applied Computing and Informatics, vol. 1, no. 1, pp. 1–11, 2021. [Google Scholar]
48. K. Xu, D. Feng and H. Mi, “Deep convolutional neural network-based early automated detection of diabetic retinopathy using fundus image,” Molecules, vol. 22, no. 12, pp. 1–7, 2017. [Google Scholar]
49. H. Tariq, M. Rashid, A. Javed, E. Zafar, S. S. Alotaibi et al., “Performance analysis of deep-neural-network-based automatic diagnosis of diabetic retinopathy,” Sensors, vol. 22, no. 1, pp. 1–15, 2022. [Google Scholar]
50. G. T. Zago, R. V. Andreão, B. Dorizzi and E. O. Teatini Salles, “Diabetic retinopathy detection using red lesion localization and convolutional neural networks,” Computers in Biology and Medicine, vol. 116, no. 1, pp. 103537, 2020. [Google Scholar] [PubMed]
51. D. Das, S. K. Biswas and S. Bandyopadhyay, “A critical review on diagnosis of diabetic retinopathy using machine learning and deep learning,” Multimedia Tools and Applications, vol. 81, no. 18, pp. 25613–25655, 2022. [Google Scholar] [PubMed]
52. D. K. Salluri, V. Sistla and V. K. K. Kolli, “HRUNET: Hybrid residual U-net for automatic severity prediction of diabetic retinopathy,” Computer Methods in Biomechanics and Biomedical Engineering: Imaging & Visualization, vol. 1, no. 1, pp. 1–12, 2022. [Google Scholar]
53. S. Qummar, F. G. Khan, S. Shah, A. Khan, S. Shamshirband et al., “A deep learning ensemble approach for diabetic retinopathy detection,” IEEE Access, vol. 7, pp. 150530–150539, 2019. [Google Scholar]
54. T. Araújo, G. Aresta, L. Mendonca, S. Penas, C. Maia et al., “DR GRADUATE: Uncertainty-aware deep learning-based diabetic retinopathy grading in eye fundus images,” Medical Image Analysis, vol. 63, no. July, pp. 1–17, 2020. [Google Scholar]
55. Q. H. Nguyen, R. Muthuraman, L. Singh, G. Sen, A. C. Tran et al., “Diabetic retinopathy detection using deep learning,” in ACM Int. Conf. Proceeding Ser., Haiphong City, Viet Nam, pp. 103–107, 2020. [Google Scholar]
56. Z. Gao, J. Li, J. Guo, Y. Chen, Z. Yi et al., “Diagnosis of diabetic retinopathy using deep neural networks,” IEEE Access, vol. 7, no. 1, pp. 3360–3370, 2019. [Google Scholar]
57. S. H. Kassani, P. H. Kassani, R. Khazaeinezhad, M. J. Wesolowski, K. A. Schneider et al., “Diabetic retinopathy classification using a modified xception architecture,” in 2019 IEEE 19th Int. Symp. Signal Process. Inf. Technol. ISSPIT 2019, Ajman, United Arab Emirates, pp. 0–5, 2019. [Google Scholar]
58. O. Dekhil, A. Naglah, M. Shaban, M. Ghazal, F. Taher et al., “Deep learning based method for computer aided diagnosis of diabetic retinopathy,” in IST 2019-IEEE Int. Conf. Imaging Syst. Tech. Proc., Abu Dhabi, UAE, pp. 19–22, 2019. [Google Scholar]
59. M. H. Saeed, M. Ahsan, M. Saeed, A. U. Rahman, M. A. Mohammed et al., “An algebraic modeling for tuberculosis disease prognosis and proposed potential treatment methods using fuzzy hypersoft mappings,” Biomedical Signal Processing and Control, vol. 80, no. 1, pp. 1–18, 2023. [Google Scholar]
Cite This Article
 Copyright © 2023 The Author(s). Published by Tech Science Press.
This work is licensed under a Creative Commons Attribution 4.0 International License , which permits unrestricted use, distribution, and reproduction in any medium, provided the original work is properly cited.
 Downloads
 Citation Tools