
 Submit a Paper
 Propose a Special lssue
 Open Access
ARTICLE

SCADA Data-Based Support Vector Machine for False Alarm Identification for Wind Turbine Management
Ingenium Research Group, Universidad Castilla-La Mancha, Ciudad Real, 13071, Spain
* Corresponding Author: Fausto Pedro García Márquez. Email:
Intelligent Automation & Soft Computing 2023, 37(3), 2595-2608. https://doi.org/10.32604/iasc.2023.037277
Received 28 October 2022; Accepted 24 February 2023; Issue published 11 September 2023
 View Full Text
 Download PDF
Abstract
Maintenance operations have a critical influence on power generation by wind turbines (WT). Advanced algorithms must analyze large volume of data from condition monitoring systems (CMS) to determine the actual working conditions and avoid false alarms. This paper proposes different support vector machine (SVM) algorithms for the prediction and detection of false alarms. K-Fold cross-validation (CV) is applied to evaluate the classification reliability of these algorithms. Supervisory Control and Data Acquisition (SCADA) data from an operating WT are applied to test the proposed approach. The results from the quadratic SVM showed an accuracy rate of 98.6%. Misclassifications from the confusion matrix, alarm log and maintenance records are analyzed to obtain quantitative information and determine if it is a false alarm. The classifier reduces the number of false alarms called misclassifications by 25%. These results demonstrate that the proposed approach presents high reliability and accuracy in false alarm identification.Keywords
The current energy crisis, together with the high demand, requires new forms of energy generation, greater security of supply, improvements in efficiency and sustainable prices for this generation. The achievement of climate change agreement goals depends strongly on renewable energies, being the essential solution for reducing CO2 emissions [1]. The advantages of renewable energy include cost-effectiveness and environmental responsibility. Renewable generation should be more than 80% of the total electricity generation by 2050, and solar photovoltaic (PV) and wind power energies will contribute to two-thirds of this growth. In particular, wind energy is expected to play a critical role in the renewable energy transition due to technological advances and governmental incentives. Wind power generation is increasing gradually, and the tendency is projected to continue in the future. The installed wind power capacity currently stands at 837 GW in the world, including 94 GW of new wind energy capacity installed in 2021, achieving an annual growth of 12%. It is expected to have more than 550 GW of new capacity in the next five years [2].
The wind energy industry has a relevant challenge to reach competitiveness through systemic technological innovations. WT rotating components operate under heavy dynamic loads, generating a high probability of failure. The costs associated with the operation and maintenance (O&M) of WTs are estimated to be between 5% and 30% of the overall costs of wind energy production, and proper maintenance management operations are necessary to minimize potential critical failures. Maintenance operations cause elevated downtimes, although proper maintenance activities with periodical inspections allow failure detection and replacement of damaged components. Several types of CMS are applied for WT maintenance, providing information about the condition of the WT to perform remote supervisory and diagnosis to reduce maintenance operations. Some of the most relevant techniques are based on vibration analysis, acoustic monitoring, thermography and analysis of electric parameters, among others. The SCADA system also collects data from the WT related to critical components, e.g., rotors, generators and pitch mechanisms, among others, and storages it for further data processing. The alarm can help operators determine the actual condition of WTs [3,4]. However, the alarm dataset often has short or periodic activations, and it is necessary to apply techniques for filtering and interpretation of these alarms [5]. A false alarm is triggered when the SCADA system reports a fault, but in some cases, there is not a failure, i.e., the actual state of the WT is healthy, causing unnecessary maintenance tasks and increasing O&M costs [6]. False alarm detection requires robust algorithms to obtain reliable data from the SCADA dataset [7,8]. The selection of appropriate signal processing and data analysis techniques is essential for a correct interpretation of WT data.
Machine learning (ML) algorithms have been demonstrated to be one of the most relevant techniques for false alarm identification [9]. ML techniques recognize patterns in a dataset by learning from the data. There are two types: supervised and unsupervised. Supervised learning uses different techniques to predict the outputs using input data initially labeled through the application of classifications and forecasting models [10]. Although artificial neural networks are usually applied for data analysis, SVM can be applied in fault detection for WT maintenance management. SVM presents due to easy implementation, high accuracy, high generalization capability even with small datasets, reduction of overfitting with excellent parameter tuning and the application of nonlinear Kernels, allowing the classification of nonlinear data and high strength for two-group classification [11,12]. SVM is one of the most applied supervised learning for classification and regression problems, where the increasing evolution of publications on the SVM algorithm is compared to other relevant ML algorithms, mainly: K-nearest neighbor (KNN) and Decision Tree (DT), see Fig. 1.
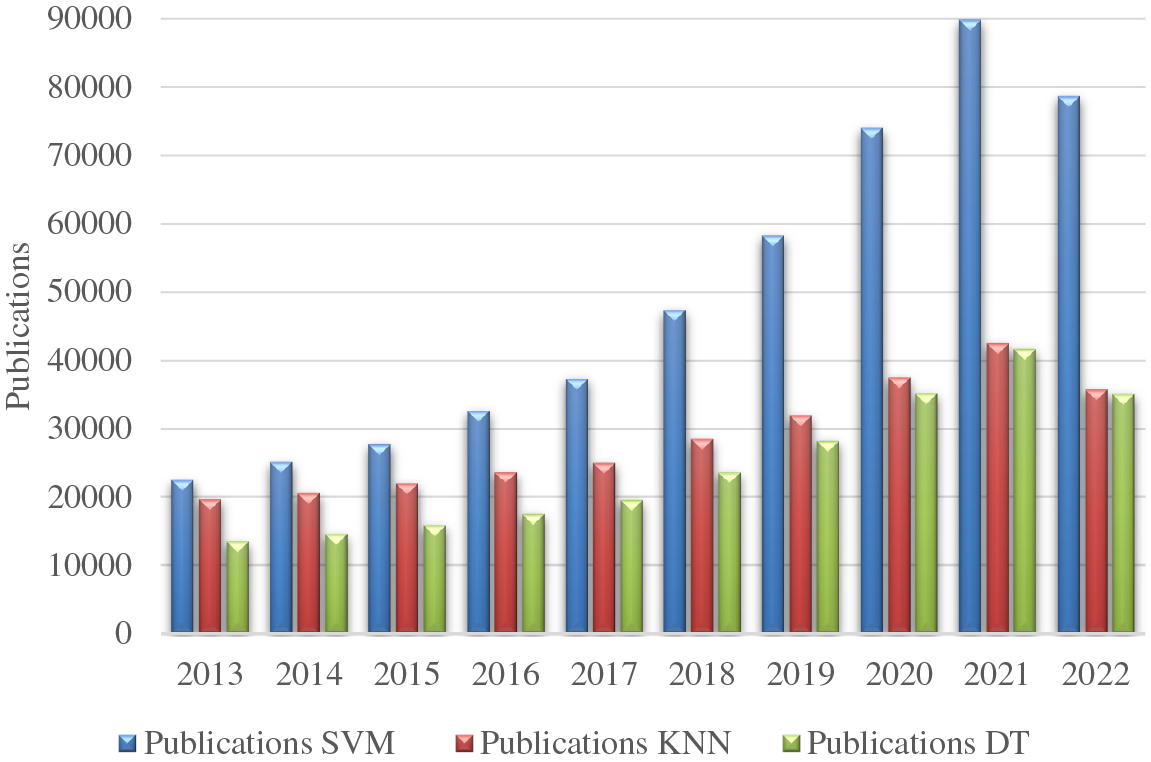
Figure 1: Evolution of SVM, KNN and DT publications in recent years, adapted from [13]
Several authors are applying SVM for fault detection and forecasting. Arcos Jimenez et al. [14] applied ultrasonic CMS to identify blade delamination in WTs. Different ML techniques analyzed the ultrasonic signals acquired during the experimental procedure and Quadratic Discriminant Analysis and Quadratic SVM achieved the best results. SVM was also employed to identify and diagnose WT faults [15]. A novel approach for WT blade ice detection was presented in [16], where different variations of SVM were applied for fault identification, achieving accuracies around 100%. A novel approach presented by Hübner et al. [17] used SVM to identify mass imbalance in WT rotors with more than 84% accuracy. Mishra et al. [18] trained different SVM models for bearing condition monitoring, and the model achieved 99% of accuracy without analyzing false alarms.
Despite the advantages and great potential of SVM, it is not widely implemented in the determination of false alarms, and it is estimated to be applied in only 6.25% of the cases with ML techniques [19]. Leahy et al. [20] applied different SVM with acceptable results although several false points are undetected, being necessary more filtering and data processing phases. The application of SVM requires new filtering techniques to ensure high reliability in processing large datasets. Dhiman et al. [21] used adaptive threshold for false alarm detection and twin SVM with a 10-fold CV in a gearbox case study. The overall accuracy was 95%, and the authors aimed to determine false alarms without obtaining a conclusive result. Wu et al. [22] combined principal component analysis and SVM to identify normal and abnormal conditions, achieving 76%−98% accuracy. The authors compared SVM with other techniques and demonstrated that SVM is one of the most significant techniques for this type of classification problems. The combination of SVM with statistical and filtering process allows higher accuracies for false alarm identification.
This analysis of the current state of the art shows the necessity of new methodologies combined with SVM to apply the capabilities provided by SVM that are currently implemented for fault detection in WT but not for false alarms from the SCADA system.
The main contributions of this paper are summarized as follows:
• The application of a novel data-based approach to detect false alarms is a novelty in the current state of the art. Several studies are focused on analyzing failures but false alarm identification is currently a challenge studied in few references and focused on the application of artificial neural networks [23]. The use of SVM classifiers with different kernels to determine if an alarm is false has not been found in the literature, and the authors usually applied the same SVM classifier. The method developed in this work can be used to increase the reliability of WTs with historical SCADA data.
• The analysis of misclassifications has been performed by providing values for the different types of alarms. The misclassification points are also examined simultaneously with the alarm log and the maintenance log to provide important information to determine the causes of false alarms.
This paper is organized as follows: Section 2 describes the methodology applied, analyzing the SVM algorithm and the CV process, the different SVMs applied, and the validation method used, as well as the different metrics classifiers; Section 3 shows the results obtained with different variations of SVM using SCADA data from an operating WT; Section 4 provides the main conclusions and discussions of this study.
This paper presents an approach to detect false alarm activations. The main phases of the methodology include filter processes, SVM classification algorithms, validation techniques and the use of the alarm log information provided by the operators to analyze misclassifications. The scheme of the methodology is shown in Fig. 2.
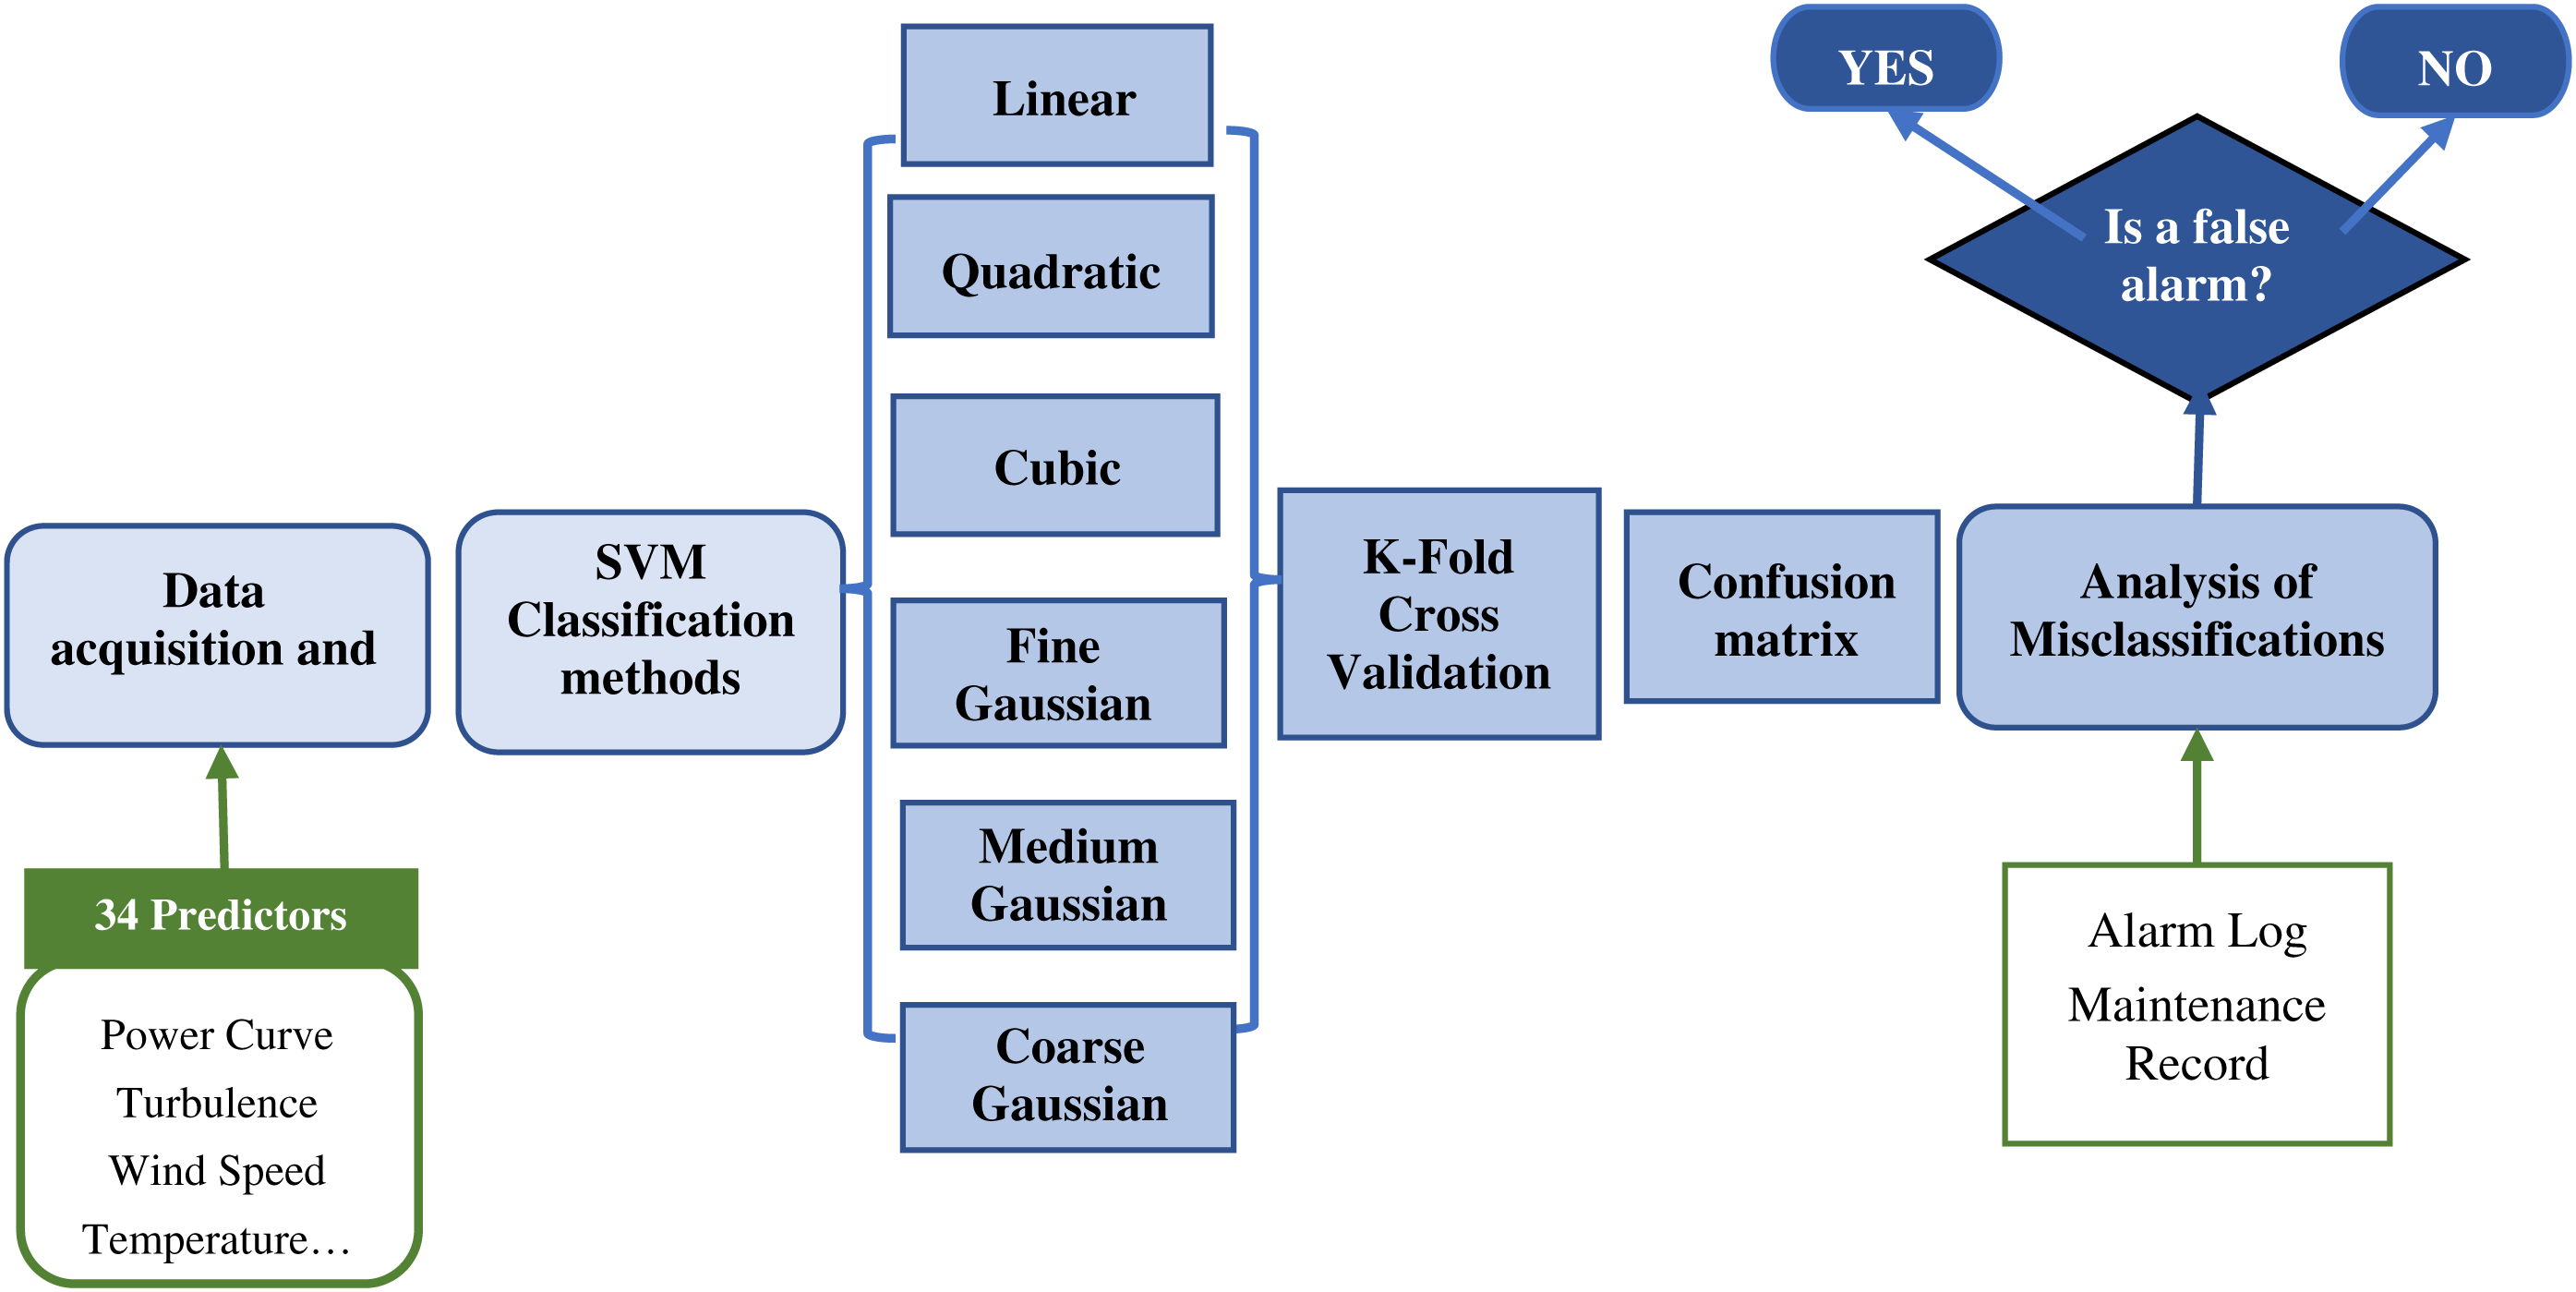
Figure 2: Flowchart of the methodology
The initial data acquisition and filtering processes provide several signals and alarms. The approach presented in this work selects 34 variables to be applied as predictors to classify the alarm according to the alarm log. The SCADA system provides the alarm log that defines the typology and description of the alarm and the activation and deactivation periods, among others. The data determine critical alarms and obtain average alarm periods, average periods without alarms and related signals to each alarm. This phase performs an initial filtering phase where the empty values, or wrong measurements caused by issues in the SCADA system, are deleted and not considered for the study. This phase also includes a time synchronization of the SCADA variables and the alarm log to simplify data analysis. The second phase applies different SVM classifiers to compare the results and enhance the reliability of the analysis. For this particular case study, linear, quadratic, cubic, fine Gaussian, medium Gaussian and coarse Gaussian are selected for being some of the most applied SVM kernels with high accuracy. The objective of providing different SVM algorithms is to increase the robustness of the methodology, selecting the most suitable technique in all the cases. The results are validated by k-fold CV because this method is one of the most relevant techniques for estimating prediction errors. Several authors have widely implemented 5-fold or 10-fold CVs and this particular case study applied a 5-fold CV for the validation. The results from the validations of all the techniques are compared in terms of accuracy and computational costs to determine the most suitable technique for this case study. The approach presented in this paper determines that only the misclassifications determined by the best technique are analyzed in further phases. This methodology ensures high suitability, avoiding wrong misclassification points that may reduce the reliability of the results. The qualitative information of the alarm and maintenance log is applied to confirm if maintenance tasks, or external factors, may have caused these alarms, and the approach identifies false alarms.
2.1 SVM Classification Algorithm
SVM is an algorithm for complex data analysis and fault detection [24,25]. SVM classifier aims to identify boundaries between several data classes with the most significant possible margin of separation with the construction of an optimal separation between hyperplanes [26], see Fig. 3.
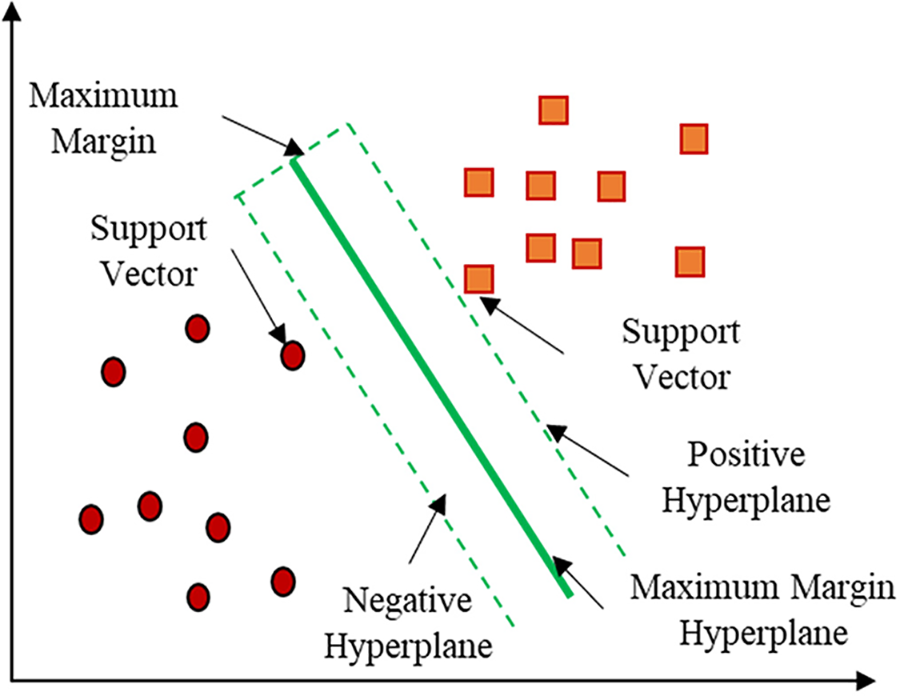
Figure 3: SVM bases
The input training data is defined by
where
being
The kernel function
It is essential to select a proper kernel function to optimize the solution because the matching kernel functional form must be known to solve the dual problem. The main characteristics of the dataset determines the type of kernel function to be implemented. Different kernel functions have been selected in this research, mainly linear, polynomial or Gaussian, given by Eqs. (4)–(6), respectively. The standard deviation parameter is denoted by δ, while the parameter P specifies the polynomial degree.
Gaussian kernel cases are classified into the following categories:
• Fine Gaussian: Class distinctions are made to an acceptable degree. N is the number of predictors, and the kernel scale is
• Medium Gaussian: It is less distinct than the previous case; hence its kernel scale is
• Coarse Gaussian: The class distinctions are less accurate in this scenario, and the kernel scale is
The purpose of validation is to evaluate the performance of the model. The K-fold CV method divides the data set into k subsets or folds. The results validation after each iteration and the frequent use of randomized subsamples for training and validation are the main advantages [27]. Hierarchical sampling is applied to preserve the consistency of the data distribution to acquire each subset [28]. The partitioned folds are trained and tested in K iterations, leaving one fold per iteration for testing and training the model on the remaining K-1 folds, see Fig. 4. The accuracy achieved in each iteration is averaged to determine the model accuracy [29].
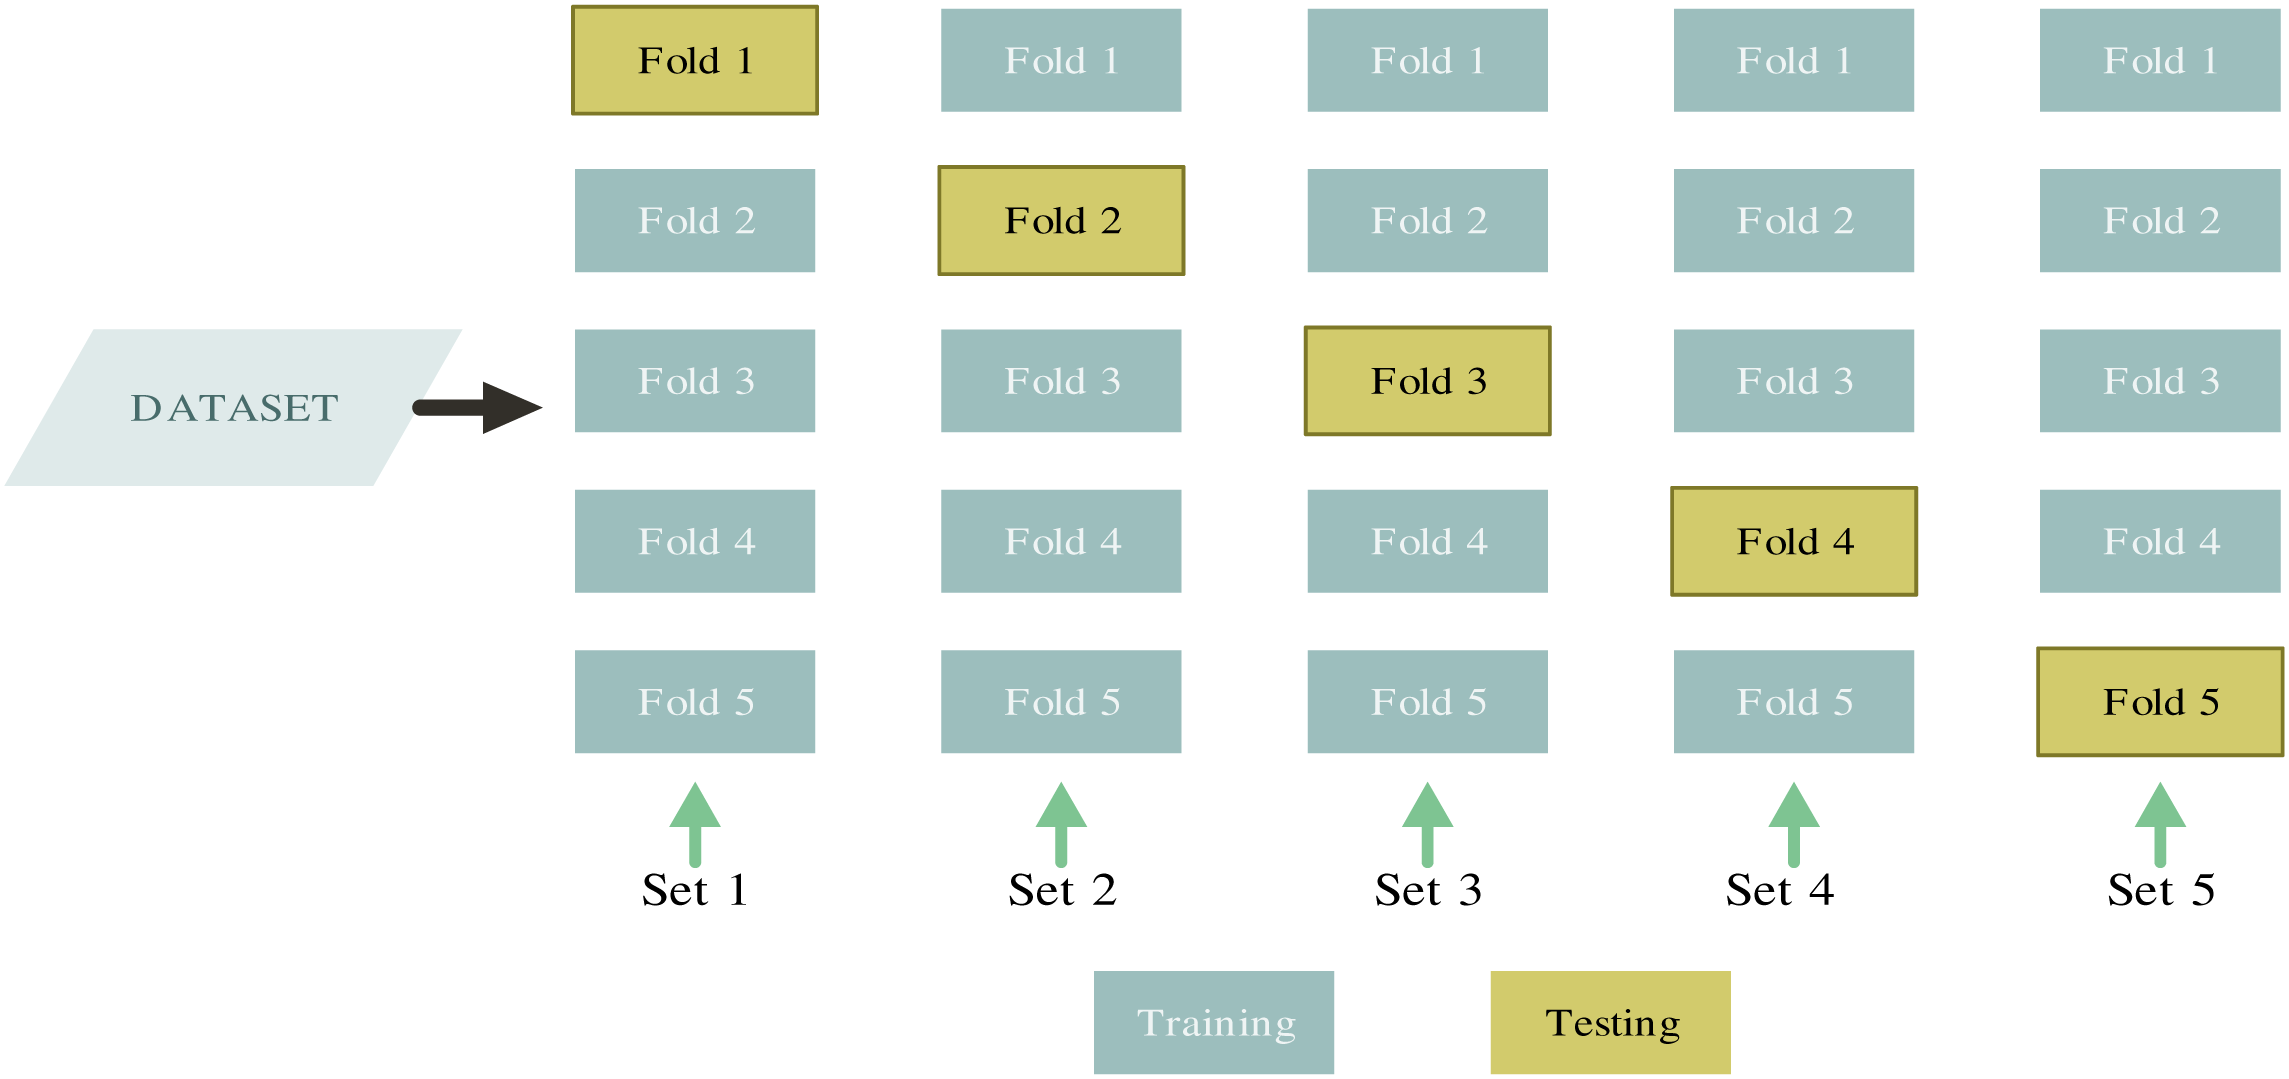
Figure 4: CV method based on [30]
The confusion matrix is used for the statistical classification of processes to determine the effectiveness of the categorization models [31]. The confusion matrix is divided into rows and columns to show the results of the classifier. The columns correspond to the classes predicted by the model, and the rows represent the actual classes. Correctly classified cases are shown on the diagonal, while the remaining cells are misclassifications points. The confusion matrix presents the following states for this case study:
• True Positive (TP): the alarm has been accurately classified.
• False Positive (FP): indicates the number of cases of alarm activations when the WT status is healthy and is considered as a misclassification.
• False Negative (FN): it also designates a misclassification because it is determined that there is no alarm when the actual state of the system has an alarm activation.
• True Negative (TN): the healthy state of the WT has been correctly detected and no alarms were activated.
Several indicators are widely applied to quantify the effectiveness of classification methods. Accuracy, sensitivity, true positive rate (TPR) and false negative rate (FNR) are the performance metrics used in this study. The accuracy is the ratio of the number of successfully classified samples to the total number of cases.
TPR, also known as sensitivity, is the proportion of successfully classified observations in each true class [32].
FNR is the percentage of incorrectly classified negative observations in each negative class, see Eq. (9).
This approach is tested with SCADA data from a working WT that acquired data every 10 min, and this study is composed of more than 22000 observations. Classification techniques aim to correlate the response variable and independent variables or predictors. For this case study, 34 SCADA signals are selected as predictor variables, and the alarm log is applied as response variable. The alarm log of the wind farm classifies all the alarms into 17 groups according to a component. The number of activations is acquired from the SCADA system, and determines that alarms related to states specification (401) and ambient conditions alarms (185) are the most frequent alarms, as it is shown in Fig. 5. The deactivated alarm associated with class 0, with 21795 activations, is also considered for this study due to the high number of registers.
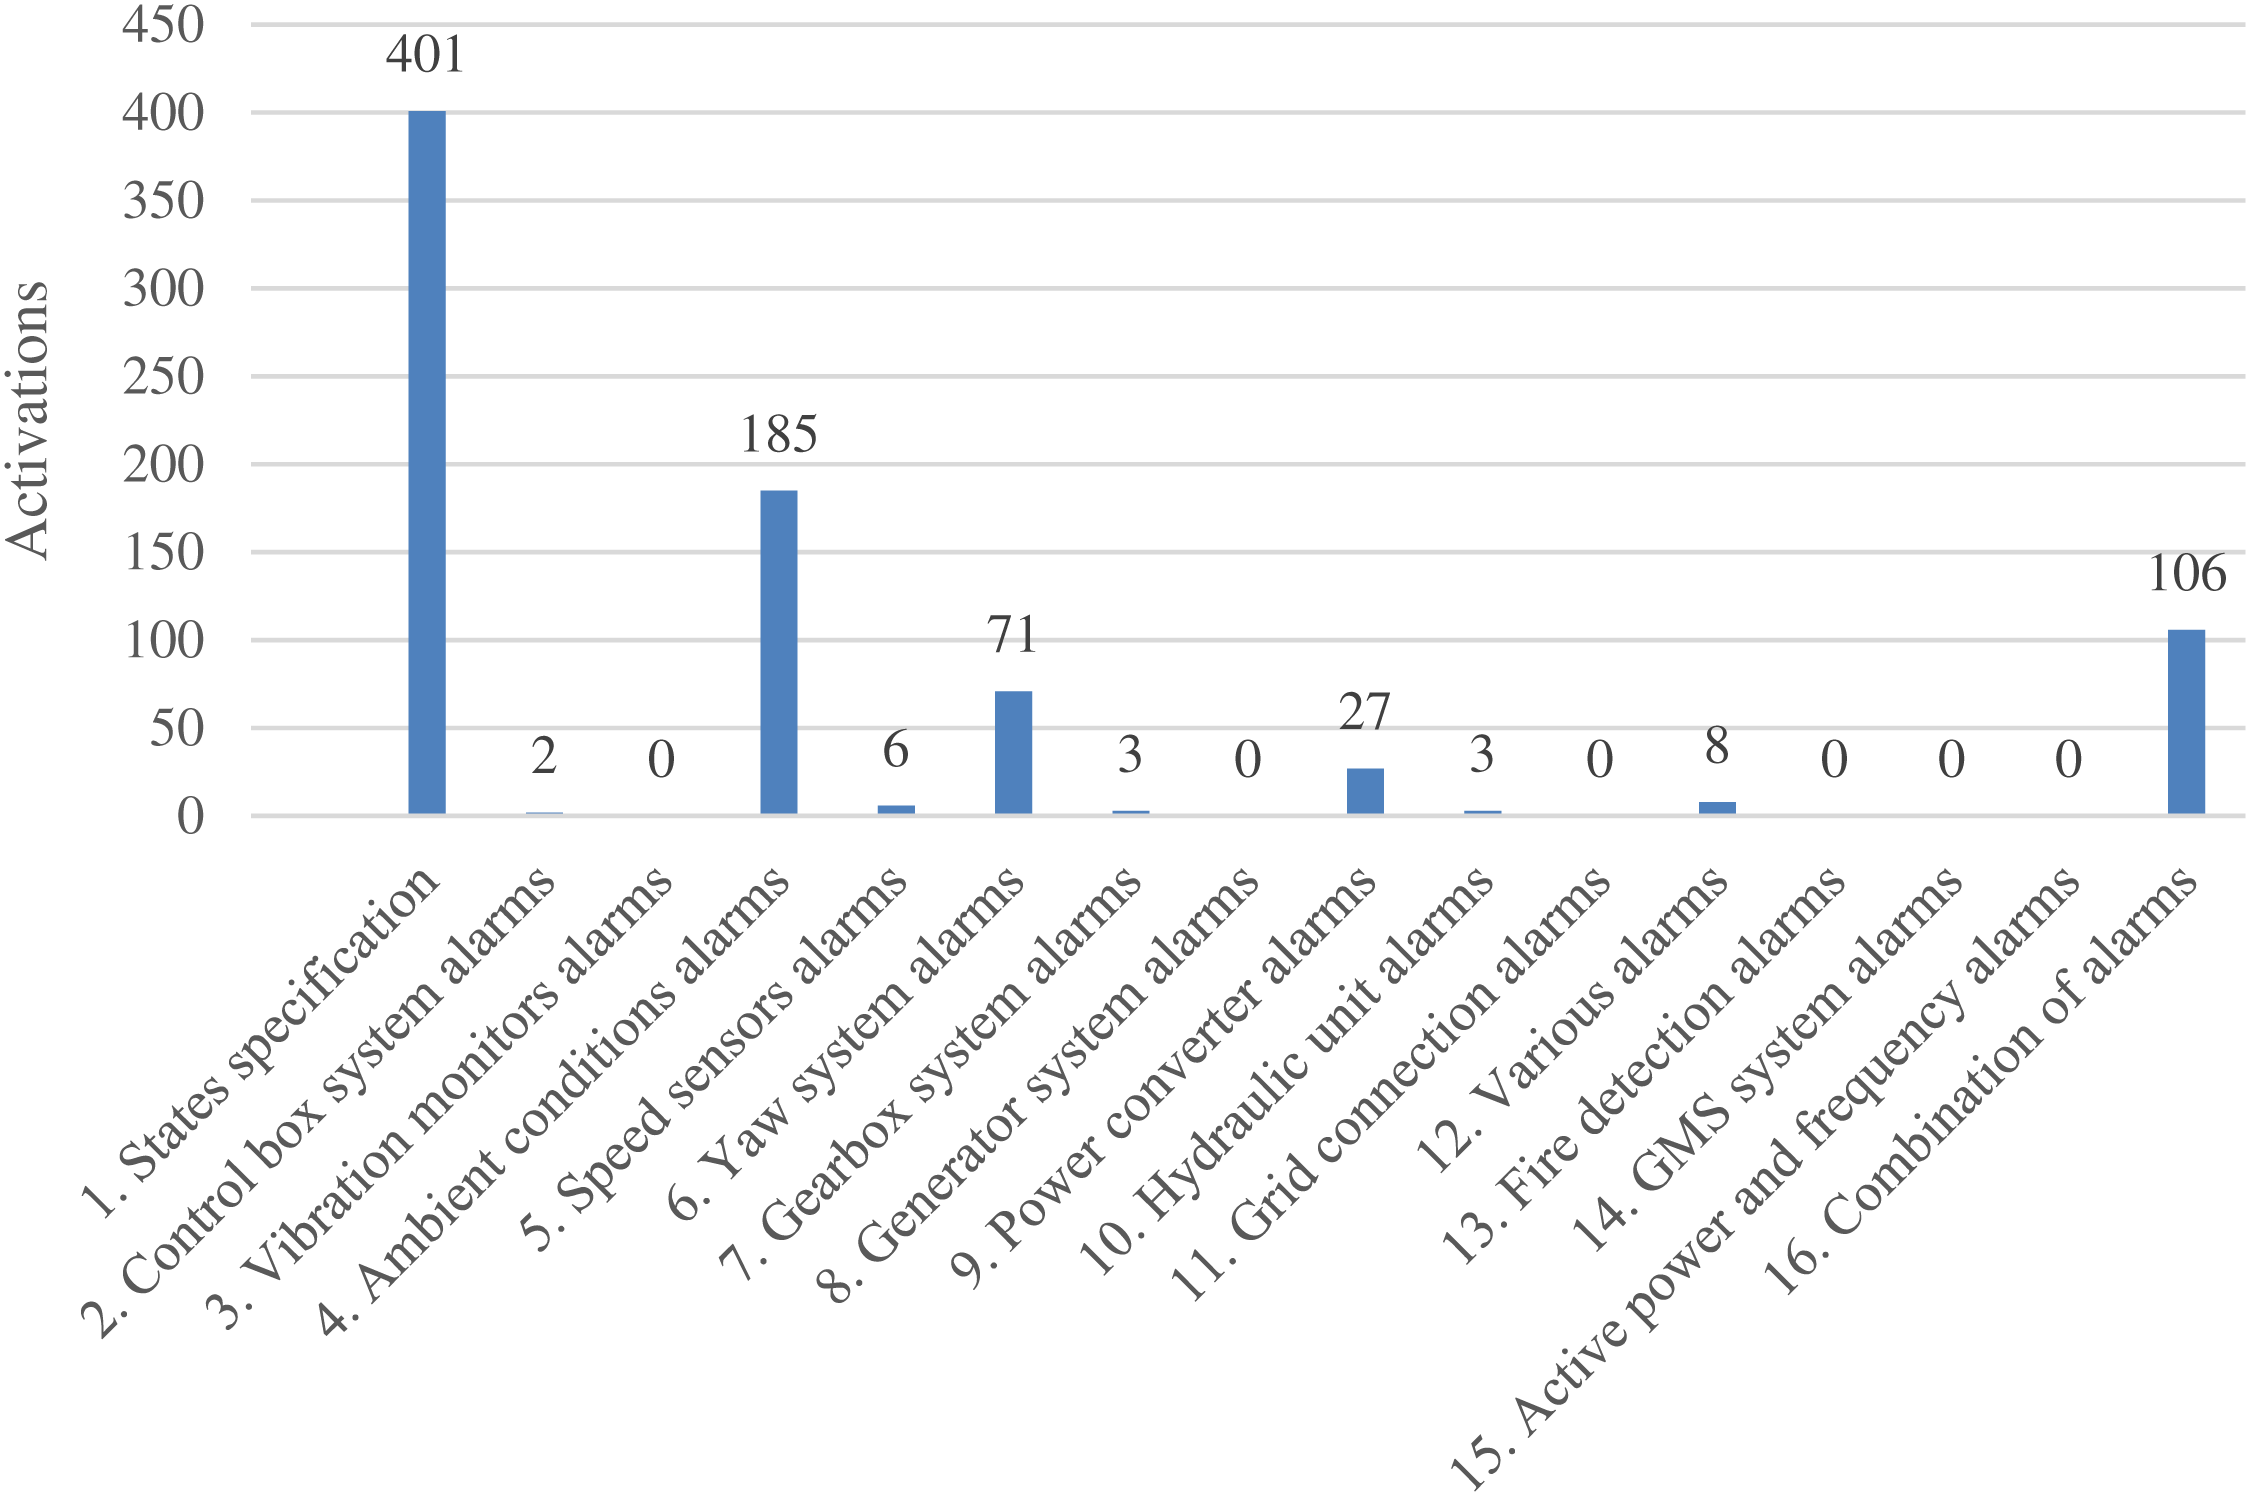
Figure 5: Different types of alarms and corresponding activations
This study determines that the number of K-fold has not a relevant influence on the accuracy of the analysis. However, the periods of the calculation periods depend on the number of K, having higher computational periods for higher K. The best results in accuracy and computational costs are obtained using the 5-Fold CV. Fig. 6a shows the 5-fold CV accuracy and training time, and Fig. 6b the misclassification for the different SVM classification models. The coarse Gaussian presented the worst accuracy results with higher misclassification points and training periods, and this technique is not considered for further steps. Cubic and quadratic SVM showed similar results, but the quadratic SVM classifier provided the best accuracy with the lowest training time and the number of misclassifications.
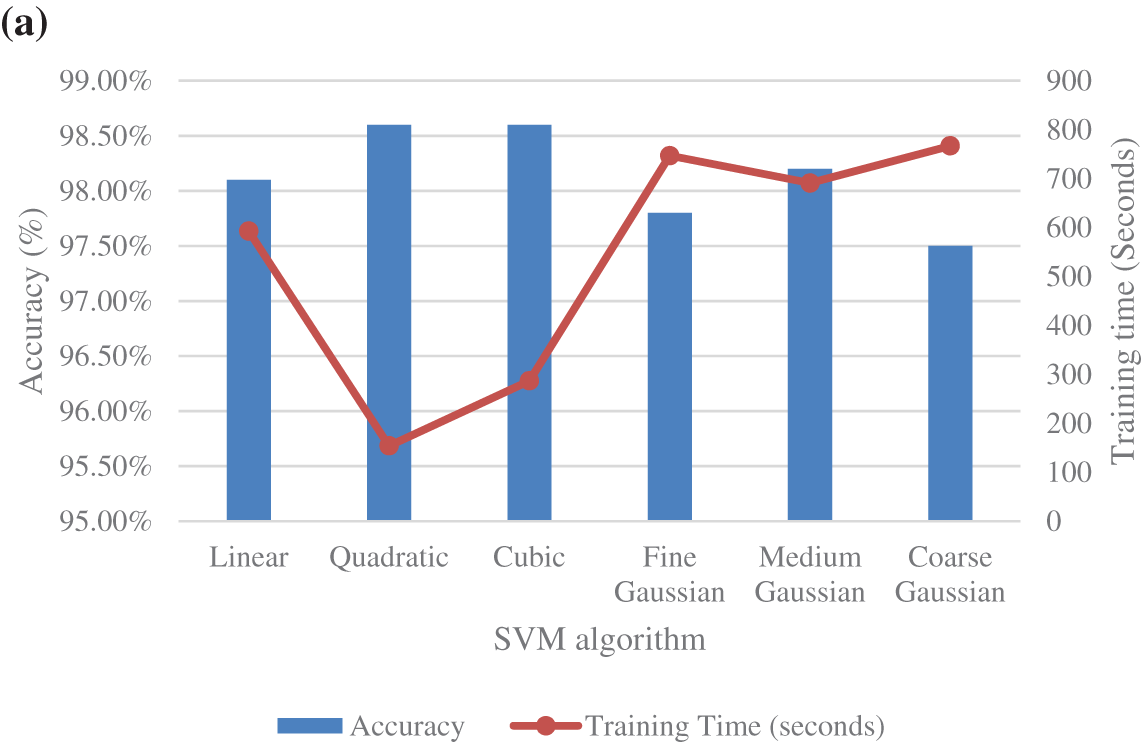
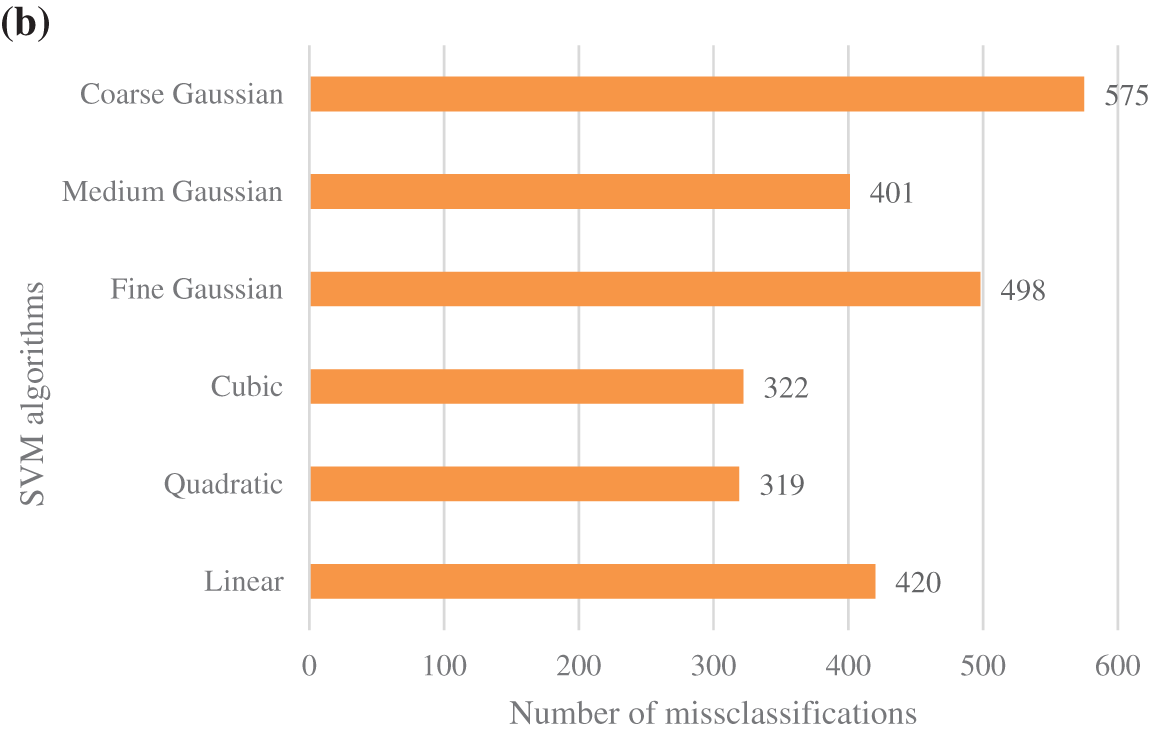
Figure 6: Performance of different SVM classifiers: (a) accuracy and training time; (b) misclassifications
The receiver operating characteristic (ROC) curve is a graph that demonstrates the performance of a classifier and displays the ratio of the TP rate and FP rate, known as the false positive ratio. The area under the curve (AUC) shows the accuracy of the classifier [33]. The performance of the classifier is better when the area AUC increases [34], being an effective model when AUC is close to 1. The period without alarm activations is classified as the positive class, and the interval where an alarm is triggered is in the negative class. SVM quadratic model can accurately classify 100% of the cases to the positive class when no alarm is triggered. On the other hand, this classifier can only classify 65% of the negative classes, see Fig. 7.
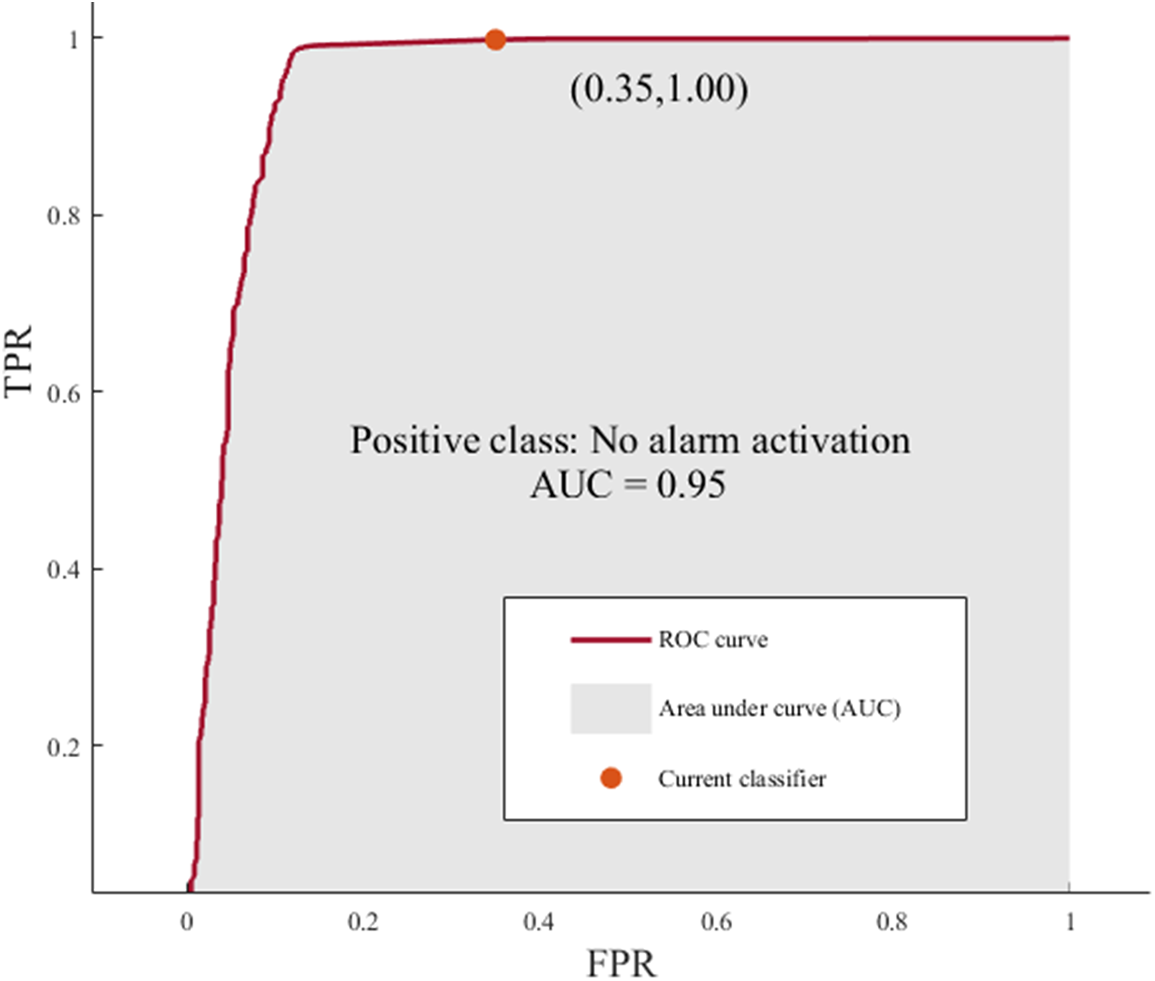
Figure 7: ROC curve for quadratic SVM model
Fig. 8 shows the performance of the classifier for each alarm type and identifies the types of alarms where the classifier has performed poorly: the diagonal elements show the cases where the predicted class and true class are the same; The blue cells show the percentage of correctly classified cases (TPR); The orange cells are the proportion of observations incorrectly classified by true class (FNR). In this case, the classifier obtains the best results for the types of alarms with more activations, representing 99% of the sample. There are several types of alarms: alarm deactivated, states specification, ambient conditions alarms and combination of alarms. Some alarm types are difficult to classify accurately, caused by the small number of cases shown in the data sample. However, this does not influence the overall accuracy of the classifier, which is 98.6%.
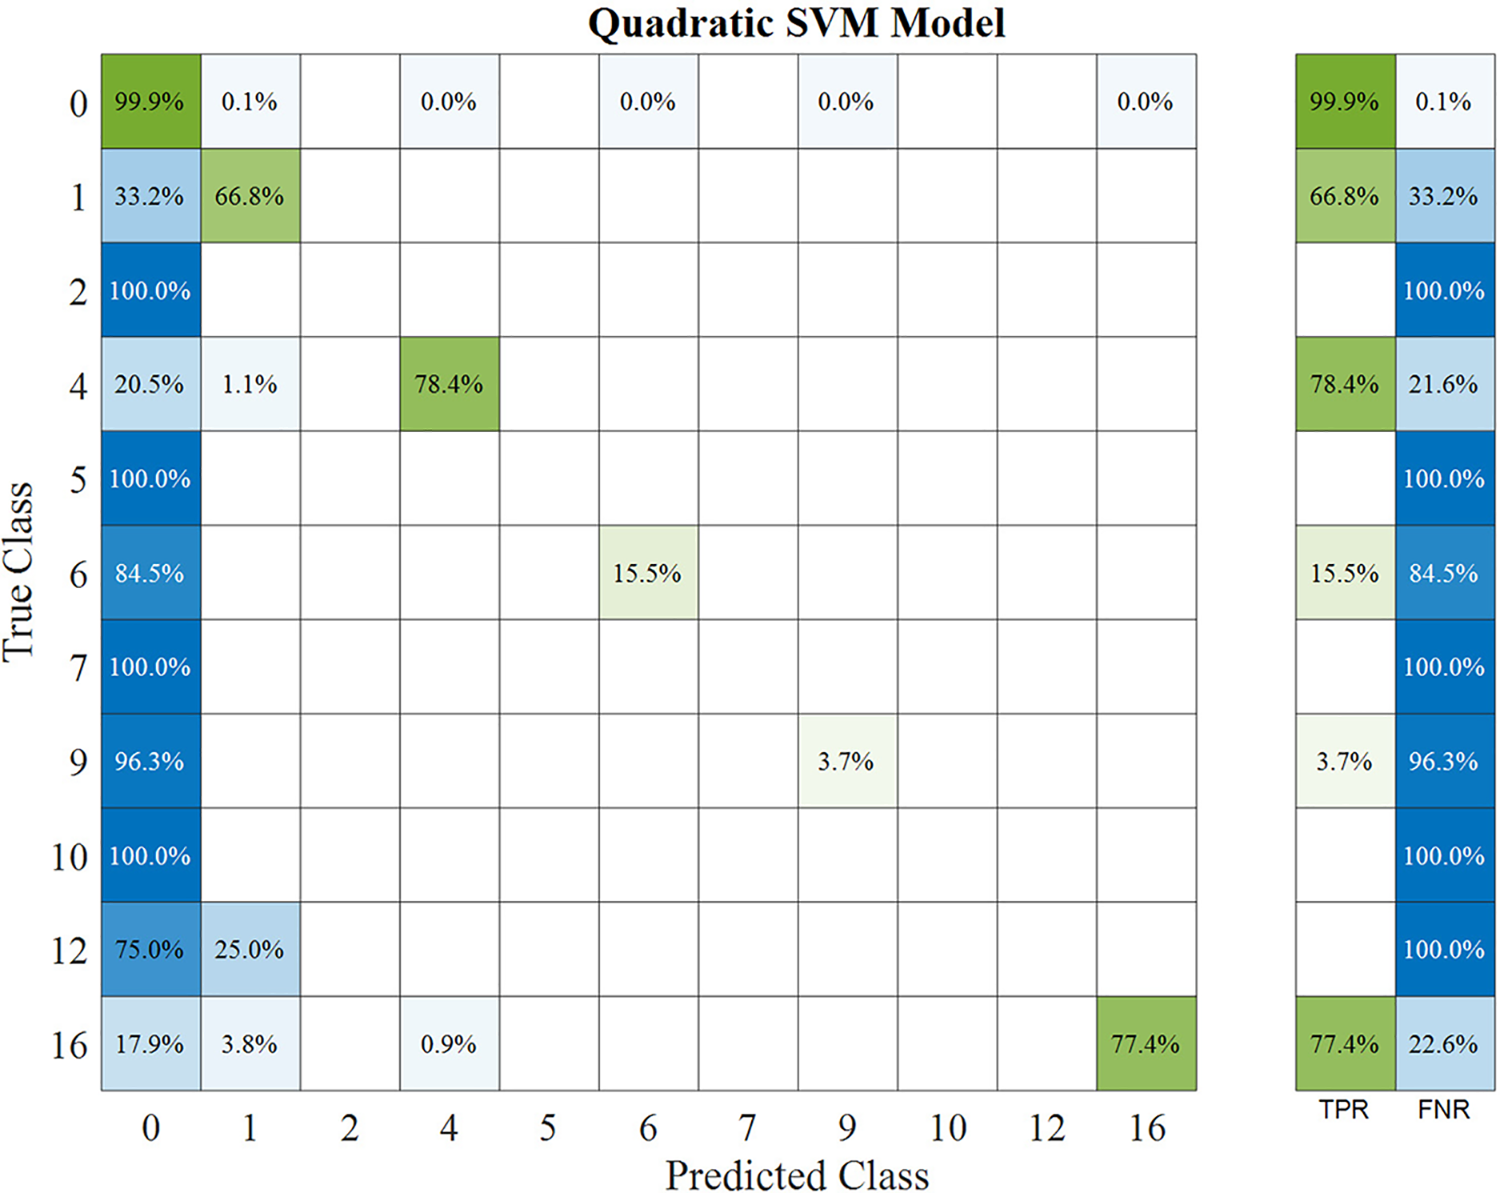
Figure 8: TPR and FNR values for each alarm type
Table 1 shows the number of cases of each type of alarm in the study sample.

The misclassification points are not correctly predicted by the SVM model, being candidates to be considered false alarms. Table 2 shows the misclassifications quantified by the algorithm for each type of alarm. The causes of the misclassifications are examined using the maintenance and the alarm log as decision variables for false alarm detection.

The type of alarm, defined as “no alarm activation” (0), presented 25 misclassification points considered false negatives by the SVM. The alarms about states specifications presented 128 misclassification points, with 29 cases considered as false alarms. This type of alarm includes different WT damage states, and the high number of misclassifications is considered normal. Once the alarm log is analyzed, it is demonstrated that the time of the alarm activations was about seconds, and these alarms were not showing any WT failure. The “ambient condition” alarm (4) showed 10 cases of turbulence alarm level. The classifier cannot recognize it, and 9 cases are considered false alarms because they occurred before and/or after the alarm predictions. The “yaw system” alarm (6) presented 60 misclassification points, and 17 were considered false alarms because of the time of the alarm activation was seconds. The “power converter” alarm presented eight possible false alarms of 27 cases because the low time of the alarm activations. The “combination of alarms” (16) presented 17 misclassification cases with desynchronization between the start or the end of the alarm times about to the periods predicted.
The total number of false alarms detected was 80 cases, i.e., 25.07% of false alarms are detected with the proposed approach. These results are elevated compared to similar studies with a false alarm rate of around 10%–15% [35]. This result is significant because the approach presented in this paper increases the detection of false alarms more than 10% compared to other studies. The distribution of false alarms between the different types of alarms represents the same distribution and only the alarm about states specification presents more misclassifications. The overall accuracy is 98.6%, higher than all the research studies analyzed in the state of the art, demonstrating the strength of the methodology. It is concluded that the combination of different SVM techniques improves the alarm data analysis in specific cases where the number of misclassification points is elevated. The alarm log is essential to test and validate the results.
For future research work, it is recommended the use of more alarms to test the efficiency of the classification algorithms and their implementation in real time.
The wind energy industry is expanding, which requires new monitoring systems and predictive maintenance to reduce downtimes to reach competitiveness in the global energy market. CMS and supervisory control and data acquisition produce large amounts and a variety of data, requiring advanced algorithms. The false alarms associated with false failures increase maintenance costs and downtimes. ML algorithms are widely applied for fault detection and diagnosis due to their accuracy. This paper presents a novel approach based on a SVM with a k-fold CV for false alarm identification. The main objective of this approach is to identify false alarms by analyzing misclassifications. Several SVM algorithms are proposed to increase the accuracy and reliability of the overall method. The accuracy of the quadratic SVM model with 5-fold CV provided the best results, 98.6% accuracy, and reduced training and misclassification times. The TPR identifies the time intervals that the alarms are deactivated, being 99.9% and 81.6% for ambient conditions alarms. It is demonstrated that the number of false alarms can be decreased by 25.07% using the quadratic support vector classifier.
Funding Statement: The work reported herein was supported financially by the Ministerio de Ciencia e Innovación (Spain) and the European Regional Development Fund under the Research Grant WindSound Project (Ref.: PID2021-125278OB-I00).
Conflicts of Interest: The authors declare they have no conflicts of interest to report regarding the present study.
References
1. O. Sadeghian, A. Moradzadeh, B. Mohammadi-Ivatloo, M. Abapour, A. Anvari-Moghaddam et al., “A comprehensive review on energy saving options and saving potential in low voltage electricity distribution networks: Building and public lighting,” Sustainable Cities and Society, vol. 72, pp. 103064, 2021. [Google Scholar]
2. J. Lee and F. Zhao. Global Wind Report 2022. “Global wind energy council,” 2022. [Online]. Available: https://gwec.net/global-wind-report-2022/ [Google Scholar]
3. F. P. García Márquez, I. Segovia Ramírez, B. Mohammadi-Ivatloo and A. P. Marugán, “Reliability dynamic analysis by fault trees and binary decision diagrams,” Information, vol. 11, pp. 324, 2020. [Google Scholar]
4. Y. Qiu, Y. Feng and D. Infield, “Fault diagnosis of wind turbine with SCADA alarms based multidimensional information processing method,” Renewable Energy, vol. 145, pp. 1923–1931, 2020. [Google Scholar]
5. F. P. Garcia Marquez, I. Segovia Ramirez and A. Pliego Marugan, “Decision making using logical decision tree and binary decision diagrams: A real case study of wind turbine manufacturing,” Energies, vol. 12, pp. 1753, 2019. [Google Scholar]
6. A. M. Peco Chacón, I. Segovia Ramírez and F. P. García Márquez, “False alarms analysis of wind turbine bearing system,” Sustainability, vol. 12, pp. 7867, 2020. [Google Scholar]
7. S. Shitharth, “An enhanced optimization based algorithm for intrusion detection in SCADA network,” Computers & Security, vol. 70, pp. 16–26, 2017. [Google Scholar]
8. I. S. Ramirez, B. Mohammadi-Ivatloo and F. P. G. Márquez, “Alarms management by supervisory control and data acquisition system for wind turbines,” Eksploatacja i Niezawodnosc, vol. 23, pp. 110–116, 2021. [Google Scholar]
9. M. García, P. Fausto and P. G. Alfredo, “A comprehensive review of artificial intelligence and wind energy,” Archives of Computational Methods in Engineering, pp. 1–24, 2021. [Google Scholar]
10. A. Stetco, F. Dinmohammadi, X. Zhao, V. Robu, D. Flynn et al., “Machine learning methods for wind turbine condition monitoring: A review,” Renewable Energy, vol. 133, pp. 620–635, 2019. [Google Scholar]
11. B. Mahesh, “Machine learning algorithms-a review,” International Journal of Science and Research, vol. 9, pp. 381–386, 2020. [Google Scholar]
12. N. Laouti, N. Sheibat-Othman and S. Othman, “Support vector machines for fault detection in wind turbines,” IFAC Proceedings Volumes, vol. 44, pp. 7067–7072, 2011. [Google Scholar]
13. Dimensions. Overview in SVM Publications. Digital Science & Research Solutions Inc., 2023. [Online]. Available: https://app.dimensions.ai/analytics/publication/overview/timeline?search_mode=content&search_text=SVM&search_type=kws&search_field=text_search [Google Scholar]
14. A. Arcos Jimenez, L. Zhang, C. Q. Gomez Muñoz and F. P. Garcia Marquez, “Maintenance management based on machine learning and nonlinear features in wind turbines,” Renewable Energy, vol. 146, pp. 316–328, 2020. [Google Scholar]
15. J. Wang, Y. Liang, Y. Zheng, R. X. Gao and F. Zhang, “An integrated fault diagnosis and prognosis approach for predictive maintenance of wind turbine bearing with limited samples,” Renewable Energy, vol. 145, pp. 642–650, 2020. [Google Scholar]
16. A. A. Jiménez, F. P. G. Márquez, V. B. Moraleda and C. Q. G. Muñoz, “Linear and nonlinear features and machine learning for wind turbine blade ice detection and diagnosis,” Renewable Energy, vol. 132, pp. 1034–1048, 2019. [Google Scholar]
17. G. Hübner, H. Pinheiro, C. de Souza, C. Franchi, L. da Rosa et al., “Detection of mass imbalance in the rotor of wind turbines using support vector machine,” Renewable Energy, vol. 170, pp. 49–59, 2021. [Google Scholar]
18. R. K. Mishra, A. Choudhary, A. R. Mohanty and S. Fatima, “Multi-domain bearing fault diagnosis using support vector machine,” in 2021 IEEE 4th Int. Conf. on Computing, Power and Communication Technologies (GUCON), Kuala Lumpur, Malaysia, pp. 1–6, 2021. [Google Scholar]
19. A. M. Peco Chacón, I. Segovia Ramírez and F. P. García Márquez, “State of the art of artificial intelligence applied for false alarms in wind turbines,” Archives of Computational Methods in Engineering, pp. 1–25, 2021. [Google Scholar]
20. K. Leahy, R. L. Hu, I. C. Konstantakopoulos, C. J. Spanos, A. M. Agogino et al., “Diagnosing and predictingwind turbine faults from scada data using support vector machines,” International Journal of Prognostics and Health Management, vol. 9, pp. 1–11, 2018. [Google Scholar]
21. H. S. Dhiman, D. Deb, S. Muyeen and I. Kamwa, “Wind turbine gearbox anomaly detection based on adaptive threshold and twin support vector machines,” IEEE Transactions on Energy Conversion, vol. 36, pp. 3462–3469, 2021. [Google Scholar]
22. Y. Wu and X. Ma, “Alarms-related wind turbine fault detection based on kernel support vector machines,” The Journal of Engineering, vol. 2019, pp. 4980–4985, 2019. [Google Scholar]
23. W. C. E. Teixeira, M. Á. Sanz-Bobi and R. C. L. de Oliveira, “Applying intelligent multi-agents to reduce false alarms in wind turbine monitoring systems,” Energies, vol. 15, pp. 7317, 2022. [Google Scholar]
24. M. M. Islam and J. -M. Kim, “Reliable multiple combined fault diagnosis of bearings using heterogeneous feature models and multiclass support vector machines,” Reliability Engineering & System Safety, vol. 184, pp. 55–66, 2019. [Google Scholar]
25. I. Burman and S. Som, “Predicting students academic performance using support vector machine,” in 2019 Amity Int. Conf. on Artificial Intelligence (AICAI), New Delhi, India, pp. 756–759, 2019. [Google Scholar]
26. D. C. Toledo-Pérez, J. Rodríguez-Reséndiz, R. A. Gómez-Loenzo and J. Jauregui-Correa, “Support vector machine-based EMG signal classification techniques: A review,” Applied Sciences, vol. 9, pp. 4402, 2019. [Google Scholar]
27. C. Bergmeir and J. M. Benítez, “On the use of cross-validation for time series predictor evaluation,” Information Sciences, vol. 191, pp. 192–213, 2012. [Google Scholar]
28. G. Wang, R. Jia, J. Liu and H. Zhang, “A hybrid wind power forecasting approach based on Bayesian model averaging and ensemble learning,” Renewable Energy, vol. 145, pp. 2426–2434, 2020. [Google Scholar]
29. P. Refaeilzadeh, L. Tang and H. Liu, “Cross-validation,” Encyclopedia of Database Systems, vol. 5, pp. 532–538, 2009. [Google Scholar]
30. Q. Ren, M. Li and S. Han, “Tectonic discrimination of olivine in basalt using data mining techniques based on major elements: A comparative study from multiple perspectives,” Big Earth Data, vol. 3, pp. 8–25, 2019. [Google Scholar]
31. H. Shen, H. Jin, Á. A. Cabrera, A. Perer, H. Zhu et al., “Designing alternative representations of confusion matrices to support non-expert public understanding of algorithm performance,” in Proc. of the ACM on Human-Computer Interaction, vol. 4, pp. 1–22, 2020. [Google Scholar]
32. C. S. Hong and T. G. Oh, “TPR-TNR plot for confusion matrix,” Communications for Statistical Applications and Methods, vol. 28, pp. 161–169, 2021. [Google Scholar]
33. H. Rizwan ul, C. Li and Y. Liu, “Online dynamic security assessment of wind integrated power system using SDAE with SVM ensemble boosting learner,” International Journal of Electrical Power & Energy Systems, vol. 125, pp. 106429, 2021. [Google Scholar]
34. V. Kotu and B. Deshpande, “Model evaluation,” In: V. Kotu and B. Deshpande (Eds.Data Science, Second Edition, pp. 263–279, Burlington, Massachusetts, USA: Morgan Kaufmann, 2019. [Google Scholar]
35. C. Q. Gomez Munoz, R. de la Hermosa Gonzalez-Carrato, J. R. Trapero Arenas and F. P. Garcia Marquez, “A novel approach to fault detection and diagnosis on wind turbines,” Global Nest Journal, vol. 16, no. 6, pp. 1029–1037, 2014. [Google Scholar]
Cite This Article
 Copyright © 2023 The Author(s). Published by Tech Science Press.
This work is licensed under a Creative Commons Attribution 4.0 International License , which permits unrestricted use, distribution, and reproduction in any medium, provided the original work is properly cited.
 Downloads
 Citation Tools