
 Submit a Paper
 Propose a Special lssue
 Open Access
ARTICLE

Driving Activity Classification Using Deep Residual Networks Based on Smart Glasses Sensors
1 Department of Computer Engineering, Image Information and Intelligence Laboratory, Faculty of Engineering, Mahidol University, Nakhon Pathom, 73170, Thailand
2 Department of Computer Engineering, School of Information and Communication Technology, University of Phayao, Phayao, Thailand
3 Department of Mathematics, Faculty of Applied Science, King Mongkut’s University of Technology North Bangkok, Bangkok, 10800, Thailand
4 Intelligent and Nonlinear Dynamic Innovations Research Center, Science and Technology Research Institute, King Mongkut’s University of Technology North Bangkok, Bangkok, 10800, Thailand
* Corresponding Author: Anuchit Jitpattanakul. Email:
Intelligent Automation & Soft Computing 2023, 38(2), 139-151. https://doi.org/10.32604/iasc.2023.033940
Received 01 July 2022; Accepted 19 August 2022; Issue published 05 February 2024
 View Full Text
 Download PDF
Abstract
Accidents are still an issue in an intelligent transportation system, despite developments in self-driving technology (ITS). Drivers who engage in risky behavior account for more than half of all road accidents. As a result, reckless driving behaviour can cause congestion and delays. Computer vision and multimodal sensors have been used to study driving behaviour categorization to lessen this problem. Previous research has also collected and analyzed a wide range of data, including electroencephalography (EEG), electrooculography (EOG), and photographs of the driver’s face. On the other hand, driving a car is a complicated action that requires a wide range of body movements. In this work, we proposed a ResNet-SE model, an efficient deep learning classifier for driving activity classification based on signal data obtained in real-world traffic conditions using smart glasses. End-to-end learning can be achieved by combining residual networks and channel attention approaches into a single learning model. Sensor data from 3-point EOG electrodes, tri-axial accelerometer, and tri-axial gyroscope from the Smart Glasses dataset was utilized in this study. We performed various experiments and compared the proposed model to baseline deep learning algorithms (CNNs and LSTMs) to demonstrate its performance. According to the research results, the proposed model outperforms the previous deep learning models in this domain with an accuracy of 99.17% and an F1-score of 98.96%.Keywords
Driver attitude is one of the most important factors impacting road safety. As a result, in recent years, systems for monitoring and detecting driver behavior have become a popular research area. Systems that focus only on a driver’s conduct will not be as accurate as those that combine that behavior with additional factors (such as the vehicle’s condition) to determine the driver’s current condition [1,2]. Only a small percentage of driver behavior monitoring systems can identify more than one problematic conduct [3]. These monitoring systems have failed to effectively remember all of a driver’s inappropriate actions [4].
In recent years, wearable technology has advanced considerably. A variety of wrist-worn wearable devices can be used to monitor the participant’s biological information and motions in the healthcare industry [5]. It is expected that wearable devices will be able to monitor the user’s status and determine detailed information about the person wearing them, such as the quality of sleep or the user’s physical performance. Wearable technologies are increasingly being used in the automotive industry. Many motor businesses have developed pedestrian accident alarm systems using smartphones [6]. These systems use wireless connectivity to transmit information about a smartphone’s location and speed with the car. As a result of this technology, both the pedestrian and the driver can be alerted at any moment if there is a danger of an accident.
According to human activity recognition (HAR), driving a vehicle is a complicated action that requires the use of such a whole body [7]. Drivers’ actions and behavior concerning oncoming vehicles are critical for safe driving [8]. The elements that contribute to road safety management can be classified into environmental conditions and driver attitude. Weather and road conditions are considered as environmental influences. The second category includes the state of alertness, attention (concentration), cognitive abilities, and driving skills of the driver. Early warning systems and efficient and comprehensive driving behaviour analyses are needed [9]. Driving behavior classification solutions have been developed using an in-vehicle camera [10] and vehicle position sensors [11].
Numerous research has been conducted to present on driver activity identification, in which individuals’ bodies are monitored, and deep learning algorithms are used to categorize their behaviors [1,12]. Regarding the potential for privacy violations and deception in camera-based systems, several researchers choose to employ non-visual driving indicators and standard machine learning approaches such as k-nearest neighbors (KNN) and support vector machine (SVM) [13].
Deep learning algorithms, particularly convolutional neural networks (CNNs), have already been substantially enhanced for image implementations. There are several effective deep networks for image classification, including AlexNet [14], ResNet [15], and VGGNet [16]. However, deep learning approaches for signal processing are still in their earliest stages of development. As a result, to leverage the benefits of such CNNs for analyzing the driver’s behaviors, some studies [17] presented deep learning classifiers for learning to drive based on signal data gathered using smart glasses in real-world road traffic circumstances. To address the challenge of identifying the actions of the driver, we employ recognition based on eye movement monitoring since most human activities involve ocular action [18,19].
In this study, we proposed an efficient deep learning classification model for driving learning based on bio-signal data collected in real-world road traffic circumstances utilizing EOG and an inertial measurement unit (IMU) from smart glasses in this study. In the proposed approach, an end-to-end learning strategy is created using a residual network and channel attention methods. Inspired from the previous study [20], we developed a novel deep residual network to efficiently identify driving-related activities that utilized EOG, accelerometer and gyroscope data. This study analyzed a publicly available benchmark dataset named Smart Glasses, which included sensor data from three-point EOG electrodes, a tri-axial accelerometer, and a tri-axial gyroscope of four driving-related activities. These four driving-related classes commonly take place during a driving session [21]. We conducted numerous investigations to assess the model’s predicted performance by comparing it to benchmark deep learning algorithms. To summarize our contributions, we present the following overview:
• This work presents a deep residual model that utilizes convolutional and residual-SE block to automatically learning important spatial features for recognizing driving-related activities.
• To our knowledge, this is the first research to compare the performance of EOG, tri-axial accelerometer, and tri-axial gyroscope signals concurrently obtained from participants undertaking the same series of activities.
• An efficient deep learning network is presented to identify driving behaviors and evaluate their performance against baseline and deep residual learning approaches.
• The effect of integrating IMU and EOG signals is examined on detecting driving behaviors in detail.
The following details illustrate the structure of the paper: Section 2 discusses the relational works. Section 3 describes the technique comprised of a sensor-based HAR framework and a proposed deep learning model. Following that, Section 4 presents and compares the experiments and outcomes of the deep learning model. In Section 5, we examine the effect of EOG and IMU signals on the effectiveness of the HAR system in detail. Finally, in Section 6, we summarize our results and our strategy’s benefits and future works.
In this part, we briefly present research on sensor-based human activity recognition. The subsequent sections provide more details.
2.1 Recognition of Sensor-Based Human Activity
The ever-increasing quantity of wearable devices has also necessitated much effort in dealing with real-valued sensor output, which we regard as continuous data [22–29]. This increase is particularly true when the array of sensor modalities expands with each new generation of wearable devices. Sensors such as accelerometers, gyroscopes, and magnetometers are available in almost every gadget. Nevertheless, modern technologies include more valuable sensors, including a barometer, a heart rate monitor, EOG, electromyography (EMG), and electrodermal activity sensors (EDA). The primary advancement in recent years has been a heavy emphasis on biometric healthcare information monitoring [30–33].
2.2 Deep Learning Approaches in Driver’s Activity Recognition
Deep learning and image processing are used in [34] to classify the stress level of the drivers and in [35–37] to classify driving actions. In [38], recurrent neural networks are employed as a subset of deep learning approaches for characterizing driving behavior. Tri-axial accelerations were presented as three inputs to long short-term memory (LSTM) and gated recurrent unit (GRU) of RNNs, identifying the driving occurrence categories. The developers of study [39] used the RNN approach for anticipating driver action through sensory-fusion design. Researchers monitor the driver’s face and head position and then utilize the Fusion-RNN to merge data from inside the car (the driver’s face) with features from the outside (GPS, road camera, and vehicle dynamics). Recent research has examined the use of IMU sensors and EOG to enhance the recognition accuracy of a 1D-CNN model [17]. In [40], a hybrid deep learning model known as the 4-layer CNN-2 stacked LSTM based model was used to categorize driving behaviors with great accuracy.
This section describes the process used to develop a deep learning model and recognize driving-related actions using the built-in sensors in smart glasses. The proposed methodology for the smart glasses HAR structure is shown in Fig. 1. It comprises the following five steps: data collecting, pre-processing, training of the training model, and activity recognition. Each stage is described in the entire following.
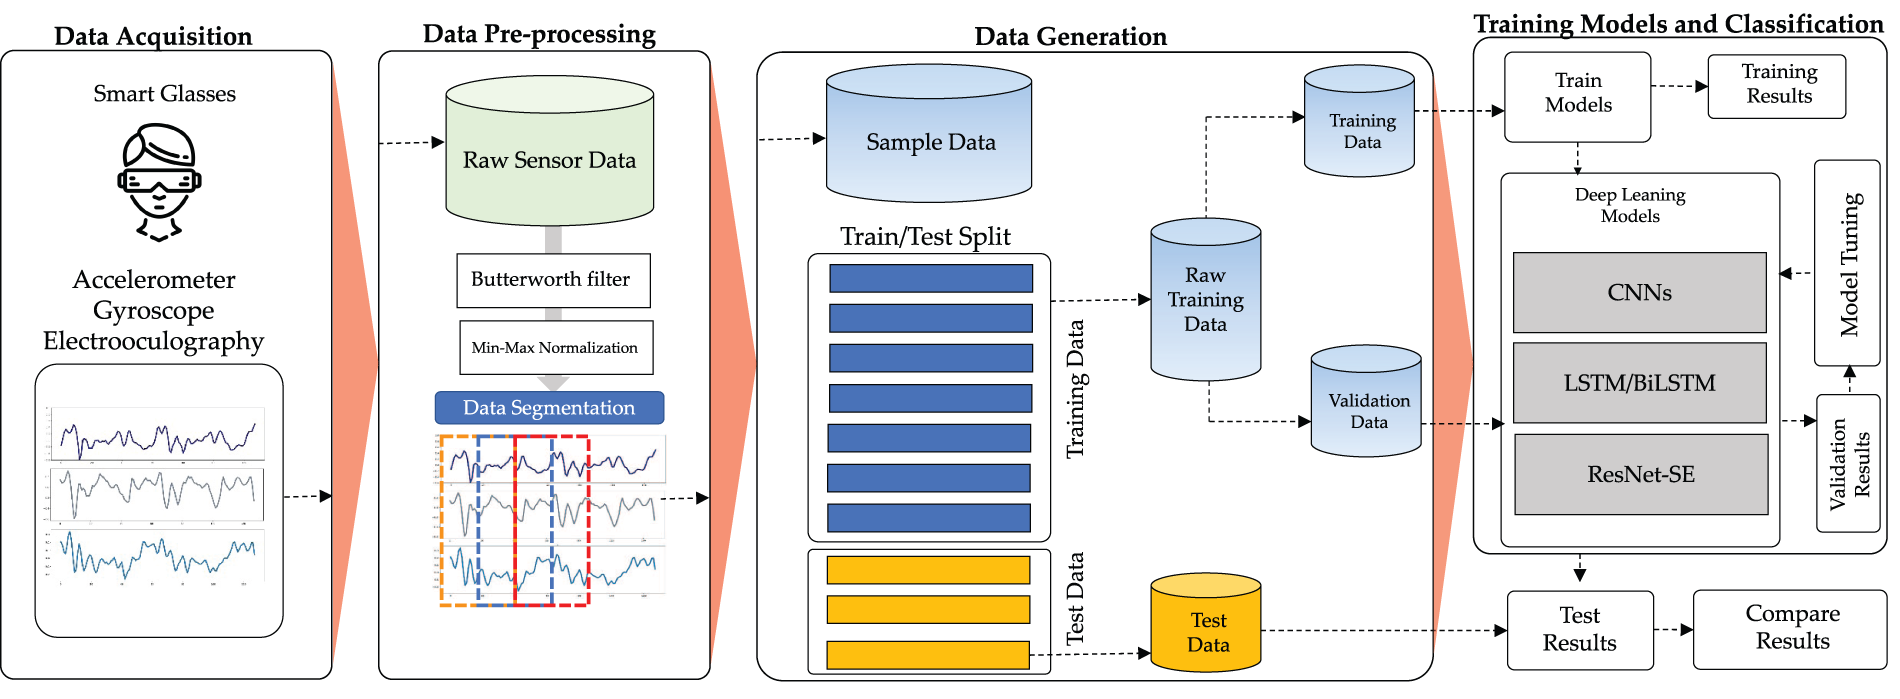
Figure 1: The proposed HAR methodology based on smart glasses sensors
For the recognition, these tasks were categorized into four driving-related activities (i.e., parking, driving through a roundabout, traffic in a city, and driving through an intersection). Some accelerometer, gyroscope, and electrooculography samples of the signal data from the Smart Glasses dataset are shown in Fig. 2.
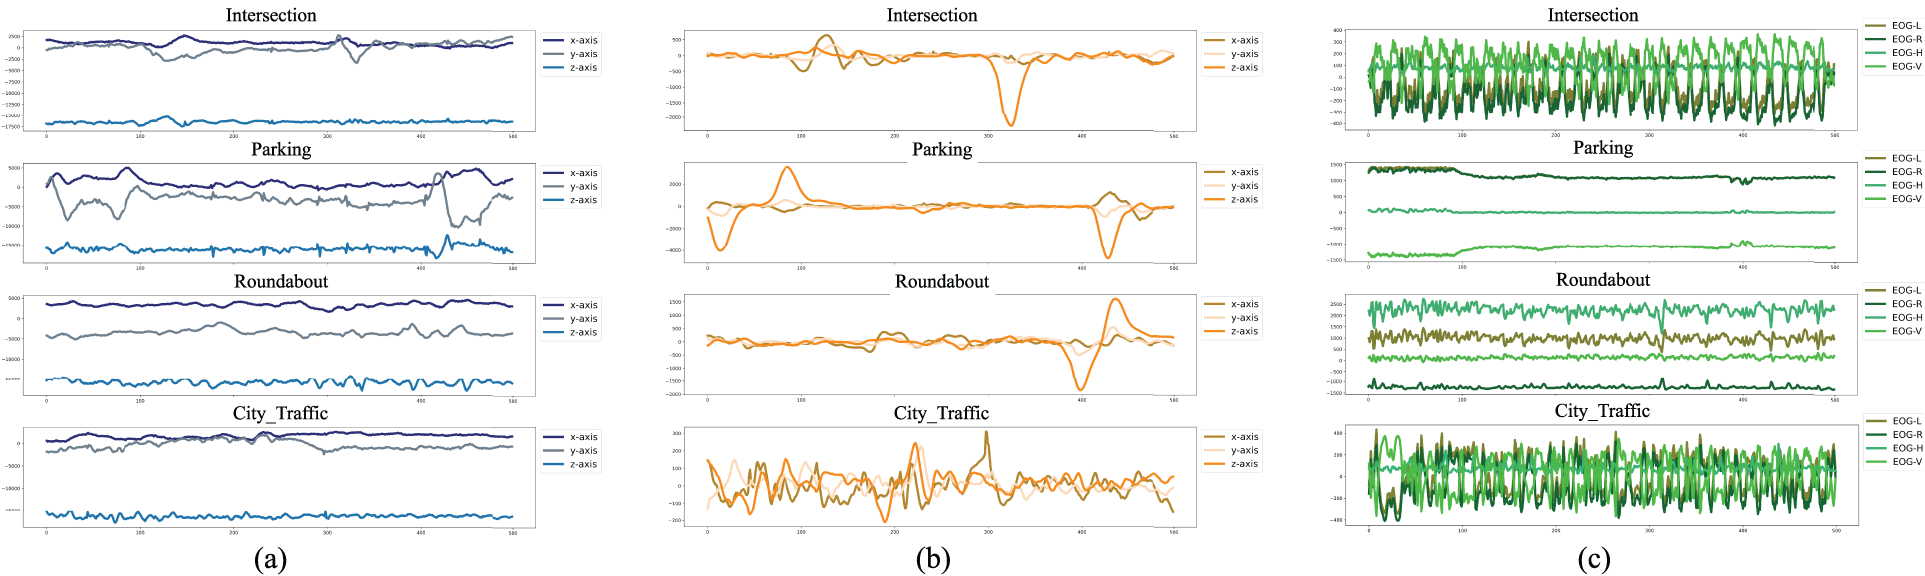
Figure 2: Samples of different signal data from the smart glasses dataset: (a) accelerometer data, (b) gyroscope data, and (c) electrooculography data
This research uses a dataset called Smart Glasses dataset that provided publicly accessible by Doniec et al. [17]. The authors collected data using JINS MEME smart glasses equipped with three-point EOG electrodes, a three-axis accelerometer, and a three-axis gyroscope. All signals are collected at 100 Hz. Sensor data were collected from 20 drivers (ten skilled drivers and ten inexperienced drivers) on the identical 28.7-kilometre route in southern Poland under real road circumstances. The drivers completed various duties while wearing the smart glasses, which were all connected to the signal received during the journey. The following tasks are shown:
• Journey along a highway;
• In city traffic, go straight ahead;
• Straight forward part outside of the metropolitan area;
• In residential traffic, go straight ahead;
• Roundabout driving (right turn, straight ahead, and left turn);
• Crossing a street (right turn, straight forward, and left turn);
• Parking garage (parallel, perpendicular, angled).
These behaviors were classified into four driving-related activities for the purposes of recognition (i.e., parking, driving through a roundabout, city traffic, and driving through an intersection). The main purpose of collection of this dataset was to examine whether it is possible to construct efficient models based on raw sensors as input signals and classify driving-related activities (as output of the models) in real road conditions.
Due to the individual’s lively motions during data collection, the raw data collected by the sensors of the smart glasses contain measurement noise and other unanticipated noise. A noisy signal obliterates the signal’s relevant information. As a result, it was critical to minimize the influence of noise on the movement to obtain relevant information for further processing. The most commonly used filtering techniques are mean, low-pass, and Wavelet filtering [41,42]. In our work, we applied a 3rd order low-pass Butterworth filter with a cutoff frequency of 20 Hz to the accelerometer, gyroscope, and electrooculography sensors in all multiple dimensions to denoise the signals. This rate is sufficient for gathering physical movements since 99.9% of the energy is held below 15 Hz [43].
In this study, we introduced a CNN-based deep learning approach to handle the HAR issue associated with driving. ResNet-SE is the proposed deep learning model, and it continuously extracts features using convolutional layers and residual connections, and squeeze-and-excite techniques. Additionally, we enhanced recognition accuracy in this network by adding a batch bormalization (BN) layer and a rectified linear unit (ReLU) layer to expedite network training and reduce the gradient vanishing problem and resultant overfitting, as illustrated in Fig. 3.
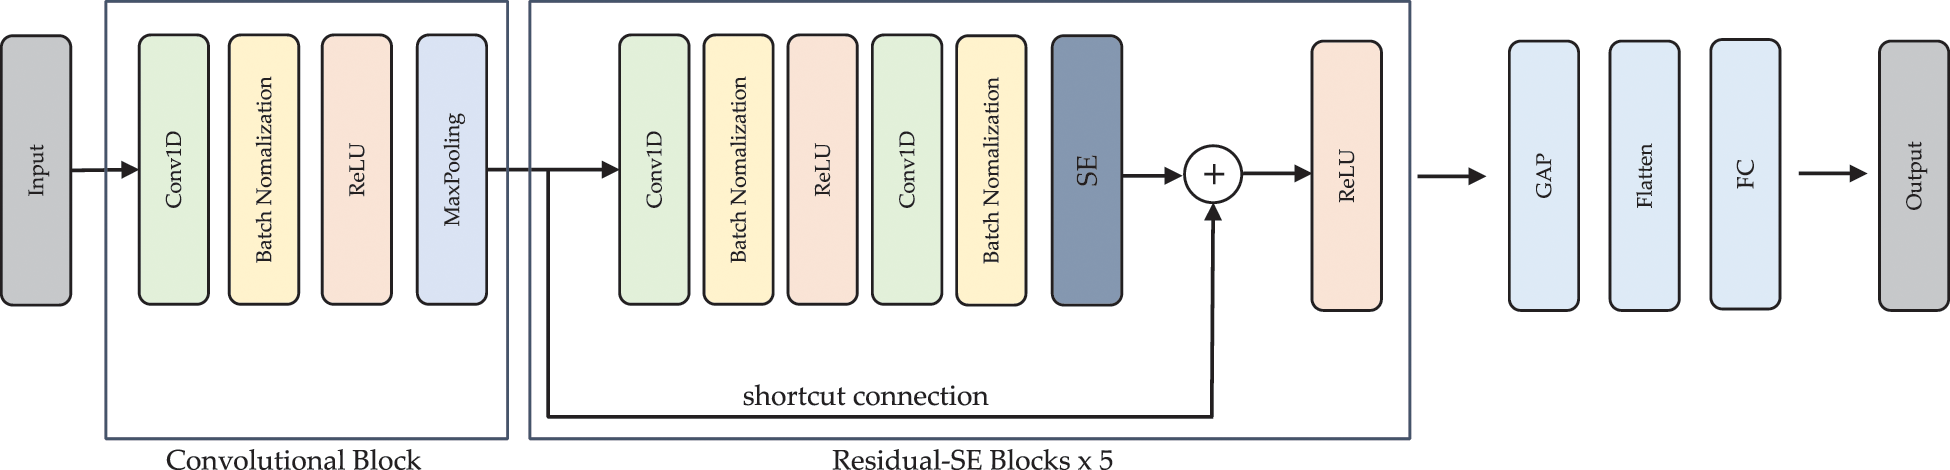
Figure 3: The architecture of the ResNet-SE model
Fig. 3 shows the architecture of the ResNet-SE. It consists of a convolutional unit and five Residual-SE units for extracting spatially distinguishable features, followed by a global average-pooling layer (GAP), a flatten layer, and a fully connected layer.
A convolutional (Conv) layer, a BN layer, a ReLU layer, and a max-pooling (MP) layer is comprised as the convolutional component. The convolutional layer enables many trainable convolutional kernels to gather various characteristics, with each kernel producing a feature map. The kernels, such as the input spectrum, are one-dimensional. BN was used to stabilize and expedite the training phase. The ReLU was employed to improve the model’s expressive capability. The MP layer was used to compress the feature map while maintaining the most important elements. The next part elaborates on the Residual-SE unit. Each feature map was averaged using the GAP and then transformed to a 1D vector using a flattened layer. A softmax function was used to change the output of the fully connected layer into probabilistic reasoning for each class. The Adam optimizer was used to train the network, and the loss was determined using the cross-entropy loss function, which is often used in classification applications.
Four evaluation metrics are computed using a 10-fold cross-validation technique, e.g., accuracy, precision, recall, and F1-score, to evaluate the performance of the proposed deep learning model. The mathematical formulas for these four performance criteria are as follows:
These four assessment measures are the most often used in HAR research to assess its overall success. The recognition is characterized as a true positive (TP) identification for the category under consideration and a true negative (TN) identification for all other categories evaluated. Activity sensor data from one category can also be misclassified as belonging to another, resulting in the false positive (FP) identification of that category. In contrast, activity sensor data from another category can also be misclassified as belonging to that category, resulting in that category’s false negative (FP) identification.
This section contains the results of all of the experimental studies conducted to establish the most efficient deep learning models for driving-related HAR, as well as the results of the experiments themselves. Our trials were carried out on benchmark datasets (Smart Glasses dataset). In order to assess the deep learning models, several evaluation measures such as accuracy, F1-score, and confusion matrix were employed.
4.1 Environmental Configuration
The Google Colab Pro+ platform [44] was utilized for this investigation. The Tesla V100-SXM2 with a 16 GB graphics processor module was used to accelerate deep learning model training, and the results were impressive. It was decided to introduce the 1D-ResNet-SE and other basic deep learning models in the Python library, using the Tensorflow backend (version 3.9.1) [45] and the CUDA (version 8.0.6) [46] graphics cards. The Python libraries that were the focus of these investigations are listed below:
• The sensor data was handled using Numpy and Pandas, which comprised reading, processing, and analyzing the data.
• The outcomes of the data discovery and model evaluation procedures were plotted and presented using Matplotlib and Seaborn.
• Sklearn, a library for sampling and data generation, was used as a library for sampling and data generation in the research.
• Deep learning models were created and trained using TensorFlow, Keras, TensorBoard, and among other programming languages.
The following three experiments were carried out using sensor data from the Smart Glasses dataset in this study:
• Experiment I: using accelerometer and gyroscope data to train deep learning models
• Experiment II: using electrooculography to train deep learning models
• Experiment III: using accelerometer, gyroscope and electrooculography to train deep learning models
A 10-fold cross-validation technique was utilized in three trials to assess studied CNNs and RNN models (including the proposed ResNet-SE model) using five n-CNNs (n represents the number of convolutional layers) and two RNN models (LSTM and BiLSTM).
Hyperparameter values are used to regulate the learning process in deep learning. The following are the hyperparameters utilized in the ResNet-SE model: (i) the number of epochs, (ii) batch size, (iii) learning rate α, (iv) optimization and (v) loss function. The number of epochs was set to 200 and the batch size was set to 128 to set the values of these hyperparameters. If no improvement in the validation loss was found after 20 epochs, we stopped the training process by an early-stop callback. Initially, we set the learning rate α = 0.001. Then, we updated it to 75% of the previous value if the validation accuracy of the proposed model had not improved after six consecutive epochs. To minimize the error, we used the Adam optimizer [47] with parameters β1 = 0.9, β2 = 0.999, and ε = 1 × 10⁻⁸. The categorical cross-entropy function is used to determine the error in the optimizer. Recently, the cross-entropy technique was found to outperform other techniques, i.e., classification error and mean square error [48].
The results of Experiment I, which utilized just accelerometer and gyroscope data for training and testing models, are summarized in Table 1. Additionally, our recommended ResNet-SE model outperformed the other models in this trial. With an accuracy of 98.29%, this model considerably outperforms other baseline deep learning models. With a score of 57.86%, the weakest performance was the 1-CNN. On average, CNN-based models outperform RNN-based models.
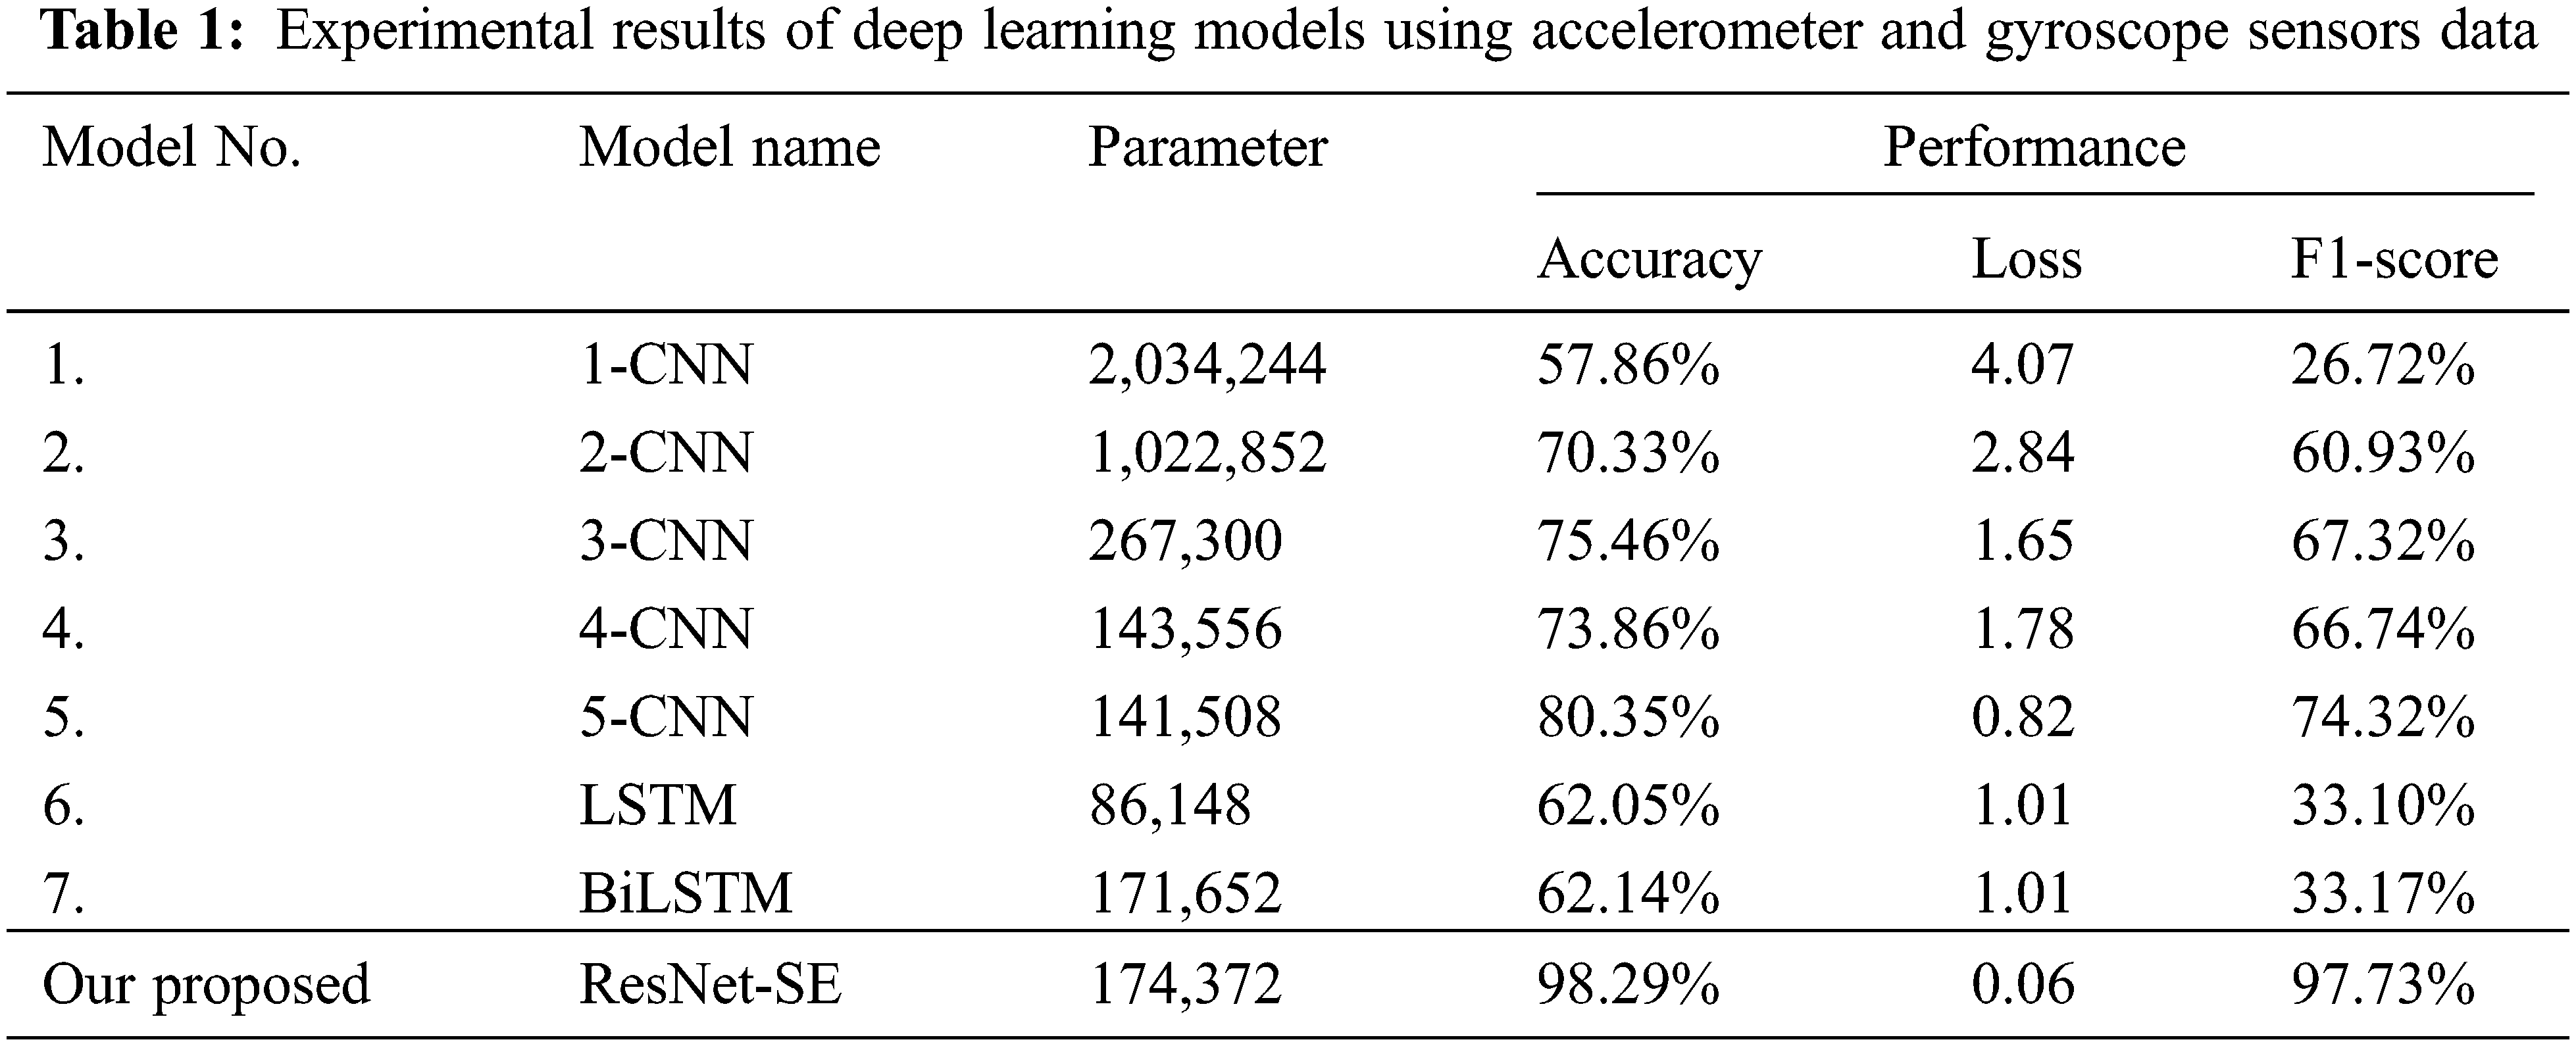
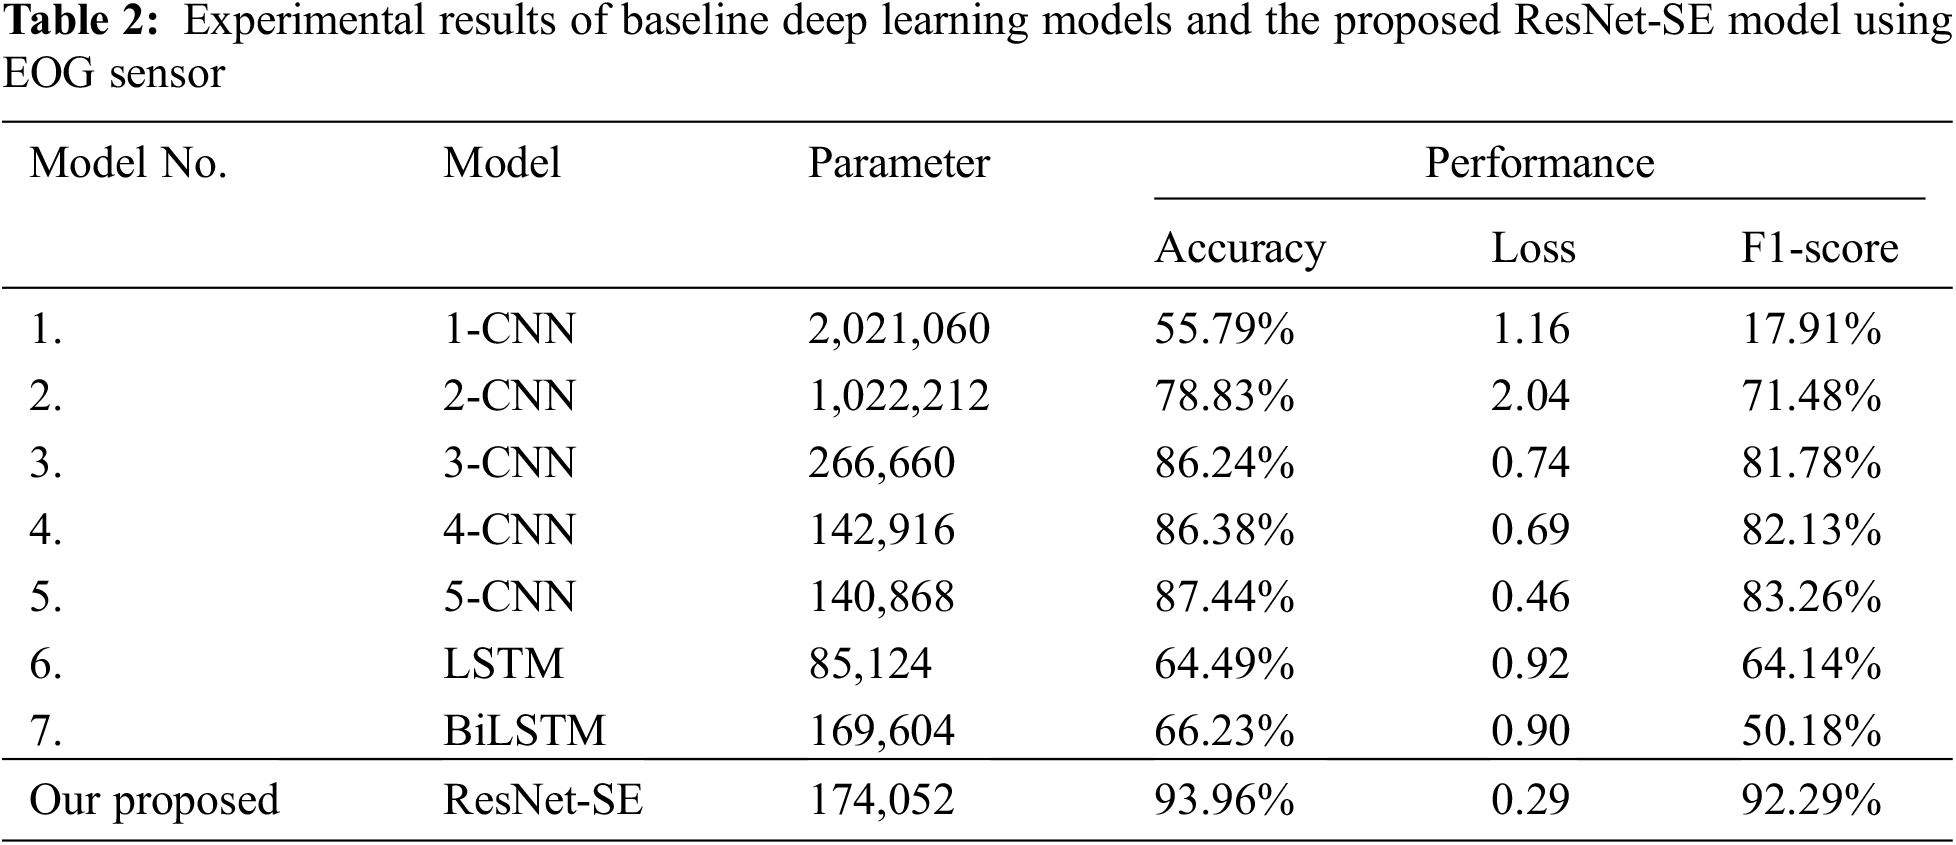
Table 2 summarizes the results of experiment II, which demonstrated that only EOG data is available for training and testing deep learning models. The results indicate that our ResNet-SE model achieves the most significant scores in this trial. The proposed model attained the most excellent accuracy of 93.96% and the highest F1-score of 92.29% in this experiment, outperforming other deep learning models.
The results of experiment III demonstrate that accelerometer, gyroscope, and EOG data are available for training and testing deep learning (DL) models in Table 3. The results indicate that our ResNet-SE model achieves excellent scores in this trial. The proposed model attained the most fantastic accuracy of 99.17% and the highest F1-score of 98.96% in this experiment, surpassing other deep learning models.

5.1 Effects of Different Sensors
To clarify the EOG signal’s effect on the performance of HAR models, we examine the confusion matrices for all participants, as shown in Fig. 4. Using only EOG data, the proposed model achieves an F1-score of 92.29%. Consequently, the majority of cases in confusion matrices are appropriately labeled. Nevertheless, “Parking” and “Roundabout” activities were commonly confused with other driving activities. As a result, we compare the confusion matrices of models that incorporate just EOG signals to those that include EOG and IMU signals. After forming the IMU signal, we see a considerable improvement in identifying the activities as mentioned earlier. Fig. 4a shows how well the model performs when just EOG is included. Realize when “Parking” and “Roundabout” activities are misclassified and conflated. Nonetheless, Fig. 4b shows that the ambiguities, as mentioned above, are resolved by adding the IMU signal.
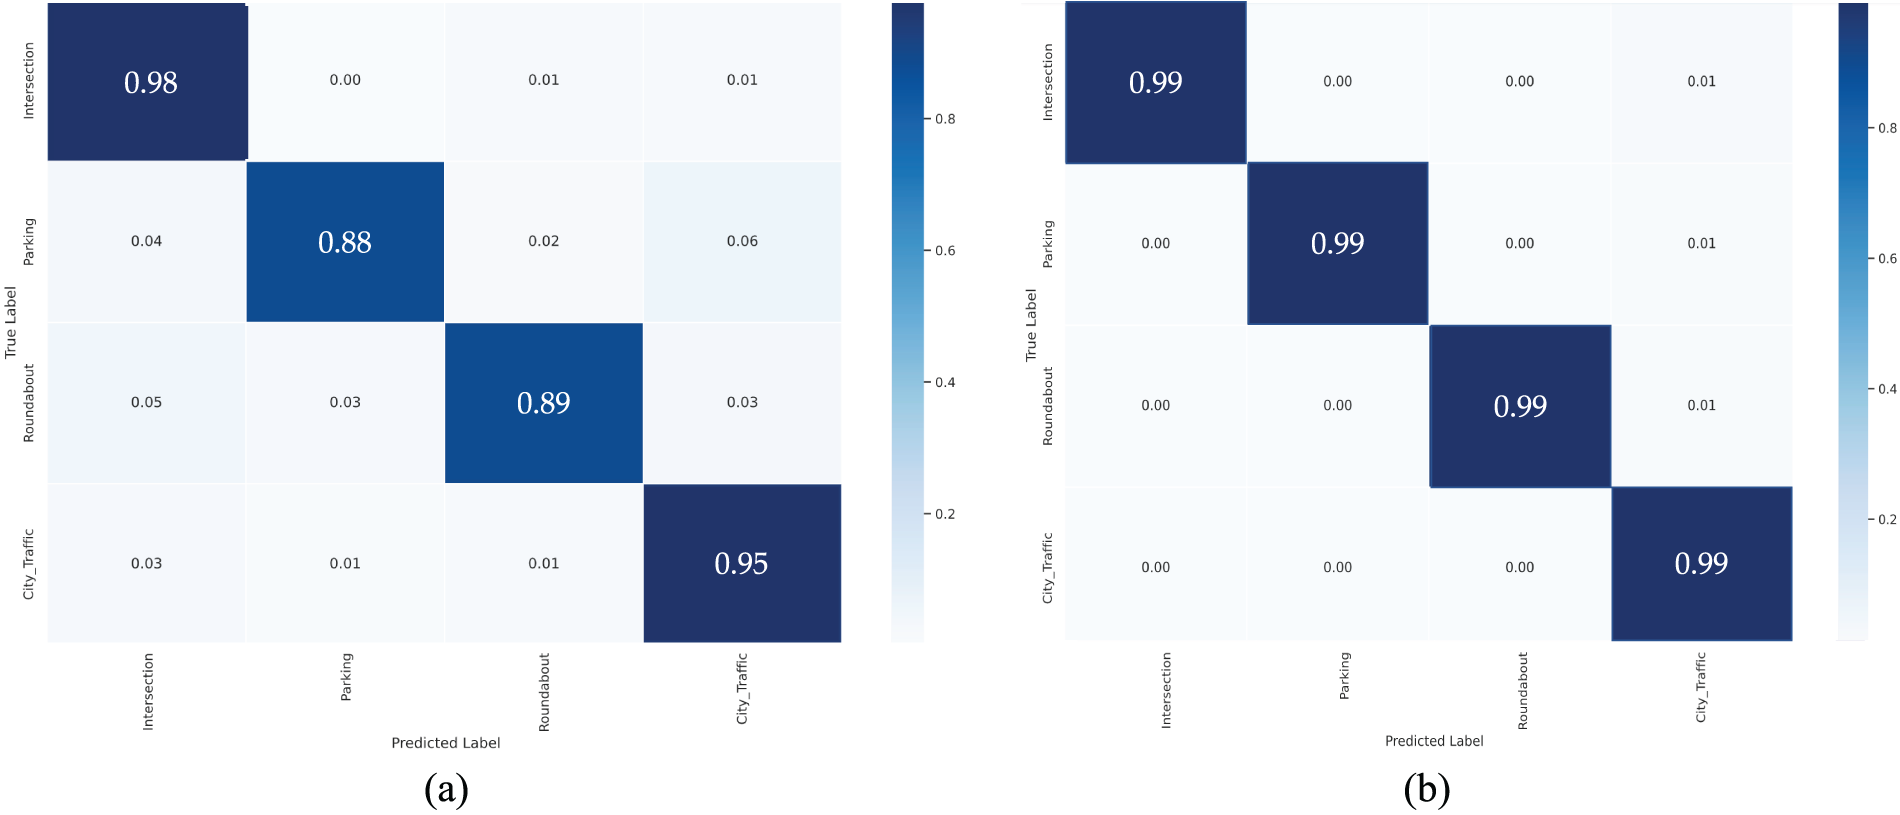
Figure 4: Comparison of the model performance between confusion matrices: (a) when considering only EOG signal (b) when combining IMU with the EOG
5.2 Comparison Results with Baseline DL Models
In this work, we have compared the recognition performances of our proposed model with the baseline DL models. From the results in Tables 1–3, we selected the 5-CNN and BiLSTM as representatives with the best performance of CNNs and LSTMs, respectively. The illustrated results evident that our proposed ResNet-SE models performed with the highest accuracies in every type of sensor data. The comparison results are depicted in Fig. 5.
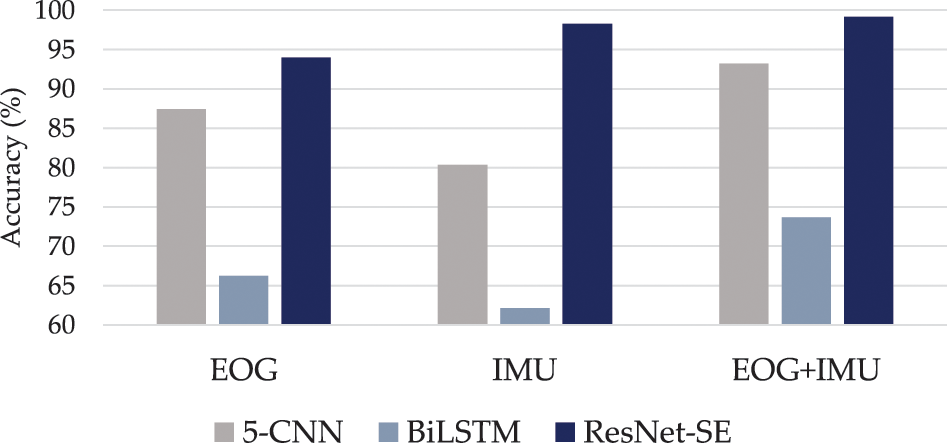
Figure 5: Comparison results with baseline DL models
5.3 Comparison Results with ResNet-Based Models
We selected to compare ResNet-SE to ResNet-based models in order to accurately evaluate its performance (ResNet-18, ResNet-34, ResNet-50, and ResNet-101). Table 4 shows the ResNet-based models’ hyperparameters that have been configured.

Classification results of the ResNet model using 18, 34, 50, and 101 layers are presented for comparison in Table 5. In the case of plain ResNet, when 18 layers were used, accuracy and F1-score showed the best at 97.87% and 97.22%. When the number of layers increase to 34 layers, the ResNet achieved the best accuracy of 98.70% and the best F1-score of 98.46%. Additionally, the ResNet-50 model showed the highest accuracy of 99.10% and F1-score of 98.96%. Meanwhile, in the case of the proposed ResNet-SE, accuracy and F1-score were the highest at 99.17% and 98.96%, respectively. These results evident that the proposed ResNet-SE outperforms other DL models. Moreover, the ResNet-SE has least parameters compared with other models, significantly.

Deep learning models were used to classify driving-related activities in this study. The Smart Glasses dataset was used to test seven basic deep learning techniques. In terms of overall accuracy and F1-score, CNN-based models outperformed RNN-based models. To this end, we developed ResNet-SE, a new deep learning model that combines the benefits of connection modules with squeeze-and-excitation units to enhance recognition accuracy in the HAR issue that pertains to vehicle operation. A 99.17% accuracy rate and a 98.96% F1-score demonstrate that our model is superior to other baseline deep learning methods.
In the future, we will work to overcome one of the original study drawbacks: the requirement for sensor data with a pre-determined size. As an alternative to using a flatten layer, we suggest creating a model with a variable size that uses global pooling instead. The optimization of hyperparameters provides a second channel for enhancing the proposed effectiveness of the algorithm.
Acknowledgement: The authors would like to explicitly thank Virach Sornlertlamvanich for his insightful discussions and feedback during the development.
Funding Statement: The authors gratefully acknowledge the financial support provided by Thammasat University Research fund under the TSRI, Contract Nos. TUFF19/2564 and TUFF24/2565, for the project of “AI Ready City Networking in RUN”, based on the RUN Digital Cluster collaboration scheme. This research project was also supported by the Thailand Science Research and Innovation fund, the University of Phayao (Grant No. FF65-RIM041), and supported by National Science, Research and Innovation (NSRF), and King Mongkut’s University of Technology North Bangkok, Contract No. KMUTNB-FF-66-07.
Author Contributions: Narit Hnoohom: Conceptualization, methodology, validation, data curation, writing-original draft preparation, writing-review and editing, visualization, funding acquisition; Sakorn Mekruksavanich: Software, validation, investigation, resources, supervision, funding acquisition; Anuchit Jitpattanakul: Conceptualization, validation, formal analysis, writing-review and editing, visualization, supervision, project administration, funding acquisition.
Availability of Data and Materials: The datasets supporting this study’s findings are published online availability at IEEE DataPort: https://dx.doi.org/10.21227/q163-w472.
Conflicts of Interest: The authors declare that they have no conflict of interest to report regarding the present study.
References
1. E. E. Galarza, F. D. Egas, F. M. Silva, P. M. Velasco and E. D. Galarza, “Real time driver drowsiness detection based on driver’s face image behavior using a system of human computer interaction implemented in a smartphone,” Advances in Intelligent Systems and Computing, vol. 721, pp. 563–572, 2018. [Google Scholar]
2. S. Al-Sultan, A. H. Al-Bayatti and H. Zedan, “Context-aware driver behavior detection system in intelligent transportation systems,” IEEE Transactions on Vehicular Technology, vol. 62, no. 9, pp. 4264–4275, 2013. [Google Scholar]
3. J. Carmona, F. Garcia, D. Martin, A. D. L. Escalera and J. M. Armingol, “Data fusion for driver behaviour analysis,” Sensors, vol. 15, no. 10, pp. 25968–25991, 2015. [Google Scholar] [PubMed]
4. M. Shahverdy, M. Fathy, R. Berangi and M. Sabokrou, “Driver behavior detection and classification using deep convolutional neural networks,” Expert Systems with Applications, vol. 149, pp. 113240, 2020. [Google Scholar]
5. S. Mekruksavanich and A. Jitpattanakul, “Biometric user identification based on human activity recognition using wearable sensors: An experiment using deep learning models,” Electronics, vol. 10, no. 3, pp. 1–21, 2021. [Google Scholar]
6. A. Tahmasbi-Sarvestani, H. Kazemi, Y. Fallah, M. Naserian and A. Lewis, “System architecture for cooperative vehicle-pedestrian safety applications using dsrc communication,” SAE Technical Papers, vol. 2015, pp. 1–6, 2015. [Google Scholar]
7. D. D. Salvucci, “Modeling driver behavior in a cognitive architecture,” Human Factors, vol. 48, no. 2, pp. 362–380, 2006. [Google Scholar] [PubMed]
8. C. Braunagel, D. Geisler, W. Rosenstiel and E. Kasneci, “Online recognition of driver-activity based on visual scanpath classification,” IEEE Intelligent Transportation Systems Magazine, vol. 9, no. 4, pp. 23–36, 2017. [Google Scholar]
9. Y. Ma, Z. Zhang, S. Chen, Y. Yu and K. Tang, “A comparative study of aggressive driving behavior recognition algorithms based on vehicle motion data,” IEEE Access, vol. 7, pp. 8028–8038, 2019. [Google Scholar]
10. R. B. Wang, L. Guo, B. L. Tong and L. S. Jin, “Monitoring mouth movement for driver fatigue or distraction with one camera,” in Proc. of ITS, Washington, WA, USA, pp. 314–319, 2004. [Google Scholar]
11. P. Singh, N. Juneja and S. Kapoor, “Using mobile phone sensors to detect driving behavior,” in Proc. of DEV, New York, NY, USA, pp. 1–2, 2013. [Google Scholar]
12. S. Mekruksavanich and A. Jitpattanakul, “Deep learning approaches for continuous authentication based on activity patterns using mobile sensing,” Sensors, vol. 21, no. 22, pp. 1–21, 2021. [Google Scholar]
13. J. Yu, Z. Chen, Y. Zhu, Y. Chen, L. Kong et al., “Fine-grained abnormal driving behaviors detection and identification with smartphones,” IEEE Transactions on Mobile Computing, vol. 16, no. 8, pp. 2198–2212, 2017. [Google Scholar]
14. O. Russakovsky, J. Deng, H. Su, J. Krause, S. Satheesh et al., “Imagenet large scale visual recognition challenge,” International Journal of Computer Vision, vol. 115, pp. 211–252, 2015. [Google Scholar]
15. M. D. Zeiler and R. Fergus, “Visualizing and understanding convolutional networks,” Lecture Notes in Computer Science, vol. 8689, pp. 818–833, 2014. [Google Scholar]
16. K. Simonyan and A. Zisserman, “Very deep convolutional networks for large-scale image recognition,” in Proc. of ICLR, San Diego, CA, USA, pp. 1–14, 2015. [Google Scholar]
17. R. J. Doniec, S. Sieciński, K. M. Duraj, N. J. Piaseczna, K. Mocny-Pachońska et al., “Recognition of drivers’ activity based on 1D convolutional neural network,” Electronics, vol. 9, no. 12, pp. 1–17, 2020. [Google Scholar]
18. A. Bulling, J. A. Ward, H. Gellersen and G. Tröster, “Eye movement analysis for activity recognition using electrooculography,” IEEE Transactions on Pattern Analysis and Machine Intelligence, vol. 33, no. 4, pp. 741–753, 2011. [Google Scholar] [PubMed]
19. K. Huda, M. S. Hossain and M. Ahmad, “Recognition of reading activity from the saccadic samples of electrooculography data,” in Proc. of EEE, Rajshahi, Bangladesh, pp. 73–76, 2015. [Google Scholar]
20. N. Hnoohom, S. Mekruksavanich and A. Jitpattanakul, “An efficient resnetse architecture for smoking activity recognition from smartwatch,” Intelligent Automation & Soft Computing, vol. 35, no. 1, pp. 1245–1259, 2023. [Google Scholar]
21. R. Doniec, S. Sieciński, N. Piaseczna, K. Mocny-Pachońska, M. Lang et al., “The classifier algorithm for recognition of basic driving scenarios,” Advances in Intelligent Systems and Computing, vol. 1186, pp. 359–367, 2021. [Google Scholar]
22. S. Mekruksavanich and A. Jitpattanakul, “Sport-related activity recognition from wearable sensors using bidirectional gru network,” Intelligent Automation & Soft Computing, vol. 34, no. 3, pp. 1907–1925, 2022. [Google Scholar]
23. A. Bulling, U. Blanke and B. Schiele, “A tutorial on human activity recognition using body-worn inertial sensors,” ACM Computing Surveys, vol. 46, no. 3, pp. 1–33, 2014. [Google Scholar]
24. T. Al Shloul, U. Azmat, S. A. Alsuhibany, Y. Yasin Ghadi, A. Jalal et al., “Smartphone sensors based physical life-routine for health education,” Intelligent Automation & Soft Computing, vol. 34, no. 2, pp. 715–732, 2022. [Google Scholar]
25. L. Bao and S. S. Intille, “Activity recognition from user-annotated acceleration data,” Lecture Notes in Computer Science, vol. 3001, pp. 1–17, 2004. [Google Scholar]
26. S. Choe, W. Cho, J. Kim and A. Ki-Hyung Kim, “Reducing operational time complexity of k-NN algorithms using clustering in wrist-activity recognition,” Intelligent Automation & Soft Computing, vol. 26, no. 4, pp. 679–691, 2020. [Google Scholar]
27. S. Mekruksavanich and A. Jitpattanakul, “LSTM networks using smartphone data for sensor-based human activity recognition in smart homes,” Sensors, vol. 21, no. 5, pp. 1636, 2021. [Google Scholar] [PubMed]
28. E. Dhiravidachelvi, M. Kumar, L. D. Vijay Anand, D. Pritima, S. Kadry et al., “Intelligent deep learning enabled human activity recognition for improved medical services,” Computer Systems Science and Engineering, vol. 44, no. 2, pp. 961–977, 2023. [Google Scholar]
29. A. Gumaei, M. Al-Rakhami, H. AlSalman, S. Md. Mizanur Rahman and A. Alamri, “Dl-har: Deep learning-based human activity recognition framework for edge computing,” Computers, Materials & Continua, vol. 65, no. 2, pp. 1033–1057, 2020. [Google Scholar]
30. N. D. Lane, E. Miluzzo, H. Lu, D. Peebles, T. Choudhury et al., “A survey of mobile phone sensing,” IEEE Communications Magazine, vol. 48, no. 9, pp. 140–150, 2010. [Google Scholar]
31. M. Berchtold, M. Budde, D. Gordon, H. R. Schmidtke and M. Beigl, “Actiserv: Activity recognition service for mobile phones,” in Proc. of ISWC, Seoul, Korea (Southpp. 1–8, 2010. [Google Scholar]
32. A. Mannini and A. Sabatini, “Machine learning methods for classifying human physical activity from on-body accelerometers,” Sensors, vol. 10, pp. 1154–75, 2010. [Google Scholar] [PubMed]
33. S. Mekruksavanich and A. Jitpattanakul, “Deep convolutional neural network with rnns for complex activity recognition using wrist-worn wearable sensor data,” Electronics, vol. 10, no. 14, pp. 1–33, 2021. [Google Scholar]
34. M. N. Rastgoo, B. Nakisa, F. Maire, A. Rakotonirainy and V. Chandran, “Automatic driver stress level classification using multimodal deep learning,” Expert Systems with Applications, vol. 138, pp. 112793, 2019. [Google Scholar]
35. O. Khunpisuth, T. Chotchinasri, V. Koschakosai and N. Hnoohom, “Driver drowsiness detection using eye-closeness detection,” in Proc. of SITIS, Naples, Italy, pp. 661–668, 2016. [Google Scholar]
36. J. Jo, S. J. Lee, K. R. Park, I. J. Kim and J. Kim, “Detecting driver drowsiness using feature-level fusion and user-specific classification,” Expert Systems with Applications, vol. 41, no. 4, pp. 1139–1152, 2014. [Google Scholar]
37. M. Sabet, R. A. Zoroofi, K. Sadeghniiat-Haghighi and M. Sabbaghian, “A new system for driver drowsiness and distraction detection,” in Proc. of ICEE, Tehran, Iran, pp. 1247–1251, 2012. [Google Scholar]
38. E. Carvalho, B. V. Ferreira, J. Ferreira, C. de Souza, H. V. Carvalho et al., “Exploiting the use of recur-rent neural networks for driver behavior profiling,” in Proc. of IJCNN, Anchorage, AK, USA, pp. 3016–3021, 2017. [Google Scholar]
39. A. Jain, A. Singh, H. S. Koppula, S. Soh and A. Saxena, “Recurrent neural networks for driver activity anticipation via sensory-fusion architecture,” in Proc. of ICRA, Stockholm, Swede, pp. 3118–3125, 2016. [Google Scholar]
40. S. K. Kwon, J. H. Seo, J. Y. Yun and K. D. Kim, “Driving behavior classification and sharing system using CNN-LSTM approaches and V2X communication,” Applied Sciences, vol. 11, no. 21, pp. 1–22, 2021. [Google Scholar]
41. R. Liu, J. Z. Zhou, M. Liu and X. F. Hou, “A wearable acceleration sensor system for gait recognition,” in Proc. of ICIEA, Harbin, China, pp. 2654–2659, 2007. [Google Scholar]
42. A. Mostayed, S. Kim, M. M. G. Mazumder and S. J. Park, “Foot step based person identification using histogram similarity and wavelet decomposition,” in Proc. of ISA, Busan, Korea (Southpp. 307–311, 2008. [Google Scholar]
43. D. Anguita, A. Ghio, L. Oneto, X. Parra and J. L. Reyes-Ortiz, “A public domain dataset for human activity recognition using smartphones,” in Proc. of ESANN, Bruges, Belgium, pp. 437–442, 2013. [Google Scholar]
44. E. Bisong, “More on optimization techniques,” in Building Machine Learning and Deep Learning Models on Google Cloud Platform, 1st ed., Berkely, CA, USA: Apress, pp. 411–413, 2019. [Google Scholar]
45. M. Abadi, P. Barham, J. Chen, Z. Chen, A. Davis et al., “Tensorflow: A system for large-scale machine learning,” in Proc. of USENIX, USA, pp. 265–283, 2016. [Google Scholar]
46. N. Corporation, Expand Horizons with NVDIA in the Cloud, 2022. [Online]. Available: https://www.nvidia.com/en-us/data-center/gpu-cloud-computing/ [Google Scholar]
47. D. P. Kingma and J. Ba, “Adam: A method for stochastic optimization,” in Proc. of ICLR, San Diego, CA, USA, 2015. [Google Scholar]
48. K. Janocha and W. M. Czarnecki, “On loss functions for deep neural networks in classification,” Schedae Informaticae, vol. 25, pp. 49–59, 2016. [Google Scholar]
Cite This Article
 Copyright © 2023 The Author(s). Published by Tech Science Press.
This work is licensed under a Creative Commons Attribution 4.0 International License , which permits unrestricted use, distribution, and reproduction in any medium, provided the original work is properly cited.
 Downloads
 Citation Tools