
 Submit a Paper
 Propose a Special lssue
 Open Access
ARTICLE
A Robust Method of Bipolar Mental Illness Detection from Facial Micro Expressions Using Machine Learning Methods
1 Department of Artificial Intelligence, Faculty of Computing, The Islamia University of Bahawalpur, Bahawalpur, 63100, Pakistan
2 Biophotonics Imaging Techniques Laboratory, Institute of Physics, The Islamia University of Bahawalpur, Bahawalpur, 63100, Pakistan
3 West High School, Salt Lake City, UT, 84103, USA
* Corresponding Author: Ghulam Gilanie. Email:
Intelligent Automation & Soft Computing 2024, 39(1), 57-71. https://doi.org/10.32604/iasc.2024.041535
Received 26 April 2023; Accepted 12 January 2024; Issue published 29 March 2024
 View Full Text
 Download PDF
Abstract
Bipolar disorder is a serious mental condition that may be caused by any kind of stress or emotional upset experienced by the patient. It affects a large percentage of people globally, who fluctuate between depression and mania, or vice versa. A pleasant or unpleasant mood is more than a reflection of a state of mind. Normally, it is a difficult task to analyze through physical examination due to a large patient-psychiatrist ratio, so automated procedures are the best options to diagnose and verify the severity of bipolar. In this research work, facial micro-expressions have been used for bipolar detection using the proposed Convolutional Neural Network (CNN)-based model. Facial Action Coding System (FACS) is used to extract micro-expressions called Action Units (AUs) connected with sad, happy, and angry emotions. Experiments have been conducted on a dataset collected from Bahawal Victoria Hospital, Bahawalpur, Pakistan, Using the Patient Health Questionnaire-15 (PHQ-15) to infer a patient’s mental state. The experimental results showed a validation accuracy of 98.99% for the proposed CNN model while classification through extracted features Using Support Vector Machines (SVM), K-Nearest Neighbour (KNN), and Decision Tree (DT) obtained 99.9%, 98.7%, and 98.9% accuracy, respectively. Overall, the outcomes demonstrated the stated method’s superiority over the current best practices.Keywords
Mental illness, impacting millions globally, poses a significant public health challenge, with early detection and treatment crucial for improving the health and well-being of those affected. The human face plays a pivotal role in emotion interpretation, leading to demographic estimation through facial image analysis for diverse applications, including forensics and social media. Psychologists rely on facial expressions to gauge mental states, although the vast range of expressions complicates concrete assessments. In this context, facial activity units become vital in diagnosing psychological disorders. Bipolar disorder (BD), identified by the World Health Organization as a leading cause of disability and reduced life expectancy among youth, often gets misdiagnosed as major depressive disorder. This complicates treatment, despite being a prevalent condition. BD, characterized by mood swings from high (mania or hypomania) to low (depression), affects various aspects of life and can vary in frequency and duration. Treatment includes medications and psychotherapy, but symptoms and severity vary widely. Factors like family history, personal stressors, and life events can trigger BD, emphasizing the need for accurate diagnosis methods, where machine learning offers promising advancements.
BD can be diagnosed using both clinical and non-clinical diagnostic methods. Patient reports or clinical decisions made in light of the Diagnostic and Statistical Manual of Mental Disorders (DSM) constitute the sole basis of the symptom severity-based clinical method, which is computerized of Patient Health Questionnaire-15 (PHQ-15) in (DSM-5) [1]. Clinical methods used for bipolar detection are mainly consisting of two screening test, i.e., Mood Disorders Questionnaire (MDQ) and Hypomania Checklist (HCL-32) [2].
Facial micro-expressions indicative of the degree and kind of bipolar disorder can be recognized by computer vision. When these methods are combined, it is possible to create computer-aided diagnostic systems that can be used to screen the entire population without any hesitancy or other barriers. Both the patient and the psychiatrist may benefit financially and timewise from the use of such technologies. In addition, confidentiality can be maintained, which is essential given the social stigma. So, these technologies have the potential to be efficient, dependable, secure, non-invasive, real-time, resilient, and helpful for early-stage detection.
Facial micro-expression refers to the almost imperceptible but telling changes in facial muscle activity that can reveal whether a person is trying to conceal their true emotions or even their mental state. Therefore, micro-expression recognition attracts rising study efforts in both domains of psychology and computer vision [3]. Every suspect, no matter how innocent-looking on the outside, will show some sort of reaction under questioning, even if it is just a short-term micro-expression [4]. The suspect’s expression negates her words.
The main contribution of this research is key fold into the following. This research examined the effectiveness of applying Convolutional Neural Network (CNN). Support Vector Machine (SVM), K-Nearest Neighbors (KNN), and Decision Tree (DT) to diagnose bipolar illness. The suggested CNN-based and other CNN-based pretrained models are used to classify noisy and aligned images in the first module, while in the second module, SVM, KNN, and DT are utilized to classify the extracted features.
The paper is organized as follows: Section 2 contains a review of related studies, while Section 3 embodies details about the data acquisition, preprocessing, and the proposed CNN model for bipolar detection. In Section 4, experimental work is performed; this section also represents experimental results, their discussions, and comparison with the state-of-the-art methods. Section 5 concludes the conducted research work and future directions of this conducted study.
Several investigators proposed several diagnostic models using automated techniques to detect BD in non-invasive manners.
In this study [5], the dataset used for the experiments was behavioral simulations of bipolar patients experiencing mixed episodes. The study’s computational component used Matlab scripts based on Euler’s mechanism. The proposed system takes in all the probability data for an event while keeping the noise value constant at 0.1. The study also determines that an amplitude of 0.01 is the maximum for a customarily distributed event. The practical utility of the proposed model is significantly high for real-world cases of bipolar disorder. In this study [6], two datasets used in this study BD Corpus [7] and the Well-being dataset. The Proposed model audio-visual Long-Short-Term Memory (LSTM), audio-visual-textual LSTM & adaptive nonlinear judge classifier was used to classify BD and Depression on both datasets. Achieved results Using audio-visual-textual LSTM from BD corpus’s as per accuracy = 91.6%, and audio-visual LSTM from Well-being dataset’s as per F1 = 0.870. This study improved by adding different samples (audio, visual and textual) of the same patients. In this study, multiple video recordings of the same patient were used, so there is a need to add more patients and a variety of videos from different patients.
In this study [8], BD and borderline personality disorder (BPD) happen together; it is hard to tell them apart from each disorder. The study aims to use machine learning (ML) to tell BP/BPD apart from BP and BPD on their own. Diagnoses from the DSM were given to the participants, and self-report measures looked at personality, ways to control emotions, and how parents were seen when they were young. BP was given to 82 participants, BPD to 52, and BP and BPD to 53. The accuracy of ML-based diagnoses for BP/BPD vs. BP was 79.6%, and for BP/BPD vs. BPD, it was 61.7%. Limited dataset used in this study.
In this study [9], dataset participants met the inclusion criteria and sought treatment at the Bipolar Outpatient Clinic in the Medical Faculty at Eskisehir Osman Gaze University, Turkey. The neurocognitive evaluation was conducted using six tests from the CANTAB test battery, and participants were placed into appropriate categories using the Polyhedral Conic Functions algorithm. An accuracy of 78.0% was achieved in distinguishing bipolar patients from healthy controls. In another paper [10], major depressive and bipolar disorder have been detected Using a machine learning predictive model. This study achieved results as per Area under the Curve (AUC) = 0.97, accuracy on Major Depressive Disorder (MDD) = 92.0% and accuracy of BD = 86.0%. Patients were recruited from a single center and ethnic group, limiting generalizability.
In this study [11], the benchmark dataset Turkish Audio-Visual Bipolar Disorder Corpus (AVEC) is used to classify the BD state. CNN is used for the classification of facial features from video recordings. Long-Short-Term Memory (LSTM) is used to classify extracted features from facial images and achieved results from the proposed model as per Unweighted Average Recall (UAR) of 60.6%. In this study [12], BD patients are classified Using an audio-visual dataset from AVEC-2018. A Fisher Vector encoding of ComParE’s low-level descriptors (LLDs) used for screening for bipolar disorder. The best test set result achieved UAR = 57.4%. This study needs to improve results in terms of accuracy.
In this study [13], the IncepLSTM framework was used to categorize BD severity. IncepLSTM uses a CNN with filters of varying kernel sizes and LSTM on the feature sequence to effectively model multi-scale temporal audio clues. This experimental work made use of the AVEC-2018 dataset. An accuracy of 65.0% was achieved Using IncepLSTM in this study. This study needs to improve results in terms of accuracy.
It is evident that each study contributes uniquely through diverse methodologies, such as computational modeling, audio-visual-textual LSTM, and machine learning diagnostics, with varied datasets ranging from behavioral simulations to the Turkish Audio-Visual Bipolar Disorder Corpus. While these studies collectively advance the understanding and diagnosis of bipolar disorder, often-achieving high accuracy and innovative classification methods, they also reveal limitations like limited generalizability and varied success rates across different modalities. This highlights the need for more comprehensive and diverse approaches in future research to address these gaps and continue advancing the field.
The proposed method of bipolar disorder detection based on facial images consists of several steps as follows.
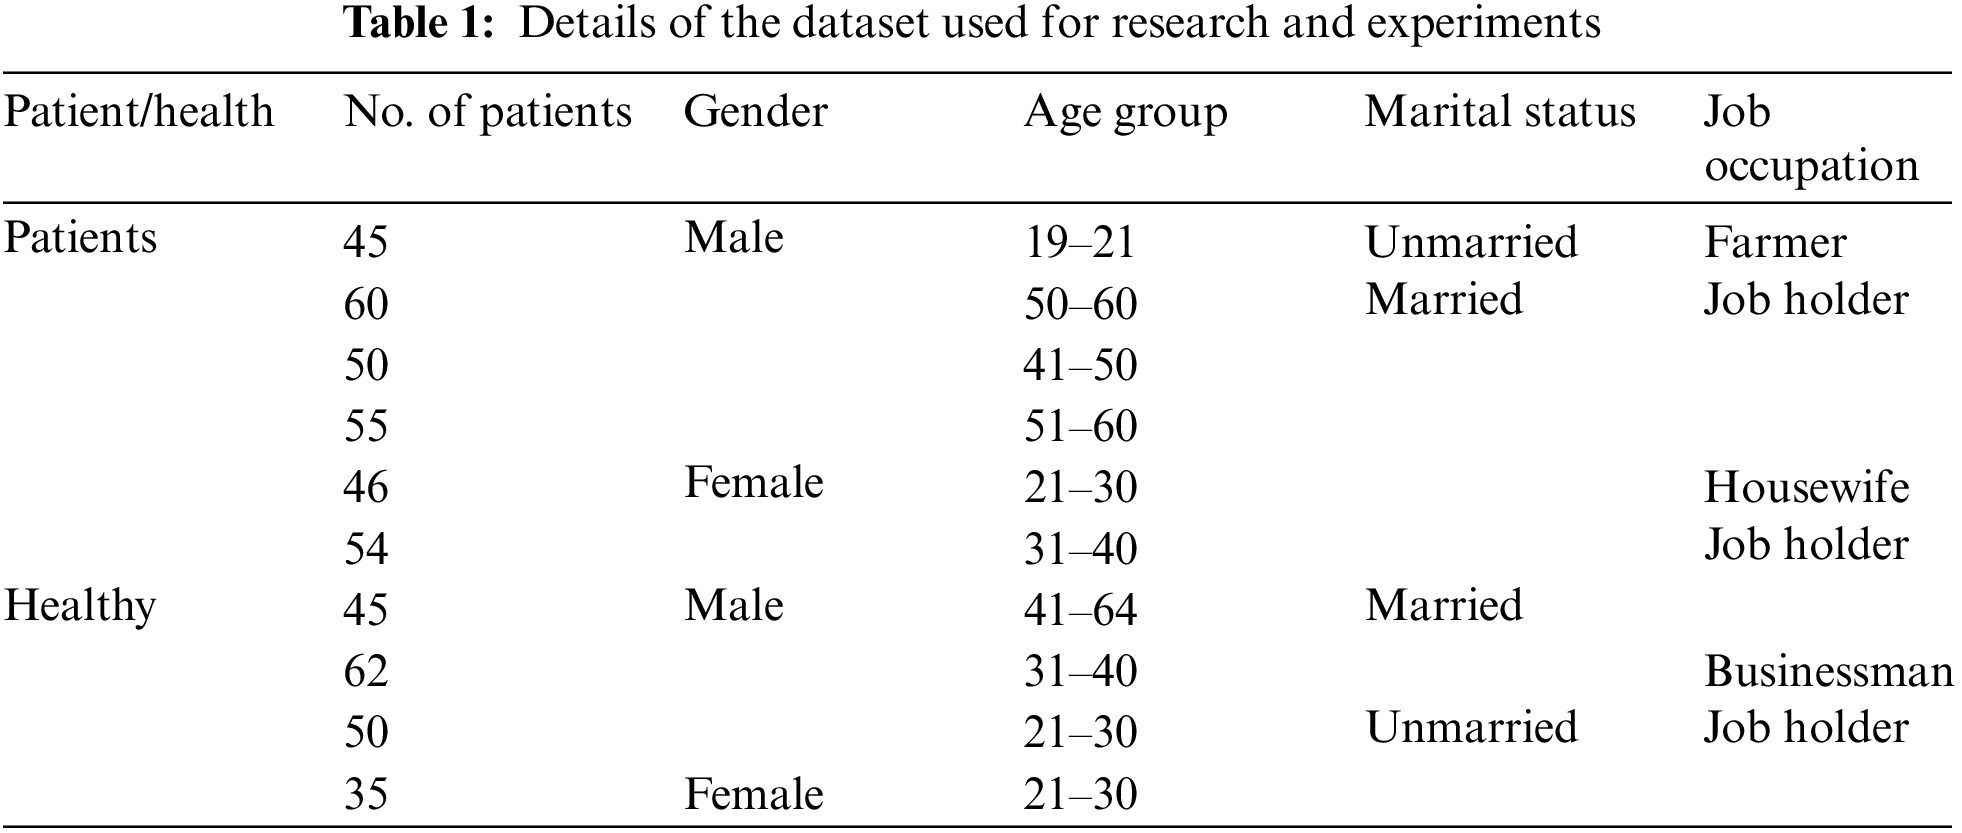
The dataset has been collected from the Department of Psychiatry at Bahawal Victoria Hospital in Bahawalpur, Pakistan. It comprises 1–5-min videos of each bipolar patient and healthy controls. When conducting PHQ-15 interviews, all patients signed a consent form and gave their informed consent to be videotaped. According to a clinical trial conducted by a team of psychiatrists, there were 310 bipolar patients and 192 healthy controls. While acquiring the videos, interviews were conducted using a questionnaire prepared following the PHQ-15 and DSM-V. Table 1 displays information about the patients and healthy controls used for research and experiments for at least two hours before the examination.
The videos were turned into frames that were each 256 * 256 pixels. Every video lasts one to five minutes and has 24 frames per second. There are 5.25 million bipolar images and 3.25 million healthy person images that were taken from videos. So, a lighter version of this dataset was made by only including one frame from every two frames that came before it. Due to the fleeting and subtle nature of microexpressions, the possibility of losing them increases as more frames are missed. This explains why the volume cannot be decreased by dropping further frames.
The OpenFace tool [14] was used to obtain noise-free data for aligned faces, 2D landmarking, and Action Unit (AUs) [15] detection & estimation. AUs [16] are based on micro expressions during sadness, fear, disgust, contempt, and anger. Table 2 shows examples of aligned faces, which are saved as 256256 JPEG files. Face landmarks, like the mouth, ears, and eyes, are used to crop and line up each frame. Four features, including AUs, gaze, pose, and landmarks, were found and saved in a features file (in CSV format) so that they could be used in future experiments to figure out how they can be used to tell BD patients from healthy controls.

3.4 The Proposed CNN Architecture
CNN helps solve any machine vision-related problem. The image is analyzed and mapped into a more manageable format for improved prediction, with no critical details lost. The two main components of CNN are convolution and pooling. As a layer dedicated to extracting features that help to preserve spatial information, convolution does an excellent job of doing just that. To optimize the application, the pooling layer reduces the size of the significant characteristics. Next, an activation function containing a fully connected layer receives the simplified features.
The kernel or filter is the vital part of the convolutional layer that does the work. This part multiplies the input data by the two-dimensional array of weights for a two-dimensional image. The convolutional layer oversees obtaining low-level features such as edges, color, and gradient orientation. More layers are added to obtain high-level features, including micro-expressions that can quickly identify the severity of bipolar disorder. Eq. (1) depicts the convolutional process.
where I = image, K = filter/kernel, x = x-coordinate, y = y-coordinate, nh = height of image, nw =
Width of the image, and nc = the number of channels.
In this layer, we minimize the sizes by which the convolved features are represented to control the amount of computing power required to process the enormous dataset. Additionally, it is required to separate the primary features that are not affected by changes in position or rotation. This aids in efficient model processing. Mainly, two distinct forms of pooling operations exist, i.e., maximum pooling and average pooling. In max-pooling, the maximum value from the image portion covered by the kernel is returned, while in average-pooling, the average of all numbers from the image portion covered by the kernel is provided. Max-pooling outperforms average-pooling in the facial dataset when processed to extract micro-expressions, which was incorporated into the proposed design.
3.4.3 Rectified Linear Unit (RELU) Layer
The activation function converts the data from linear to nonlinear, essential for solving complex problems. Standard activation functions include Softmax, Exponential Linear Unit (ELU), sigmoid, and RELU. During the proposed CNN model’s feature extraction, the RELU function increases non-linearity to learn about complex relationships in the data. It can minimize the interaction effects as it returns 0 for negative values. This function is linear and nonlinear for two halves of the input data. It is primarily implemented in the hidden layer due to the formation of dead neurons. RELU function is computationally efficient because it has zero derivatives for negative numbers and 1 for positive numbers; due to this, some of the neurons get activated. Its function is shown in Eq. (2).
The f(x) function returns a maximum value between 0 and x.
It is a nonlinear feed-forward activation function defined for actual input values. It has a value between 0 and 1. It is a smoothing function that is useful for derivation and classification. To calculate gradients in the neural network, derivation is required. Calculating the optimal parameters for neural network learning Using the constant derivative is impossible. It is not centered and has a vanishing gradient problem. As a result, learning is limited and time-consuming. It is mainly used in the output layer and works best for binary classification. Eq. (3) depicts the sigmoid function. This function was used to classify bipolar in the proposed CNN architecture.
The sigmoid function S(x) takes any real number x and returns a value between 0 and 1.
The pooled feature map is flattened before applying a fully connected layer. The proceeds data through hidden layers are flattened into a suitable column vector and fed to the fully connected layer. Then back-propagation is applied to each iteration of training. The fully connected layer is responsible for learning a nonlinear combination of high-level features. A fully connected layer has all its connections with the activation units of the layers that came before it. Using the Softmax classification method, the model can tell over time which features are dominant and which are not. It gives the feature map vectors for each category values between 0 and makes them the same. Normalization is done to obtain a means close to zero that accelerates the learning process and is a prime factor for faster convergence. Convergence is when CNN has reached a constant learning rate and does not improve further.
3.5 Hyper Parameters of the Proposed CNN Architecture
This CNN architecture hypermeter is used to prevent over-fitting. This improves the model’s efficiency and generalizability. It has a value between 0.0 and 0.9. For network weight thinning, nodes are temporarily removed from the CNN along with all their incoming and outgoing connections based on the fixed probability value given. The proposed CNN model became overfitted when the dropout value was set to zero (0). Similarly, when it was set to 9, no learning resulted. Therefore, the proposed CNN architecture has an empirically determined value of 0.5.
Batch size is a gradient descent hypermeter that refers to the number of samples in the forward and backward pass before evaluating the internal model limitations. The batch size could be 32, 64, 128, 256, 512, etc. Since there are many frames to train the model, training time reached unaffordable limits when the batch size was set to 32. Therefore, the batch size in the proposed CNN architecture is set to 128 as a moderate value.
Momentum is used to overcome the noisy gradient or bounce the gradient by accelerating the search movement in a direction to create inertia (constant movement). Descent momentum is used to optimize the gradient’s performance. It generally reduces error and improves the learning algorithm’s performance. It prevents optimization process hedging. It assists CNN in breaking out local minima so that a global minimum can be found. Most momentum values are close to one, such as 0.9 or 0.99. The proposed CNN architecture has an empirically determined momentum value of 0.9.
The learning rate is augmented or diminished concerning the error gradient by adjusting the neural network’s weights. It is the most critical gradient descent hypermeter and is responsible for stable and smooth training. The learning rate, accuracy, and time required to train the model are all factors to consider. The learning rate ranges from 0.0 to 1.0. In the proposed CNN architecture, the learning rate is set to 0.001.
Fig. 1 represents the architecture of the proposed CNN model. Table 3 represent the summary of the proposed CNN architecture. An overview of the proposed study is demonstrated in Fig. 2.
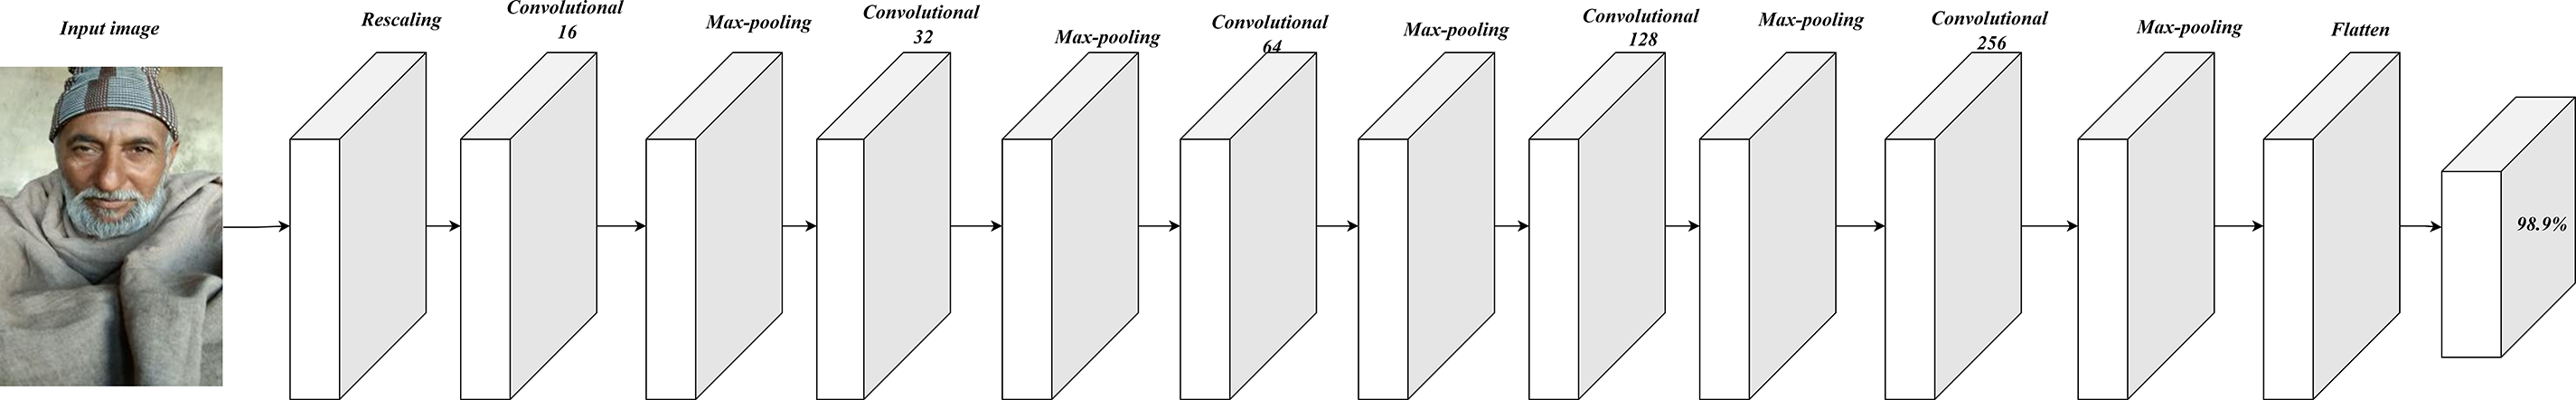
Figure 1: The proposed CNN architecture for bipolar detection
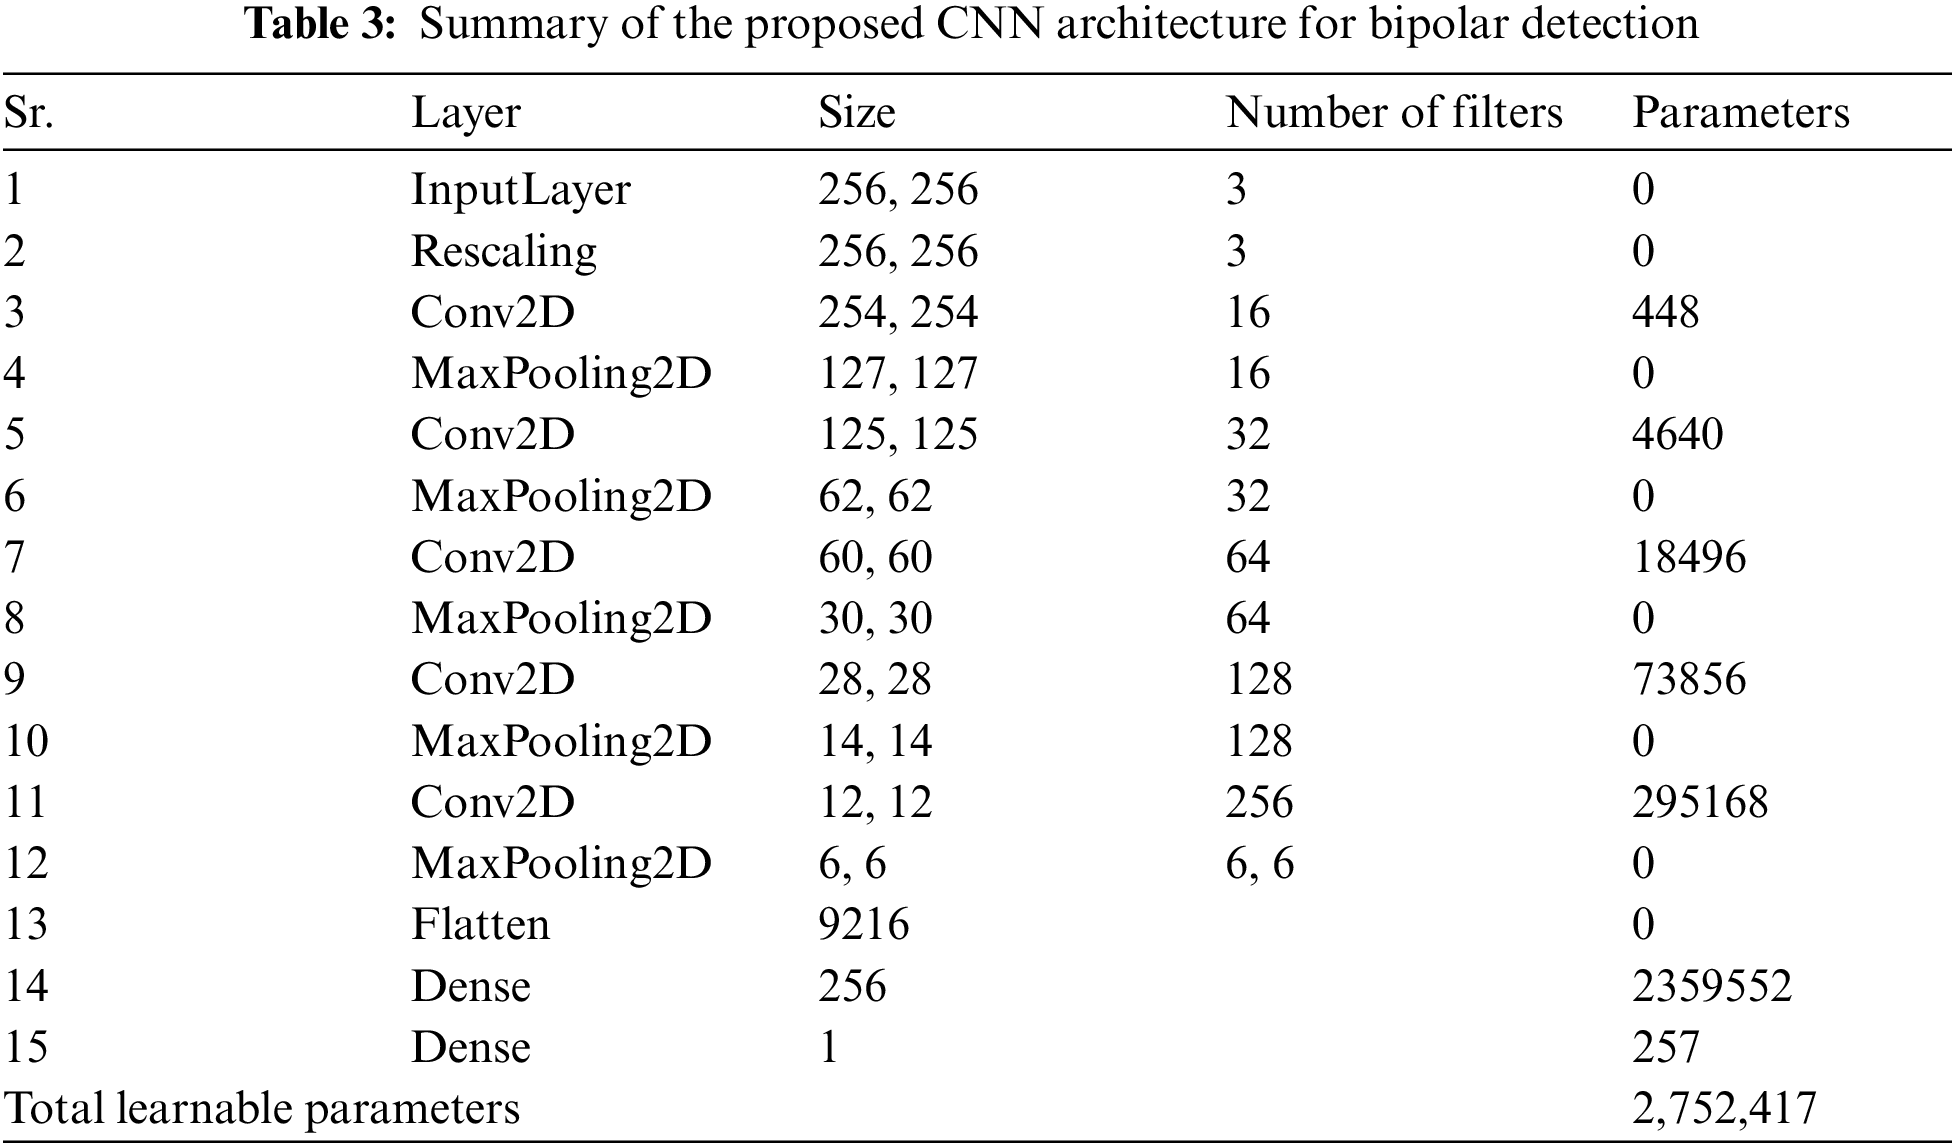

Figure 2: Overview of the proposed methodology
So that system could get subsamples from the video, frames were taken so that one frame out of every two consecutive frames was discarded. So, the dataset of 502 controls produced 8, 50,440 data frames, of which 5, 25,000 belonged to bipolar, while 3,25,440 belonged to healthy controls. Due to the fleeting and subtle nature of micro-expressions, it was a risk of losing them if more frames were dropped. This explains why additional frames were not dropped. Initially, the experiments for bipolar detection from the noisy frames were done using pre-trained state-of-the-art CNN-based models, i.e., Rest-net 18, Squeeze-net, and Alex-net, and the proposed CNN-based model. However, the model was overturned because of the noise present in the frames. Then, to eliminate the noise, these frames are added to the OpenFace tool for aligned faces, 2D landmarks, and AUs and to extract features, including gaze, pose, and landmarks. The proposed and these pre-trained CNN-based model were applied to aligned faces to detect BD and healthy control. SVM, KNN, and DT were also used to classify AUs, gaze, pose, and landmarks features. These features were also combined and used to classify Using SVM, KNN and DT to detect BD and healthy control.
70% of the dataset is used for training, 20% for testing, and the rest for 10% for validation. The results of all experiments are shown in Table 4. It is evident from Table 4 that only six pose features have obtained 95.4% validation accuracy when extracted from aligned images. Similarly, gaze features, 288 in number, gained lower classification rates. When only AUs features were extracted, it obtained 90.0% validation accuracy, which is reasonable. Fe features have an excellent classification rate, i.e., 99.9%, 98.7%, and 98.9% for accuracy archived against different classifiers, i.e., SVM, KKN and DT, respectively. To verify whether all these features collectively improve accuracy, these were combined, which achieved a remarkable classification rate of 99.9%, which is the maximum it can be Using SVM. All about SVM seems good; however, feature engineering is required. Therefore, aligned images are also classified Using CNN-based models, which do not need features to extract explicitly. When aligned, facial images were classified through Rest-net 18, Squeeze-net, and Alex-net obtained 98.0%, 97.0%, and 96.0% validation accuracy, respectively. This is also reasonable. However, all these pre-trained models have a large volume of learnable (parameters), significantly increasing the training time of a respective model. However, the proposed model consumes only 15 layers with 2,752,417 parameters. Therefore, it could be considered light-weight and requires less training time, achieving 98.9% validation accuracy. The accuracy obtained through the proposed CNN model is significantly higher than the pre-trained model. Therefore, it is more favorable for real-time bipolar detection from facial images.

The results from our model are compared with other recent studies on detecting bipolar disorder from videos and images, shown in Table 5.

In this study [6], an audio-visual LSTM & audio-visual-textual LSTM, both architectures based on recurrent neural network architectures (RNN) used to recognize BD and depression from two datasets, i.e., the BD Corpus and the Well-being dataset. Achieved results Using audio-visual LSTM from BD corpus’s as per accuracy = 91.6%, and from Well-being dataset’s as per F1 score = 0.870, and feed-forward neural network based adaptive nonlinear judge classifier used, achieved results from this classifier as per accuracy = 91.7%. This study improved by adding different samples (audio, visual and textual) of the same patients.
This study [17] classified BD, BPD and combined BP/BPD patients Using the ML algorithm. The diagnostic accuracy of ML was 79.6% for distinguishing between BD/BPD and 61.7% for BPD/BD. The accuracy of the results is low. This study [9] includes people who met the inclusion criteria at the Bipolar Outpatient Clinic of Eskisehir Osman Gazi University, Turkey. The Polyhedral Conic Functions algorithm was used to classify participants based on six CANTAB neurocognitive tests. This study achieved 78.0% of bipolar patients distinguished from healthy controls. The accuracy of this study is quite low. In another paper [18], MDD and BD were detected Using a machine learning predictive model. Achieved results as per AUC = 0.97, accuracy (MDD = 92.0%, BD = 86.0%). Patients were recruited from a single center and ethnic group, limiting generalizability.
Although another study [11], the benchmark dataset AVEC-18 is used to classify the BD state. CNN is used for the classification of facial features from video recordings. LSTM is used to classify extracted features from facial images and achieved results from this proposed model as per UAR = 60.7%. Single modalities (Facial images) are used for classification. In another study [12], Fisher Vector encoding features were extracted Using multimodal fusion and OpenSmile. Achieved results Using Fisher Vector encoding as per UAR = 57.4% Achieved UAR are not very high. In another study [13], the IncepLSTM framework was used to categorize BD severity. CNN with different filters were used to classify BD patients, and LSTM was used to classify extracted features. Results achieved Using IncepLSTM as per accuracy = 65.0%. They achieved accuracy Using IncepLSTM id low.
The proposed study refers to implementing its own designed CNN-based model and state-of-the-art CNN-based models that have already been developed. Experiments have been done in several ways. Both pre-trained and reported models are utilized to classify the noisy dataset. Models get overturned on noisy datasets in both ways. OpenFace is a tool for aligning faces and extracting features from noisy datasets. The aligned faces are classified using the proposed model and achieved a validation accuracy of 98.9%. Meanwhile, the SVM, KNN, and DT models have been used to classify extracted features and obtained validation accuracy of 99.9%, 98.7%, and 98.9%, respectively.
Bipolar disorder is one of the most severe mental health issues people face. Significant indicators of mania or depression can be found in facial AUs, which can aid in diagnosing bipolar disorder. Although several research has attempted to predict the detection of bipolar disorder from these visual cues, their models have not fared well on evaluation measures. Thus, they proposed a CNN and SVM-based multimodal bipolar detection system trained on a locally collected dataset. The experimental results showed a validation accuracy of 98.9% for the proposed CNN model and the extracted features Using SVM, KNN, and DT with an accuracy of 99.9%, 98.7%, and 98.9%, respectively. Also, the outcomes demonstrated the stated method’s superiority over the current best practices. Real-time bipolar detection from low-resolution digital camera videos is made more accessible by the proposed lightweight CNN-based model, which has fewer layers and parameters but is perfectly tuned to provide robust performance.
In the future, speech, gait, written samples, and MRI scans will be employed for the classification of mental diseases, and more disorders will be detected using customized CNN, other CNN-based pretrained models, and standard machine learning models, such as SVM, KNN, DT, etc.
Acknowledgement: The researchers would like to thank the BVH Hospital, Bahawalpur, Pakistan staff for their cooperation in providing the dataset.
Funding Statement: Self-funded; no external funding is involved in this study.
Author Contributions: G.G. gave the idea of the research topic, selected the title name, and assisted in the whole research work; S.C. wrote the paper and made a model to perform experiments on the dataset. A.L. helped in the writing of literature review. Similarly, A.S. and M.A. helped in datasets collection from different private and Government hospitals. H.U. and D.O. helped in finalizing & validating the outcomes of the conducted research work.
Availability of Data and Materials: The dataset was obtained from BVH Bahawalpur and other private hospitals. It is not publicly available yet, because of some codal formalities and legal involvements.
Conflicts of Interest: The authors declare that they have no conflicts of interest to report regarding the present study.
References
1. D. L. Sun et al., “Patient health questionnaire-15 (PHQ-15) to distinguish bipolar II disorder from major depressive disorder,” Psychiat. Res., vol. 290, pp. 113026, 2020. doi: 10.1016/j.psychres.2020.113026. [Google Scholar] [PubMed] [CrossRef]
2. A. Sasdelli, L. Lia, C. C. Luciano, C. Nespeca, D. Berardi and M. Menchetti, “Screening for bipolar disorder symptoms in depressed primary care attenders: Comparison between mood disorder questionnaire and hypomania checklist (HCL-32),” Psychiat. J., vol. 2013, 2013. doi: 10.1155/2013/548349. [Google Scholar] [PubMed] [CrossRef]
3. M. A. Takalkar and M. Xu, “Image based facial micro-expression recognition using deep learning on small datasets,” in 2017 Int. Conf. Digital Image Comput.: Tech. Appl. (DICTA), Sydney, NSW, Australia, 2017, pp. 1–7. [Google Scholar]
4. G. Gilanie et al., “An automated and real-time approach of depression detection from facial micro-expressions,” Comput. Mater. Con., vol. 73, no. 2, pp. 2513–2528, 2022. doi: 10.32604/cmc.2022.028229. [Google Scholar] [CrossRef]
5. Y. K. A. Kumar and A. K. Saxena, “Stochastic modelling of transition dynamic of mixed mood episodes in bipolar disorder,” Int. J. Electr. Comput. Eng., vol. 12, no. 1, pp. 620, 2022. doi: 10.11591/ijece.v12i1.pp620-629. [Google Scholar] [CrossRef]
6. F. Ceccarelli and M. Mahmoud, “Multimodal temporal machine learning for bipolar disorder and depression recognition,” Pattern Anal. Appl., vol. 25, no. 3, pp. 493–504, 2022. doi: 10.1007/s10044-021-01001-y. [Google Scholar] [CrossRef]
7. E. Çiftçi, H. Kaya, H. Güleç, and A. A. Salah, “The turkish audio-visual bipolar disorder corpus,” in 2018 First Asian Conf. Affect. Comput. Intell. Interact. (ACII Asia), Beijing, China, 2018, pp. 1–6. [Google Scholar]
8. A. Bayes, M. Spoelma, and G. Parker, “Comorbid bipolar disorder and borderline personality disorder: Diagnosis using machine learning,” J. Psychiat. Res., vol. 152, pp. 1–6, 2022. doi: 10.1016/j.jpsychires.2022.05.032. [Google Scholar] [PubMed] [CrossRef]
9. H. O. Sonkurt, A. E. Altınöz, E. Çimen, F. Köşger, and G. Öztürk, “The role of cognitive functions in the diagnosis of bipolar disorder: A machine learning model,” Int. J. Med. Inform., vol. 145, pp. 104311, 2021. doi: 10.1016/j.ijmedinf.2020.104311. [Google Scholar] [PubMed] [CrossRef]
10. S. Poletti et al., “A peripheral inflammatory signature discriminates bipolar from unipolar depression: A machine learning approach,” Prog. Neuro-Psychopharmacol. Biol. Psychiat., vol. 105, pp. 110136, 2021. doi: 10.1016/j.pnpbp.2020.110136. [Google Scholar] [PubMed] [CrossRef]
11. N. Abaei and H. Al Osman, “A hybrid model for bipolar disorder classification from visual information,” in ICASSP, Ottawa, Canada, 2020, pp. 4107–4111. [Google Scholar]
12. Z. S. Syed, K. Sidorov, and D. Marshall, “Automated screening for bipolar disorder from audio/visual modalities,” in Proc. 2018 Audio/Vis. Emotion Chall. Workshop, Seoul, Korea, 2018, pp. 39–45. [Google Scholar]
13. Z. Du, W. Li, D. Huang, and Y. Wang, “Bipolar disorder recognition via multi-scale discriminative audio temporal representation,” in Proc. 2018 Audio/Vis. Emotion Chall. Workshop, Seoul, Korea, 2018,pp. 23–30. [Google Scholar]
14. T. Baltrusaitis, A. Zadeh, Y. C. Lim, and L. P. Morency, “OpenFace 2.0: Facial behavior analysis toolkit,” in 2018 13th IEEE Inte. Conf. Autom. Face & Gesture Recognit. (FG 2018), Xi’an, China, 2018, pp. 59–66. [Google Scholar]
15. Z. Wang et al., “Spatial-temporal graph-based AU relationship learning for facial action unit detection,” in Proc. IEEE/CVF Conf. Comput. Vis. Pattern Recognit., Vancouver, Canada, 2023, pp. 5898–5906. [Google Scholar]
16. J. Yang, F. Zhang, B. Chen, and S. U. Khan, “Facial expression recognition based on facial action unit,” in 2019 Tenth Int. Green Sustain. Comput. Conf. (IGSC), Alexandria, VA, USA, 2019, pp. 1–6. [Google Scholar]
17. A. Bayes, M. Spoelma, and G. Parker, “Comorbid bipolar disorder and borderline personality disorder: Diagnosis using machine learning,” J. Psychiat. Res., pp. 1–2, 2022. doi: 10.1016/j.jpsychires.2022.05.032. [Google Scholar] [PubMed] [CrossRef]
18. S. Poletti et al., “A peripheral inflammatory signature discriminates bipolar from unipolar depression: A machine learning approach,” Prog. Neuro-Psychopharmacol. Biol. Psychiat., vol. 105, pp. 110136, 2021. doi: 10.1016/j.pnpbp.2020.110136. [Google Scholar] [PubMed] [CrossRef]
Cite This Article
 Copyright © 2024 The Author(s). Published by Tech Science Press.
This work is licensed under a Creative Commons Attribution 4.0 International License , which permits unrestricted use, distribution, and reproduction in any medium, provided the original work is properly cited.
 Downloads
 Citation Tools