
 Submit a Paper
 Propose a Special lssue
 Open Access
ARTICLE

Diagnosing Retinal Eye Diseases: A Novel Transfer Learning Approach
1 Department of Computer Engineering (CE), College of Computer Science and Information Technology (CCSIT), Imam Abdulrahman Bin Faisal University, Dammam, 31441, Saudi Arabia
2 Department of Computer Science (CS), College of Computer Science and Information Technology (CCSIT), Imam Abdulrahman Bin Faisal University, Dammam, 31441, Saudi Arabia
3 Science Technology Unit, Umm Al-Qura University, Makkah, 21955, Saudi Arabia
4 Deanship of Postgraduate Studies and Research, Umm Al-Qura University, Makkah, 21955, Saudi Arabia
5 Information & Computer Science Department, King Fahd University of Petroleum and Minerals, Dhahran, 31261, Saudi Arabia
* Corresponding Author: Atta Rahman. Email:
(This article belongs to the Special Issue: Medical Imaging Decision Support Systems Using Deep Learning and Machine Learning Algorithms)
Intelligent Automation & Soft Computing 2025, 40, 149-175. https://doi.org/10.32604/iasc.2025.059080
Received 27 September 2024; Accepted 23 December 2024; Issue published 12 February 2025
 View Full Text
 Download PDF
Abstract
This study rigorously evaluates the potential of transfer learning in diagnosing retinal eye diseases using advanced models such as YOLOv8, Xception, ConvNeXtTiny, and VGG16. All models were trained on the esteemed RFMiD dataset, which includes images classified into six critical categories: Diabetic Retinopathy (DR), Macular Hole (MH), Diabetic Neuropathy (DN), Optic Disc Changes (ODC), Tesselated Fundus (TSLN), and normal cases. The research emphasizes enhancing model performance by prioritizing recall metrics, a crucial strategy aimed at minimizing false negatives in medical diagnostics. To address the challenge of imbalanced data, we implemented effective preprocessing techniques, including cropping, resizing, and data augmentation. The proposed models underwent fine-tuning and were evaluated using established metrics such as accuracy, precision, and recall. The experimental results are compelling, with YOLOv8 achieving the highest recall rates for both normal cases (97.76%) and DR cases (87.10%), demonstrating its reliability in disease screening. In contrast, Xception showed a decline in recall after fine-tuning, particularly in identifying DR and MH cases, highlighting the need for a careful balance between sensitivity and specificity in model training. Notably, both ConvNeXtTiny and VGG16 exhibited significant improvements post-fine-tuning, with VGG16’s recall for normal conditions increasing dramatically from 40.30% to an impressive 89.55%. These findings clearly underscore the potential of utilizing pre-trained models through transfer learning for the effective detection of retinal eye diseases, ultimately contributing to improved patient outcomes in medical diagnostics.Keywords
Vision impairment and blindness are significant global public health issues, affecting an estimated 2 billion people worldwide, which makes up around 26% of the global population [1]. The retina, a vital part of vision, can be impacted by various disorders such as age-related macular degeneration (AMD), diabetic retinopathy (DR), glaucoma, and cataracts, leading to vision loss or blindness in millions of individuals [2]. Recent reports from the World Health Organization (WHO) indicate that refractive errors, cataracts, glaucoma, AMD, and DR account for over 75% of global distance vision impairment or blindness cases, affecting more than 1.5 billion people worldwide [3]. These statistics highlight the enormity of the challenges posed by ocular diseases on a global scale. Additionally, there are concerns about the increasing burden of ocular diseases in the coming decades due to factors such as population growth, aging demographics, rapid urbanization, and lifestyle changes, particularly in low- and middle-income countries [3]. By 2050, the global prevalence of vision impairment is expected to increase by 20%, affecting over 2.4 billion people [4]. Early diagnosis and timely intervention are crucial in preventing irreversible vision loss and slowing the progression of degenerative retinal diseases. However, the manual interpretation of retinal images by healthcare professionals can be time-consuming and prone to variability, leading to delayed diagnosis and treatment [5,6]. In response to these challenges, computer-aided diagnosis (CAD) systems have emerged as promising tools to enhance clinical decision-making in ophthalmology. These systems utilize advanced technologies, such as deep learning (DL) techniques, to automate the analysis and interpretation of retinal images, aiding in early disease detection and intervention [7]. DL methods, including Convolutional Neural Networks (CNNs) and transformer architectures, have shown remarkable efficacy in automated disease diagnosis, achieving sensitivity and specificity rates exceeding 90% in some cases [8–10]. Recent research efforts have focused on leveraging DL models and transfer learning paradigms to improve the detection and classification of prevalent retinal diseases, such as AMD, DR, and glaucoma.
A brief review of the literature highlights a concerning trend: most studies concentrate solely on the detection and classification of individual diseases. These investigations often utilize binary classification (presence or absence) and multi-class classification to evaluate disease severity. However, research into multiple retinal eye diseases is notably scarce, especially within the Kingdom of Saudi Arabia. The existing studies that do address multiple retinal eye diseases typically show inadequate performance and demand significant improvements. Alarmingly, the WHO’s survey reveals that retinal eye diseases are rapidly increasing globally, as depicted in Fig. 1 [1]. This underscores the urgent need for comprehensive research efforts to tackle this growing health concern.
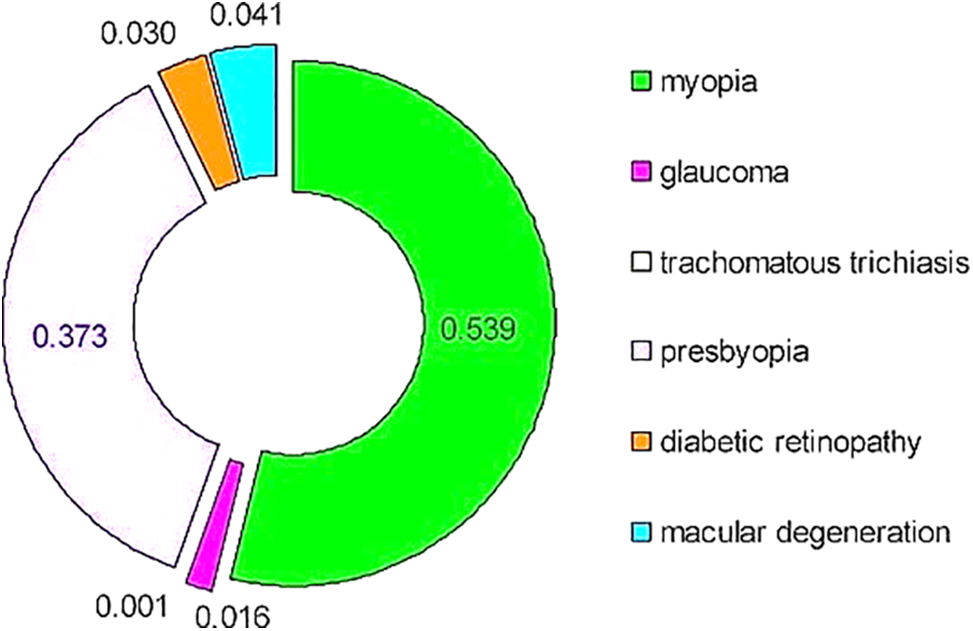
Figure 1: Eye diseases causing visual impairment (2020) [1]
This study introduces a new multi-label classification system based on multi-label classification and transfer learning for detecting five critical retinal diseases simultaneously: DR, media haze, tessellation disease, drusen disease, and optic disc cupping. These diseases collectively contribute to over 60% of global vision impairment cases caused by retinal disorders [3]. The selection of these diseases is based on their clinical significance and prevalence, with DR alone affecting nearly 93 million individuals worldwide [11]. The study uses Xception, VGG16, ConvNeXtTiny, and YOLOv8 models. The system aims to address the challenges associated with early detection and accurate diagnosis of vision-threatening conditions. The primary motivation for this research is the efficient and accurate multi-disease detection in retinal images. Many patients may have multiple co-occurring retinal diseases, requiring a multi-label classification approach for a comprehensive diagnosis. Early detection and monitoring of these conditions are crucial for timely intervention and prevention of permanent vision loss [12]. Moreover, the study is among the preliminary studies in the Kingdom of Saudi Arabia and a potential contribution towards the Kingdom’s Vision 2030.
The main contributions of this work are:
• Development of a multi-label classification framework based on DL for the simultaneous diagnosis of interleaved retinal diseases from color fundus images.
• Evaluation of the proposed framework’s effectiveness using a recent publicly available multi-label dataset containing a wide variety of challenging retinal diseases.
• Comparison of the proposed framework’s performance with state-of-the-art methods and built-in models using various evaluation metrics.
• Extension of the proposed framework’s capability to detect a broader range of retinal diseases.
The rest of the paper is organized as follows: Section 2 contains background and a review of the literature. Section 3 is dedicated to comprehensive methodology while Section 4 provides the results of experiments. Section 5 discusses the findings of the study while Section 6 concludes the paper.
2 Background and Review of Literature
DR is a complication of diabetes that damages retinal blood vessels, leading to vision loss [13]. Early detection is crucial for preventing vision loss. Media haze (MH) refers to haziness or distortion in the eye’s cornea and lens and can indicate various eye conditions [14]. Optic disc cupping (ODC) helps diagnose glaucoma, which causes nerve damage and vision loss [15]. Tessellation disease (TSLN) is often associated with myopia and appears as a pattern in retinal pigmentation, while drusen diseases (DN) involve yellow deposits beneath the retina and are linked to age-related macular degeneration (AMD) [16,17]. Although articles employing machine-learning techniques to predict certain eye conditions using retinal data were found, specialized articles addressing Tessellation or Drusen Diseases were not identified in our search.
In a recent study [18], authors developed a model to identify 45 eye diseases by analyzing color fundus images from the retinal fundus multi-disease image dataset (RFMID) [19]. The model was built using a multi-label convolutional neural network (ML-CNN). The ensemble network achieved an area under the receiver operating characteristic curve (AUROC) score of 0.9613 for disease screening (healthy vs. pathologic). The SE-ResNeXt architecture achieved the highest single network score of 0.9586. The average AUROC score for each class in individual disease classification was 0.9295. In [20], researchers developed a deep-learning model to detect early signs of 20 diseases in fundus images. The study involved using various deep learning models, including MobileNetV2, EfficientNetV2M, ResNet125V2, EfficientNet-B7, DenseNet-201, and XceptionNet, along with ensemble learning techniques investigated on RFMID [19]. The results obtained by the researchers showed a significant accuracy rate, specifically 76.92% for multi-disease detection and 96.98% for risk classification.
In a study [21], researchers developed a model to detect retinal diseases early on and differentiate among 27 different conditions from RFMID [19]. The model was built using ensemble learning and transfer learning techniques, and various architectural frameworks were used to create multiple models, resulting in the following AUROC scores: Logistic Regression achieved an AUROC of 0.999, EfficientNetB4 achieved an AUROC of 0.993, DenseNet201 recorded an AUROC of 0.980, InceptionV3 exhibited an AUROC of 0.932, ResNet151 attained an AUROC of 0.970, and DenseNet201 registered an AUROC of 0.973. In a recent study [22], the researcher’s model successfully identified 45 eye diseases by analyzing color fundus images from RFMID [19]. The model used a machine learning convolutional neural network (ML-CNN) for its construction. Other models such as InceptionresNetv2, DenseNet201, MobileNetV2, InceptionV3, and SeResNext50 were also developed. However, the ML-CNN outperformed these models, achieving an accuracy (ACC) of 94.3%, a precision of 91.5%, a recall rate of 80%, an area under the curve (AUC) of 96.7%, and a Dice similarity coefficient (DSC) of 99%.
In a study [23], the authors focused on identifying four common eye diseases in healthy individuals: glaucoma, maculopathy, pathological myopia, and Retinitis pigmentosa. They suggested using MobileNetV2, a deep learning architecture that leverages transfer learning. MobileNetV2 is designed to reduce network size while maintaining prediction accuracy by focusing on minimizing the network’s size and addressing the gradient vanishing issue through residual connections. To extract features, TensorFlow was used, with each block containing ReLU6 activation and batch normalization.
In [24], the authors described a method for predicting DR using pre-trained ConvNets like VGG16, NASNet, Xception Net, and Inception ResNetV2. The experimental study evaluates the performance of a model built using blended feature representations on retinal images from the Kaggle APTOS 2019 challenge [25]. This challenge involves a diverse set of retinal images captured through fundus photography in various imaging conditions. The results demonstrate that the proposed model outperforms existing methods. The images are rated on a scale from zero to four to identify different severity levels (0—no DR, 1—mild, 2—moderate, 3—severe, and 4—proliferative DR). Each experiment involved training with 80% of the data and validation with the remaining 20%. The research also indicates that the most effective method for DR recognition involves cross-mean pooling-based fusion of features from Xception and VGG16. The proposed model can predict severity levels with an accuracy of 81.7% and a kappa value of 71.1%. Additionally, it can recognize DR with an accuracy of 97.41% and a kappa statistic of 94.82. In their research, the authors used a deep neural network model with the Grey Wolf Optimization (GWO) algorithm to analyze characteristics extracted from the Diabetic Retinopathy Debrecen dataset. They selected the ideal training parameters for the model using GWO and utilized the dataset from the UCI machine learning library. The dataset consists of 1151 cases and 20 attributes. The study divided the dataset, using 20% for validation and testing, and the remaining 80% for training. The researchers converted, standardized, and eliminated misfits in the dataset using the standard scaler approach. They then employed Principal Component Analysis (PCA) to extract relevant features. The researchers compared their model with other classifiers such as Support Vector Machine (SVM), Naïve Bayes Classifier, Decision Tree, and XGBoost, and found that the DNN-PCA-GWO algorithm outperformed the others, achieving 97.3% accuracy. They also noted that using PCA as a pre-processing technique significantly reduced the training time while maintaining the model’s performance [26,27].
The study [28] discussed a transfer learning approach for classifying retinal disorders using a neural network model designed for mobile and early diagnosis. Although the specific dataset used is not explicitly named, it consists of retinal images categorized as healthy, glaucoma-related, and diabetic. While the exact algorithm is not specified, it is suggested that a neural network model using transfer learning was employed. According to the publication, the proposed model achieved a peak accuracy of 90.52% with a learning rate of 0.01 and 100 epochs. It is mentioned that adjusting the number of epochs and learning rate could affect accuracy. Nonetheless, the study consistently reports accuracy levels above 90%, demonstrating the reliability and utility of the model for classifying retinal disorders.
The goal of the study [29] was to introduce a new deep-learning system aimed at predicting the progression of DR in individual patients using color fundus images. This research employed a DCNN by utilizing color fundus photos (CFPs) taken during a single visit from patients with DR. The DCNN was trained to anticipate the advancement of diabetic retinopathy (DR). The algorithm was specifically designed to forecast a 2-step deterioration on the Early Treatment Diabetic Retinopathy Severity Scale and was trained using DR severity scores assessed at 6, 12, and 24 months after the initial visit by experienced human reading center graders, who were masked to the patient’s information. The dataset for this study comprised CFPs obtained from two large, similarly designed, placebo-controlled, double-masked, phase 3 clinical trials (RIDE [NCT00473382] and RISE [NCT00473330]) [30,31]. These images were taken from patients with DR and diabetic macular edema (DME) during their baseline and subsequent visits at 6, 12, and 24 months. The deep learning system described in this study achieved its best performance, with an area under the curve (AUC) of 0.79, in predicting the development of DR at the 12-month mark.
In a recent article [32], the authors presented a method for predicting diabetic retinopathy (DR) that relies on individual risk factors. They used a combination of a deep neural network (DNN) and recursive feature elimination (RFE) for their research, which was based on a dataset of 115,000 patients. The results showed highly accurate DR predictions. The main algorithm involved using a DNN to categorize diseases and RFE to eliminate irrelevant characteristics. Although the authors compared their approach with other machine-learning techniques, they did not specify the algorithms used. They applied their method to an unspecified publicly available dataset to predict early DR. In the publication, they referenced the NHISS Korea dataset [33], which includes risk variables from 1000 individuals, 239 of whom have diseases like hypertension and diabetes. The authors achieved remarkably high accuracy using their proposed technique, with an F1-score, accuracy, precision, sensitivity, and AUC all reaching 96.5%. These results were obtained through stratified 10-fold cross-validation, and the authors found that their approach, utilizing DNN with RFE, outperformed other machine learning techniques.
A study cited in [34] discusses glaucoma detection using fundus images by exploring modified Gauss-Kuzmin-distribution-based Gabor (GKDG) features within a two-dimensional (2D) Flexible Analytical Wavelet Transform (FAWT). The findings indicate that the proposed glaucoma classification model outperforms existing techniques. This model was evaluated using tenfold cross-validation, achieving an impressive accuracy of 95.84%, a specificity of 97.17%, and a sensitivity of 94.55%.
Similarly, another study mentioned in [35] examines hybrid intelligent techniques for diagnosing diabetic retinopathy. The researchers utilized k-Nearest Neighbors (kNN), Support Vector Machine (SVM), and Histogram-based Gradient Boosting (HGB) machine learning algorithms on the APTOS dataset. The SVM algorithm yielded the highest accuracy at 96.9%, followed closely by kNN and HGB at 95.6%.
In addition, a fuzzy rule-based system-assisted approach for retinal disease classification was proposed in [36]. This study investigated two classifiers: rule-based (RB) and Stochastic Gradient Boosting (SGB). The efficiency of these algorithms in multi-class classification on unbalanced data was evaluated using two indicators: the multi-class area under the curve (MAUC) and the multi-class Matthews correlation coefficient (MMCC). The results indicated a 5%–8% increase in accuracy compared to traditional methods.
Another approach explored extended fuzzy logic for detecting diabetic retinopathy, as mentioned in [37]. Instead of solely focusing on overt symptoms, this method identifies subtle similarities in retinal irregularities between diabetic patients and non-diabetic individuals. To quantify these similarities, the ‘f-validity’ value was calculated based on diabetic retinopathy risk factors and associated symptoms, which were then transformed into membership function values. The aggregation of these values was accomplished using the Ordered Weighted Averaging (OWA) operator. Experimental results of this method aligned well with expert expectations, achieving an accuracy of 90%, a precision of 92.2%, and a sensitivity of 75%.
Studies indicate that deep learning has the potential for the automated analysis of retinal images. However, the datasets used in these studies are often limited in size, diversity, and balance across various disease classes. Many research efforts relied on small, homogeneous datasets that focused on specific patient populations. Furthermore, there is a lack of thorough external validation using large, real-world datasets. Other challenges include the risk of model overfitting, suboptimal optimization for clinical applications, and a narrow emphasis on accuracy instead of overall clinical suitability.
Most models focus solely on retinal diseases, disregarding how other eye conditions could affect performance. Additionally, there has been little analysis of how factors such as image quality influence algorithm outcomes. As a result, the generalizability and cost-effectiveness of these models outside specific research settings remain uncertain.
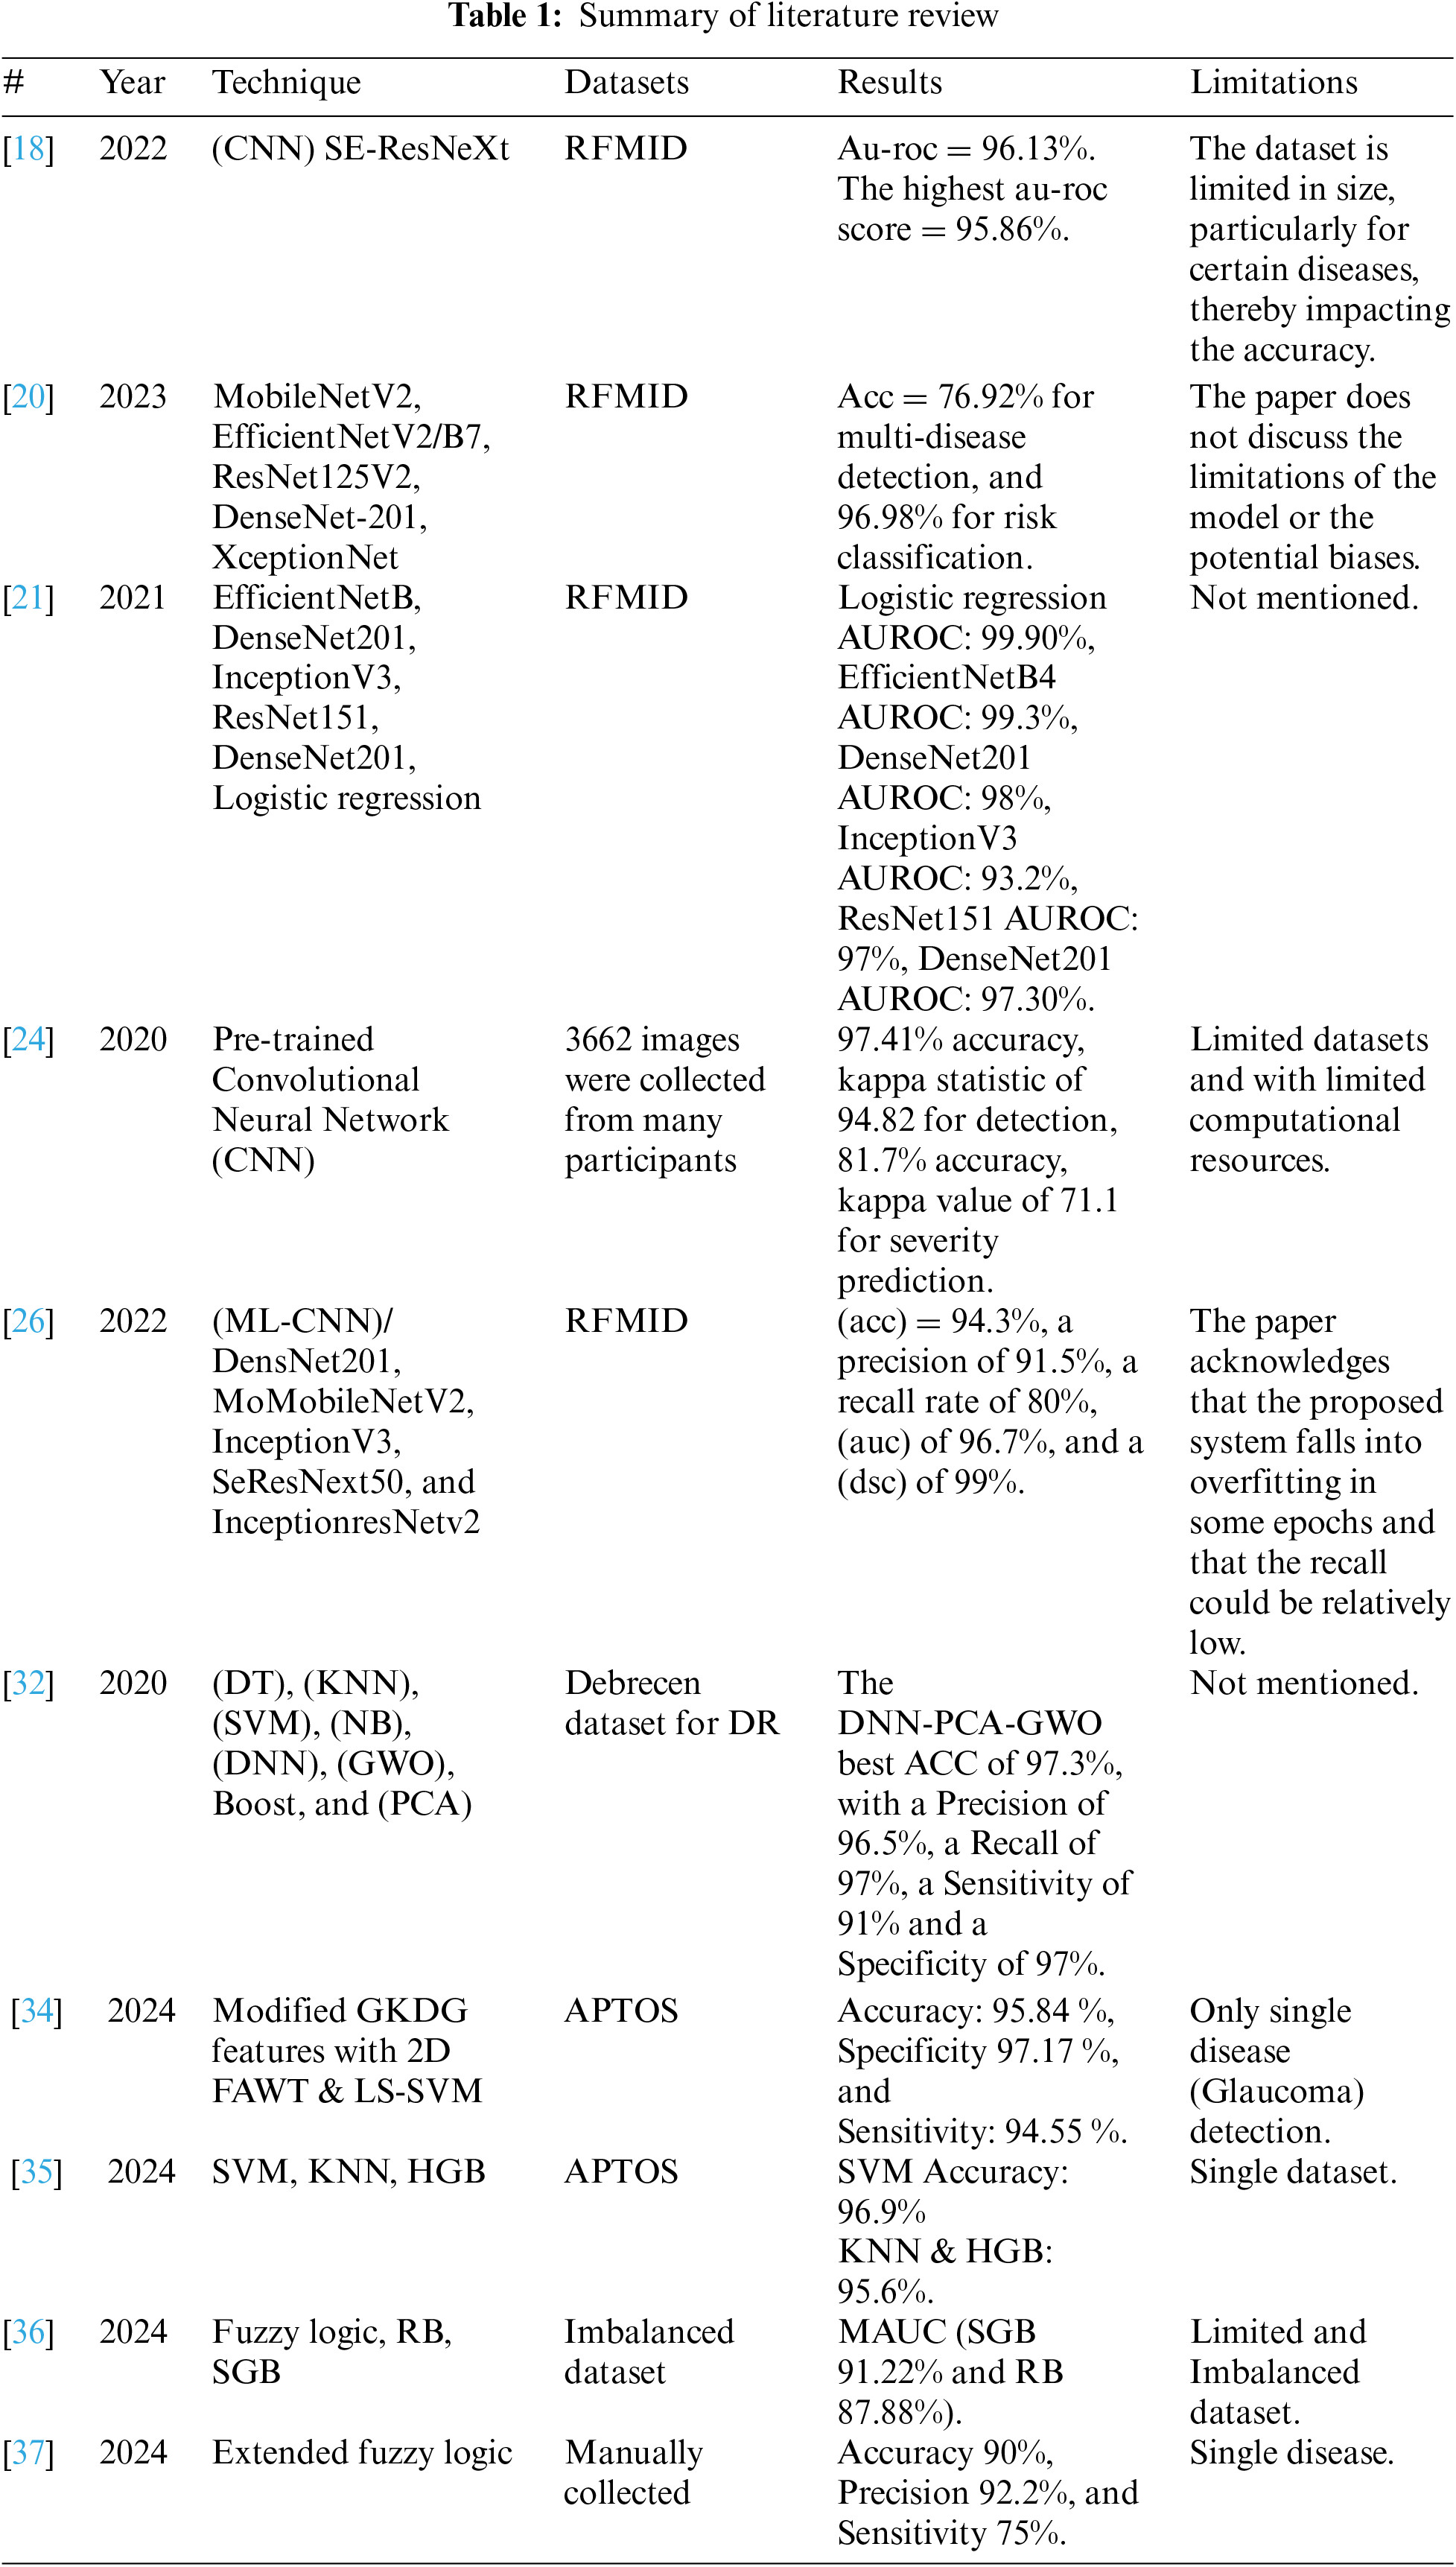
To address these gaps, the proposed study developed a transfer learning model to enhance the practical application of deep learning technologies beyond theoretical success. Acknowledging the limitations of direct clinical trials for validating these models, we rigorously tested them using the best available evaluation techniques. By focusing on metrics like recall and precision and employing robust data preprocessing and augmentation strategies, we aimed to ensure that the models are not only accurate but also reliable in correctly identifying true positive cases of retinal diseases. The goal is to improve generalization and tackle the challenges identified in the literature. We intend to contribute to solving the generalization problem by implementing technical solutions. Table 1 provides a summary of recent and relevant literature.
The study employs Convolutional Neural Networks (CNN) as the primary technique and utilizes Transfer Learning to efficiently create and implement models. This approach leverages existing high-performance models such as Xception, VGG16, ConvNeXtTiny, and YOLOv8n-cls. By utilizing their pre-trained knowledge, we can reduce computational demands and maximize learning efficiency. This streamlined process simplifies the fine-tuning of models, allowing them to quickly adapt to specific tasks or domains, thereby expediting deployment and optimization. The framework will include systematic steps for selecting suitable pre-trained models, adjusting parameters, and integrating domain-specific data to enhance performance. This ensures an adaptable and robust solution for various computer vision applications. The section describing predefined computational intelligence-based systems and preprocessing methods used in the research will precede a detailed explanation of techniques such as CNN and architectures like Xception, VGG16, ConvNeXtTiny, and YOLOv8n-cls. Subsequent sections will introduce the performance metrics used to evaluate the proposed models, culminating in a summary of the entire chapter in the final section.
The RFMiD [19] dataset is a carefully curated collection of retinal fundus images intended to cover a wide range of retinal conditions. It consists of 3200 images and ground truth labels for 28 different categories, with separate sets for training, validation, and testing. Our focus is on six distinct classes: DR with 479 images, MH with 512 images, DN with 433 images, ODC with 516 images, TSLN with 523 images, and a normal class comprising 401 images. This deliberate distribution ensures a balanced representation of diverse retinal conditions for comprehensive analysis and classification. This dataset serves as a crucial resource for training and evaluating models, aiming to accurately identify and differentiate between these retinal conditions, thereby contributing to advancements in ophthalmic diagnostics and healthcare. The following preprocessing techniques have been employed.
1. Image Preprocessing: Data preprocessing is essential for reliable analysis and diagnosis. The raw retinal images undergo various procedures to enhance their quality and make it easier to detect abnormalities.
2. Data Exploration was a critical part of our research. This phase involved examining the types of variables and the distribution of diseases within the dataset. We carefully identified and managed imbalances in disease occurrences to improve our model’s learning process.
3. Cropping and resizing: We cropped the images to ensure that the retina filled the picture and then resized them to 224 × 224 pixels. These steps were important for standardizing the image dimensions and ensuring compatibility for subsequent analysis.
4. Data Augmentation: Up-sampling involves creating new instances of minority classes to balance the classes in a dataset. For instance, in our dataset, classes like Drusen (DN), Optic disc cupping (ODC), and Tessellation (TSLN) had fewer samples compared to other classes. We addressed this imbalance by randomly selecting instances and applying horizontal flipping, vertical flipping, and rotation by 90 degrees to increase their representation in the dataset and achieve better class balance.
5. Data normalization is a preprocessing technique used to rescale the values of numeric features in a dataset to a standard range. In Keras, each model such as Xception, VGG16, and ConvNeXt has specific preprocessing requirements. For Xception, the inputs should be preprocessed using Keras.applications.xception.preprocess_input, which scales the input pixels between −1 and 1. VGG16 requires calling keras.applications.vgg16.preprocess_input, which involves converting RGB images to BGR and zero-centering each color channel with respect to the ImageNet dataset, without scaling. Conversely, ConvNeXt models include preprocessing within the model itself, utilizing a Normalization layer. For ConvNeXt, the inputs should be float or uint8 tensors with pixel values ranging from 0 to 255. It is important to apply the appropriate preprocessing steps based on the specific model to ensure accurate and reliable results [38]. YOLOv8n-cls includes a Spatial Pyramid Pooling Fast (SPPF) layer for accelerated computation and utilizes batch normalization and SiLU activation functions for each convolution [39]. The head is decoupled to process objectless, classification, and regression tasks independently. Additionally, advanced techniques are employed, with transformation processes varying for each convolutional layer [40].
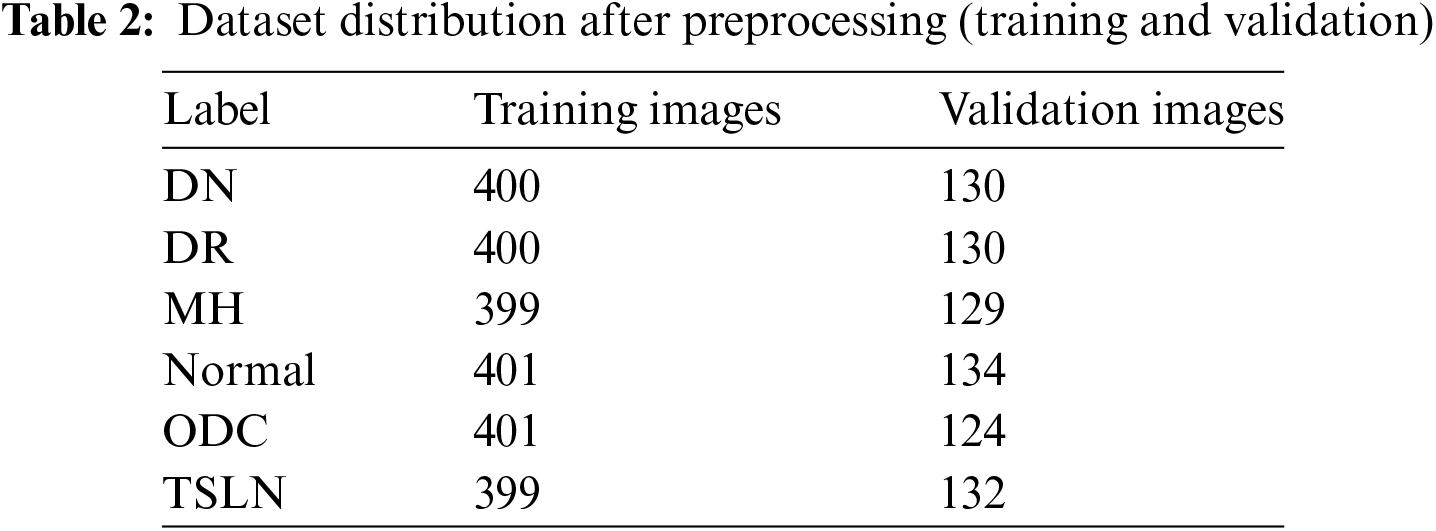
Initially, the dataset was split into a 60:20:20 ratio, comprising 1455 training images, 466 validation images, and 463 test images, all with multi-label annotations. Following preprocessing, the dataset was re-divided into a 67.5:21.9:10.6 ratio. Preprocessing, data augmentation, and up-sampling techniques were applied to the training and validation sets, resulting in 2400 training images and 779 validation images. However, no augmentation or up-sampling was conducted on the test set of 463 images as the aim was to evaluate model performance on unaltered, real-world images with multi-labeling.
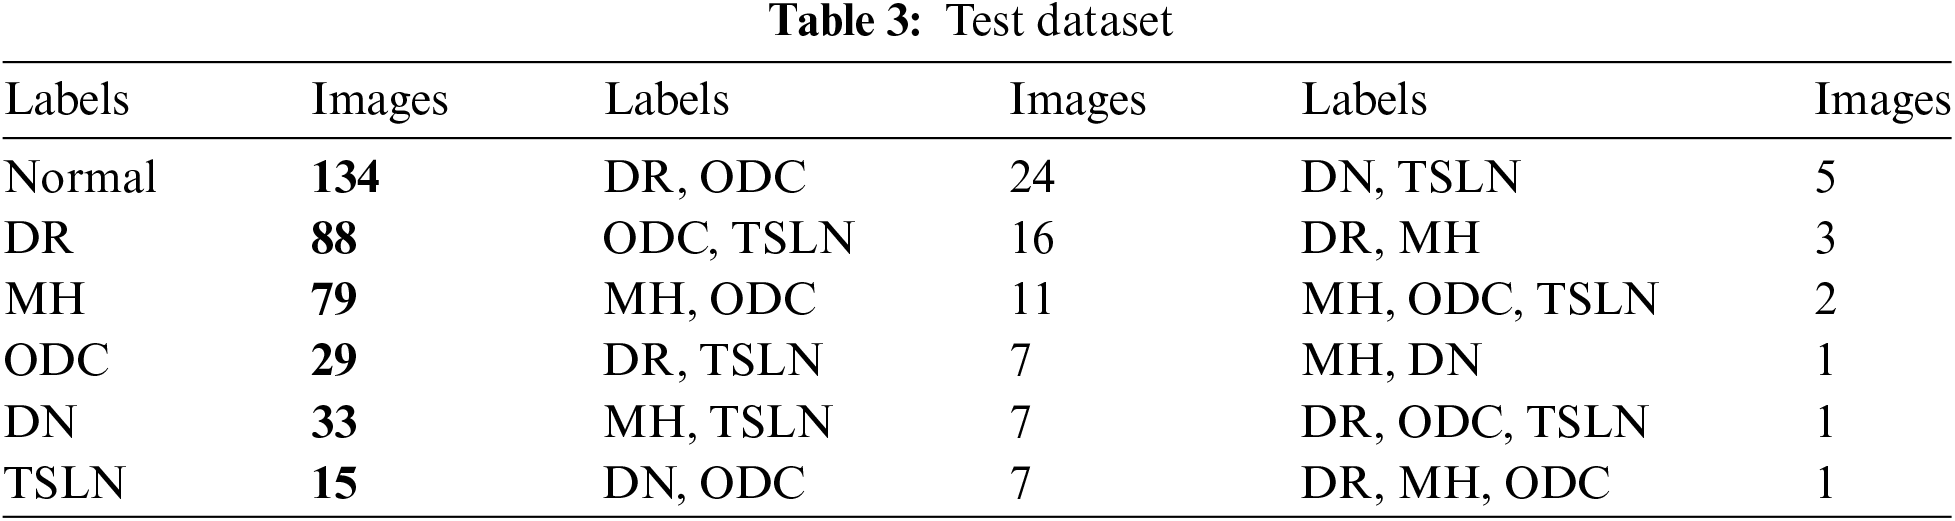
Nevertheless, preprocessing steps such as cropping, resizing, and normalization were carried out on the test set to ensure uniform image formatting and data integrity. Table 2 contains the data distribution for training and validation. While Table 3 provides lables distribution among the instances of test dataset.
Transfer learning is particularly effective for medical image analysis tasks, such as predicting retinal diseases, due to the limited availability of large, labeled medical image datasets [41]. By utilizing models that have been pre-trained on extensive general image datasets like ImageNet, transfer learning enables us to develop high-performance models using fewer medical images [42].
In the context of predicting retinal diseases, transfer learning has demonstrated state-of-the-art results. This is achieved by fine-tuning models that were initially trained on natural images and then retraining them on specific retinal image datasets [43]. This approach significantly reduces the computational resources and data requirements compared to training a model from scratch.
Using a single transfer-learned model for multiple retinal diseases offers several advantages over employing separate models:
1. A unified model architecture minimizes redundancy and decreases the likelihood of overfitting to any single disease, thereby enhancing the model’s generalizability to new disease cases [44].
2. With a shared feature representation, knowledge can be transferred between related diseases during multi-task learning, which can improve overall prediction performance [44].
3. From an operational perspective, a single model is more efficient to develop, validate, update, and deploy when compared to managing multiple models, simplifying real-world usage.
Therefore, transfer learning plays a crucial role in developing predictive frameworks for retinal eye diseases. Pre-trained deep learning architectures, such as Xception, VGG16, ConvNeXtTiny, and YOLOv8n-cls, serve as a foundation for transferring knowledge from large image datasets to the specialized area of retinal scans. Fine-tuning these models with a comprehensive array of retinal images allows them to learn the specific features associated with various eye conditions. To ensure the robustness and generalizability of the models, rigorous testing and validation protocols, including train-validation-test partitioning, are employed. This meticulous process enables transfer learning-based models to accurately diagnose and predict retinal diseases, potentially revolutionizing early detection and treatment strategies in ophthalmology.
Additionally, we used scikit-learn for various tasks, including importing confusion_matrix, OneHotEncoder, precision_recall_curve, and f1_score from the scikit-learn.metrics module. Furthermore, we employed YOLOv8n-cls to build another model trained on a dataset relevant to the experiment’s objectives. This model was used to identify and localize objects of interest within the data.
3.3.1 Hardware and Software Configuration
For the models Xception, VGG16, and ConvNeXtTiny, we utilized Kaggle with GPU support P100. In contrast, we used Google Colab for the YOLOv8n-cls architecture. Both platforms provided the essential computational resources and infrastructure needed to effectively train and evaluate the models, in line with the objectives of our experiment. Additionally, the experiments were conducted using an Intel 12th Gen Core i7-1260P processor, with a clock speed of 2.10 GHz, 16 GB of RAM, and a Jupyter notebook environment.
Hyperparameter optimization involves systematically adjusting the hyperparameters of an algorithm through iterative evaluation to find the optimal configuration for maximizing model performance. In our research, we selected parameters by reviewing previous studies, and then proceeded with parameter adjustments and experimentation.
The VGG16 architecture is renowned for its simplicity and effectiveness in computer vision tasks. It has been meticulously configured to ensure optimal performance for this particular setup. The selected optimizer is Adam, which utilizes a learning rate of 0.001. This allows for adaptive learning rates for individual parameters, making it a variant of stochastic gradient descent that facilitates efficient weight updates during training.
In addition to the optimizer, the VGG16 model is configured with specific parameters to enhance compatibility with the dataset. These parameters include setting the `class_mode' to ‘raw’, the `color_mode' to ‘RGB’, and the `target_size' to (224, 224). These configurations are crucial for maximizing the model’s performance in image classification. Table 4 presents the fine-tuned hyperparameters.
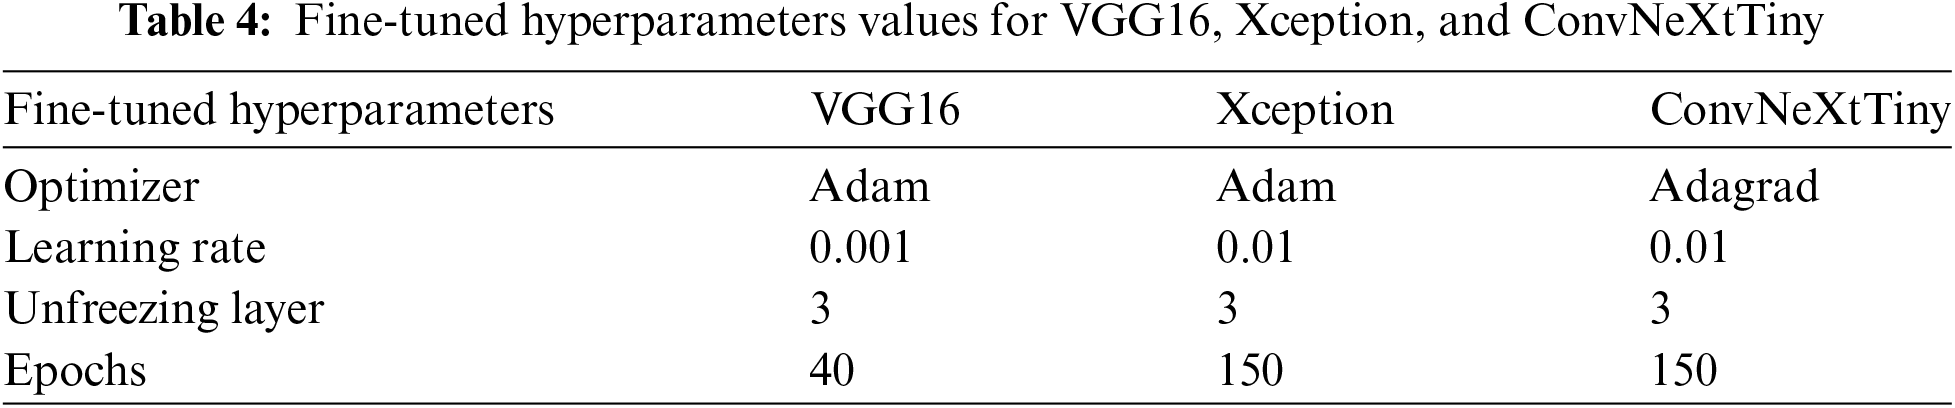
Xception is an advanced convolutional neural network specifically designed to achieve superior performance in computer vision tasks. It is initially optimized using the Adadelta optimizer with a learning rate of 0.1, which enables the model to dynamically adjust its weights to minimize categorical cross-entropy loss. Pre-trained with ImageNet weights, Xception benefits from accelerated training and enhanced generalization capabilities.
The model uses a batch size of 32 and implements early stopping with a patience of 7 epochs, ensuring efficient convergence and reducing the risk of overfitting. ReLU activation is applied in the hidden layers to introduce non-linearity, while the Softmax function in the output layer computes multi-class probabilities. The single hidden layer consists of 256 units and features a dropout rate of 0.3 to further prevent overfitting. Additionally, global average pooling is utilized to reduce the dimensions of the feature maps, improving interpretability and mitigating overfitting.
During the fine-tuning stage, the optimizer is changed to Adam with a learning rate of 0.01. Three layers of the network are frozen to preserve the pre-learned representations, and training continues for 150 epochs to refine the model’s performance on the specific dataset.
The Xception model is configured with additional parameters tailored to match the characteristics of the dataset: the class mode is set to ‘raw’, the color mode is set to ‘RGB’, and the target size is specified as (224, 224). These hyperparameters and settings ensure that the Xception model performs robustly across various image classification tasks. Table 4 presents the hyperparameters used in Xception.
The ConvNeXtTiny is a compact convolutional neural network designed specifically for image classification tasks. It has been meticulously configured to optimize performance. The model utilizes Adagrad optimization with a learning rate of 0.01 to dynamically adapt its weights and minimize categorical cross-entropy loss. It is initialized with ImageNet weights to enhance training and improve generalization.
With a batch size of 16 and early stopping set to a patience of 7 epochs, ConvNeXtTiny efficiently converges while mitigating the risks of overfitting. ReLU activation is employed in the hidden layers to introduce non-linearity, while Sigmoid activation is used in the output layer to compute class probabilities. The single hidden layer consists of 32 units, augmented by a dropout rate of 0.4 to further reduce the risk of overfitting. Additionally, Global Average Pooling is applied to decrease feature map dimensions, enhancing interpretability and also helping to prevent overfitting.
During the fine-tuning phase, the optimizer remains Adagrad with customized parameters: an initial accumulator value of 0.1, an epsilon of 1e−07, and a learning rate of 0.01. Three layers are frozen to preserve pre-learned representations while training continues for 150 epochs to refine the model’s performance on the specific dataset. The ConvNeXtTiny model is also configured with additional parameters to ensure compatibility with the dataset’s characteristics. The class mode is set to ‘raw,’ the color mode is set to ‘RGB,’ and the target size is specified as (224, 224). Together, these hyperparameters and settings equip the ConvNeXtTiny model for robust performance in various image classification tasks. Refer to Table 4 for the hyperparameters.
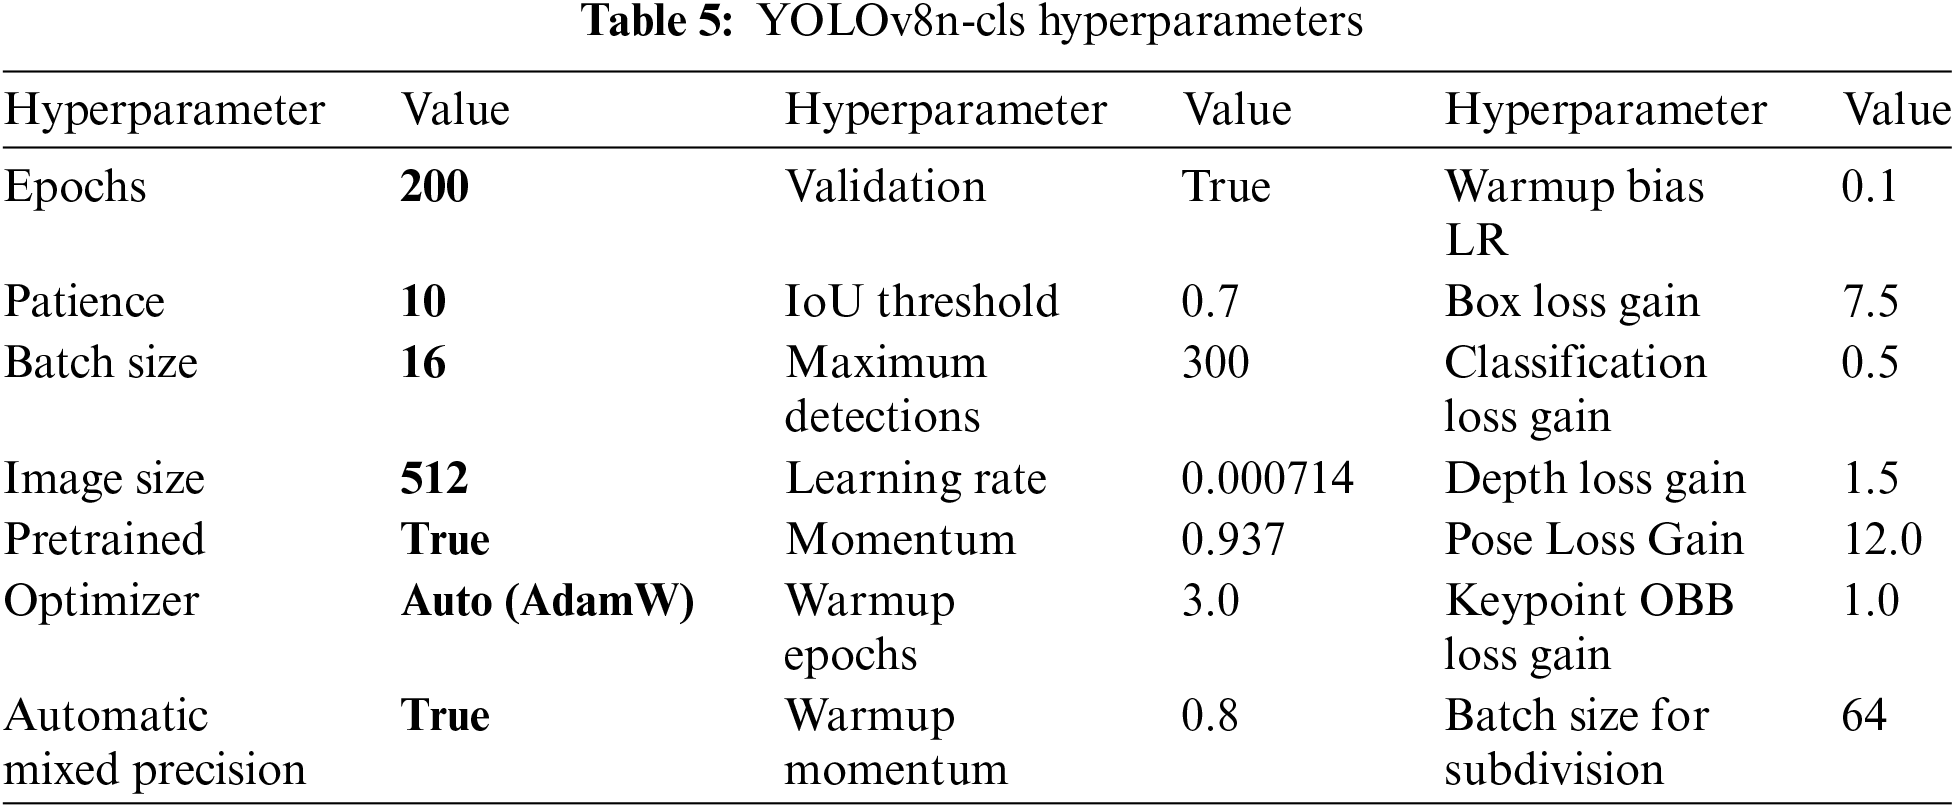
The configuration of the YOLOv8n-cls model is designed with various hyperparameters to optimize its performance. The model undergoes extensive training for 200 epochs with a patience threshold of 10 to ensure robust learning. It utilizes a batch size of 16 and an image size of 512 pixels to facilitate efficient processing and high-resolution analysis. Additionally, the use of pre-trained weights and automatic mixed precision enhances both training efficiency and accuracy. Key optimization parameters, such as momentum (0.937) and weight decay (0.0005), contribute to stable convergence and improved generalization.
The model also incorporates specialized loss functions, including box loss gain (7.5) and pose loss gain (12.0), which are tailored to specific tasks. To enhance model robustness, augmentation techniques such as HSV (Hue, Saturation, Value) adjustments and mosaic transformations are employed to diversify the training data. The model furthermore includes validation and plotting functionalities, which aid in monitoring training progress and diagnosing performance issues. Data augmentation parameters, including probabilities for rotation, translation, and flipping, enrich the dataset and promote better generalization. The YOLOv8n-cls model features an automatic optimizer selection mechanism that uses the ‘auto’ setting to dynamically choose the most appropriate optimizer for training. While the default optimizer is set to ‘AdamW’, the ‘auto’ mode enables adaptive parameter selection, which can lead to better results compared to manual selection. This automated approach ensures that the model is optimized with hyperparameters tailored to both the dataset and the training dynamics, enhancing performance without the need for manual tuning.
By utilizing automatic optimization, YOLOv8n-cls maximizes training efficiency and effectiveness, resulting in improved object detection outcomes. Overall, the hyperparameter configuration of YOLOv8n-cls represents a comprehensive strategy aimed at achieving state-of-the-art object detection capabilities. Refer to Table 5 for the hyperparameters of YOLOv8n-cls.
3.5 Optimal Threshold Determination for Binary Classification
During the post-processing phase of our predictive modeling, we employ a step-by-step approach to determine the best threshold for converting predicted probabilities into binary classifications. First, we organize the labels and predicted probabilities into one-dimensional arrays to ensure compatibility for further analysis. Next, we utilize the precision_recall_curve function to calculate precision and recall at various thresholds, which are critical for evaluating the performance of binary classifiers. To identify the threshold that balances precision and recall, we compute the F1-score for each possible threshold.
The F1-score, which is the harmonic mean of precision and recall, serves as a reliable measure of binary classifier accuracy, particularly in imbalanced datasets. We then select the threshold that corresponds to the highest F1-score as the optimal threshold. This optimal threshold is subsequently used to categorize the predicted probabilities into either 0 or 1, depending on whether they meet or exceed this value. This method is essential for enhancing the effectiveness of the classification process, ensuring a balance between precision and recall to improve overall model performance.
3.6 Performance Evaluation of the Proposed Models
The performance of the models will be assessed using several key performance indicators, including accuracy, Receiver Operating Characteristic (ROC) curve, precision, recall, Area Under the Curve (AUC), and F1-score. Accuracy refers to the proportion of correctly predicted results among all predictions. Precision is defined as the ratio of true positive predictions to the total number of positive predictions. Recall measures the proportion of actual positive instances that were correctly identified by the model.
The F1-score combines both precision and recall into a single metric. AUC is a metric that evaluates a classification model’s ability to distinguish between positive and negative examples, with a higher AUC value indicating better discriminatory ability. The ROC curve is a graphical representation that plots the true positive rate against the false positive rate, allowing for an assessment of the model’s effectiveness.
These metrics are essential for evaluating model performance, and some are interdependent. For example, accuracy cannot be calculated without knowing precision and recall. Additionally, the terms used in this evaluation include: True Positive (TP), True Negative (TN), False Positive (FP), and False Negative (FN). The relevant formulas are presented in Eqs. (1)–(6).
In this research, we conducted a thorough assessment of the performance of classification models using various evaluation metrics, including Recall, Accuracy, Precision, F1-score, and AUC per class. These metrics provide insights into the performance of each individual class.
We also analyzed Macro-Average, Micro-Average, Weighted-Average, and sample-average metrics to offer a comprehensive evaluation by employing different averaging techniques. Additionally, Global Accuracy gives a summary of the overall correctness of the model across all classes.
Furthermore, we emphasize the importance of considering metrics such as False Negatives (FN) and False Positives (FP) to prevent misdiagnosis, which can pose significant risks and endanger people’s lives.
The section explores the performance analysis of the YOLOv8n-cls model and compares it with other leading architectures, such as VGG16, Xception, and ConvNeXtTiny, during the training and validation phases, both prior to and following fine-tuning.
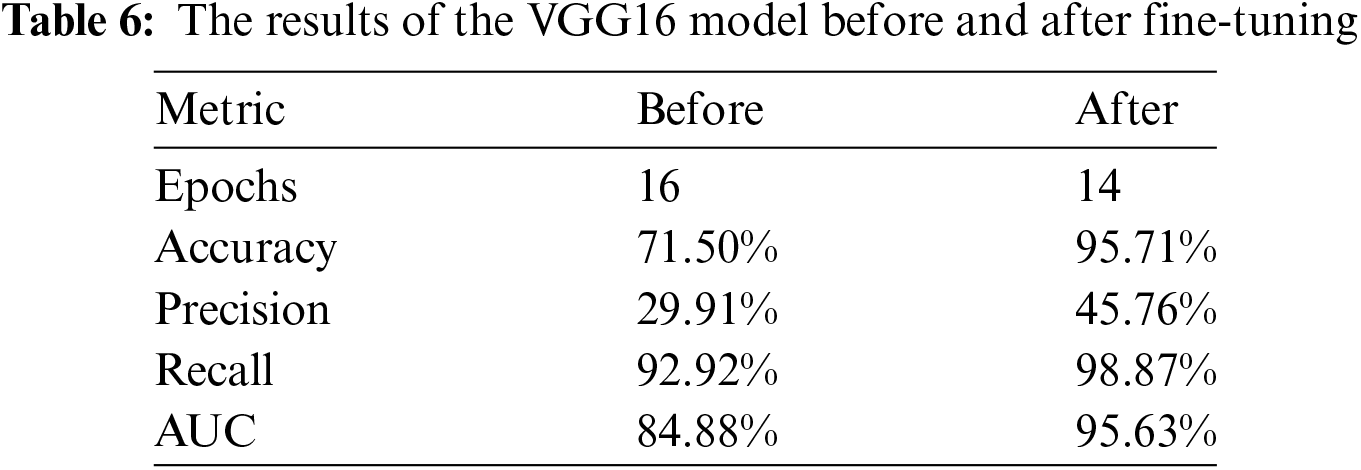
The performance of the VGG16 model, both before and after fine-tuning, is demonstrated through three key metrics: Training and Validation Accuracy, Training and Validation Loss, as well as Precision, Recall, and AUC. After implementing a strategic fine-tuning approach—by unfreezing the last three layers and using the Adam optimizer with a learning rate of 0.0001—significant improvements in performance metrics were achieved. The model’s accuracy increased dramatically from 71.50% before fine-tuning to an impressive 95.71% afterward. This substantial improvement indicates that the model’s ability to correctly classify instances has been greatly enhanced through the fine-tuning process.
The results comparing performance before and after fine-tuning are presented in Table 6. A notable difference is evident in the performance by applying the fine-tuning by a margin of 24.21%, 15.85%, 5.95% and 10.75%, in accuracy, precision, recall and AUC, respectively. While epochs were reduced by just 2.
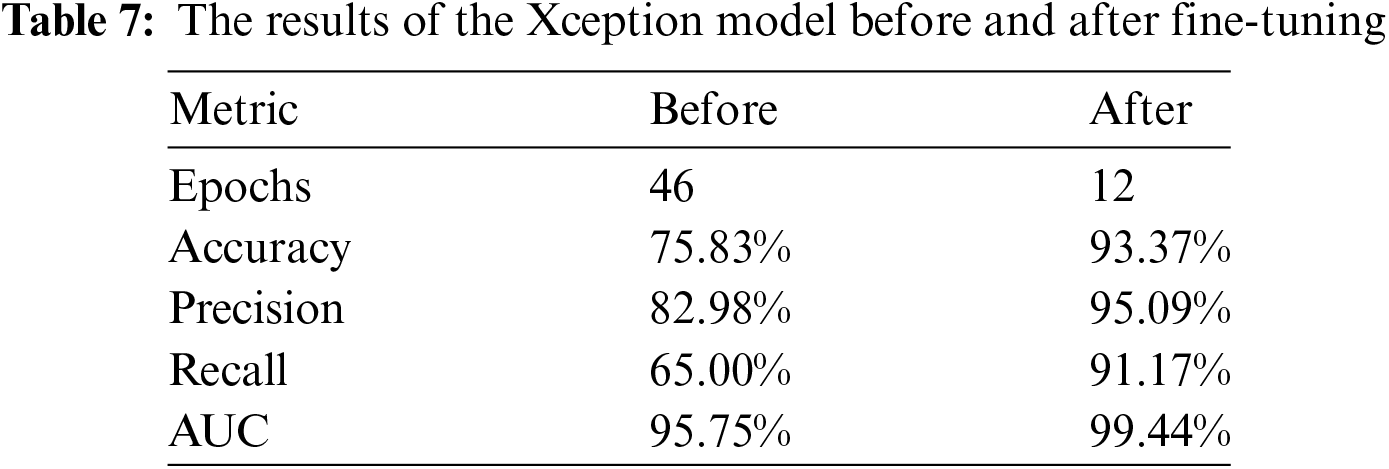
The performance of the Xception model was evaluated before and after fine-tuning by examining various metrics, including Training and Validation Accuracy, Training and Validation Loss, Precision, Recall, and AUC. After fine-tuning the model using a strategic approach—specifically, unfreezing the last three layers and applying the Adam optimizer with a learning rate of 0.01—significant improvements in these performance metrics were observed. These enhancements illustrate the effectiveness of fine-tuning process in optimizing the model’s performance, resulting in better classification outcomes.
Table 7 presents the experimental results before and after hyperparameter tuning, respectively. It is apparent that post fine tuning, results are significantly improved in terms of accuracy, precision, recall, and AUC by 17.54%, 12.11%, 26.17% and 3.69%, respectively. Moreover, this feat was achieved with significantly reduced number of epochs.
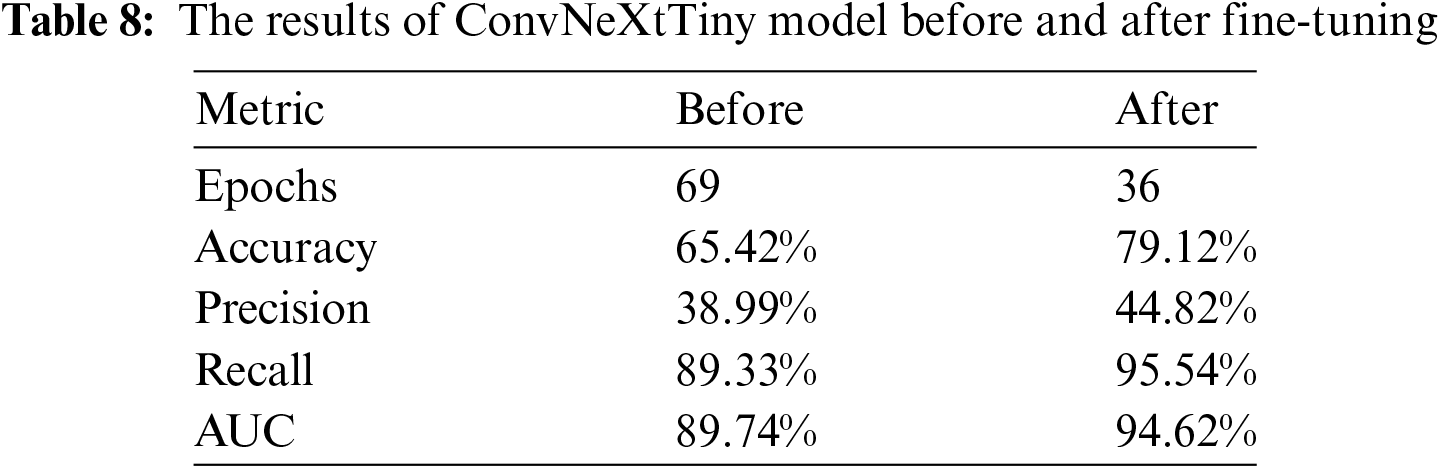
The performance of the ConvNeXtTiny model is evaluated using three key metrics: Training Accuracy, Validation Accuracy, Training Loss, Validation Loss, Precision, Recall, and AUC. After fine-tuning the ConvNeXtTiny model with a strategic approach—specifically, unfreezing the last three layers and utilizing the ‘Adagrad’ optimizer with a learning rate of 0.01, an initial accumulator value of 0.1, and an epsilon value of 1e−07—significant improvements in these performance metrics have been observed.
The results are detailed in Table 8. A significant improvement in performance metrics of accuracy, precision, recall and AUC has been observed after fine-tuning by a difference of 13.7%, 5.83%, 6.33% and 4.88%, respectively. While the number of epochs are reduced by 33.
The performance of the YOLOv8n-cls model is illustrated through four key plots: Training Loss, Validation Loss, Top-1 Accuracy, and Top-5 Accuracy. The plots for training and validation loss show a consistent decrease, which indicates effective learning and convergence of the model. The Top-1 accuracy improves and stabilizes around 0.75, reflecting the model’s enhanced ability to predict the correct class. Meanwhile, the Top-5 accuracy metric highlights the model’s capability to rank predictions. This plot consistently demonstrates high accuracy, starting at 0.99 and maintaining that level with only minor fluctuations. This indicates the proposed model’s strong ability to correctly rank the target class within its top five predictions.
Using accuracy metrics such as Top-1 and Top-5 provides a direct measure of performance for classification tasks, emphasizing how often the correct class is predicted. This method is effective for assessing the model’s efficiency in identifying and ranking classes, which is the primary objective of models like YOLOv8n-cls. Fig. 2 visually represents the performance of the YOLOv8n-cls model.
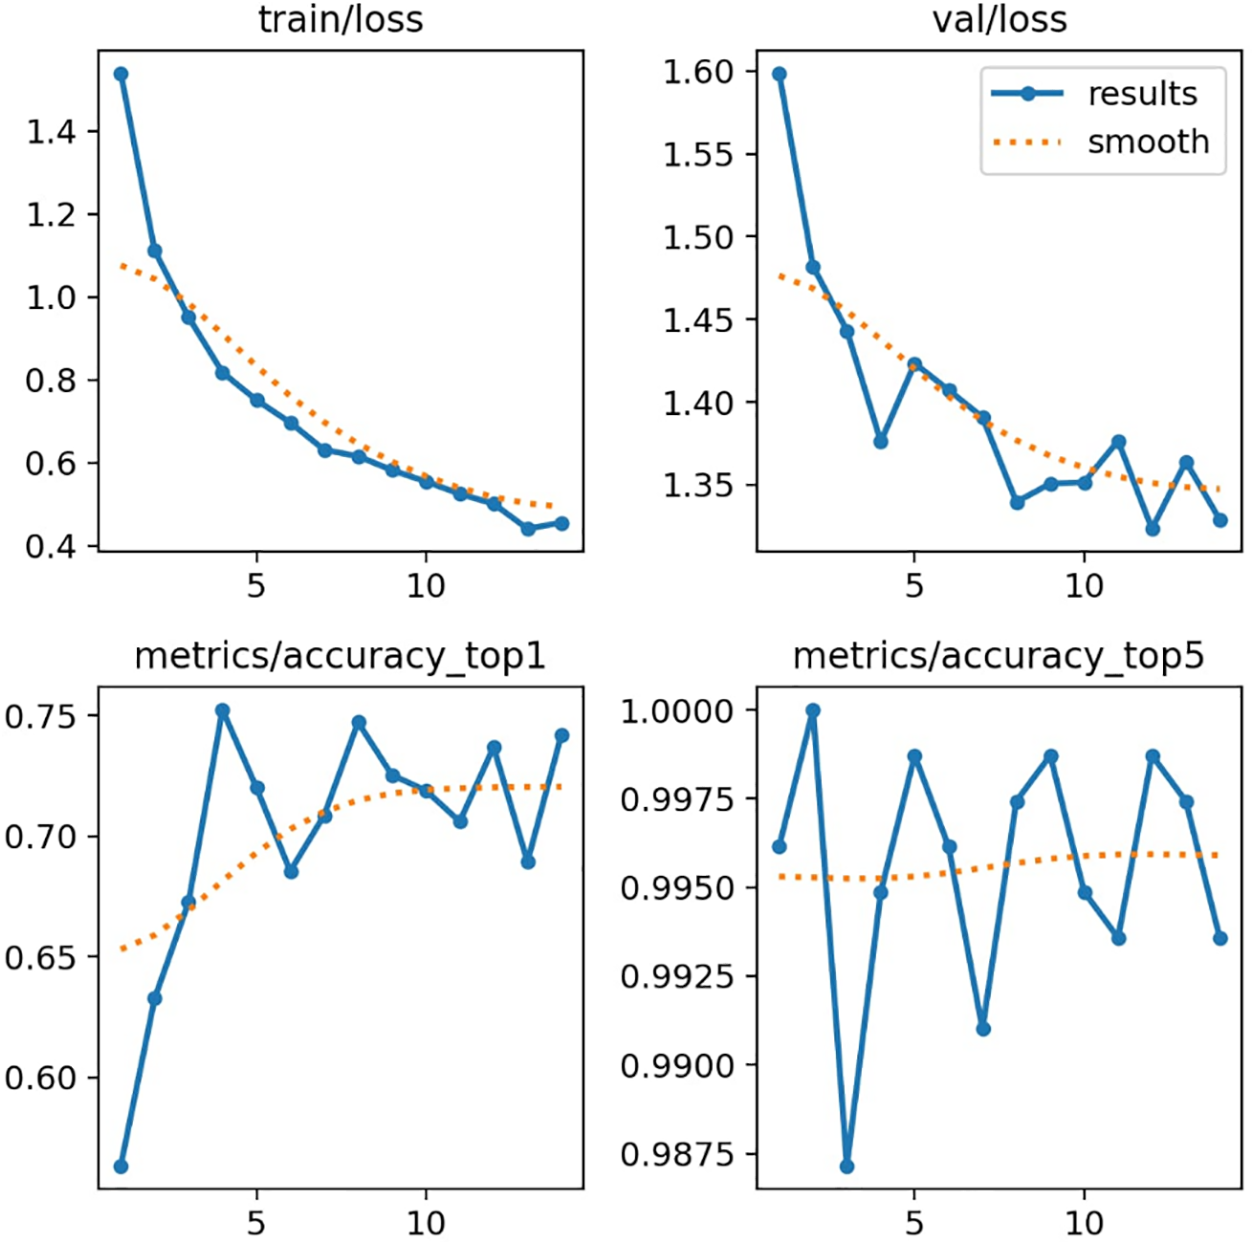
Figure 2: Performance of YOLOv8n model over training epochs
The YOLOv8n-cls model was not fine-tuned due to its complex architecture, which posed challenges in the fine-tuning process. Furthermore, the version of YOLOv8n-cls used in this study is not designed to support fine-tuning. These limitations restricted the application of fine-tuning techniques that were successfully implemented on other models such as VGG16, Xception, and ConvNeXtTiny. Consequently, we focused on evaluating the model based on its inherent capabilities without any additional fine-tuning or adjustments.
Table 9 presents the model’s performance. It is important to note that an early stopping criterion was applied to mitigate the potential risk of overfitting. Additionally, transfer learning models do not require as many epochs or extended training times, which is one of the advantages of using transfer learning models like YOLO.
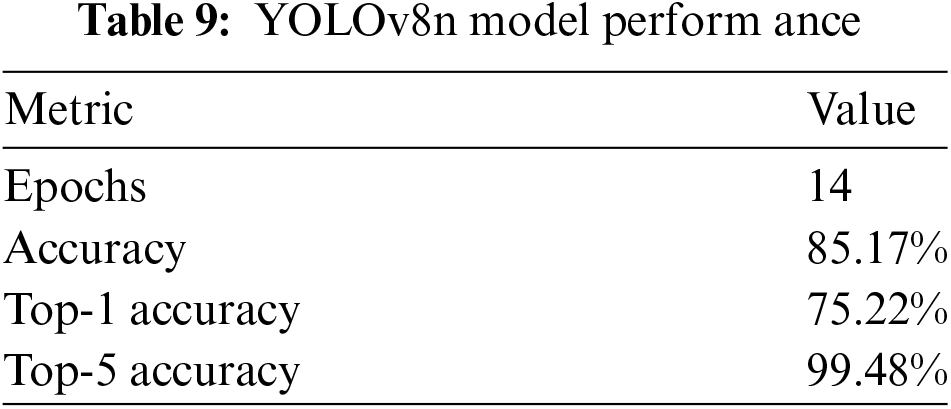
Fig. 3 presents a compelling collection of retinal fundus images paired with their true labels, highlighting the accuracy of our dataset.
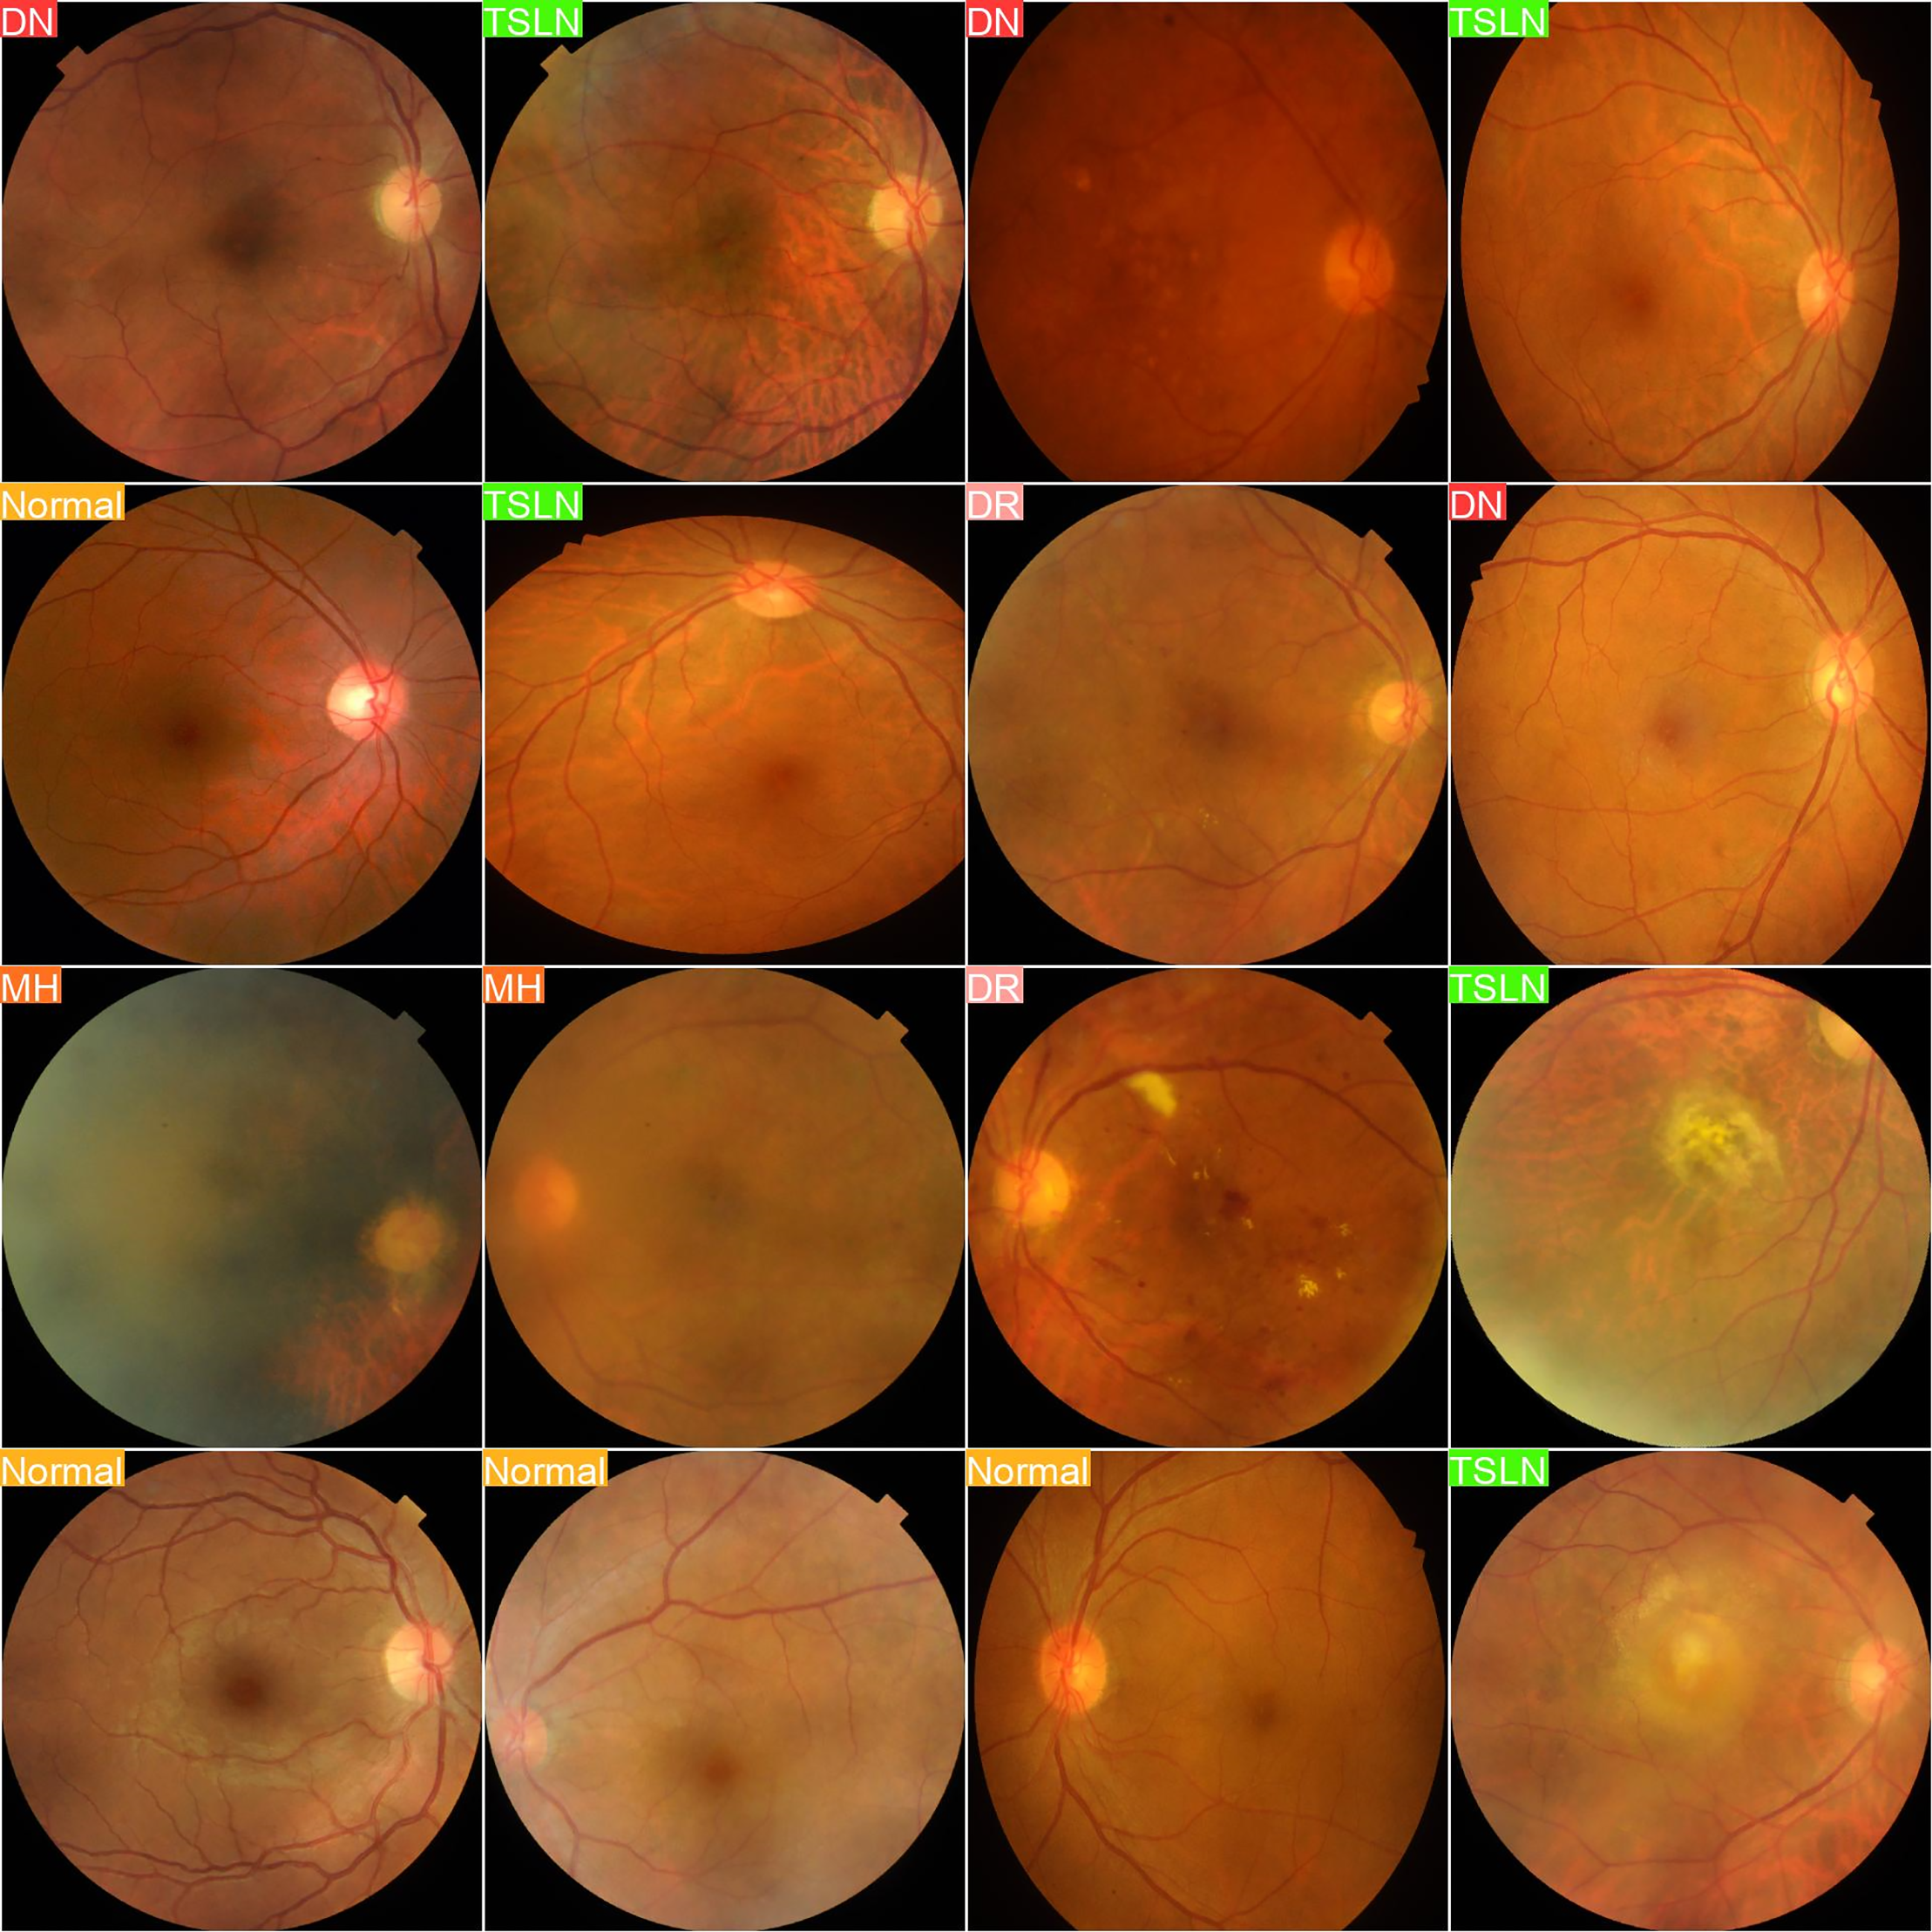
Figure 3: Actual labels
In contrast, Fig. 4 showcases images labeled based on predictions from the YOLOv8n-cls model, demonstrating its potential for advanced image analysis.
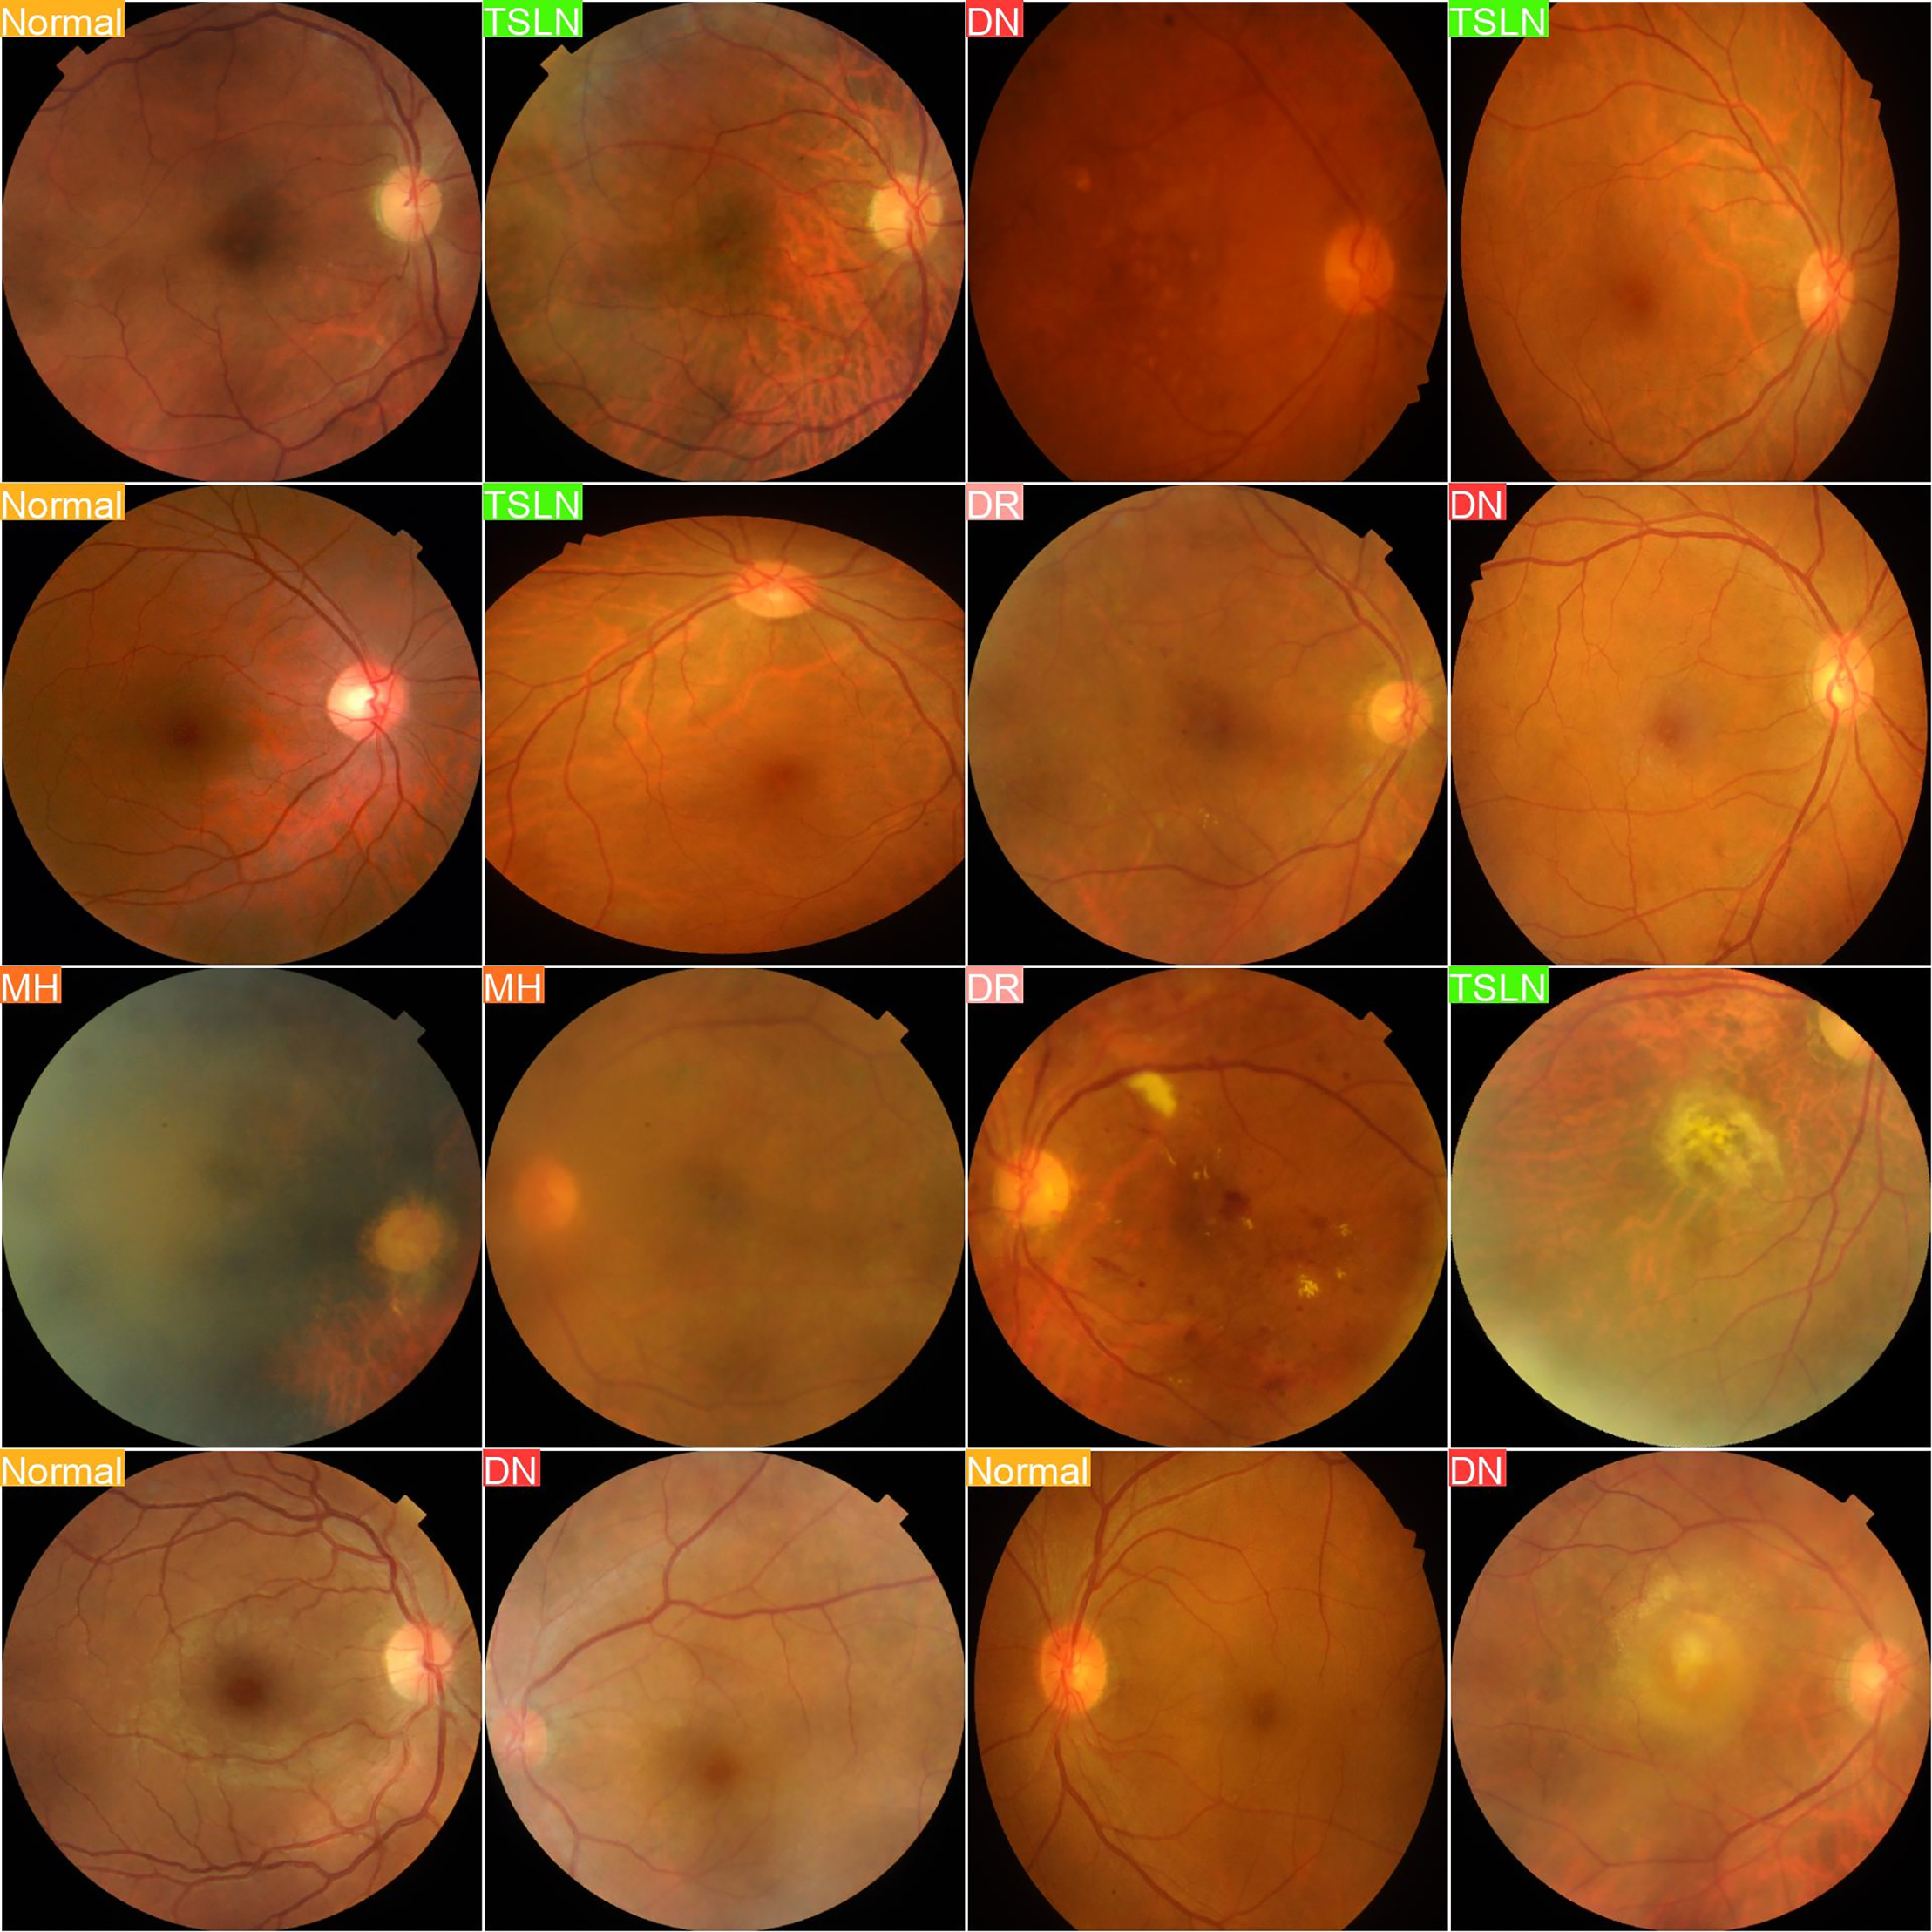
Figure 4: Predicted labels
In this experiment, we evaluated the performance of the YOLOv8n-cls model in accurately predicting various retinal diseases based on fundus images. The first set of images displays the actual labels of the retinal images, categorizing them into distinct disease classes, including Diabetic Neuropathy (DN), Tesselated Fundus (TSLN), Normal, Diabetic Retinopathy (DR), and Macular Hole (MH). The second set presents the predictive output from the YOLOv8n-cls model. By comparing these sets, we can assess the model’s diagnostic accuracy by examining how closely the predicted labels align with the true disease categories.
The aim of this experiment is to determine the model’s reliability and precision in real-world scenarios, providing insights into its potential utility in clinical practice for the detection and classification of retinal conditions. Such validation is essential and crucial for further refining the model and ensuring its applicability in clinical healthcare settings, where accurate and early diagnosis is crucial for effective treatment planning.
4.5 Performance of All the Models over Test Data
Table 10 presents the comprehensive performance outcomes of all models tested on individual diseases, as well as their aggregated performance. It is important to note that these results were achieved following hyperparameter optimization. Results obtained prior to hyperparameter tuning are not included due to page limitations. The YOLOv8n-cls model outperformed all other models across all performance metrics for both individual disease detection and aggregated performance.
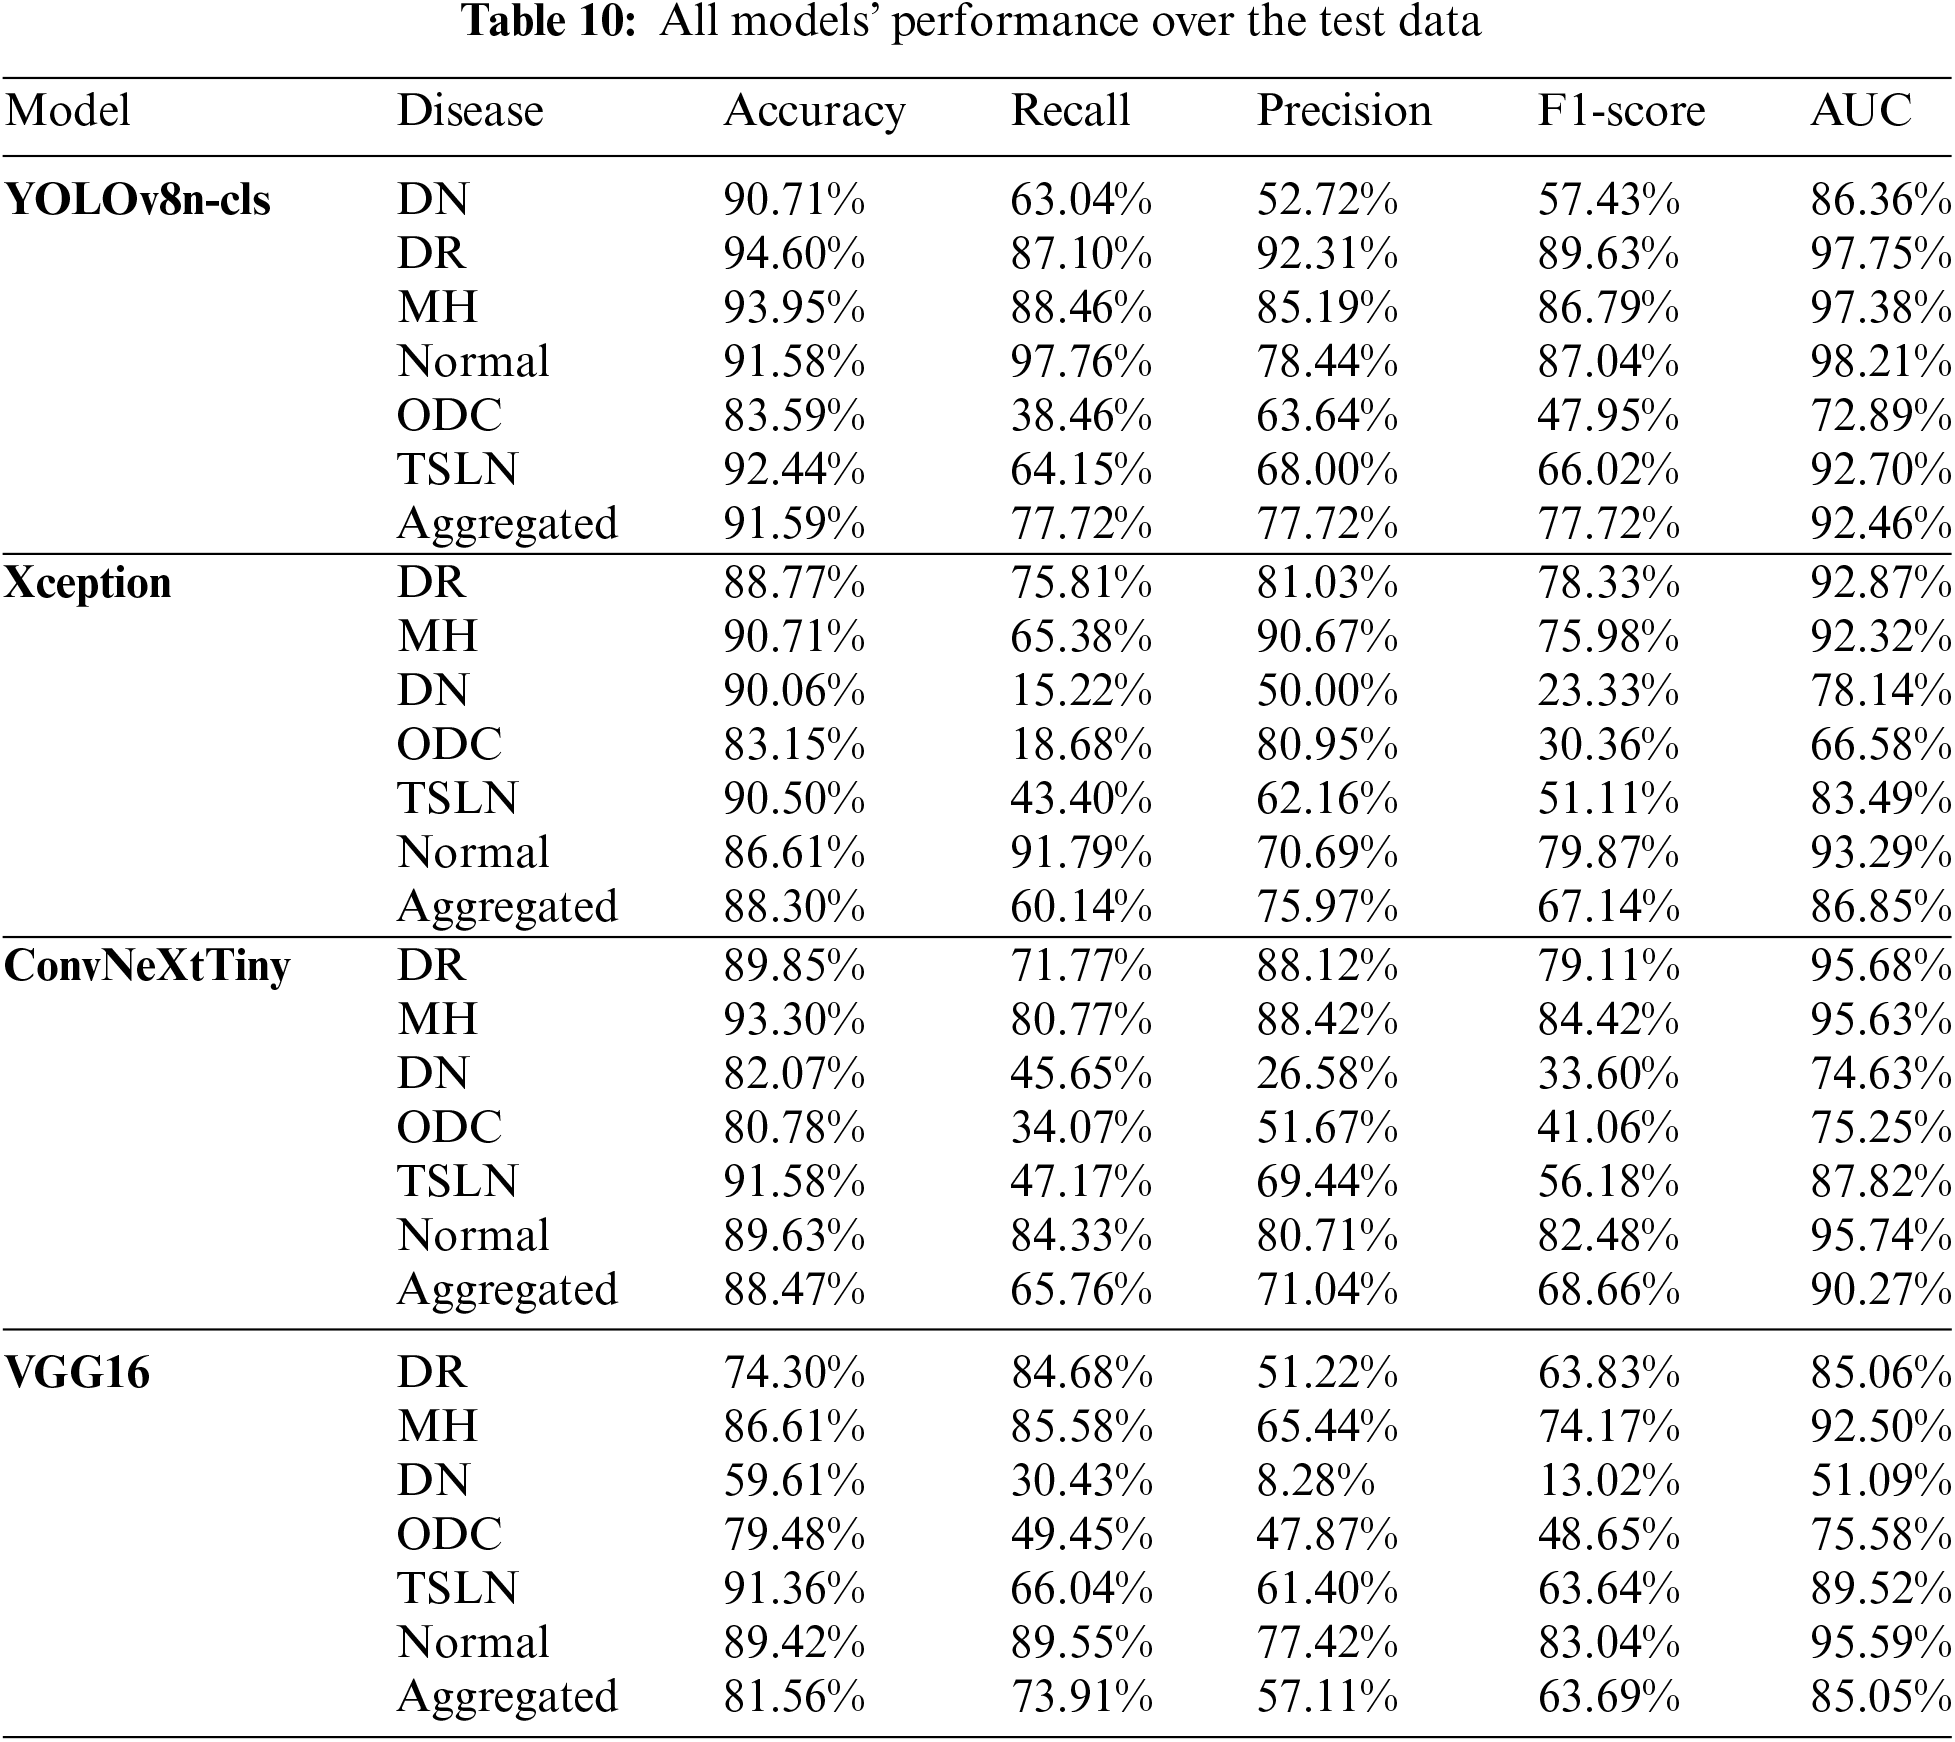
The analysis, along with the data presented in Tables 10 and 11, has revealed the following observations:
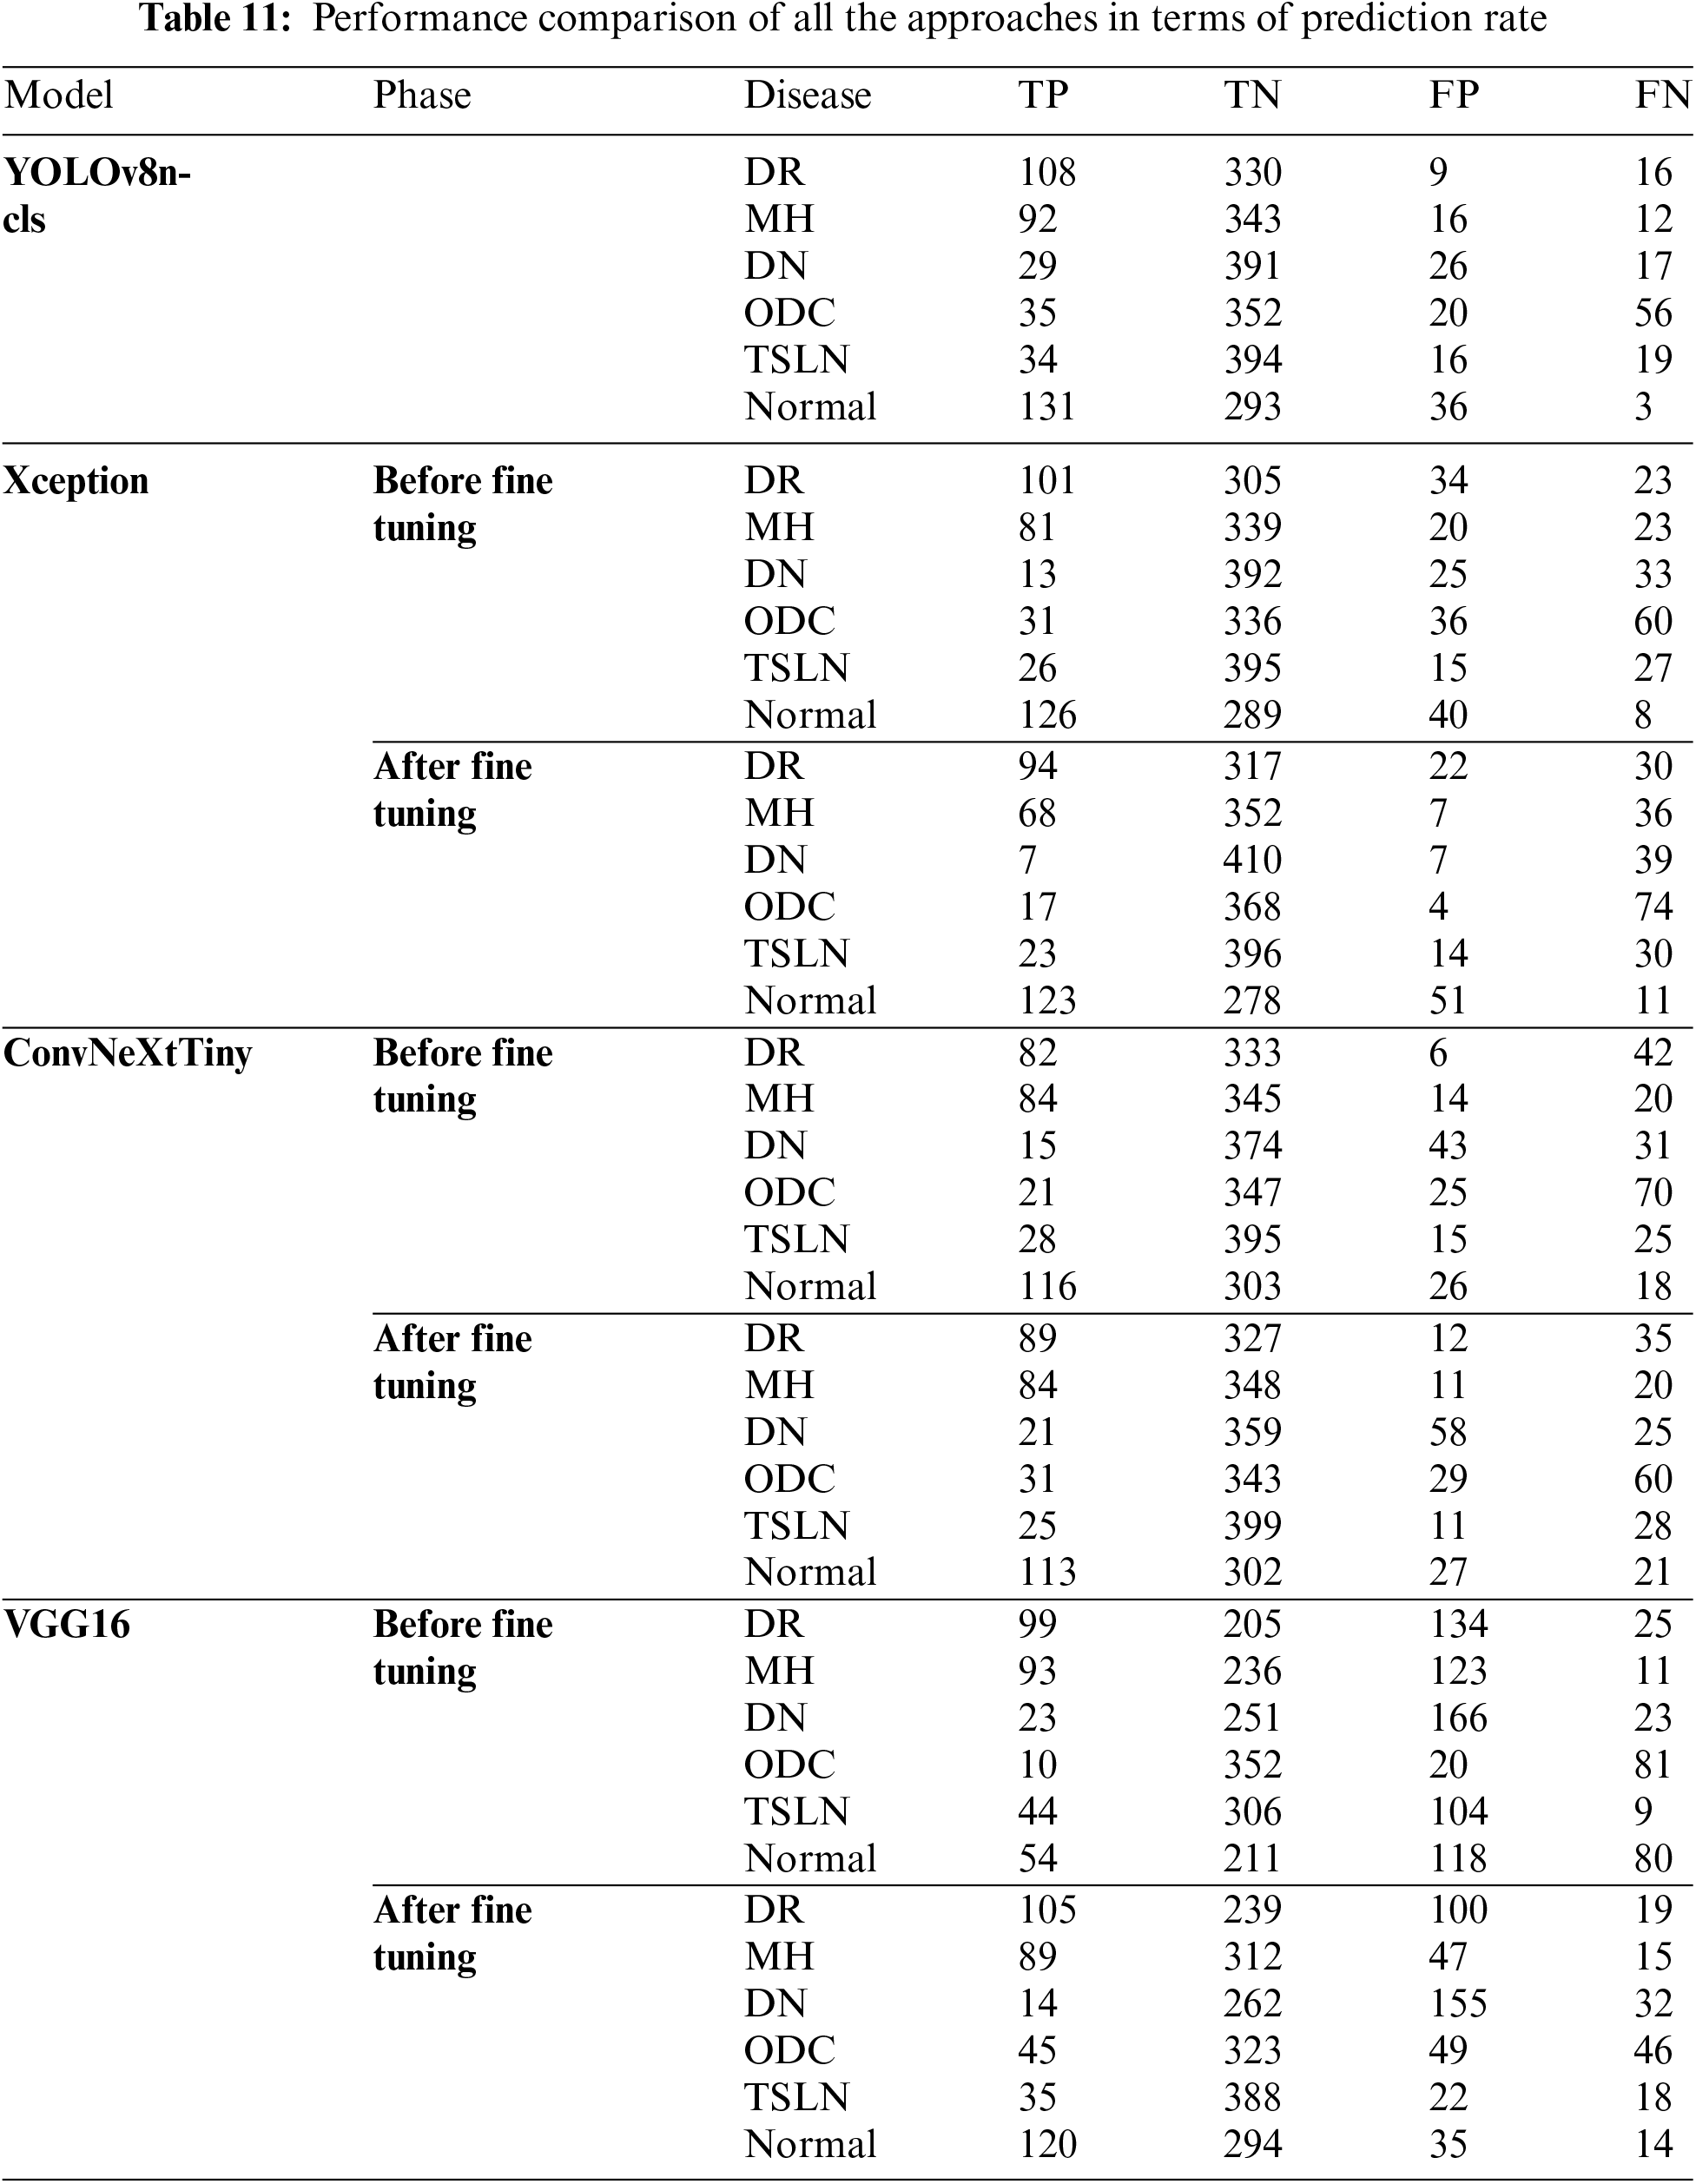
1. The YOLOv8n-cls and Xception models demonstrate a strong performance in True Positives for the conditions of diabetic retinopathy (DR), Normal, and macular hemorrhage (MH), indicating good sensitivity to these conditions.
2. The ConvNeXtTiny and VGG16 models show significant improvements in True Positives for the Normal and DR conditions after fine-tuning.
3. The YOLOv8n-cls model is remarkably stable across most diseases, consistently achieving high True Negatives, particularly notable in the Normal and TSLN conditions.
4. The Xception model exhibits a significant improvement in True Negatives for the Normal condition post-fine-tuning; however, it also shows a notable increase in False Negatives for DR, MH, and diabetic neuropathy (DN).
5. The ConvNeXtTiny model demonstrates balanced improvement after fine-tuning across most diseases, with increased True Positives and decreased False Negatives for both DR and MH.
6. The VGG16 model exhibits considerable variability, with dramatic shifts in performance metrics, particularly in False Positives and False Negatives across all conditions.
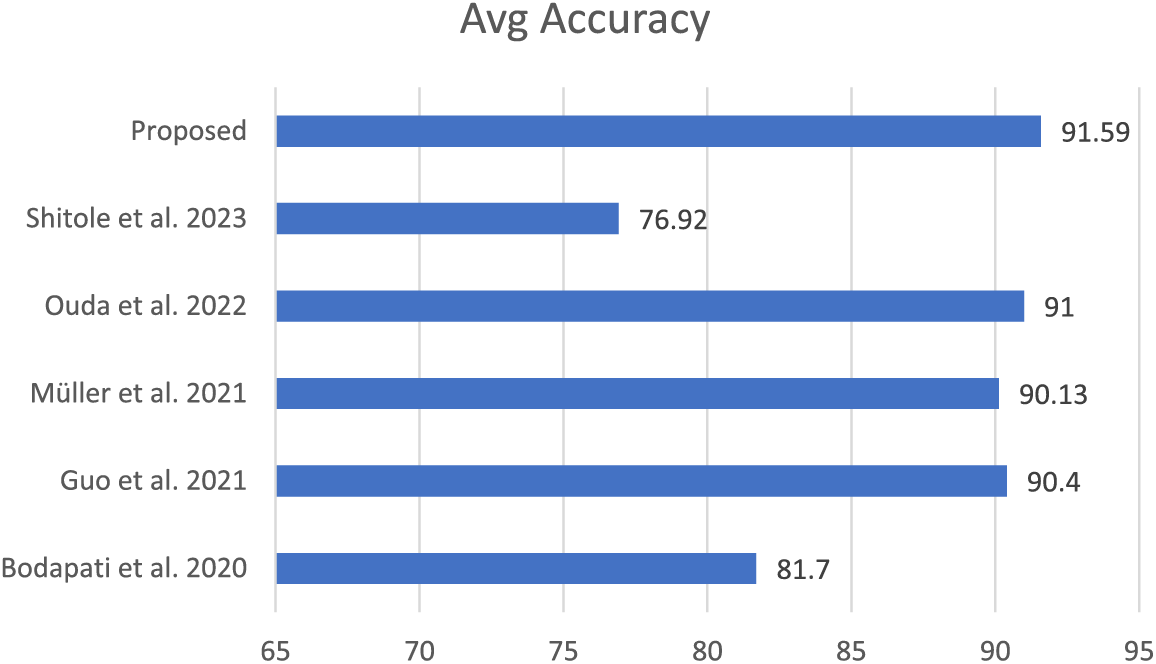
4.7 Comparison with State-of-the-Art
The proposed scheme has been qualitatively compared with various techniques found in the literature, considering that there are approximately fifty retinal diseases and that different techniques are chosen for different conditions. The selected schemes were evaluated based on criteria such as the use of the same dataset (RFMID), the presence of multiple retinal diseases, and the application of deep learning, particularly transfer learning. Overall, the proposed scheme outperforms the others in these comparisons. The results are illustrated in Fig. 5.
This research aimed to develop and evaluate deep learning models for identifying retinal eye diseases using transfer learning methods. We specifically focused on four pre-trained models: YOLOv8n-cls, Xception, ConvNeXtTiny, and VGG16. The primary diseases considered in our study were Diabetic Retinopathy (DR), Macular Hole (MH), Diabetic Neuropathy (DN), Optic Disc Changes (ODC), Tessellated Fundus (TSLN), and normal eye conditions. Accurately identifying positive cases in medical diagnostics is crucial, so we prioritized recall as our main metric to minimize false negatives. These false negatives can be particularly dangerous, as they may lead to delayed treatment for serious conditions. The strong performance of YOLOv8n-cls and VGG16 in identifying normal conditions after fine-tuning is promising. This indicates that these models can effectively reduce the number of false positives in healthy patients, which is important in clinical settings to avoid unnecessary anxiety and additional medical examinations.
For Diabetic Retinopathy, we observed consistently high recall rates across the models, especially with YOLOv8n-cls. This aligns with the need to prioritize sensitivity for this sight-threatening condition and supports findings from other studies that highlight the potential of deep learning in DR screening. In our comparative analysis with state-of-the-art models, our proposed scheme outperformed others using the same dataset. Furthermore, this study contributes to Saudi Arabia’s Vision 2030 initiative, which aims to improve healthcare and well-being for its citizens.
A notable limitation of this study is its reliance on a specific dataset, RFMiD, for testing, which may limit the generalizability of the findings. To enhance the robustness of the models, future research should incorporate data from multiple centers. Additionally, using advanced forms of transfer learning and integrating clinical metadata could improve diagnostic accuracy [45,46]. Given the wide variety of retinal diseases, it is crucial to differentiate each condition through a segmentation process that highlights abnormalities, rather than simply classifying them. To address these limitations, future investigations should explore data augmentation techniques to include more diverse datasets, contributing to the development of more generalized and robust models. Furthermore, for multi-class classification, it is essential to investigate hybrid, fusion-based, and ensemble models to further refine the results [47–50].
This study successfully developed and evaluated deep learning models utilizing transfer learning to detect retinal eye diseases. We employed four prominent pre-trained models: YOLOv8n-cls, Xception, ConvNeXtTiny, and VGG16, fine-tuning them on a comprehensive dataset of retinal images to diagnose conditions such as Diabetic Retinopathy (DR), Macular Hole (MH), Diabetic Neuropathy (DN), Optic Disc Changes (ODC), Tesselated Fundus (TSLN), and normal eye conditions. We emphasized recall as the primary metric due to the critical need to minimize false negatives in medical diagnostics, as missing a positive case can lead to severe consequences for patients. Our results demonstrated that the YOLOv8n-cls model performed exceptionally well, particularly in detecting normal conditions, with a recall of 97.76%, and DR, with a recall of 87.10%. This high sensitivity in identifying normal and DR conditions is essential for reducing unnecessary treatments and ensuring patients with significant conditions receive prompt and accurate diagnoses and treatments. In conclusion, this research highlights the potential of deep learning approaches, especially transfer learning with pre-trained models, in transforming the diagnosis of retinal diseases. By focusing on recall, we ensure that the developed models are sensitive to detecting true positives, which is crucial in medical settings. However, a potential limitation of the current study is its focus on a single, comprehensive dataset. Future research should aim to address these limitations and explore new methodologies to enhance the applicability and robustness of these models further.
Acknowledgement: The authors like to acknowledge CCSIT for using the computing resources during the study.
Funding Statement: The authors received no specific funding for this study.
Author Contributions: Conceptualization, Atta Rahman; Data curation, Basel Altaha and Hussein Alkatout; Methodology, Atta Rahman, Yahya Alhabboub, Khalid Alzahrani and Hassan Baragbah; Software, Yahya Alhabboub, Khalid Alzahrani, Hassan Baragbah and Basel Altaha; Supervision, Mohammed Salih Ahmed and Atta Rahman; Validation, Hussein Alkatout; Writing—original draft, Yahya Alhabboub, Khalid Alzahrani, Hassan Baragbah, Basel Altaha and Hussein Alkatout; Writing—review & editing, Mohammed Salih Ahmed, Aghiad Bakry, Rashad Ahmed and Sardar Asad Ali Biabani. All authors reviewed the results and approved the final version of the manuscript.
Availability of Data and Materials: The data that support the findings of this study are openly available in (IEEE Dataport) at https://ieee-dataport.org/open-access/retinal-fundus-multi-disease-image-dataset-rfmid (accessed on 22 December 2024).
Ethics Approval: Not applicable.
Conflicts of Interest: The authors declare no conflicts of interest to report regarding the present study.
References
1. World Health Organization, “World report on vision; World Health Organization: Geneva, Switzerland,” 2019. Accessed: Nov. 22, 2024. [Online]. Available: https://www.who.int/publications/i/item/9789241516570 [Google Scholar]
2. A. W. Stitt et al., “The progress in understanding and treatment of diabetic retinopathy,” Prog. Retin. Eye Res., vol. 15, no. 1, pp. 156–186, 2016. doi: 10.1016/j.preteyeres.2015.08.001. [Google Scholar] [PubMed] [CrossRef]
3. G. A. Stevens, “Global prevalence of vision impairment and blindness: Magnitude and temporal trends, 1990–2020,” Lancet Glob. Health, vol. 9, no. 12, pp. e1721–e1736, 2021. [Google Scholar]
4. C. Zhou et al., “Visual impairment and blindness caused by retinal diseases: A nationwide register-based study,” J. Glob. Health, vol. 3, no. 13, 2023, Art. no. 04126. doi: 10.7189/jogh.13.04126. [Google Scholar] [PubMed] [CrossRef]
5. S. Suganyadevi, V. Seethalakshmi, and K. Balasamy, “A review on deep learning in medical image analysis,” Int. J. Multimed. Inf. Retr., vol. 11, no. 1, pp. 19–38, 2022. doi: 10.1007/s13735-021-00218-1. [Google Scholar] [PubMed] [CrossRef]
6. M. N. Yeasmin, M. AlAmin, T. J. Joti, Z. Aung, and M. A. Azim, “Advances of AI in image-based computer-aided diagnosis: A review,” Array, vol. 23, no. 1, 2024, Art. no. 100357. doi: 10.1016/j.array.2024.100357. [Google Scholar] [CrossRef]
7. Y. Gu et al., “A survey of computer-aided diagnosis of lung nodules from CT scans using deep learning,” Comput. Biol. Med., vol. 137, no. 1, 2021, Art. no. 100357. doi: 10.1016/j.compbiomed.2021.104806. [Google Scholar] [PubMed] [CrossRef]
8. D. S. Kermany, “Identifying medical diagnoses and treatable diseases by image-based deep learning,” Cell, vol. 172, no. 5, pp. 1122–1131, 2018. doi: 10.1016/j.cell.2018.02.010. [Google Scholar] [PubMed] [CrossRef]
9. A. Choudhary, S. Ahlawat, S. Urooj, N. Pathak, A. Lay-Ekuakille, and N. Sharma, “A deep learning-based framework for retinal disease classification,” Healthcare, vol. 11, no. 2, 2023, Art. no. 212. doi: 10.3390/healthcare11020212. [Google Scholar] [PubMed] [CrossRef]
10. R. Kommaraju and M. S. Anbarasi, “Diabetic retinopathy detection using convolutional neural network with residual blocks,” Biomed. Sig. Process. Control, vol. 87, no. 4, 2024, Art. no. 105494. doi: 10.1016/j.bspc.2023.105494. [Google Scholar] [CrossRef]
11. A. N. Kollias and M. W. Ulbig, “Diabetic retinopathy: Early diagnosis and effective treatment,” Dtsch. Arztebl. Int., vol. 107, no. 5, pp. 75–83, 2010. doi: 10.3238/arztebl.2010.0075. [Google Scholar] [PubMed] [CrossRef]
12. F. S. Sorrentino et al., “Novel approaches for early detection of retinal diseases using Artificial Intelligence,” J. Pers. Med., vol. 14, no. 7, 2024, Art. no. 690. doi: 10.3390/jpm14070690. [Google Scholar] [PubMed] [CrossRef]
13. U. V. Shukla and K. Tripathy, Diabetic retinopathy. In: StatPearls [Internet]. Treasure Island (FLStatPearls Publishing; 2024 Jan. Accessed: Nov. 22, 2024. [Online]. Available: https://www.ncbi.nlm.nih.gov/books/NBK560805/ [Google Scholar]
14. A. Kawali et al., “Diagnostic and therapeutic challenges in ocular histoplasmosis—A case report,” Ocul. Immunol. Inflamm., vol. 30, no. 1, pp. 149–152, 2022. doi: 10.1080/09273948.2020.1797114. [Google Scholar] [PubMed] [CrossRef]
15. G. Rebolleda, S. Noval, I. Contreras, F. Arnalich-Montiel, J. García-Perez and F. Munoz-Negrete, “Optic disc cupping after optic neuritis evaluated with optic coherence tomography,” Eye, vol. 23, no. 4, pp. 890–894, 2009. doi: 10.1038/eye.2008.117. [Google Scholar] [PubMed] [CrossRef]
16. N. Yoshihara, T. Yamashita, K. Ohno-Matsui, and T. Sakamoto, “Objective analyses of tessellated fundi and significant correlation between degree of tessellation and choroidal thickness in healthy eyes,” PLoS One, vol. 9, no. 5, 2014, Art. no. e103586. doi: 10.1371/journal.pone.0103586. [Google Scholar] [PubMed] [CrossRef]
17. American Academy of ophthalmology, “What are Drusen,” 2023. Accessed: Dec. 22, 2024. [Online]. Available: https://www.aao.org/eye-health/diseases/what-are-drusen [Google Scholar]
18. E. Ho et al., “Deep ensemble learning for retinal image classification,” Transl. Vis. Sci. Technol., vol. 11, no. 10, 2022, Art. no. 39. doi: 10.1167/tvst.11.10.39. [Google Scholar] [PubMed] [CrossRef]
19. Retinal Fundus Multi-disease Image Dataset (RFMiD) | IEEE DataPort, “IEEE dataport,” 2023. Accessed: Feb. 22, 2024. [Online]. Available: https://ieee-dataport.org/open-access/retinal-fundus-multi-disease-image-dataset-rfmid [Google Scholar]
20. A. Shitole, A. Kenchappagol, R. Jangle, Y. Shinde, and A. S. Chadha, “Enhancing retinal scan classification: A comparative study of transfer learning and ensemble techniques,” Int. J. Recent Innov. Trends Comput. Commun., vol. 11, no. 7, pp. 520–528, 2023. doi: 10.17762/ijritcc.v11i7s.7031. [Google Scholar] [CrossRef]
21. D. Müller, I. Soto-Rey, and F. Kramer, “Multi-disease detection in retinal imaging based on ensembling heterogeneous deep learning models,” Stud. Health Technol. Inform., vol. 283, no. 1, pp. 23–31, 2021, doi: 10.3233/SHTI210537. [Google Scholar] [CrossRef]
22. O. Ouda, E. AbdelMaksoud, A. Abd El-Aziz, and M. Elmogy, “Multiple ocular disease diagnosis using fundus images based on multi-label deep learning classification,” Electronics, vol. 11, no. 13, 2022, Art. no. 1966. doi: 10.3390/electronics11131966. [Google Scholar] [CrossRef]
23. M. Guo, M. Yu, and J. Li, “Prediction of different eye diseases based on fundus photography via deep transfer learning,” J. Clin. Med., vol. 10, no. 12, 2021, Art. no. 5481. doi: 10.3390/jcm10235481. [Google Scholar] [PubMed] [CrossRef]
24. J. D. Bodapati et al., “Blended multi-modal deep convnet features for diabetic retinopathy severity prediction,” Electronics, vol. 9, no. 9, 2020, Art. no. 914. doi: 10.3390/electronics9060914. [Google Scholar] [CrossRef]
25. T. MariaHerrero, “Aptos-2019 Dataset,” Kaggle,” 2021. Accessed: Feb. 12, 2024. [Online]. Available: https://www.kaggle.com/datasets/mariaherrerot/aptos2019 [Google Scholar]
26. T. R. Gadekallu, N. Khare, S. Bhattacharya, S. Singh, P. K. R. Maddikunta and G. Srivastava, “Deep neural networks to predict diabetic retinopathy,” J. Ambient Intell. Humaniz. Comput., vol. 14, no. 4, pp. 4079–4092, 2021. doi: 10.1007/s12652-020-01963-7. [Google Scholar] [CrossRef]
27. B. Antal and A. Hajdu, ““Diabetic retinopathy debrecen,” UCI machine learning repository,” 2014. Accessed: Mar. 10, 2024. [Online]. Available: https://archive.ics.uci.edu/dataset/329/diabetic+retinopathy+debrecen+data+set [Google Scholar]
28. A. Das, R. Giri, G. Chourasia, and A. A. Bala, “Classification of retinal diseases using transfer learning approach,” in 2019 Int. Conf. Commun. Electron. Syst. (ICCES), 2019. doi: 10.1109/icces45898.2019.9002415. [Google Scholar] [CrossRef]
29. F. Arcadu, F. Benmansour, A. Maunz, J. Willis, Z. Haskova and M. Prunotto, “Deep learning algorithm predicts diabetic retinopathy progression in individual patients,” npj Digit. Med., vol. 2, no. 1, 2019, Art. no. 92. doi: 10.1038/s41746-019-0172-3. [Google Scholar] [PubMed] [CrossRef]
30. World Health Organization, “Diabetic retinopathy clinical research network (DRCRnet) protocol W,” 2023. Accessed: Dec. 22, 2024. [Online]. Available: https://trialsearch.who.int/?TrialID=NCT00473382 [Google Scholar]
31. World Health Organization, “Diabetic retinopathy clinical research network (DRCRnet) protocol V,” 2023. Accessed: Dec. 22, 2024. [Online]. Available: https://trialsearch.who.int/?TrialID=NCT00473330 [Google Scholar]
32. G. Alfian et al., “Deep neural network for predicting diabetic retinopathy from risk factors,” Mathematics, vol. 8, no. 9, 2020, Art. no. 1620. doi: 10.3390/math8091620. [Google Scholar] [CrossRef]
33. D. W. Shin, B. Cho, and G. Eliseo, “Korean national health insurance database,” JAMA Intern. Med., vol. 176, no. 1, 2016, Art. no. 138. doi: 10.1001/jamainternmed.2015.7110. [Google Scholar] [PubMed] [CrossRef]
34. R. K. Patel, S. S. Chouhan, H. S. Lamkuche, and P. Pranjal, “Glaucoma diagnosis from fundus images using modified Gauss-Kuzmin-distribution-based Gabor features in 2D-FAWT,” Comput. Electr. Eng., vol. 119, no. 11, Art no. 109538. doi: 10.1016/j.compeleceng.2024.109538. [Google Scholar] [CrossRef]
35. A. Rahman et al., “Diabetic retinopathy detection: A hybrid intelligent approach,” Comput. Mater. Contin., vol. 80, no. 3, pp. 4561–4576, 2024. doi: 10.32604/cmc.2024.055106. [Google Scholar] [CrossRef]
36. E. V. Orlova, “Artificial intelligence-based system for retinal disease diagnosis,” Algorithms, vol. 17, no. 7, 2024, Art. no. 315. doi: 10.3390/a17070315. [Google Scholar] [CrossRef]
37. M. I. B. Ahmed, “Early detection of Diabetic Retinopathy utilizing advanced fuzzy logic techniques,” Math. Model. Eng. Prob., vol. 10, no. 6, pp. 2086–2094, 2023. doi: 10.18280/mmep.100619. [Google Scholar] [CrossRef]
38. K. Team, “Keras documentation: Keras applicationsKeras documentation: Keras applications,” keras.io,” Accessed: Dec 22, 2024. [Online]. Available: https://keras.io/api/applications/ [Google Scholar]
39. J. Terven, D. -M. Córdova-Esparza, and J. -A. Romero-González, “A comprehensive review of YOLO architectures in computer vision: From YOLOv1 to YOLOv8 and YOLO-NAS,” Mach. Learn. Knowl. Extract., vol. 5, no. 4, pp. 1680–1716, 2023. doi: 10.3390/make5040083. [Google Scholar] [CrossRef]
40. G. Litjens et al., “A survey on deep learning in medical image analysis,” Med. Image Anal., vol. 42, no. 13, pp. 60–88, 2017. doi: 10.1016/j.media.2017.07.005. [Google Scholar] [PubMed] [CrossRef]
41. H. Greenspan, B. van Ginneken, and R. Summers, “Guest editorial deep learning in medical imaging: Overview and future promise of an exciting new technique,” IEEE Trans. Med. Imaging, vol. 35, no. 5, pp. 1153–1159, 2016. doi: 10.1109/TMI.2016.2553401. [Google Scholar] [CrossRef]
42. P. Porwal et al., “Transfer learning-based detection of diabetic retinopathy from small dataset,” Biomed. Sig. Process. Control, vol. 59, 2020, Art. no. 101921. [Google Scholar]
43. B. Menaouer, Z. Dermane, N. El Houda Kebir, and N. Matta, “Diabetic retinopathy classification using hybrid deep learning approach,” SN Comput. Sci., vol. 3, no. 1, 2022, Art. no. 357. doi: 10.1007/s42979-022-01240-8. [Google Scholar] [CrossRef]
44. A. K. Gangwar and V. Ravi, “Diabetic retinopathy detection using transfer learning and deep learning,” in Evolution in Computational Intelligence. Advances in Intelligent Systems and Computing, V. Bhateja, S. L. Peng, S. C. Satapathy, Y. D. Zhang, Eds. Singapore: Springer, 2021, vol. 1176, pp. 679–689. 10.1007/978-981-15-5788-0_64. [Google Scholar] [CrossRef]
45. M. Youldash et al., “Early detection and classification of diabetic retinopathy: A deep learning approach,” AI, vol. 5, no. 4, pp. 2586–2617, 2024. doi: 10.3390/ai5040125. [Google Scholar] [CrossRef]
46. M. Gollapalli et al., “Appendicitis diagnosis: Ensemble machine learning and explainable artificial intelligence-based comprehensive approach,” Big Data Cogn. Comput., vol. 8, no. 9, 2024, Art. no. 108. doi: 10.3390/bdcc8090108. [Google Scholar] [CrossRef]
47. A. Bilal et al., “DeepSVDNet: A deep learning-based approach for detecting and classifying vision threatening diabetic retinopathy in retinal fundus images,” Comput. Syst. Sci. Eng., vol. 48, no. 2, pp. 511–528, 2024. doi: 10.32604/csse.2023.039672. [Google Scholar] [CrossRef]
48. Y. Zhou et al., “A foundation model for generalizable disease detection from retinal images,” Nature, vol. 622, no. 1, pp. 156–163, 2023. doi: 10.1038/s41586-023-06555-x. [Google Scholar] [PubMed] [CrossRef]
49. M. W. Nadeem, H. G. Goh, M. Hussain, S. -Y. Liew, I. Andonovic and M. A. Khan, “Deep learning for diabetic retinopathy analysis: A review,” Res. Chall. Future Dir. Sens., vol. 22, no. 18, 2022, Art. no. 6780. doi: 10.3390/s22186780. [Google Scholar] [PubMed] [CrossRef]
50. S. Muchuchuti and V. Serestina, “Retinal disease detection using deep learning techniques: A comprehensive review,” J. Imaging, vol. 9, no. 4, 2023, Art. no. 84. doi: 10.3390/jimaging9040084. [Google Scholar] [PubMed] [CrossRef]
Cite This Article
 Copyright © 2025 The Author(s). Published by Tech Science Press.
This work is licensed under a Creative Commons Attribution 4.0 International License , which permits unrestricted use, distribution, and reproduction in any medium, provided the original work is properly cited.
 Downloads
 Citation Tools