
 Submit a Paper
 Propose a Special lssue
 Open Access
ARTICLE
Bayesian Stochastic INLA Application to the SIR-SI Model for Investigating Dengue Transmission Dynamics
1 Department of Statistics, Faculty of Mathematics and Natural Sciences, Universitas Halu Oleo Kendari, Kendari, 93232, Indonesia
2 Department of Computer Sciences, Faculty of Mathematics and Natural Sciences, Universitas Halu Oleo Kendari, Kendari, 93232, Indonesia
3 Department of Biology, Faculty of Mathematics and Natural Sciences, Universitas Halu Oleo Kendari, Kendari, 93232, Indonesia
4 Department of Medicine, Faculty of Medicine, Universitas Halu Oleo Kendari, Kendari, 93232, Indonesia
* Corresponding Author: Mukhsar. Email:
Intelligent Automation & Soft Computing 2025, 40, 177-193. https://doi.org/10.32604/iasc.2025.058884
Received 23 September 2024; Accepted 12 December 2024; Issue published 24 February 2025
 View Full Text
 Download PDF
Abstract
Despite extensive prevention efforts and research, dengue hemorrhagic fever (DHF) remains a major public health challenge, particularly in tropical regions, with significant social, economic, and health consequences. Statistical models are crucial in studying infectious DHF by providing a structured framework to analyze transmission dynamics between humans (hosts) and mosquitoes (vectors). Depending on the disease characteristics, different stochastic compartmental models can be employed. This research applies Bayesian Integrated Nested Laplace Approximation (INLA) to the SIR-SI model for DHF data. The method delivers accurate parameter estimates, improved computational efficiency, and effective integration with early warning systems. The model compared to existing work using Markov Chain Monte Carlo (MCMC) using monthly DHF data from 10 districts in Kendari-Indonesia from 2020–2023. While MCMC requires 10,000 iterations with an 80,000 burn-in, INLA achieves parameter convergence with just 10,000 iterations. The parameter estimation results show that INLA provides a better fit, with the lowest deviance = 105.23, compared to MCMC. Risk analysis using INLA highlights dengue case dynamics from January to May each year. Kadia and Wua-Wua districts consistently show high case numbers, emphasizing the need for targeted interventions in Kendari City. Early surveillance and control efforts are essential to curb mosquito breeding in these areas starting in January. In contrast, the Puuwatu, Kambu, and Kendari Barat districts are sporadic outbreaks, often linked to cases originating in Kadia and Wua-Wua districts.Keywords
Dengue Hemorrhagic Fever (DHF) is a more severe variant of dengue fever, transmitted by the bite of Aedes aegypti mosquitoes. It often develops when an individual is infected with a second, different strain of the dengue virus, leading to an intensified immune reaction. DHF remains a public health concern, especially in tropical and subtropical areas, including Southeast Asia (e.g., Indonesia), Latin America, and parts of Africa. Dengue is endemic in over 100 countries, with approximately 390 million cases annually, of which about 500,000 progress to DHF [1,2]. The consequences of DHF include high healthcare expenses, loss of productivity, and increased pressure on healthcare systems during large outbreaks, especially in low-middle-income countries. Factors like rapid urbanization, international travel, and climate change are facilitating the spread of dengue to new areas, further worsening its global impact [3].
For complex and unpredictable diseases such as DHF, precise modeling is essential for optimizing public health responses, enhancing preparedness, enabling real-time adjustments to intervention efforts, and mitigating the global disease burden. The SIR-SI model is a fundamental tool for analyzing the transmission of DHF infectiousness using an ordinary differential equation (ODE) [4,5]. A typical ODE involves integer-order derivatives, such as first or second derivatives. In fractional calculus, we generalize this idea with a fractional derivative of order
One of the primary challenges in Bayesian statistics is the substantial computational effort involved. Markov Chain Monte Carlo (MCMC) methods are widely used for Bayesian analysis [6]. Although MCMC is highly adaptable and capable of handling complex data and models [8,12], it is computationally demanding and time-intensive [14,15]. The Integrated Nested Laplace Approximation (INLA) was introduced as a more efficient alternative to MCMC [16,17]. INLA has been successfully applied across various fields and supported by an R package [18]. Moreover, INLA is integrated with the stochastic partial differential equation (SPDE) framework to develop spatial-temporal models [19]. In practice, INLA offers efficient computation and straightforward handling of complex structured models and is particularly effective for large datasets and quick updates. MCMC, though more resource-intensive, provides greater flexibility for models with unique or nonstandard distributions. The computational process in INLA effectively achieves a balance between speed and accuracy when compared to MCMC [20]. INLA and MCMC each have distinct strengths in estimating uncertainty. INLA provides efficient, somewhat narrower uncertainty bounds, making it well-suited for structured models, while MCMC produces broader, more comprehensive intervals. These methods complement one another, with INLA excelling in efficiency and quick updates and MCMC offering deeper insights for complex scenarios [17,18]. These tools facilitate data-driven decisions, ensuring that interventions are timely, precisely focused, and responsive to real-time shifts and long-term uncertainties in dengue transmission patterns [20,21].
This paper focuses on presenting the key features of the INLA method in analyzing dengue transmission dynamics. It underscores the importance of understanding the complex interactions between hosts (humans) and vectors (mosquitoes) [22–25]. Dengue Hemorrhagic Fever (DHF) continues to pose a major public health challenge, leading to substantial social, economic, and health-related impacts [25]. Consequently, early prevention efforts, including predictive modeling, are vital for developing and implementing targeted intervention strategies [24]. Bayesian inference provides a powerful method for estimating parameters in the SIR-SI (susceptible, infected, recovered of human-susceptible, infected of mosquitoes) or cross-infection model, offering a thorough framework for integrating prior knowledge and assessing uncertainty. The INLA is a highly effective Bayesian technique designed for latent Gaussian models, making it well-suited for handling intricate epidemiological models [18]. The INLA method improves the efficiency, accuracy, and practicality of applying models to real-world disease dynamics [19]. We apply our model based on a monthly DHF dataset of 10 districts in Kendari-Indonesia from 2022–2023.
2.1 Stochastic SIR-SI Model Compartment
Bayesian inference provides a versatile and robust framework for parameter estimation and prediction in complex models. By integrating prior knowledge, updating it with new data, and accounting for uncertainty, Bayesian methods are particularly effective at handling high-dimensional, hierarchical, and non-linear systems across various disciplines [12]. The Bayesian approach in this model provides enhanced flexibility, improved computational efficiency, and effective uncertainty handling, making it particularly suitable for modeling complex epidemiological systems such as dengue transmission. While computationally demanding, advancements in techniques like Markov Chain Monte Carlo (MCMC) and variational inference have made these methods more practical for real-world applications. The INLA is an incredibly efficient approach for Bayesian inference in complex spatial-temporal models. It takes advantage of the sparsity in Gaussian Markov random fields and uses deterministic Laplace approximations, allowing it to process large datasets and intricate dependencies quickly and precisely. The INLA offers several notable advantages over MCMC methods for Bayesian inference, particularly in models involving complex spatial-temporal dependencies [15].
The intricate relationships between the dengue virus, Aedes mosquitoes, and human populations drive the spread of DHF. The transmission cycle involves viral replication in humans and mosquitoes, with factors such as mosquito behavior, environmental conditions, and human actions influencing the process. The virus enters the digestive system when a female Aedes mosquito bites an infected person. The virus replicates and moves to the mosquito salivary glands over 8–12 days (extrinsic incubation period) [2]. When this infected mosquito bites another individual, the virus is transmitted through its saliva, initiating a new infection. Once the mosquito bites a dengue-infected individual, it becomes a virus carrier. Infected humans are viremic (the virus circulates in the bloodstream) for around 4–5 days, giving mosquitoes multiple chances to acquire the virus if they bite during this period [1]. Aedes aegypti mosquitoes thrive in urban areas, especially around stagnant water sources like containers and poorly drained locations. They are primarily active during the day and have a limited flight range of 50–100 m, making outbreaks more likely in areas where infected people and mosquito breeding grounds are nearby [3].
The SIR-SI model is based on the following assumptions: (1) susceptible individuals become infected and either recover; (2) susceptible Aedes mosquitoes become infected but do not recover; (3) the infection rate is proportional to the susceptible number; and (4) the recovery rate is proportional to the infected number. The compartmental framework depicted in Fig. 1 is frequently applied in studies investigating the transmission dynamics of DHF within human populations. The susceptible, infected, and recovered host are denoted by
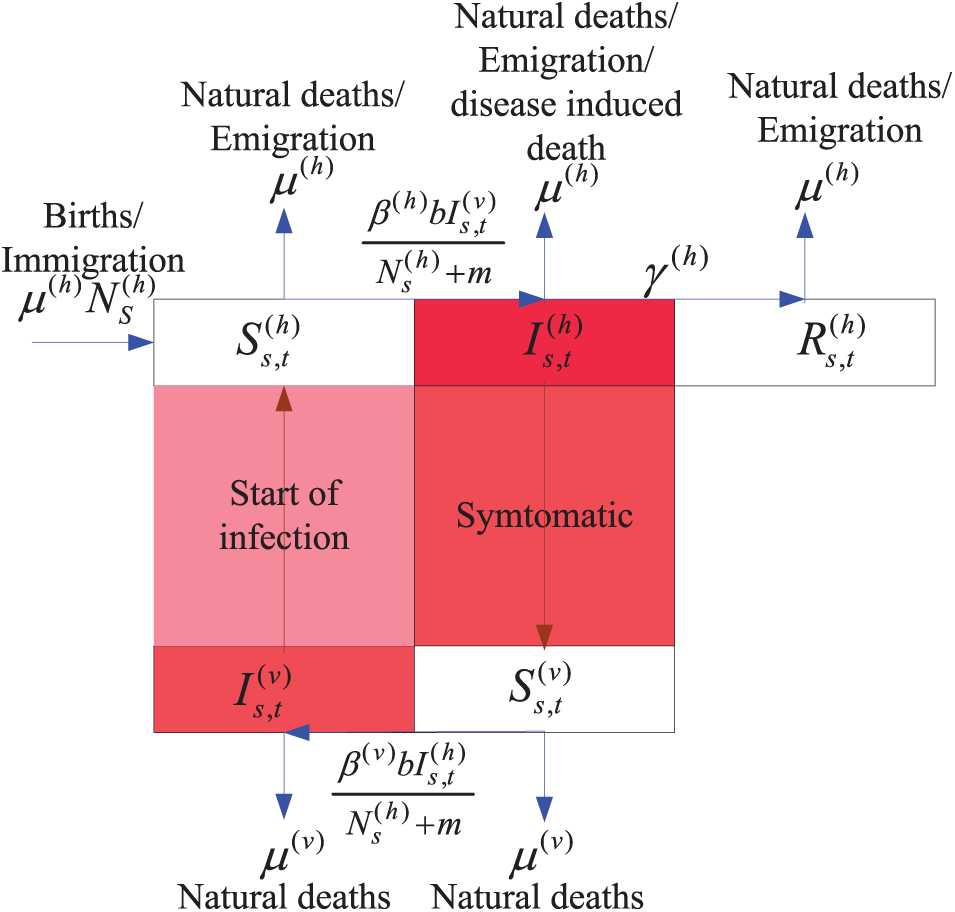
Figure 1: Epidemiological compartment of SIR-SI model
The SIR-SI framework illustrated in Fig. 1 converted into a system of differential equations. These equations establish the stochastic process (refer to Eq. (1)). The
The equilibrium points are obtained by setting all derivatives (1) to zero
The Jacobian matrix is composed of (2), obtained
The stability analysis of system (1) on the Jacobian matrix is sufficient. In this research, we do not describe the details of the Jacobian matrix and only focus on estimating model parameters.
2.2 Approximation Bayesian Inference with INLA
The INLA algorithm provides a deterministic method for Bayesian inference, distinguishing it from simulation-based approaches such as Monte Carlo (MC) and MCMC methods [19,26]. The primary goal of Bayesian computation is to determine the marginal posterior distributions for the parameter vector
The dataset used for model validation includes monthly DHF case reports from 10 sub-districts in Kendari City, the capital of Southeast Sulawesi Province, Indonesia. This area faces an annual risk of DHF outbreaks (see Fig. 2). The sub-districts covered in the analysis are Mandonga, Baruga, Puuwatu, Kadia, Wua-Wua, Poasia, Abeli (including Nambo), Kambu, Kendari, and Kendari Barat. The data was collected by the Kendari Health Office for the period from 2020 to 2023.
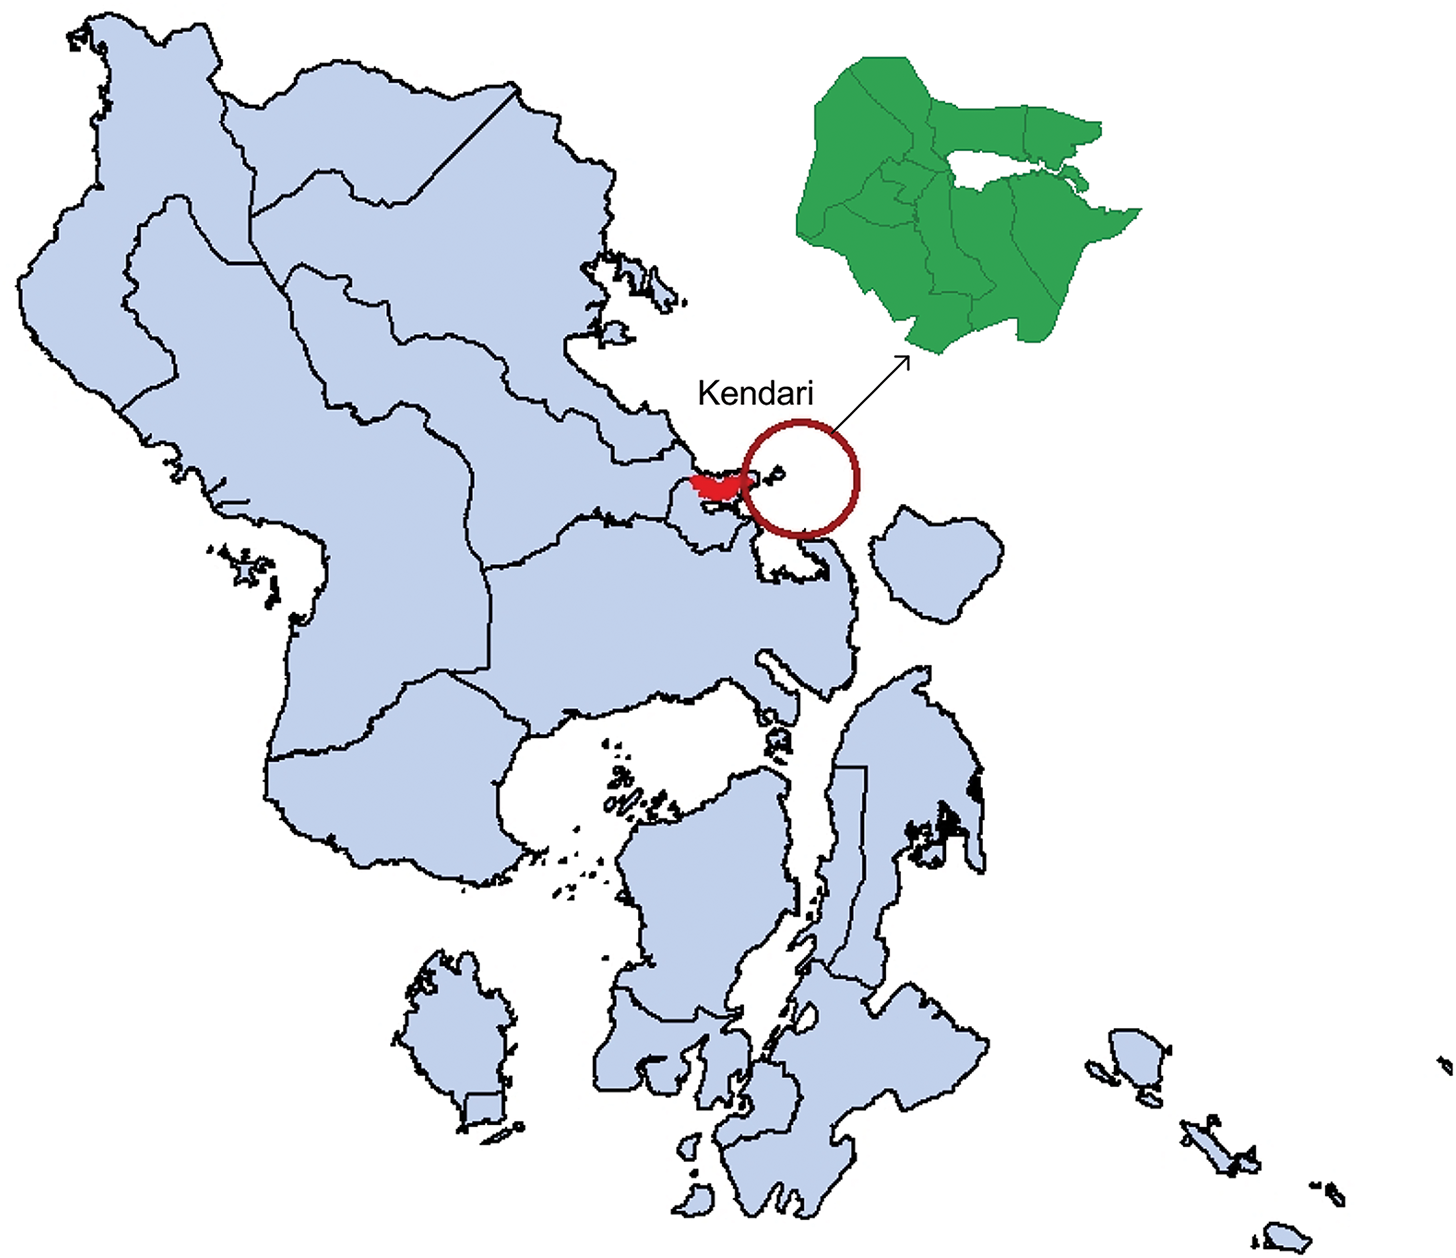
Figure 2: Research sites, 10 districts, in Kendari City (red color)
Data from 2020 to 2023 reveals a notable rise in monthly DHF cases in January, peaking in February and gradually declining through May. The highest number of cases during this period are in the Kadia, Kambu, and Wua-Wua districts, with these areas showing consistent trends each year. Other areas, such as Baruga and Kendari Barat, also experienced high cases during this timeframe. However, they were less consistent than the three main districts (see Fig. 3). The dynamics and consistency of dengue fever cases require statistical modeling.
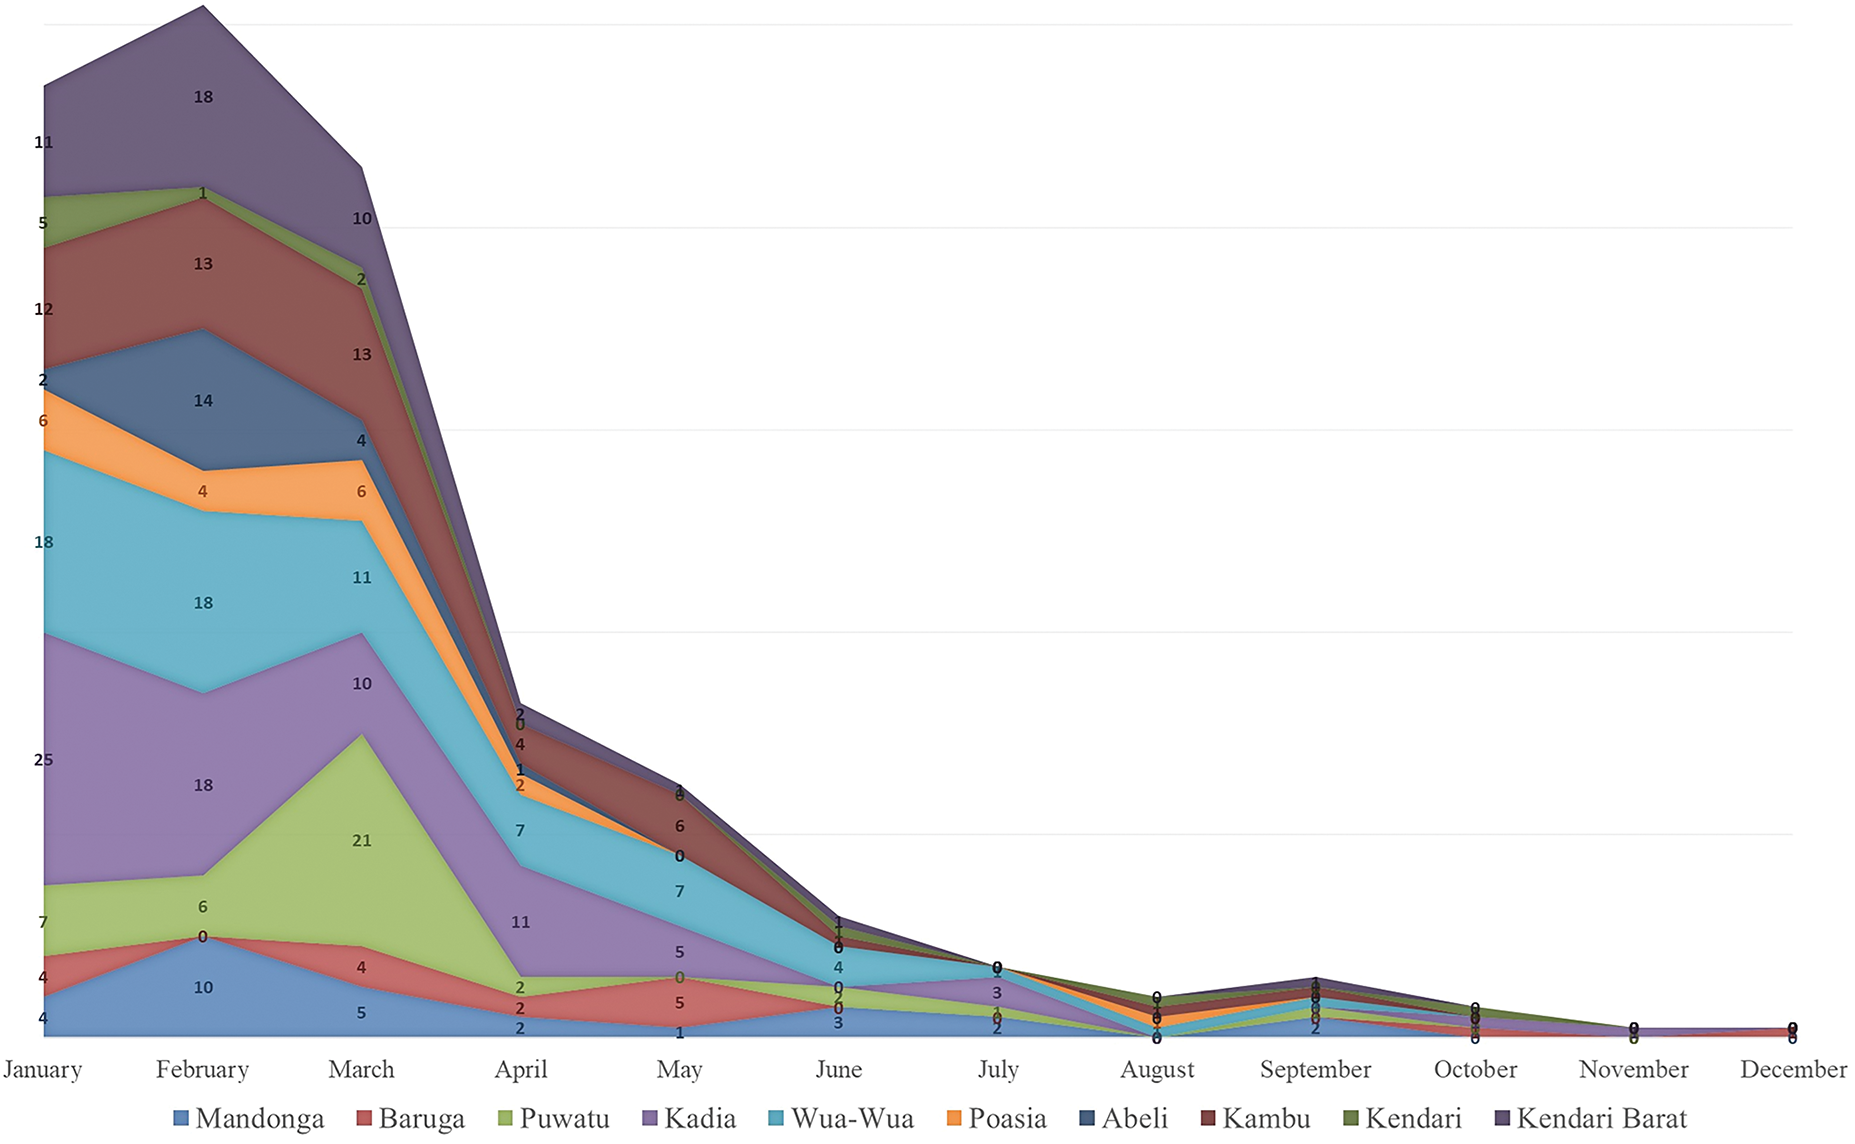
Figure 3: Monthly DHF data for Kendari City by district from 2020 to 2023
Probabilistic techniques can effectively manage issues such as missing data, outliers, inconsistencies, and normalization or aggregation through a Bayesian framework. The flexibility of Bayesian methods, such as imputation, robust likelihood functions, hierarchical structures, and prior distributions, allows addressing these data challenges to improve accuracy. These methods help ensure the model can generate reliable predictions even when working with incomplete or noisy data.
Based on the Kendari Central Bureau of Statistics data, Kadia district holds the highest population density, with Wua-Wua district ranking second. Meanwhile, information from the Kendari Meteorology, Climatology, and Geophysics Agency indicates that the heaviest rainfall, usually between December and July, ranges from 67 to 238.6 mm3 (Fig. 4).
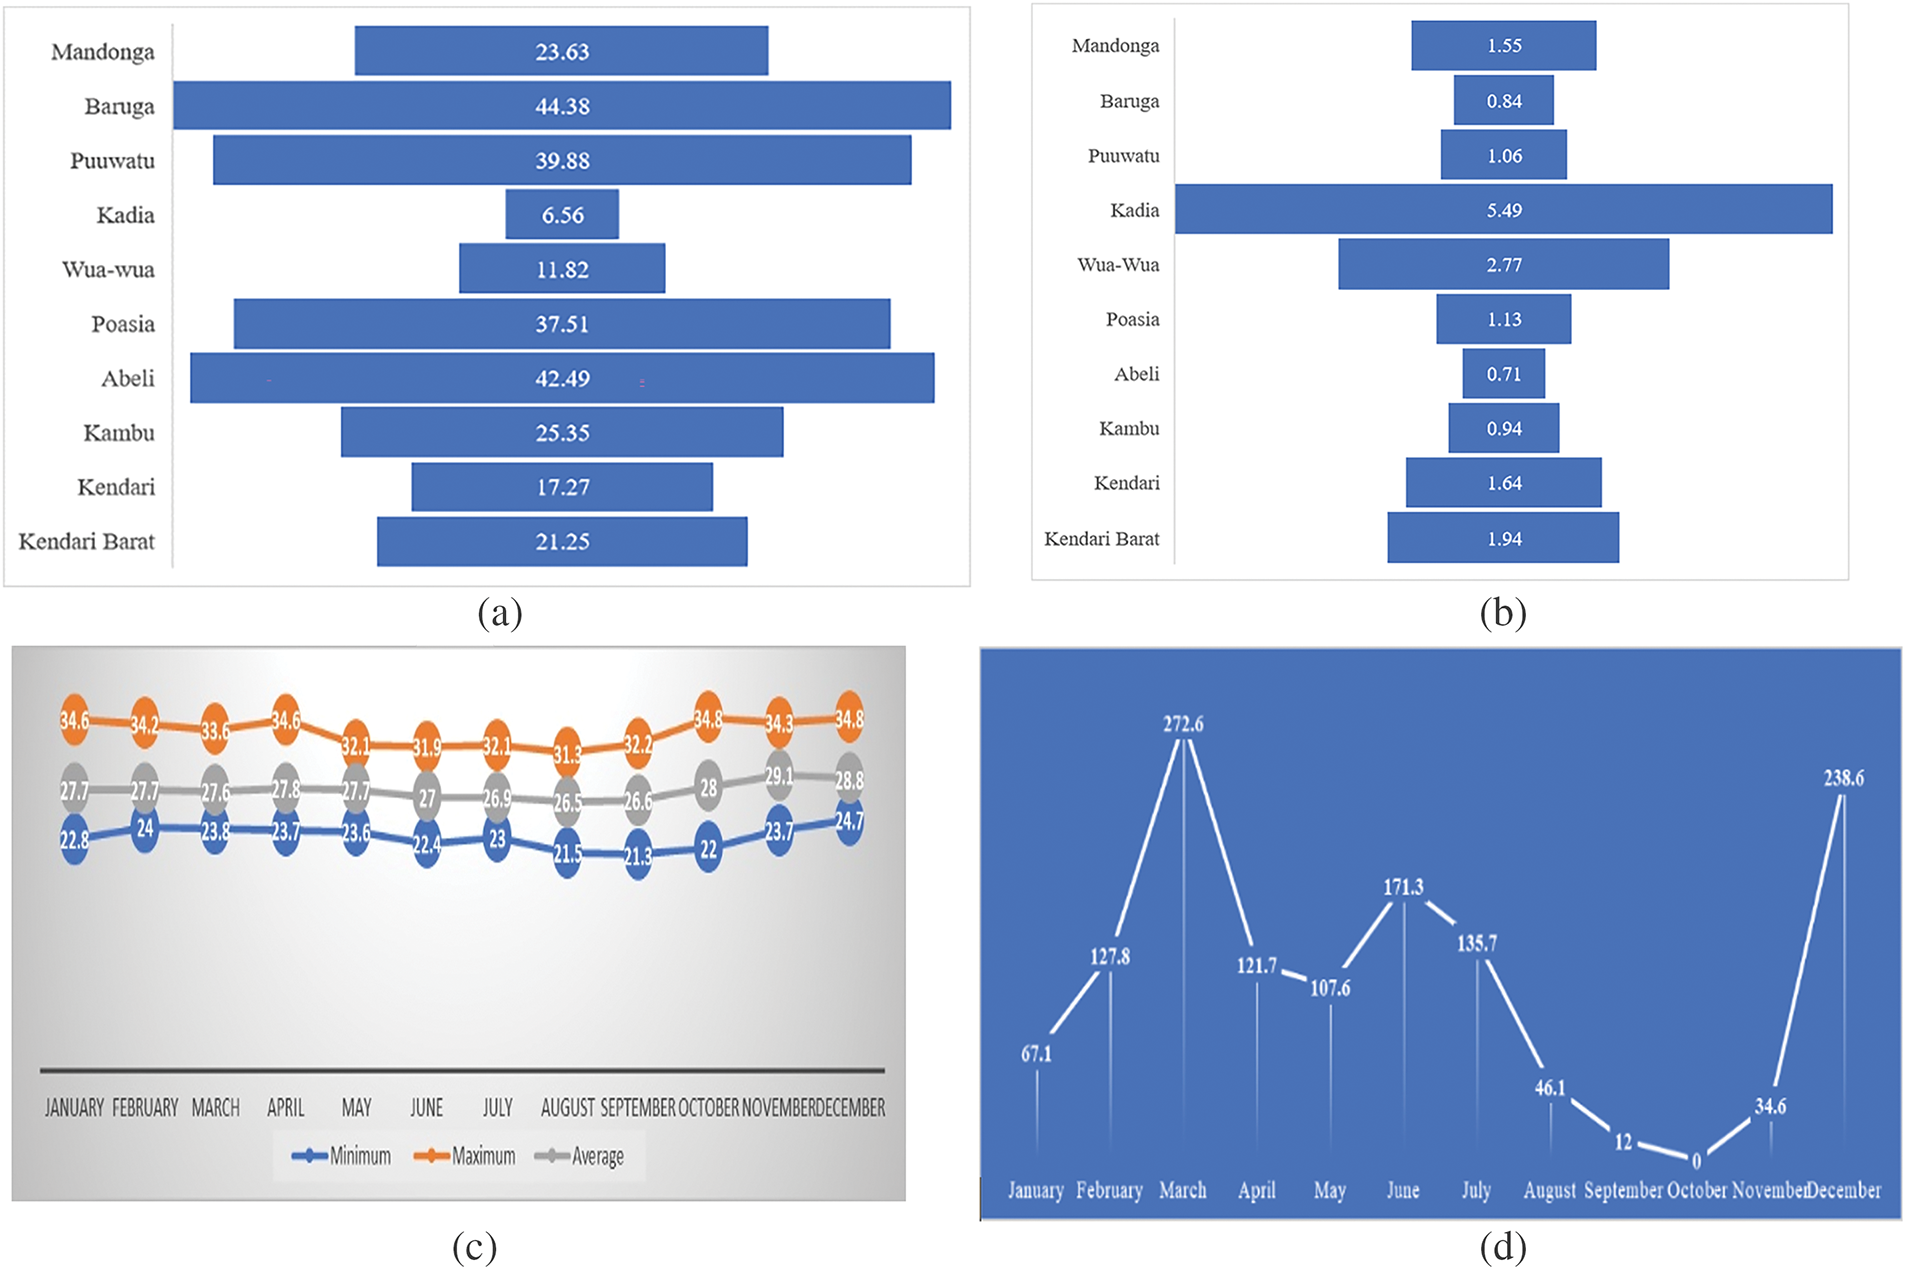
Figure 4: population density, climate, and rainy days of Kendari. (a) number of populations per district of Kendari (km2); (b) population density per district of Kendari; (c) climate (°C); (d) rainy Days (mm3)
The modelling framework (1) for dengue fever transmission across human and vector populations is visible, including key variables as predictors or latent factors, and accounts for climate variability phenomena like El Niño or La Niña. Climate factors like temperature, rainfall, and humidity are essential predictors of dengue transmission, as they affect the life cycle of the vector (mosquitoes) and the probability of transmission. Significant climate phenomena such as El Niño and La Niña may significantly influence temperature and rainfall patterns, affecting transmission dynamics. These events introduce climate-driven factors that modulate the associated transmission rates. These could affect vector survival rates, mosquito reproduction rates, and overall transmission dynamics. The latent variable is a time-varying factor that influences key parameters; however, in this work, it has yet to be accommodated in the model (1) and is an open issue for researchers. Including climate variability allows the model to capture feedback loops between climate and disease transmission. For example, warmer temperatures might increase mosquito populations, leading to higher infection rates, which could influence future mosquito dynamics (as human population immunity or behaviour changes). The model can integrate these changes into its predictions as climate change alters the frequency and intensity of events such as El Niño and La Niña. By analyzing the long-term impacts of shifting climate patterns, the model could pinpoint emerging areas at risk for dengue outbreaks, including those previously unaffected. Incorporating climate variables like temperature, rainfall, and climate phenomena, e.g., El Niño or La Niña, as dynamic predictors or latent factors significantly enhances the model’s accuracy and long-term relevance. This capability enables the model to adapt to climate variability, deepen insights into disease transmission dynamics, and deliver more dependable forecasts to support public health interventions.
The calculation of infected mosquito data relies on the newly infected mosquitoes in the SIR-SI framework and is based on the findings of [2,3], expressed as
Empirical data and literature reviews of parameters such as biting and death rates are derived from empirical studies or established literature. Validation involves comparing these values against observed field data specific to the study region. For example, prior entomological surveys may inform average mosquito lifespans and feeding frequencies in tropical climates (e.g., Kendari, Indonesia). Constant biting and death rates can overlook the effects of weather, seasonality, and mosquito population fluctuations, potentially underestimating or overestimating disease transmission risk during specific periods. Over-simplification can lead to inaccuracies when projecting future outbreaks, especially in scenarios with abrupt environmental changes, like heavy rainfall or extreme temperatures. Incorporating stochastic terms or time-varying functions to represent biting and death rates can improve the robustness model without sacrificing computational efficiency.
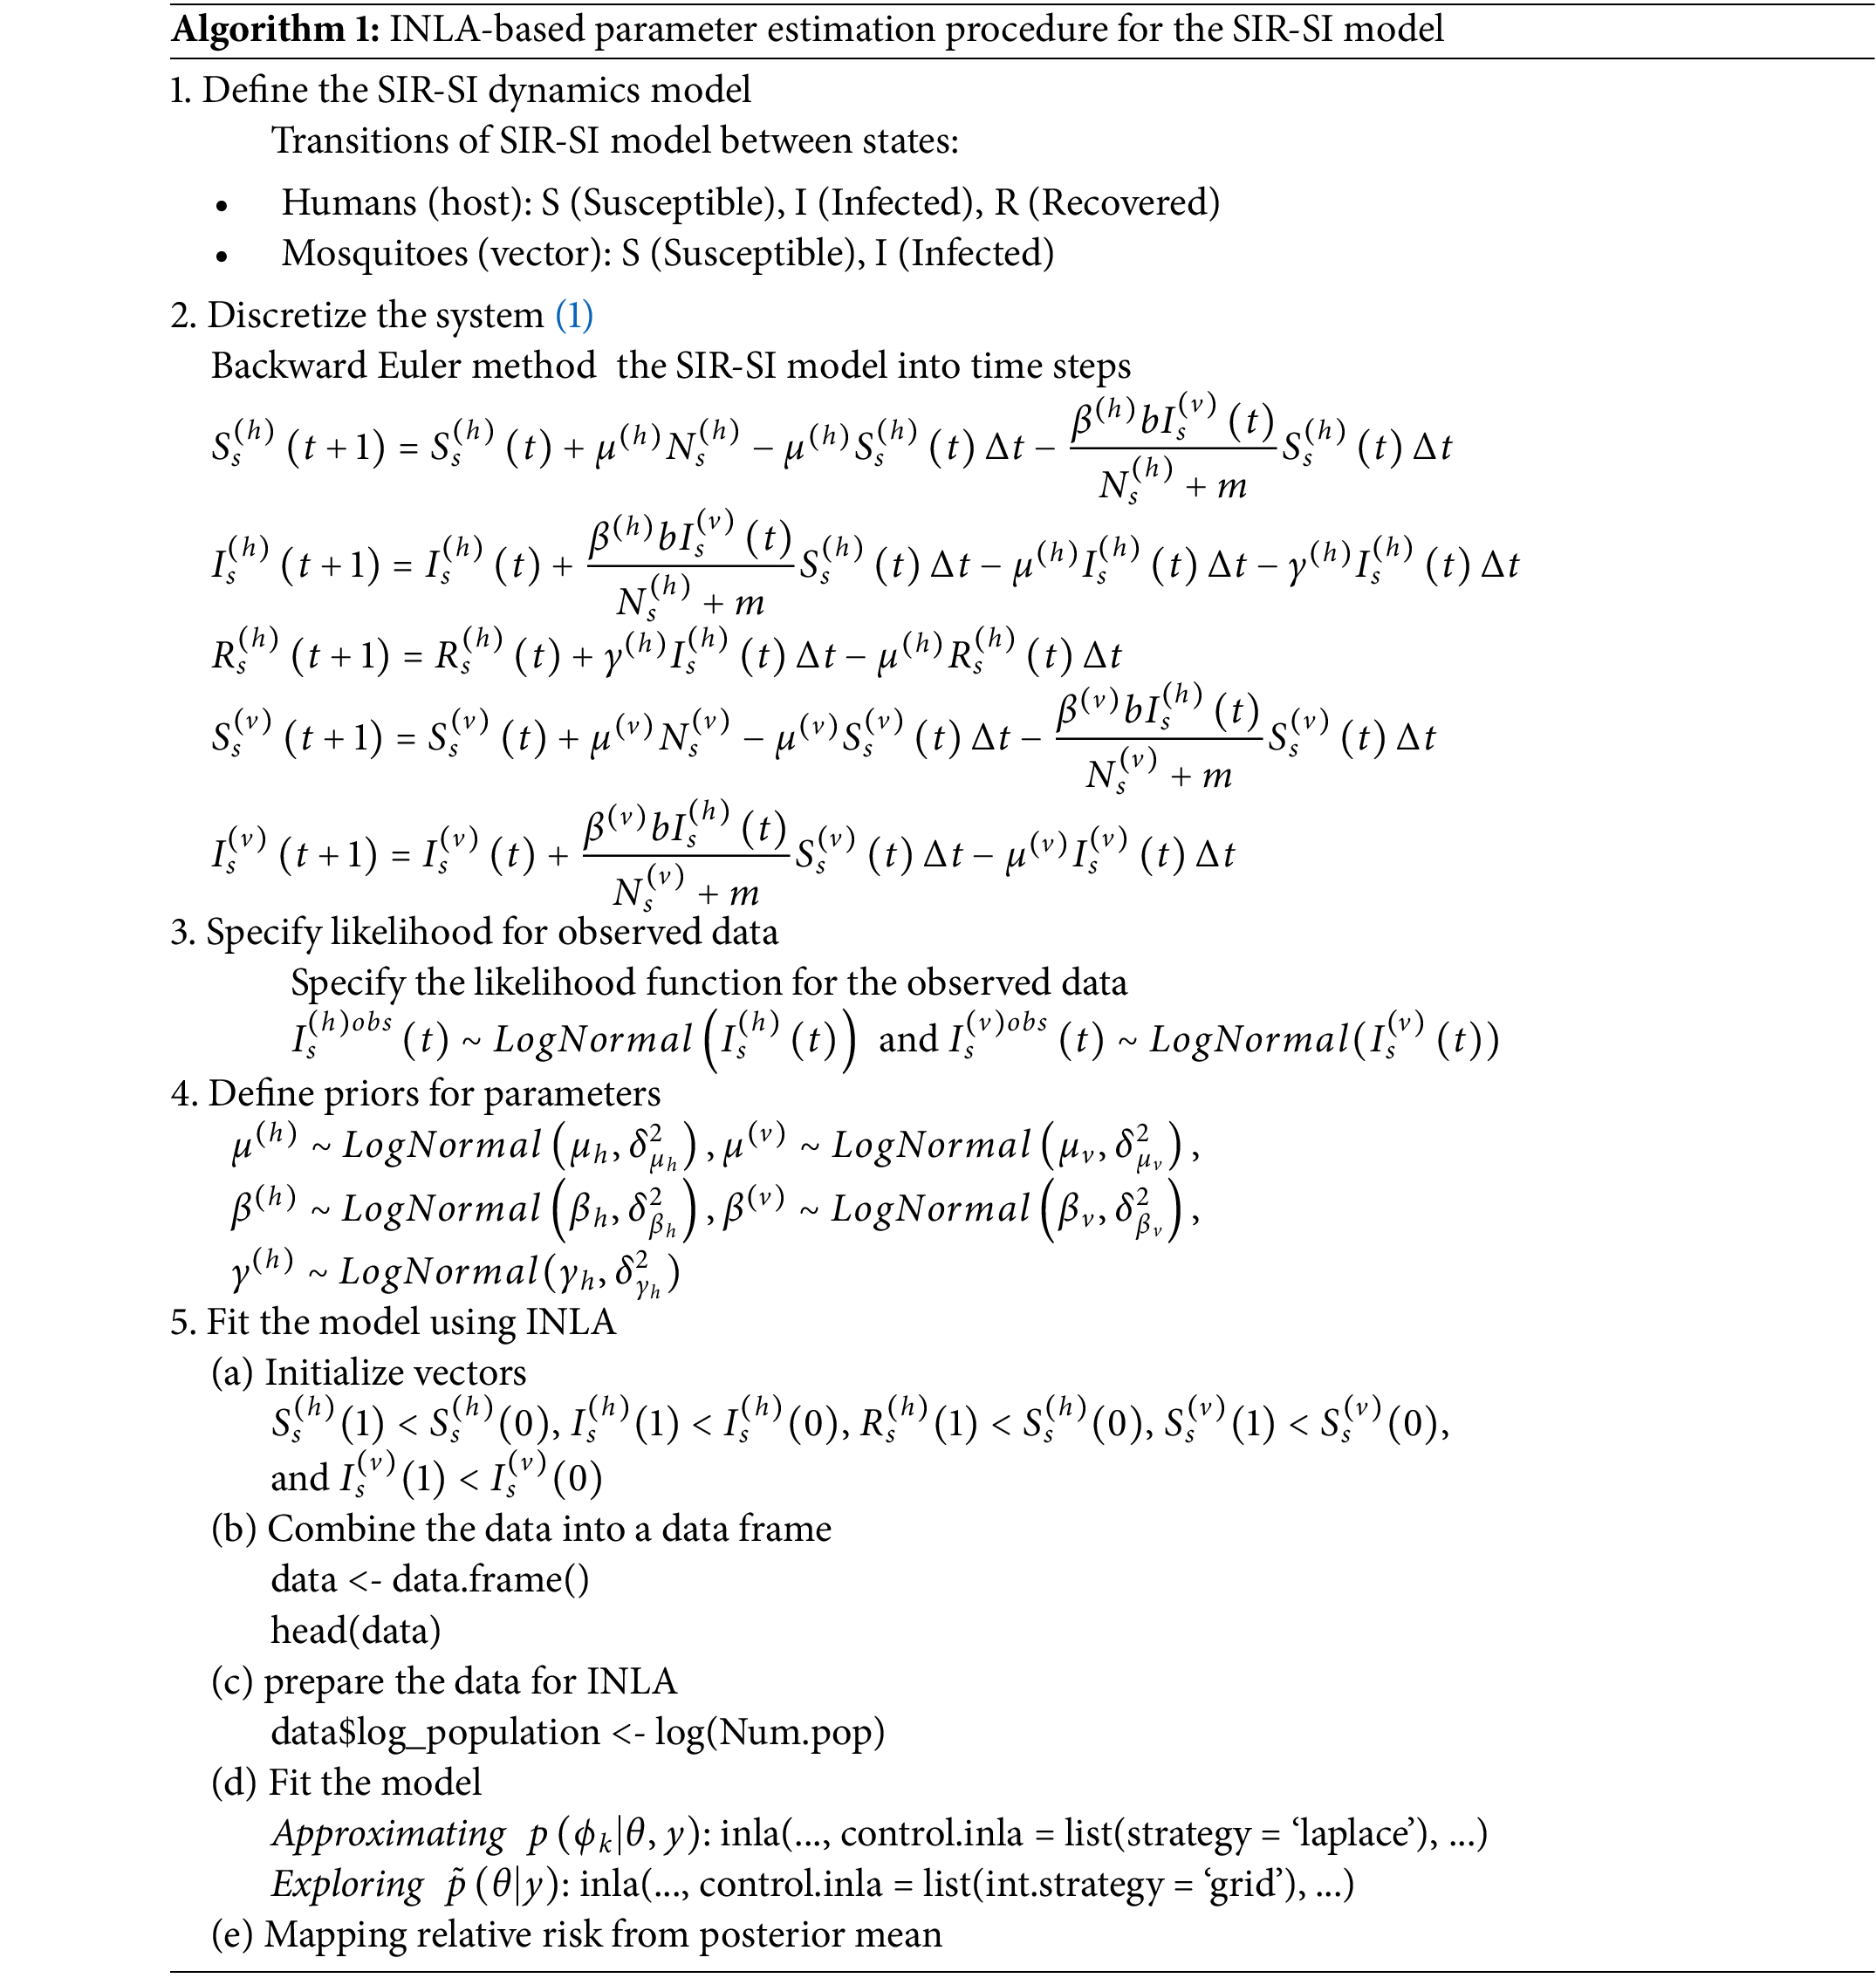
The INLA and MCMC methods provide unique benefits for the Bayesian analysis of a dengue transmission SIR-SI model. Incorporating stochastic processes into human-mosquito interactions allows the SIR-SI model to capture the variability inherent in real-world dengue transmission. Bayesian estimation uses flexibility by addressing parameter uncertainty, which contributes to generating more realistic projections of outbreak patterns. MCMC is known for its flexibility and precision. However, it can be computationally intensive, while INLA provides faster and more efficient results, particularly for larger models, albeit with an approximate trade-off. One drawback of MCMC is the selection of unsuitable prior values, which can lead to issues like getting stuck during the iteration process. This problem often requires repeated attempts and may take days or weeks to achieve convergence. MCMC also requires careful convergence diagnostics, whereas INLA, a deterministic approximation method, does not face this issue and can yield parameter estimates in seconds or minutes. For instance, MCMC requires 10,000 iterations with a burn-in of 80,000 (Table 1), whereas INLA only needs 10,000 to obtain converged parameters (see Algorithm 1). The sensitivity analysis demonstrates highly precise parameter estimates. In a Bayesian framework, sensitivity is assessed through 95% credible intervals or trace plots. Selecting parameter values outside the credible interval decreases the accuracy of the outcome. For instance, the parameter


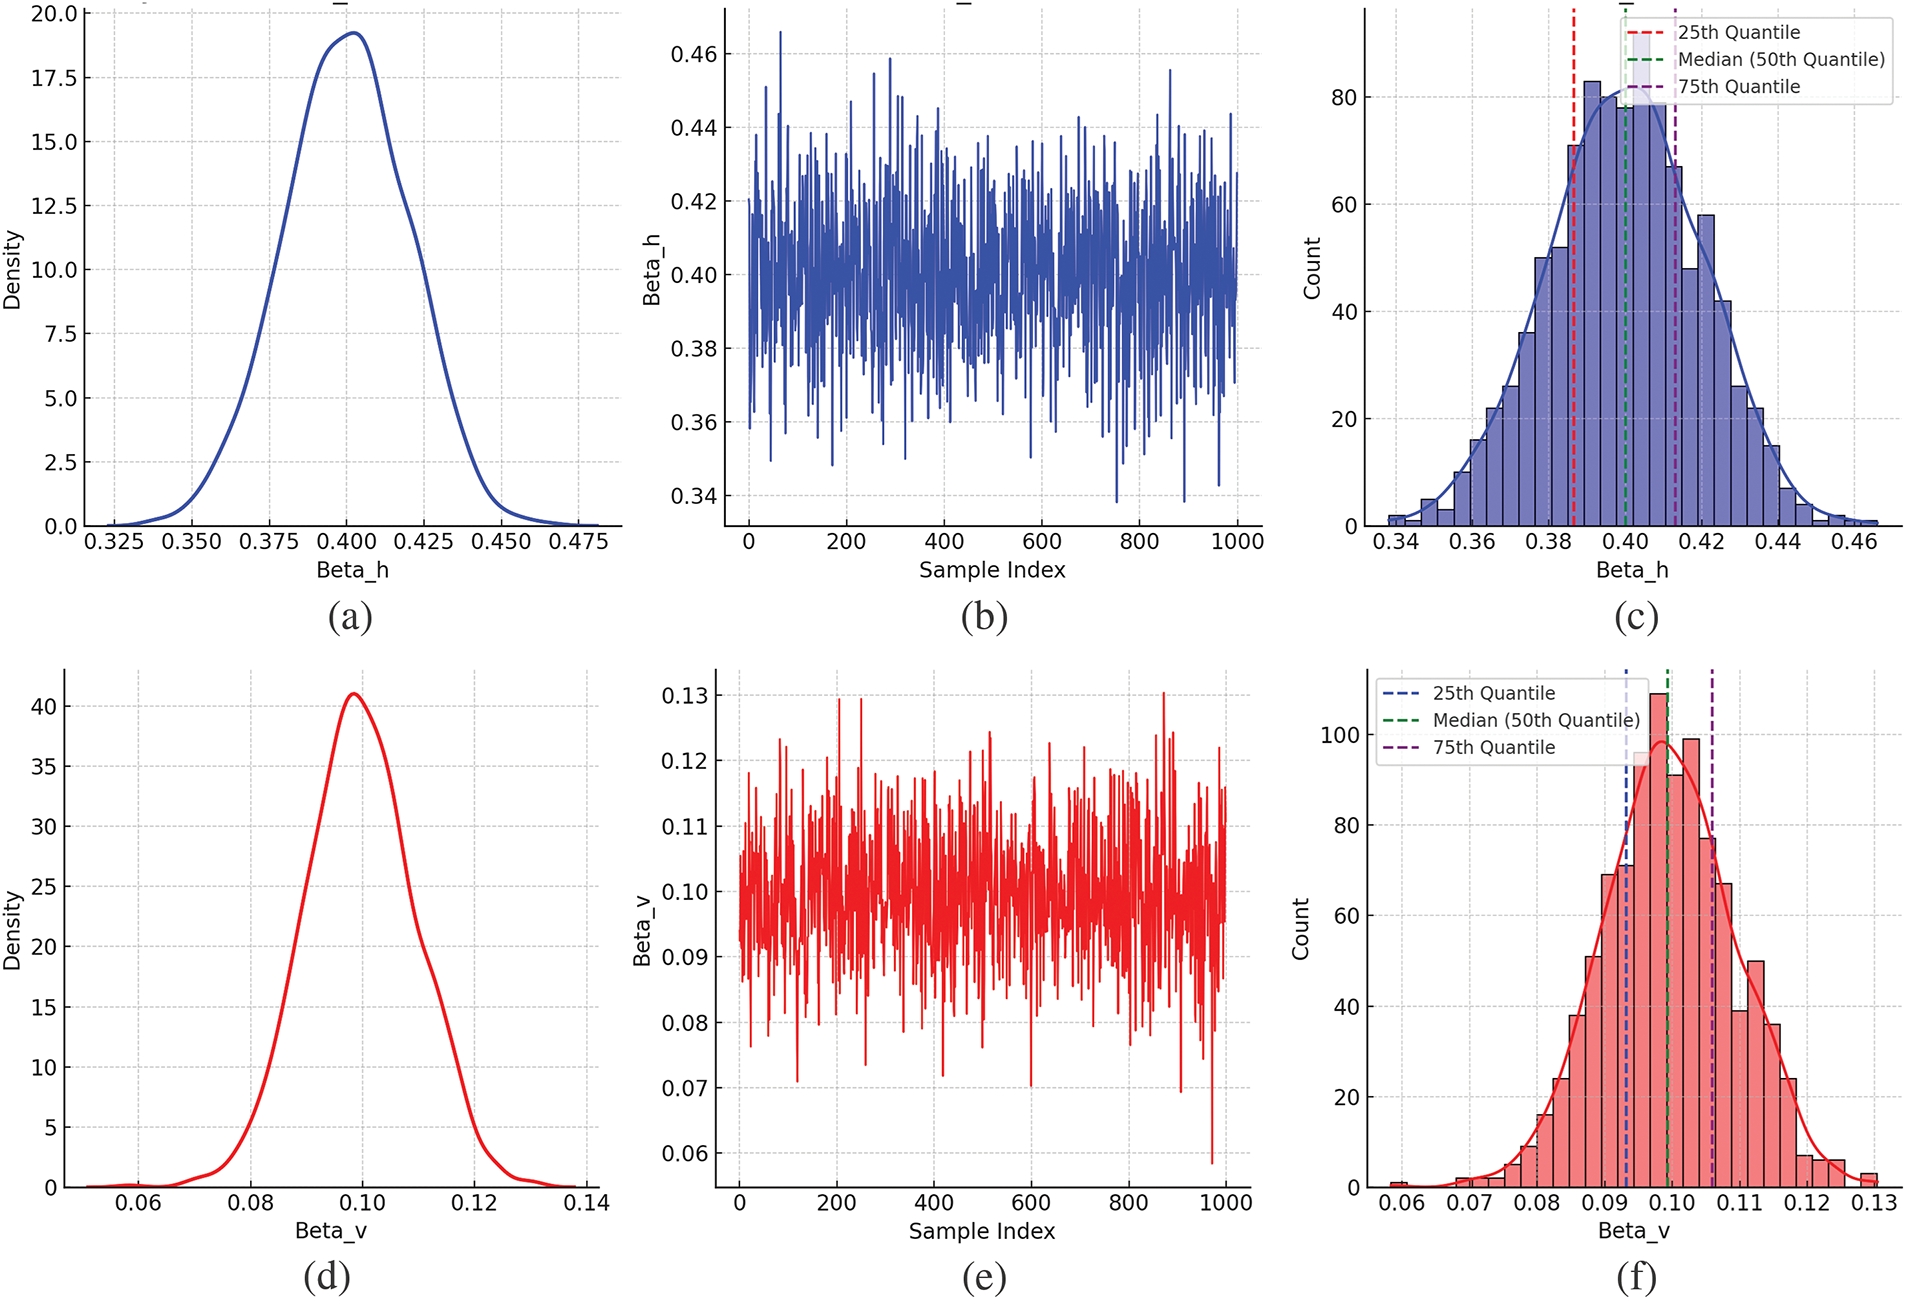
Figure 5: Estimation of SIR-SI model parameters using INLA,
The provided visualization compares the uncertainty bounds (posterior distributions) of individual parameters between INLA (blue) and MCMC (red). The dots represent the estimated posterior means for INLA and MCMC methods. The vertical lines (error bars) represent the 95% credible intervals, showing each uncertainty parameter range. The visualization effectively highlights differences in uncertainty and convergence precision for each parameter under the two methodologies, which is critical for understanding the robustness of the parameter estimates in a modelling context (see Fig. 6).
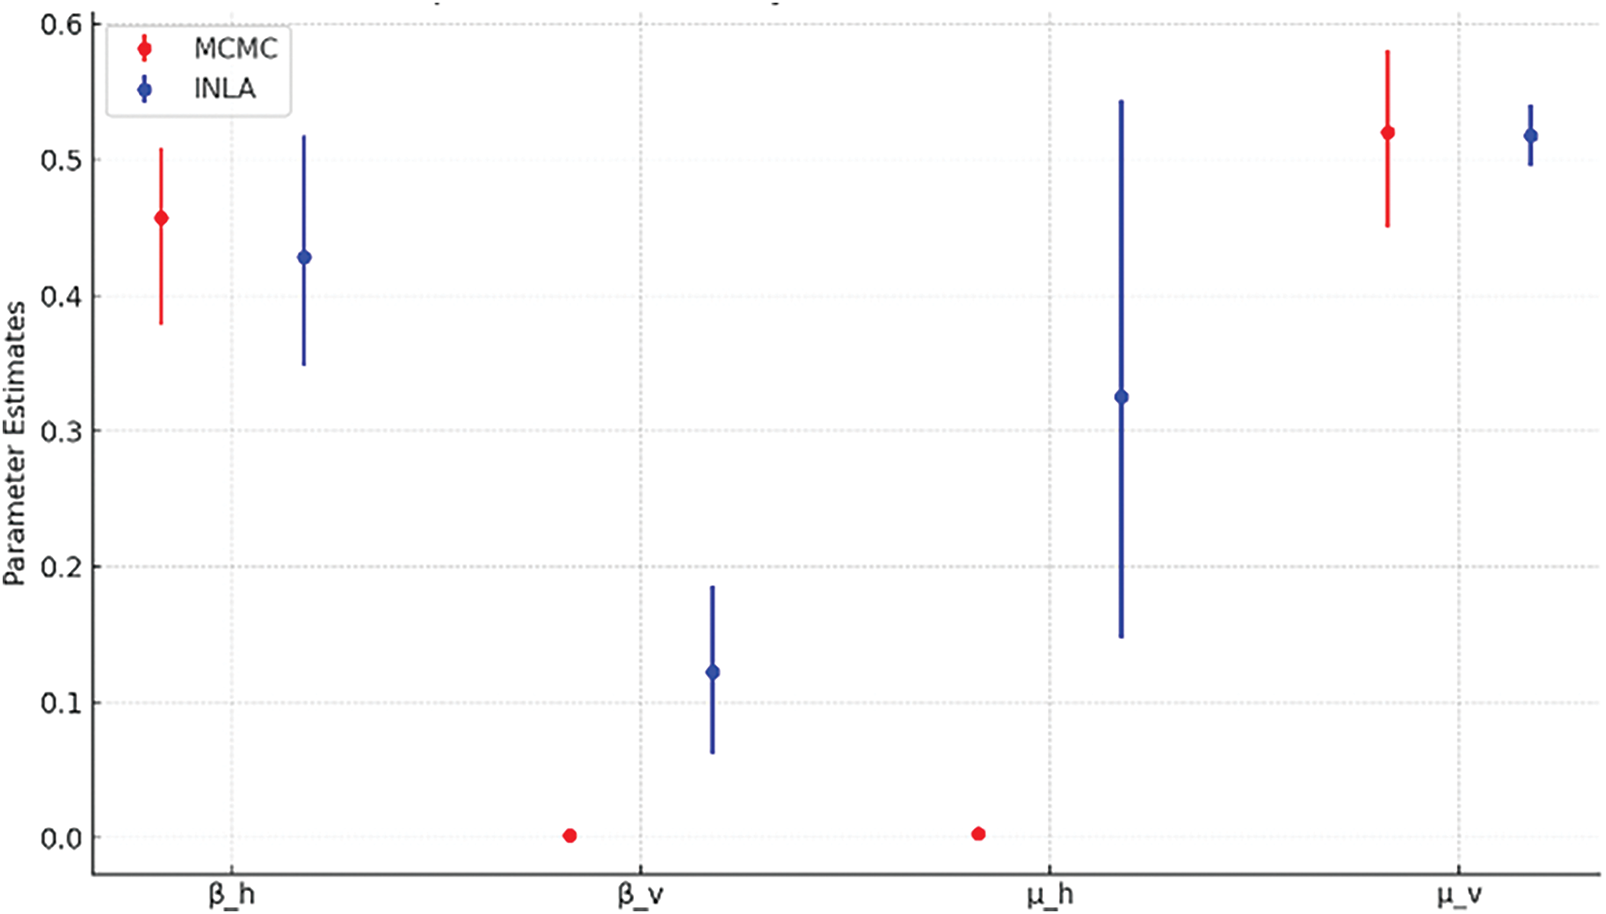
Figure 6: Comparison of uncertainty bound between INLA and MCMC
INLA precision is preferable for quicker, actionable insights. The MCMC uncertainty might be attributed to difficulties in estimating the parameters, especially if the data weakly inform the parameter. The INLA provides a more reliable and narrower estimate, which is advantageous for decision-making. The INLA generally produces narrower uncertainty bounds for most parameters. The INLA makes it more suitable for applications requiring quick and precise parameter estimates than the MCMC. The central tendencies (posterior means) differ slightly between the two methods because they combine over the posterior distribution or handle parameter correlations. The INLA result indicates better precision than the MCMC and explores a broader range of the posterior distribution. For computational efficiency, the INLA converges faster than the MCMC (especially for complex models), making it an attractive option for real-time decision-making. The comparison underscores the trade-offs between MCMC and INLA for parameter estimation in epidemiological models.
The incidence rate in Fig. 7 represents the number of DHF cases per 10,000 people, calculated based on the total population exposure time. This rate illustrates the trends and risks of DHF in each district of Kendari City. For instance, the Kadia district experienced an average of 25 cases per 10,000 people in January 2020–2023, gradually decreasing to nearly zero by December. In contrast, Puwatu District had an average of 7 cases per 10,000 people in January, with a sharp increase to about 21 cases in March before dropping to zero from April to December. Overall, DHF cases in all districts of Kendari City fluctuated between January and May during this period. While the incidence rate reflects these trends, it does not fully capture the overall DHF risk, serving as an initial indicator for more detailed risk analysis. The Wua-Wua district requires targeted efforts to reduce the DHF transmission rate in Kendari City. Early intervention and monitoring should commence in January to prevent the breeding of mosquito larvae in these areas. In the Puuwatu, Kambu, and Kendari Barat districts, DHF cases tend to emerge sporadically, influenced by outbreaks in Kadia and Wua-Wua Districts. Since the parameters are expressed as proportions, they are dimensionless constants. The relative risk analysis indicates that DHF cases vary annually from January to July, with monthly incidence rates from 2020 to 2023 (see Fig. 7). This period highlights the annual fluctuations of dengue transmission, with a consistent occurrence of DHF cases from January to May. The study highlighted Kadia and Wua-Wua districts with persistently high case rates.
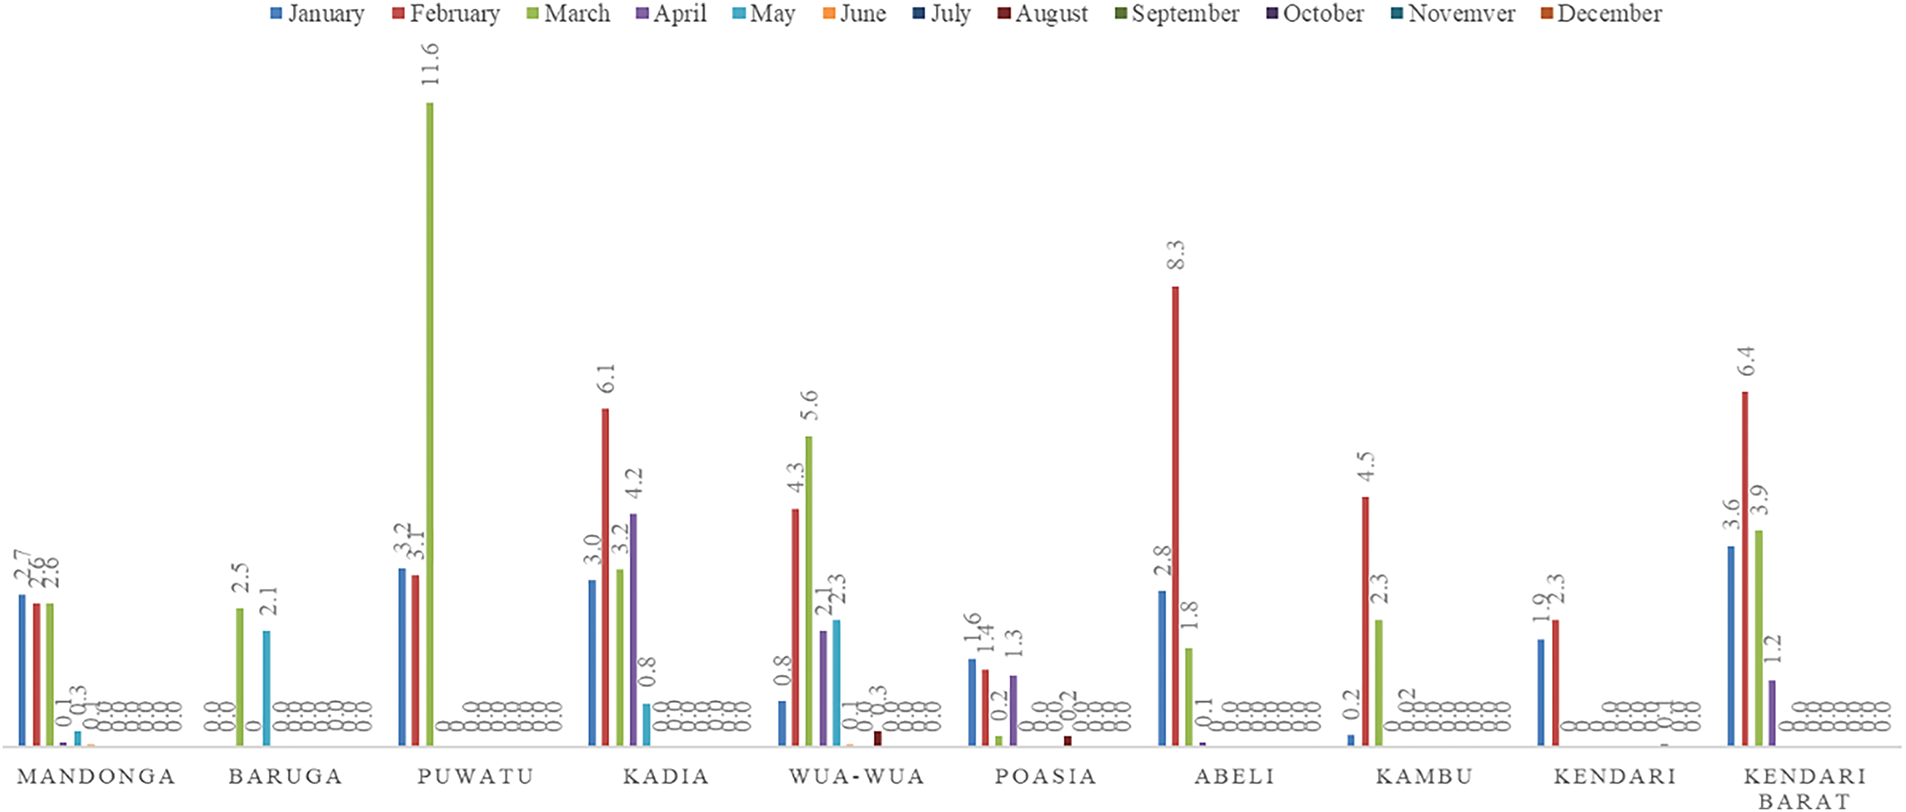
Figure 7: Monthly DHF incident rates by sub-district in Kendari city for the period of 2020–2023
The DHF is a critical complication of dengue virus infection that necessitates focused and proactive control measures. Insights from models built on statistical and computational methods can significantly contribute to these efforts, enhancing the ability to predict, prevent, and manage DHF outbreaks with greater precision. Geospatial models are helpful in pinpointing regions at high risk for DHF outbreaks by analyzing historical data and environmental conditions, enabling timely interventions. These models can detect areas where mosquito populations are increasing rapidly or where human-mosquito interactions are most frequent, allowing mosquito control efforts like larviciding, insecticide spraying, and public education to be concentrated in these zones. By forecasting the likely timing and locations of outbreaks, these models also help optimize the distribution of resources such as mosquito nets, insecticide-treated materials, and trained personnel, ensuring that high-risk areas are prioritized.
Models can identify high-risk areas, enabling targeted public health campaigns to educate communities on DHF prevention and promote behaviors like eliminating stagnant water and wearing protective clothing. Moreover, behaviors models can predict how community participation, such as involvement in clean-up activities or adherence to preventive measures, affects the overall effectiveness of DHF control programs. Insights from models enable ongoing monitoring of the effectiveness of interventions, such as vector control measures, offering real-time feedback to adjust strategies as needed. As new data emerges, whether related to climate changes or viral mutations, models can evolve and provide updated recommendations for disease control, ensuring a dynamic and adaptable approach to managing DHF. By integrating these model-based insights into DHF control strategies, health efforts become more data-driven, proactive, and scalable, helping to prevent outbreaks and reduce the impact on affected communities. Predicting DHF outbreaks through models incorporating environmental, epidemiological, and behaviors data can significantly enhance the efficiency and effect of resource distribution. Accurate forecasts enable early intervention, focusing efforts on high-risk areas, optimizing vector control measures, and ensuring healthcare resources are directed where they are most needed. This data-driven approach to managing DHF provides a proactive strategy for controlling the disease, limiting its spread, and ultimately saving lives.
The updated risk map for January provides valuable insights into the distribution of dengue risk across Kendari and can serve as a decision-making tool for resource allocation. Kambu and Wua-Wua districts were identified as high-risk zones. These districts should be a priority for larvicide applications to reduce mosquito populations in breeding sites such as stagnant water bodies. Increase larvicide spraying frequency and mobilize teams to inspect and treat breeding grounds in these neighbourhoods. Kadia, Kendari Barat, and Baruga districts should targeted as secondary priorities. While more urgent than high-risk zones, preventive measures are necessary to stop potential escalation. Conduct surveillance and larvicide applications but at a slightly reduced frequency compared to high-risk areas. Then, the Mandonga, Puuwatu, and Abeli districts may require minimal larvicide application, primarily serving as monitoring zones to ensure no significant increase in risk (Fig. 8). These areas are control points to detect early warning signs of increasing risk. Intensify education campaigns in high-risk areas, focusing on:
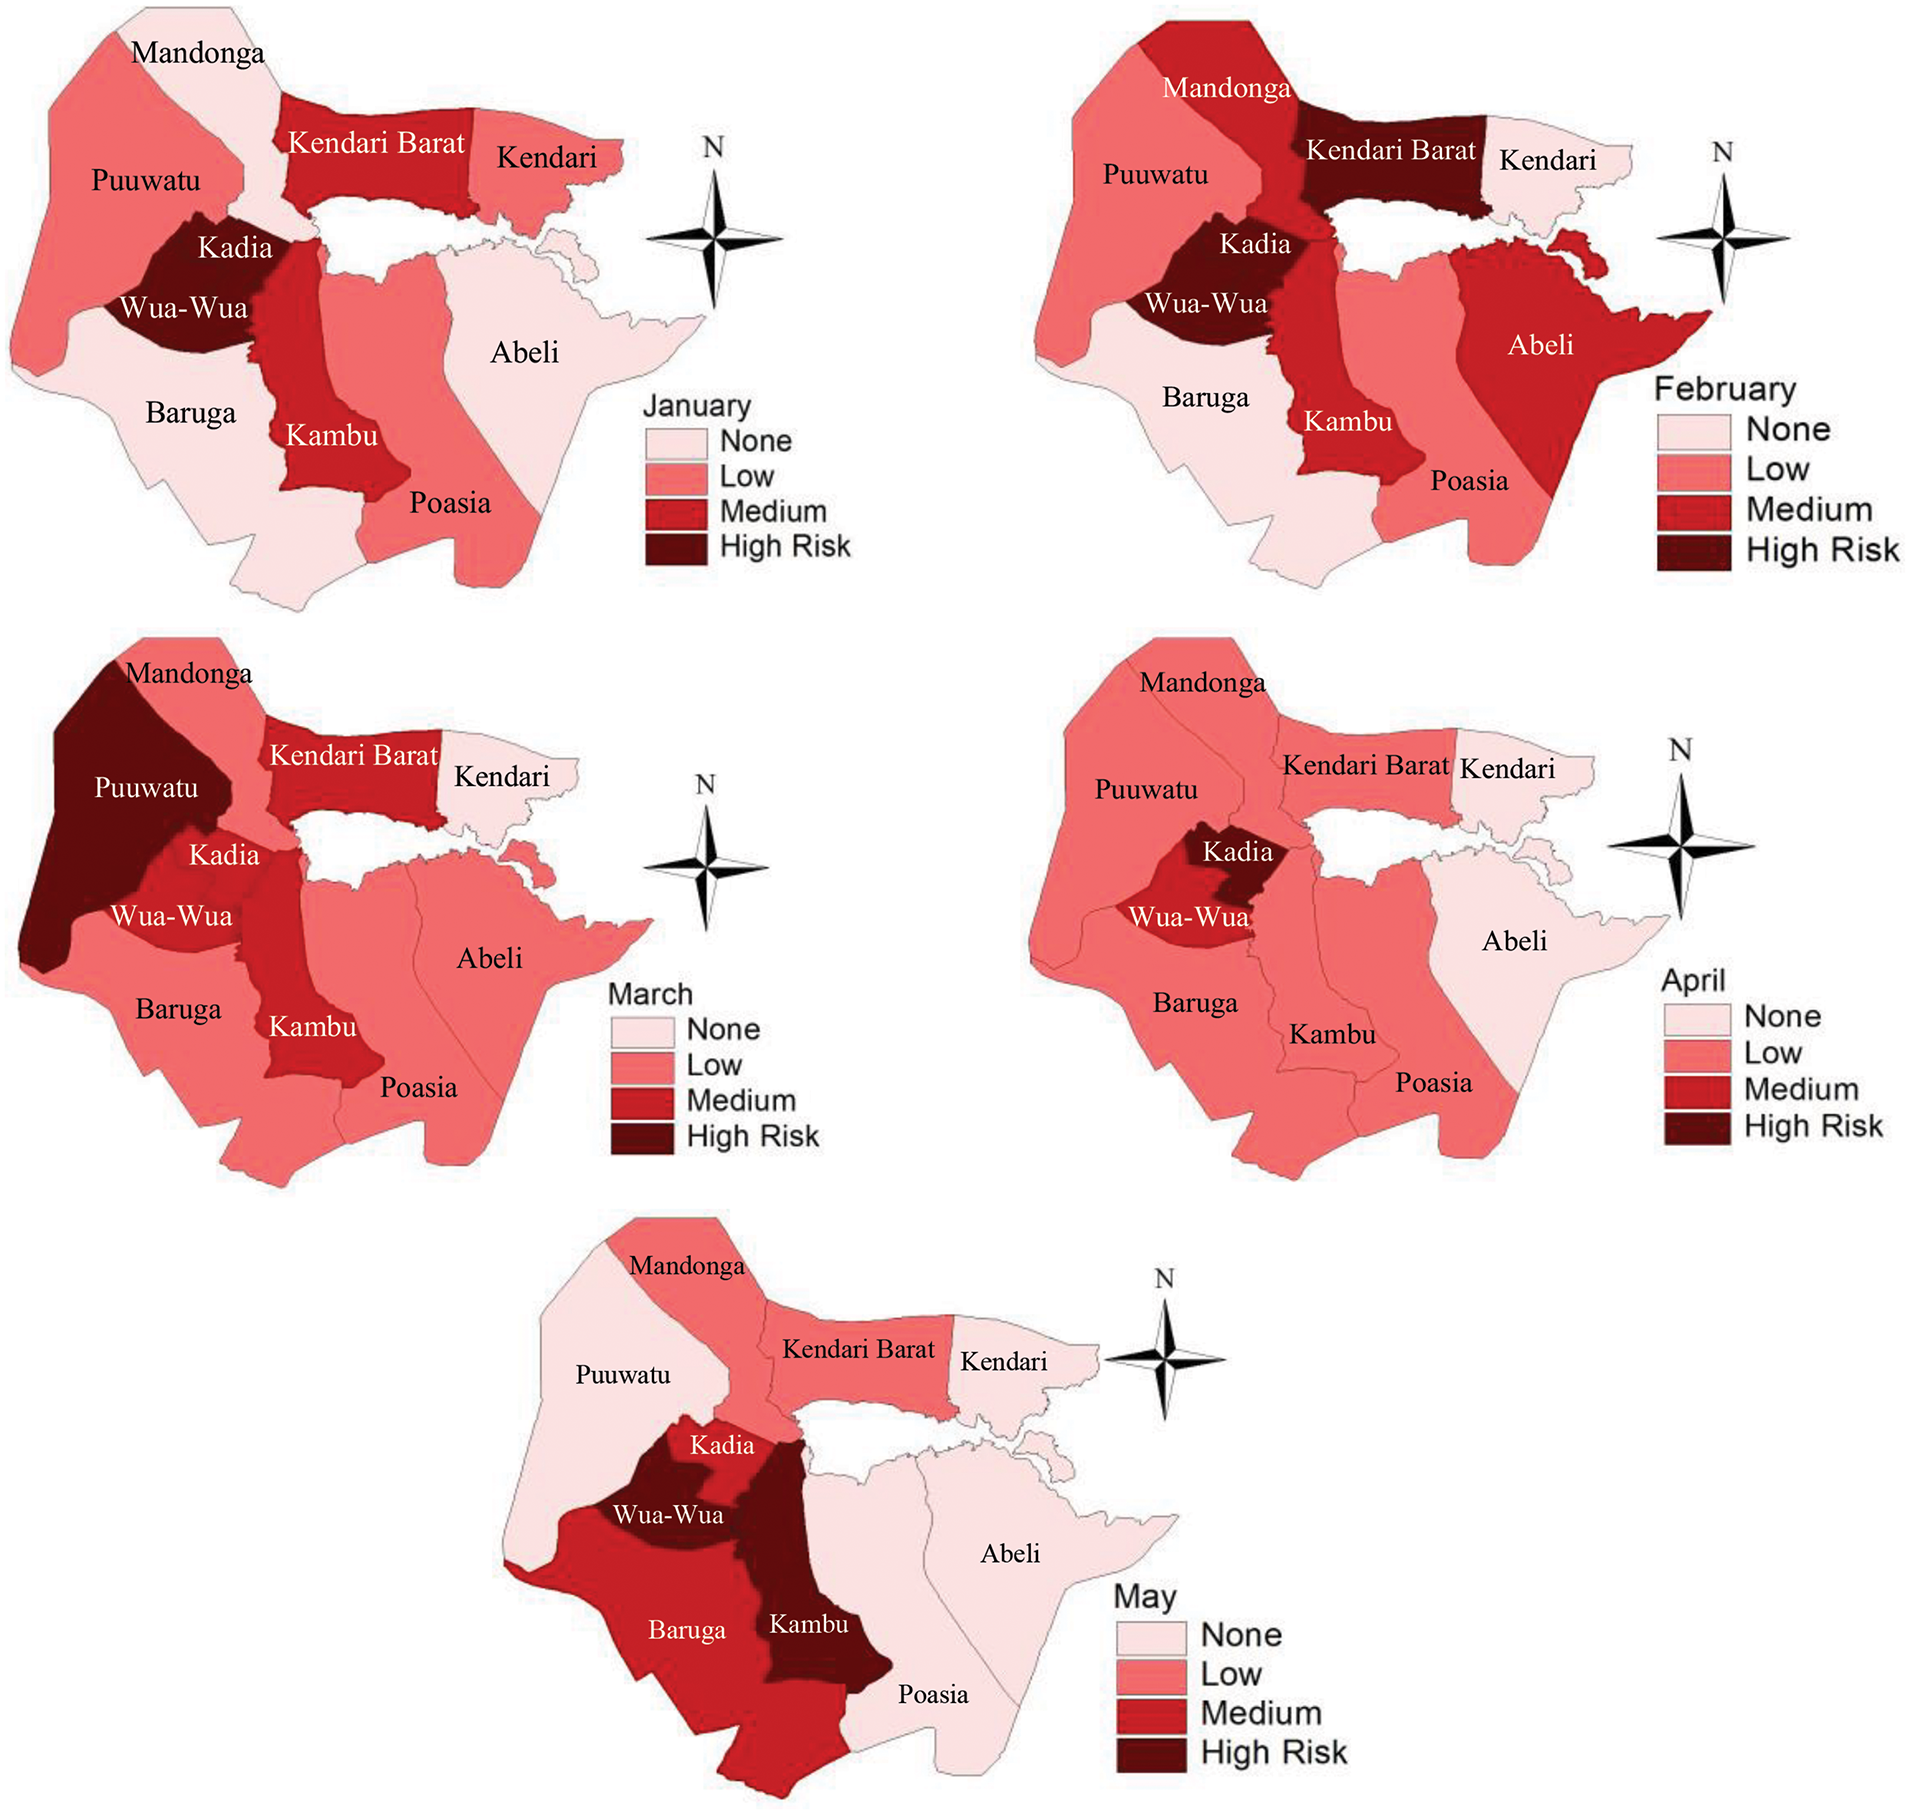
Figure 8: Dynamic DHF risk map utilizing Bayesian INLA SIR-SI models for the period from January to May annually
1. Removing standing water (mosquito breeding sites).
2. Encouraging the use of mosquito nets and repellents.
3. Raising awareness of early symptoms of dengue to ensure timely medical attention.
Partner with local leaders or community organizations to ensure grassroots-level outreach. For medium-risk areas, target messaging toward prevention and preparedness. Residents in medium-risk regions must know how to prevent escalation into high-risk zones. Then, for low-risk areas, conduct awareness sessions in schools, markets, and places of worship to reinforce preventive habits, such as proper waste disposal and water storage practices.
This study applies Bayesian INLA to estimate the parameters of the SIR-SI stochastic model, comparing it with previous research that used MCMC. Monthly dengue fever data from 10 districts in Kendari, Indonesia, from 2020 to 2023 is used. The INLA method delivers accurate parameter estimates, greater computational efficiency, and smooth integration with early warning systems. In contrast to MCMC, which requires 10,000 iterations with an 80,000 burn-in, INLA achieves parameter convergence with just 10,000 iterations. The results show that INLA offers a superior fit, with a lower deviance value of 105.23, outperforming MCMC. Risk analysis using INLA reveals consistent dengue case patterns from January to May in the Kadia and Wua-Wua districts, indicating a need for targeted interventions in Kendari City. Early surveillance and control measures are crucial for reducing mosquito breeding in these areas starting in January. Sporadic outbreaks in Puuwatu, Kambu, and Kendari Barat districts are often linked to cases in Kadia and Wua-Wua.
The Bayesian INLA SIR-SI model is a valuable tool for simulating infectious disease outbreaks, but it depends on assumptions about disease dynamics, population behavior, and data quality. Overcoming these challenges requires refining data collection, improving model accuracy, and incorporating real-world complexities. Enhancements like better handling time-varying dynamics and spatial variability, integrating real-time data and human behavior, and optimizing computational efficiency will lead to more practical and adaptable models. Such improvements will offer more robust tools for outbreak forecasting and public health interventions.
Future works on the Bayesian INLA SIR-SI model for DHF should improve prediction accuracy by including more diverse data, such as vector surveillance and mobility patterns, and enhancing real-time forecasting capabilities. Developing dynamic models that integrate environmental, seroprevalence, and socioeconomic data will strengthen the ability of the model to predict DHF transmission. Optimizing computational efficiency and enhancing the model to real-time early warning systems will help public health authorities respond more quickly and effectively to DHF outbreaks. In fractional and spatiotemporal modeling, the nonstandard finite difference method is crucial for preserving the dynamics of stochastic dengue models. Moving mobility data into a model entail collecting anonymous and aggregated movement information to develop movement matrices and track temporal trends. The method supports targeted public health interventions by directing resources toward areas and periods with higher risk associated with human mobility. Incorporating real-time data into dengue transmission models allows for adaptive updates that align with current conditions, enhancing forecast accuracy and supporting timely interventions. Public health agencies can use disease, environmental, and mobility data to adjust intervention strategies based on current risk assessments, optimizing resource allocation to mitigate dengue outbreaks better. This responsive, data-driven approach ensures that interventions are timely, targeted, and practical, contributing to improved dengue control and prevention outcomes.
Acknowledgement: We also extend our gratitude to the Department of Health, BPS, and BMKG of Kendari for granting us access to their observational data for this study. Thank you to Muhammad Ayub Hidayat (Student Identification Number or SIN: F1A218068), Ismi Ananta Heruddin (SIN: F1A220040), and Nur Ismi Khair (SIN: F1A220091) for their valuable contributions as data collectors. Additionally, we appreciate the anonymous reviewers for their valuable feedback and critiques. Their comments were carefully considered and contributed significantly to the enhancements made in the revised version of the paper, leading to notable improvements over the original submission.
Funding Statement: Authors wish to acknowledge the financial support from the Kementerian Pendidikan, Kebudayaan, Riset, dan Teknologi of Indonesia through Regular Fundamental Grant No. 049/E5/PG.02.00.PL/2024.
Author Contributions: Contributions for each author to the paper as follows: study conception and model construction: Mukhsar, Gusti Ngurah Adhi Wibawa; description and analysis data: Bahriddin Abapihi; numerical simulation: Andi Tenriawaru; analysis and interpretation of results: Sitti Wirdhana Ahmad, I Putu Sudayasa; draft manuscript preparation: Mukhsar, Andi Tenriawaru, Gusti Ngurah Adhi Wibawa, Bahriddin Abapihi, Sitti Wirdhana Ahmad, I Putu Sudayasa. All authors reviewed the results and approved the final version of the manuscript.
Availability of Data and Materials: The data that support the findings of this study are available from the corresponding author, Mukhsar, e-mail: mukhsar.mtmk@uho.ac.id, upon reasonable request.
Ethics Approval: Not applicable.
Conflicts of Interest: The authors declare no conflicts of interest to report regarding the present study.
References
1. Tran A, Deparis X, Dussart P, Morvan J, Rabarison P, Remy F, et al. Dengue spatial and temporal patterns, French Guiana, 2001. Emerg Infect Dis. 2004;10(4):615–21. doi:10.3201/eid1004.030186. [Google Scholar] [PubMed] [CrossRef]
2. Gubler DJ. Epidemic dengue/dengue hemorrhagic fever as a public health, social and economic problem in the 21st century. Trends Microbiol. 2002;10(2):100–3. doi:10.1016/S0966-842X(01)02288-0. [Google Scholar] [PubMed] [CrossRef]
3. Mukhsar, Wibawa GNA, Tenriawaru A, Usman I, Firihu MZ, Variani VI, et al. Stochastic Bayesian Runge-Kutta method for dengue dynamic mapping. MethodsX. 2022;10(4):101979. doi:10.1016/j.mex.2022.101979. [Google Scholar] [PubMed] [CrossRef]
4. Mukhsar, Saleh Ahmar A, El Safty MA, El-Khawaga H, El Sayed M. Bayesian convolution for stochastic epidemic model. Intell Autom Soft Comput. 2022;34(2):1175–86. doi:10.32604/iasc.2022.025214. [Google Scholar] [CrossRef]
5. Raza A, Arif MS, Rafiq M. A reliable numerical analysis for stochastic dengue epidemic model with incubation period of virus. Adv Differ Equ. 2019;2019(1):32. doi:10.1186/s13662-019-1958-y. [Google Scholar] [CrossRef]
6. Lawson AB. Bayesian disease mapping: hierarchical modeling in spatial epidemiology. Boca Raton, FL, USA: Chapman and Hall/CRC; 2008. [Google Scholar]
7. Robinson B, Bisaillon P, Edwards JD, Kendzerska T, Khalil M, Poirel D, et al. A Bayesian model calibration framework for stochastic compartmental models with both time-varying and time-invariant parameters. Infect Dis Model. 2024;9(4):1224–49. doi:10.1016/j.idm.2024.04.002. [Google Scholar] [PubMed] [CrossRef]
8. Bisaillon P, Robinson B, Khalil M, Pettit CL, Poirel D, Sarkar A. Robust Bayesian state and parameter estimation framework for stochastic dynamical systems with combined time-varying and time-invariant parameters. J Sound Vib. 2024;575(3):118106. doi:10.1016/j.jsv.2023.118106. [Google Scholar] [CrossRef]
9. Golightly A, Wadkin LE, Whitaker SA, Baggaley AW, Parker NG, Kypraios T. Accelerating Bayesian inference for stochastic epidemic models using incidence data. Stat Comput. 2023;33(6):134. doi:10.1007/s11222-023-10311-6. [Google Scholar] [CrossRef]
10. Richardson S, Thomson A, Best N, Elliott P. Interpreting posterior relative risk estimates in disease-mapping studies. Environ Health Perspect. 2004;112(9):1016–25. doi:10.1289/ehp.6740. [Google Scholar] [PubMed] [CrossRef]
11. Miao A, Zhang T, Zhang J, Wang C. Dynamics of a stochastic SIR model with both horizontal and vertical transmission. J Appl Anal Comput. 2018;8(4):1108–21. doi:10.11948/2018.1108. [Google Scholar] [CrossRef]
12. Golightly A, Wilkinson DJ. Bayesian parameter inference for stochastic biochemical network models using particle Markov chain Monte Carlo. Interface Focus. 2011;1(6):807–20. doi:10.1098/rsfs.2011.0047. [Google Scholar] [PubMed] [CrossRef]
13. Schmon SM, Gagnon P. Optimal scaling of random walk Metropolis algorithms using Bayesian large-sample asymptotics. Stat Comput. 2022;32(2):28. doi:10.1007/s11222-022-10080-8. [Google Scholar] [PubMed] [CrossRef]
14. Sanders JD, Talley JL, Frazier AE, Noden BH. Landscape and anthropogenic factors associated with adult Aedes aegypti and Aedes albopictus in small cities in the Southern Great Plains. Insects. 2020;11(10):699. doi:10.3390/insects11100699. [Google Scholar] [PubMed] [CrossRef]
15. Gao N, Song Y, Wang X, Liu J. Dynamics of a stochastic SIS epidemic model with nonlinear incidence rates. Adv Differ Equ. 2019;2019(1):41. doi:10.1186/s13662-019-1980-0. [Google Scholar] [CrossRef]
16. Martino S, Aas K, Lindqvist O, Neef LR, Rue H. Estimating stochastic volatility models using integrated nested Laplace approximations. Eur J Financ. 2011;17(7):487–503. doi:10.1080/1351847X.2010.495475. [Google Scholar] [CrossRef]
17. Martins TG, Simpson DP, Lindgren F, Rue H. Bayesian computing with INLA: new features. Comput Stat Data Anal. 2012;67(9):68–83. doi:10.1016/j.csda.2013.04.014. [Google Scholar] [CrossRef]
18. Sani A, Abapihi B, Mukhsar, Tosepu R, Usman I, Rahman GA. Bayesian temporal, spatial and spatio-temporal models of dengue in a small area with INLA. Int J Model Simul. 2023;43(6):939–51. doi:10.1080/02286203.2022.2139108. [Google Scholar] [CrossRef]
19. Ruiz-Cárdenas R, Krainski ET, Rue H. Direct fitting of dynamic models using integrated nested Laplace approximations—INLA. Comput Stat Data Anal. 2012;56(6):1808–28. doi:10.1016/j.csda.2011.10.024. [Google Scholar] [CrossRef]
20. Macías-Díaz JE, Raza A, Ahmed N, Rafiq M. Analysis of a nonstandard computer method to simulate a nonlinear stochastic epidemiological model of coronavirus-like diseases. Comput Meth Programs Biomed. 2021;204(2):106054. doi:10.1016/j.cmpb.2021.106054. [Google Scholar] [PubMed] [CrossRef]
21. Stockdale JE, Kypraios T, O’Neill PD. Pair-based likelihood approximations for stochastic epidemic models. Biostatistics. 2021;22(3):575–97. doi:10.1093/biostatistics/kxz053. [Google Scholar] [PubMed] [CrossRef]
22. Fintzi J, Wakefield J, Minin VN. A linear noise approximation for stochastic epidemic models fit to partially observed incidence counts. Biometrics. 2022;78(4):1530–41. doi:10.1111/biom.13538. [Google Scholar] [PubMed] [CrossRef]
23. Birrell PJ, Wernisch L, Tom BDM, Held L, Roberts GO, Pebody RG, et al. Efficient real-time monitoring of an emerging influenza pandemic: how feasible? Ann Appl Stat. 2020;12(1):74–93. doi:10.1214/19-AOAS1278. [Google Scholar] [PubMed] [CrossRef]
24. Swallow B, Birrell P, Blake J, Burgman M, Challenor P, Coffeng LE, et al. Challenges in estimation, uncertainty quantification and elicitation for pandemic modelling. Epidemics. 2022;38(4):100547. doi:10.1016/j.epidem.2022.100547. [Google Scholar] [PubMed] [CrossRef]
25. Wadkin LE, Branson J, Hoppit A, Parker NG, Golightly A, Baggaley AW. Inference for epidemic models with time-varying infection rates: tracking the dynamics of oak processionary moth in the UK. Ecol Evol. 2022;12(5):e8871. doi:10.1002/ece3.8871. [Google Scholar] [PubMed] [CrossRef]
26. Schrödle B, Held L. Spatio-temporal disease mapping using INLA. Environmetrics. 2011;22(6):725–34. doi:10.1002/env.1065. [Google Scholar] [CrossRef]
Cite This Article
 Copyright © 2025 The Author(s). Published by Tech Science Press.
This work is licensed under a Creative Commons Attribution 4.0 International License , which permits unrestricted use, distribution, and reproduction in any medium, provided the original work is properly cited.
 Downloads
 Citation Tools