
 Submit a Paper
 Propose a Special lssue
 Open Access
ARTICLE

Digital Radiography-Based Pneumoconiosis Diagnosis via Vision Transformer Networks
1 School of Software, North University of China, Taiyuan, 030051, China
2 Pharmacovigilance Research Center for Information Technology and Data Science, Cross-Strait Tsinghua Research Institute, Xiamen, 361009, China
* Corresponding Author: Qing Wang. Email:
# These authors contributed equally to this work
Journal on Artificial Intelligence 2025, 7, 39-53. https://doi.org/10.32604/jai.2025.063188
Received 08 January 2025; Accepted 17 March 2025; Issue published 23 April 2025
 View Full Text
 Download PDF
Abstract
Pneumoconiosis, a prevalent occupational lung disease characterized by fibrosis and impaired lung function, necessitates early and accurate diagnosis to prevent further progression and ensure timely clinical intervention. This study investigates the potential application of the Vision Transformer (ViT) deep learning model for automated pneumoconiosis classification using digital radiography (DR) images. We utilized digital X-ray images from 934 suspected pneumoconiosis patients. A U-Net model was applied for lung segmentation, followed by Canny edge detection to divide the lungs into six anatomical regions. The segmented images were augmented and used to train the ViT model. Model component evaluations were conducted to assess the impact of lung segmentation and data augmentation. The ViT model achieved an accuracy of 78.8% and a specificity of 89.2% in pneumoconiosis classification. Furthermore, the region-based classification method utilizing detailed lung segmentations substantially improved diagnostic precision and was closely aligned with established clinical evaluation standards in pneumoconiosis assessment. This study demonstrates the clinical effectiveness of the ViT model in pneumoconiosis classification and highlights the importance of detailed lung region segmentation for structured clinical assessment. The findings strongly suggest that deep learning approaches, especially region-specific methods, can significantly enhance diagnostic accuracy, providing clinicians with a systematic, reliable framework for medical image analysis.Keywords
Pneumoconiosis, also known as occupational pneumoconiosis, is a disease caused by long-term inhalation of industrial mineral dust during occupational activities, primarily characterized by diffuse fibrosis of the lung tissue [1]. According to the “2021 Statistical Bulletin on the Development of Health and Hygiene in China” released by the National Health Commission, in 2021, there were 15,407 newly reported occupational disease cases in China, among which 11,809 cases were occupational pneumoconiosis, accounting for approximately 76.6%. By the end of 2021, the cumulative number of reported occupational pneumoconiosis patients nationwide had reached 915,000, with about 450,000 currently surviving patients. Pneumoconiosis ranks first among occupational diseases in China. Due to low health check-up rates in relevant workplaces and the disease’s long latency and hidden nature, the actual number of patients may far exceed the reported number [2]. This disease can lead to severe conditions such as pneumonia, tuberculosis, and pulmonary heart failure, and currently, there is no cure. Treatment mainly relies on early detection, slowing disease progression, and preventing complications.
The clinical assessment of pneumoconiosis primarily depends on changes in lung X-ray images, and the complexity of this assessment often challenges doctors’ diagnostic capabilities. Since pneumoconiosis patients are mostly workers, digital radiography (DR) has become the preferred choice for many patients due to its low cost and wide accessibility. However, the complex details in DR images increase the difficulty of analysis and diagnosis for doctors, especially in the absence of auxiliary automation tools.
The International Labor Organization (ILO) has categorized pneumoconiosis into 0, 1, 2, and 3 stages [3]. The stage of the disease is indicated by the profusion of small and large opacities, which may be round or irregularly shaped, which presents the parenchymal abnormality. The ILO classifies the size (diameter) of small rounded opacities as p, q, or r, indicative of diameters: p ≤ 1.5 p ≤ 1.5, 1.5 ≤ q ≤ 3 1.5 ≤ q ≤ 3, 3 ≤ r ≤ 10 mm and 3 ≤ r ≤ 10 mm and defined by the presence on the six significant zones (upper, middle, lower) in both left and right lungs. On the other hand, the size (widths) of small irregular opacities is illustrated by the letters shown in standard radiograph areas, s ≤ 1.5 s ≤ 1.5, 1.5 ≤ t ≤ 31.5 ≤ t ≤ 3, 3 ≤ u ≤ 10 mm, 3 ≤ u ≤ 10 mm. Opacities with a dimension of more than 10 mm are defined as large opacities. They are divided into three major categories, defined as 0 ≤ A ≤ 50 mm, 0 ≤ A ≤ 50 mm, 50 ≤ B ≤ Area (RUZ), 50 ≤ B ≤ Area (RUZ), and 50 ≤ C ≥ Area (RUZ), 50 ≤ C ≥ Area (RUZ), where RUZ indicates the area of the right upper zone (RUZ).
Since 1986, China’s diagnostic standards for occupational pneumoconiosis imaging have adopted descriptive imaging terms proposed by the International Labour Organization, such as small opacities and large opacities, providing a unified, convenient, and standardized method for staging pneumoconiosis [4]. By evaluating the density of small opacities, the distribution of large opacities in the lungs, and the presence of pleural plaques, pneumoconiosis is classified into stages zero, one, two, and three. However, diagnosing stage zero and one pneumoconiosis is challenging, and discrepancies often exist between standard films and actual cases. The accuracy of manual film reading is influenced by the doctor’s skill level and viewing fatigue, leading to misdiagnosis or missed diagnosis. The lung imaging of stage 0 pneumoconiosis patients did not show typical pneumoconiosis lesions. Alternatively, there may be slight radiographic changes, but they do not meet the diagnostic criteria for stage 1 pneumoconiosis. In stage 1 patients, small opacities (nodules) are present in the lungs, but their distribution is limited, and lung function impairment is minimal. In stage 2 patients, the number of small opacities increases, and pulmonary fibrosis may occur. In stage 3 patients, extensive pulmonary fibrosis develops, leading to severe lung function impairment. Specifically, stage 3+ indicates that the area of a single large opacity or the total area of multiple large opacities exceeds the area of the right upper lung zone, and stage 3+ is specially marked by hospital doctors, playing an important role in diagnosis.
Artificial Intelligence (AI) made significant breakthroughs in the field of medical imaging. Machine learning, a key branch of AI, has been extensively used for radionics analysis to develop features and predictive models. Some deep learning algorithms have even “surpassed” the performance of medical professionals in various medical imaging tasks. For example, CheXNet [5], developed by the Stanford Machine Learning Group, detects pneumonia from chest X-rays. Several researchers have explored the application of AI in diagnosing pneumoconiosis, although the number of cases used in these studies was typically limited. For example, Okumura et al. [6,7] conducted a study in 2010 that used only 55 images to classify pneumoconiosis into stages 0 to 3. Most studies [8,9] classified pneumoconiosis cases into normal and pneumoconiosis categories because the data were usually unevenly distributed across the stages.
Computer-aided diagnosis (CAD) systems used for medical image analysis have become crucial tools in modern healthcare [10]. These systems were applied in various fields, including lung cancer screening, coronary artery diagnosis, pneumoconiosis detection, identifying abnormalities in mammograms, and evaluating spinal deformities. The adoption of deep learning has further transformed CAD systems, allowing for automatic learning of complex features from raw image data, thereby enhancing accuracy and the detection of subtle abnormalities.
In lesion detection, establishing reliable identification and detection models becomes crucial as the number of cases increases and there is insufficient support from physicians. Although the use of deep learning algorithms for pneumoconiosis diagnosis is not new, most studies still involve a limited number of cases. For instance, in a 2020 study by Wang et al. [8], 1881 DR images were used to compare the performance of two experienced radiologists, with AUCs (Area Under Curve) of 0.668 and 0.772, respectively, indicating that more experienced doctors performed better [9]. In 2021, Yang et al. [11] experimented on a four-class classification of pneumoconiosis, providing a confusion matrix. The classification performance for categories 1, 2, and 3 was not ideal, with an overall accuracy of only 70.1%.
The dataset used in this study was collected by the Occupational Disease Prevention Hospital of the Tongmei Group from 2020 to 2021, covering DR high-voltage imaging data of a total of 934 patients. All chest X-ray data were obtained from outpatients, inpatients, and occupational health screening populations. Among them, there were 256 cases of stage 0 pneumoconiosis, 545 cases of stage 1 pneumoconiosis, 86 cases of stage 2 pneumoconiosis, 28 cases of stage 3 pneumoconiosis, and 19 cases of stage 3+ pneumoconiosis, as shown in Table 1. As shown in Fig. 1, a DR image of a pneumoconiosis patient is presented.
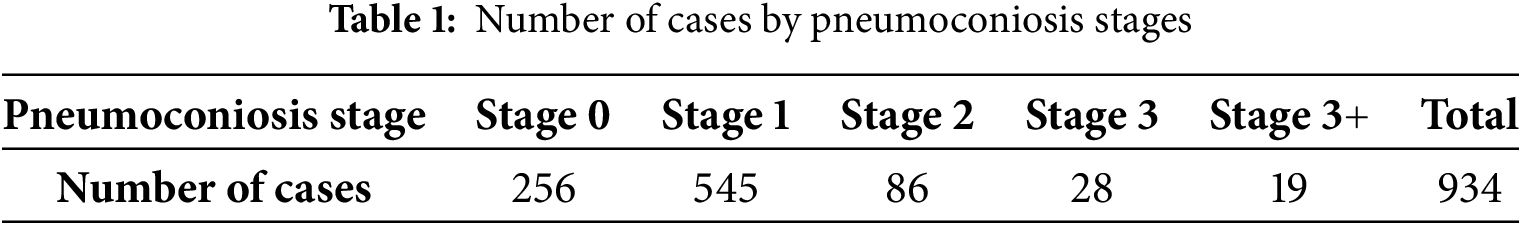
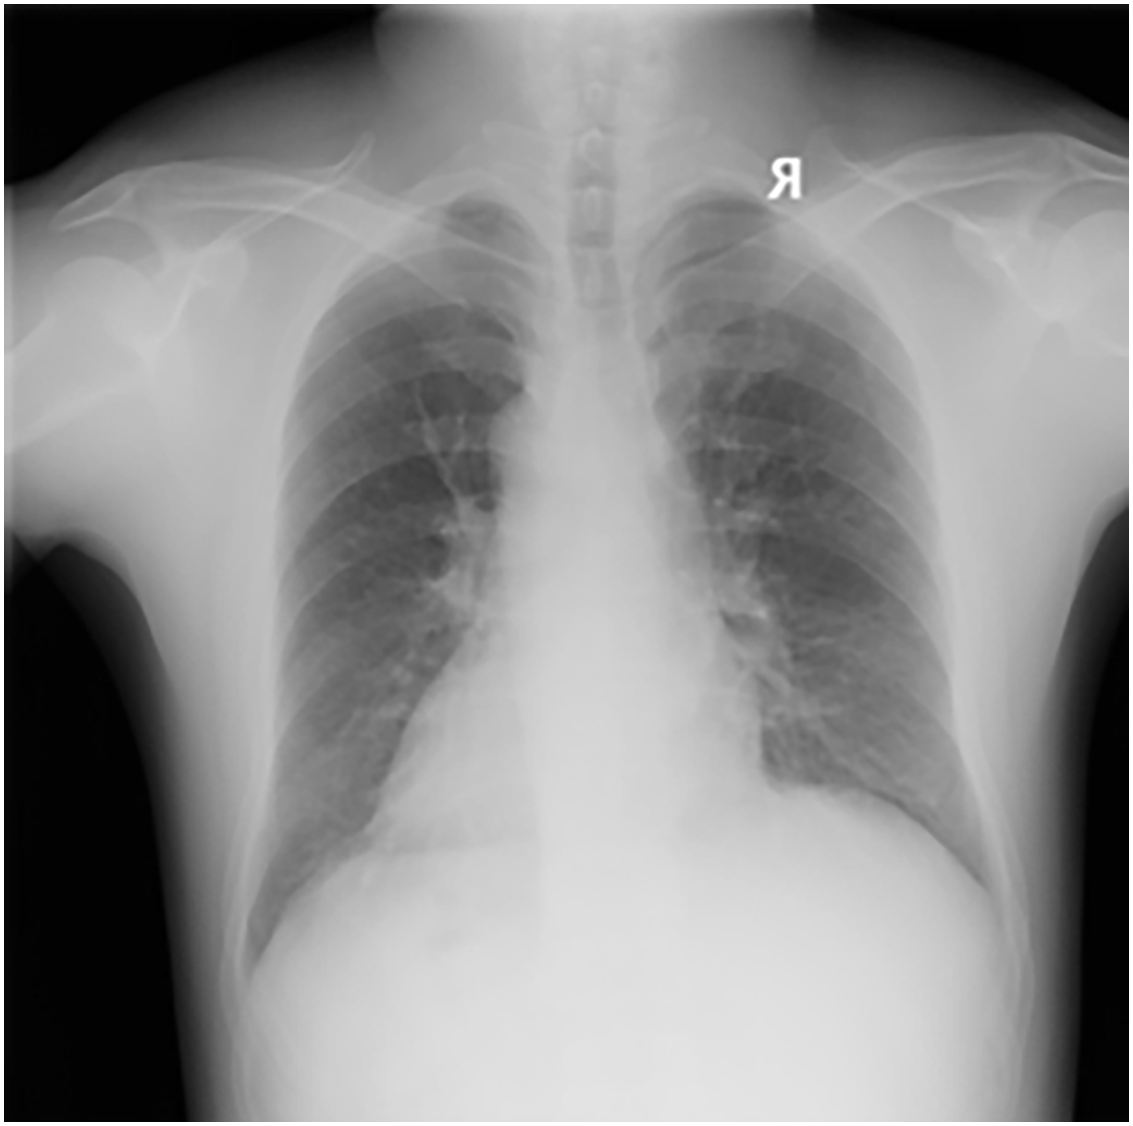
Figure 1: DR image of a pneumoconiosis patient
As shown in Fig. 2, the workflow for processing lung X-ray images and diagnosing pneumoconiosis stages is divided into three parts from left to right: data preprocessing, classification, and results.
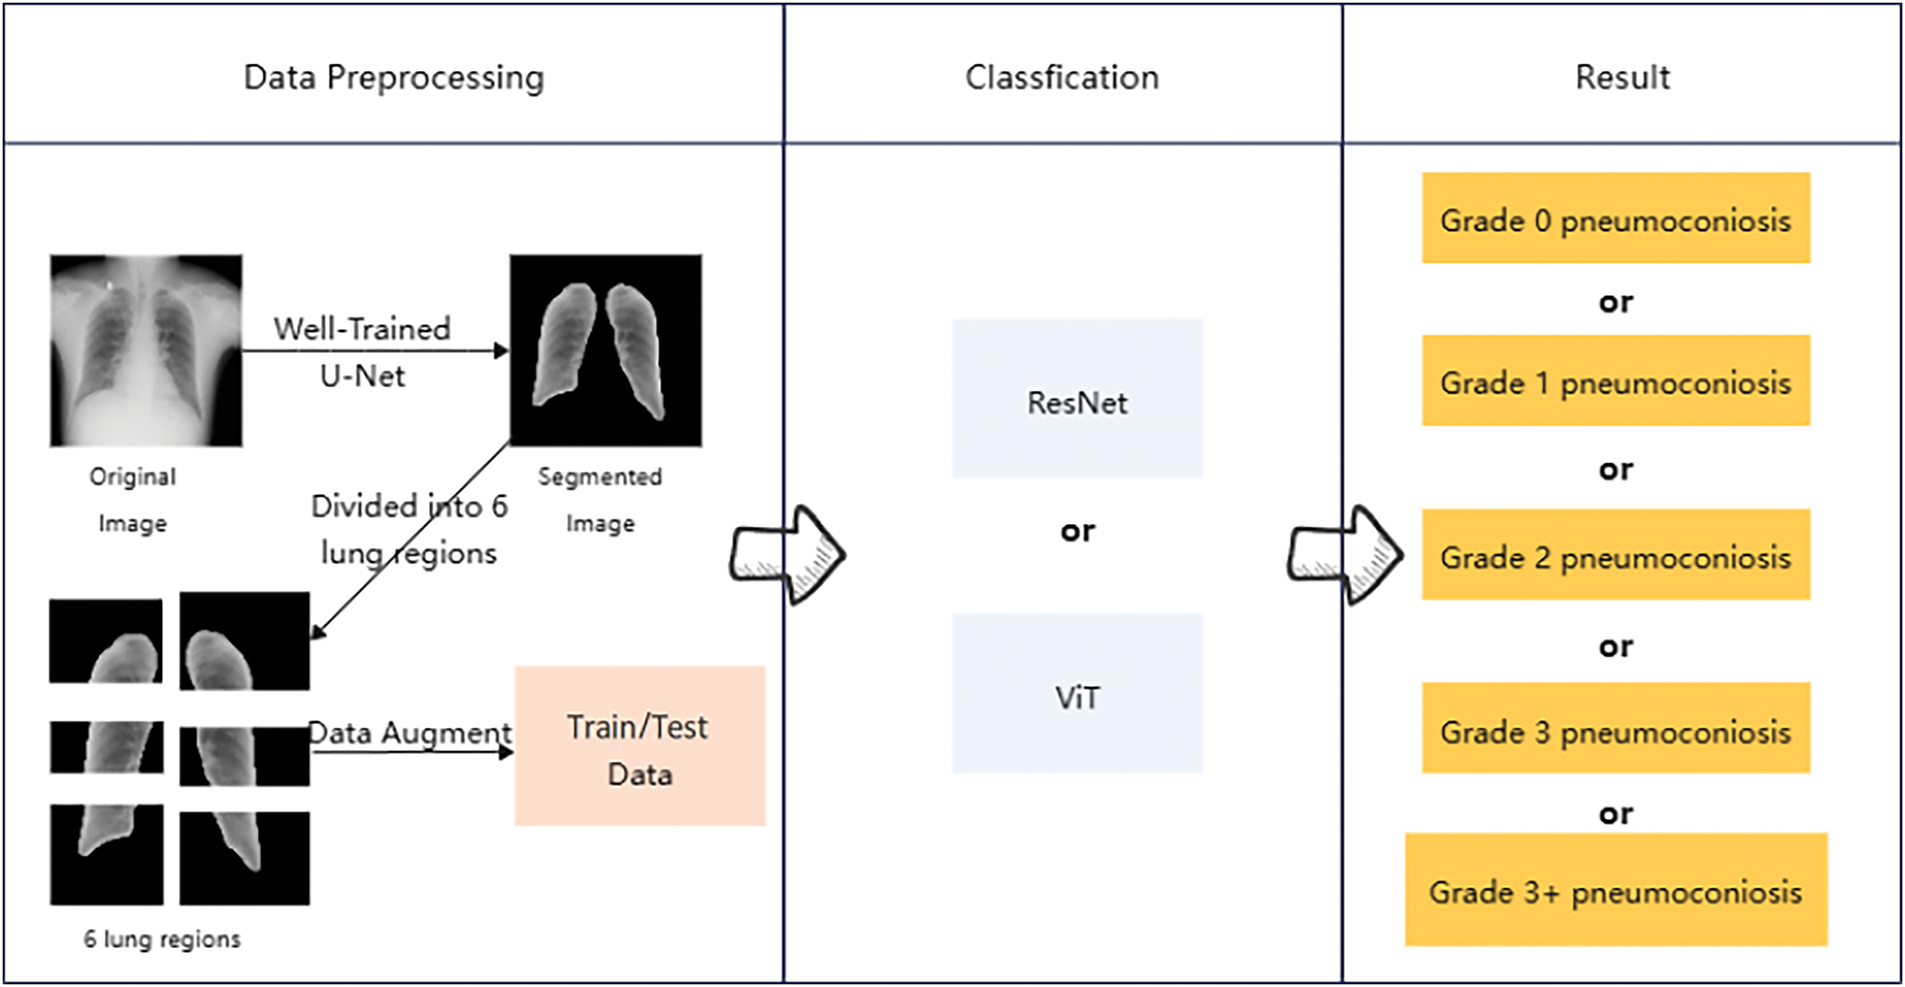
Figure 2: An overview of the method adopted in this work
First, the original lung images are segmented using a U-Net model to isolate the critical lung regions. Next, the segmented image regions undergo data augmentation to create training and test datasets. Then, these datasets are classified using ResNet and ViT models. Finally, based on the model outputs, pneumoconiosis is classified into different severity stages, ranging from stage 0 to stage 3+.
In this study, we used a U-Net model [12] for the automatic segmentation of lung DR images. The U-Net consists of a symmetric encoder and decoder with skip connections to preserve image details. The network takes a single-channel DR image of 512 × 512 pixels as input, extracting and compressing features through multiple layers of convolution and pooling operations, then progressively restoring image size and enhancing feature representation through up-sampling and skip connections. During the image preprocessing stage, we resized the images to 512 × 512 pixels and normalized them to [0, 1]. The model outputs a probability map of the same size as the input, which is converted to a binary mask through thresholding (0.5) to represent the predicted lung regions.
To further improve the accuracy of lung region identification, we implemented a post-processing step using OpenCV’s (Open Source Computer Vision Library) contour detection method to locate and fill the lung regions [13]. First, we identified all contours and then selected the two largest contours corresponding to the lungs, filling these areas with white to form the final lung mask.
The predicted masks obtained through the U-Net model were applied to the original DR images to extract lung regions, achieving an accuracy of 97%. Initially, the glob library was used to batch-read the original and predicted image files. Each predicted image was converted to grayscale and then binarized by thresholding, retaining only parts with grayscale values above 200, considering these as lung regions. Subsequently, the mask was resized to match the original image dimensions to ensure precise coverage. By applying this mask, the lung regions in the original images were extracted. As shown in Figs. 2 and 3, this is an example of the image after lung segmentation using U-Net.
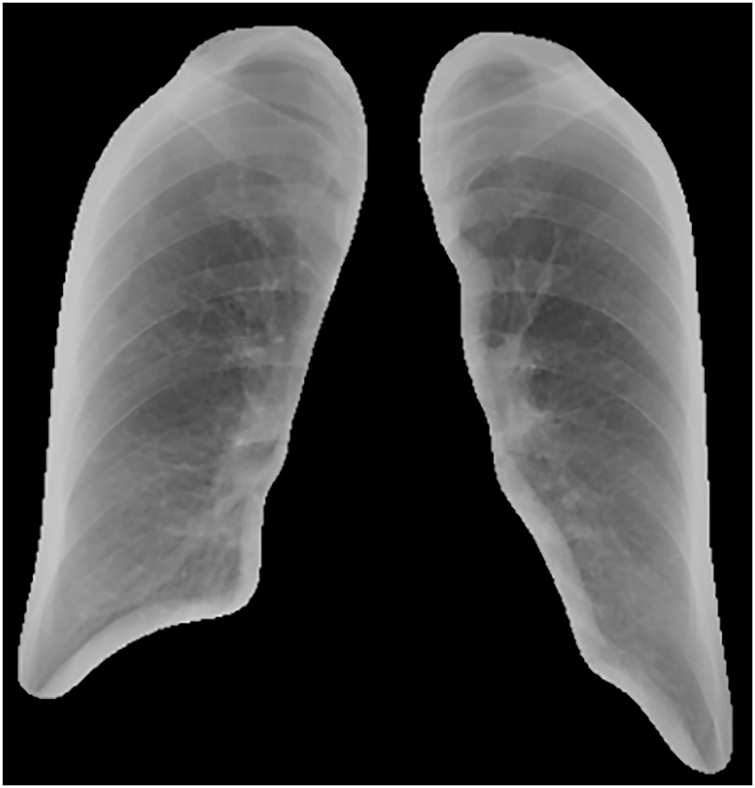
Figure 3: Lung segmentation image
In this study, we employed advanced image processing techniques to analyze lung DR images, aiming to refine the assessment of pathological changes in different lung regions. Since pneumoconiosis diagnosis relies on evaluating six lung zones, with the highest grade among these zones determining the overall severity, precise segmentation allows for a more detailed diagnosis and increases the available data for analysis. This type of segmentation is essential for studying the impact of pulmonary diseases on different lung regions, as certain conditions, such as tuberculosis or pneumonia, exhibit varying severity and characteristics across specific areas. Importantly, this approach mirrors clinical practice, where doctors evaluate the six lung zones individually to assess and annotate the severity of lesions. Similarly, pneumoconiosis grading is determined by the severity and features observed in each lung zone. Segmenting the lungs into defined regions not only reflects how doctors diagnose and grade the disease but also enhances model training by allowing it to focus on localized patterns. This enables the model to learn region-specific features more effectively. For pneumoconiosis, the distribution and density of opacities in different regions are key factors in determining the disease grade. This method ensures that subtle differences, such as denser opacities indicating advanced stages or sparse opacities in early stages are accurately captured. By closely aligned with clinical evaluation practices, this segmentation approach improves the model’s generalization, reliability, and accuracy in diagnosing and grading pneumoconiosis, ultimately supporting better patient care.
First, the cropped lung images were batch-loaded and converted to grayscale to simplify processing and enhance computational efficiency. Canny edge detection [14] was then applied to delineate lung boundaries, ensuring precise segmentation of different lung zones based on clinical guidelines. To further enhance boundary clarity, morphological dilation was performed using a 5 × 5 kernel to strengthen detected edges. Subsequently, connected component analysis (CCA) was used to identify and separate the left and right lungs. The two largest connected regions were assumed to correspond to the left and right lungs. By computing the centroid coordinates of these regions, a midline was established to ensure accurate separation of lung zones.
Using the identified midline, the image is divided into left and right parts. For detailed analysis, each part is further divided into three vertical regions: upper, middle, and lower.
After segmentation, the images of each region are saved in corresponding new folders, with a total of 5604 lung region pictures. These folders are named according to the distinction between left and right lungs and upper, middle, and lower lungs, such as “left1”, “right3”, etc., for the convenience of subsequent analysis and research. As shown in Figs. 3 and 4, the result of lung region segmentation into six regions is illustrated.
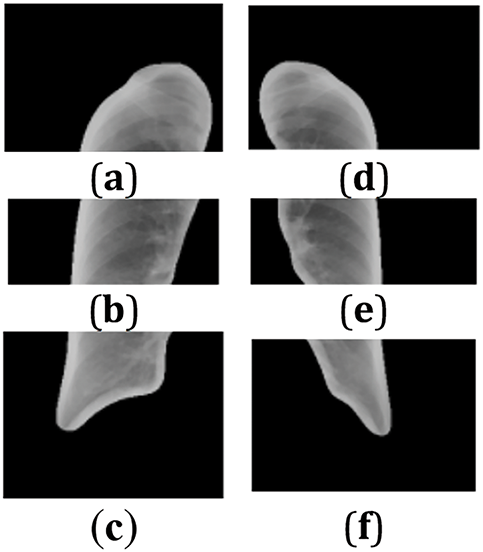
Figure 4: (a–f) Six lung regions
Due to the limited amount of data for categories 2, 3, and 3+, data augmentation was performed on these datasets. The augmentation techniques applied included adding salt-and-pepper noise, darkening the images, brightening the images, rotating the images, horizontal flipping, and stretching the images.
The original image is denoted as
Let
The contrast adjustment factor is
Rotating an image usually involves changing the position of pixels in the image, rotating them around a fixed point (usually the center of the image) by a certain angle. This operation is described by Eqs. (3) and (4). Let
where (
Image flipping is a process where each pixel in the image is mirrored along the vertical axis (i.e., the center vertical line of the image). This transformation is mathematically described by Eqs. (5) and (6). Horizontally flipping an image can be expressed as mapping each pixel position
This study utilizes the Vision Transformer (ViT) model [16] to address the multi-stage classification task for pneumoconiosis. ViT is a novel deep learning model based on the Transformer architecture, which replaces traditional convolutional operations with a patch-based self-attention mechanism, enabling global feature extraction from input images. The overall pipeline of the model includes input preprocessing, patch embedding, stacked Transformer layers for feature extraction, and a classification head for disease staging. ViT, as the first model to successfully apply the self-attention mechanism to image processing, has demonstrated superior performance compared to traditional convolutional neural networks on several benchmark datasets. Fig. 5 is the structure diagram of the vit model.
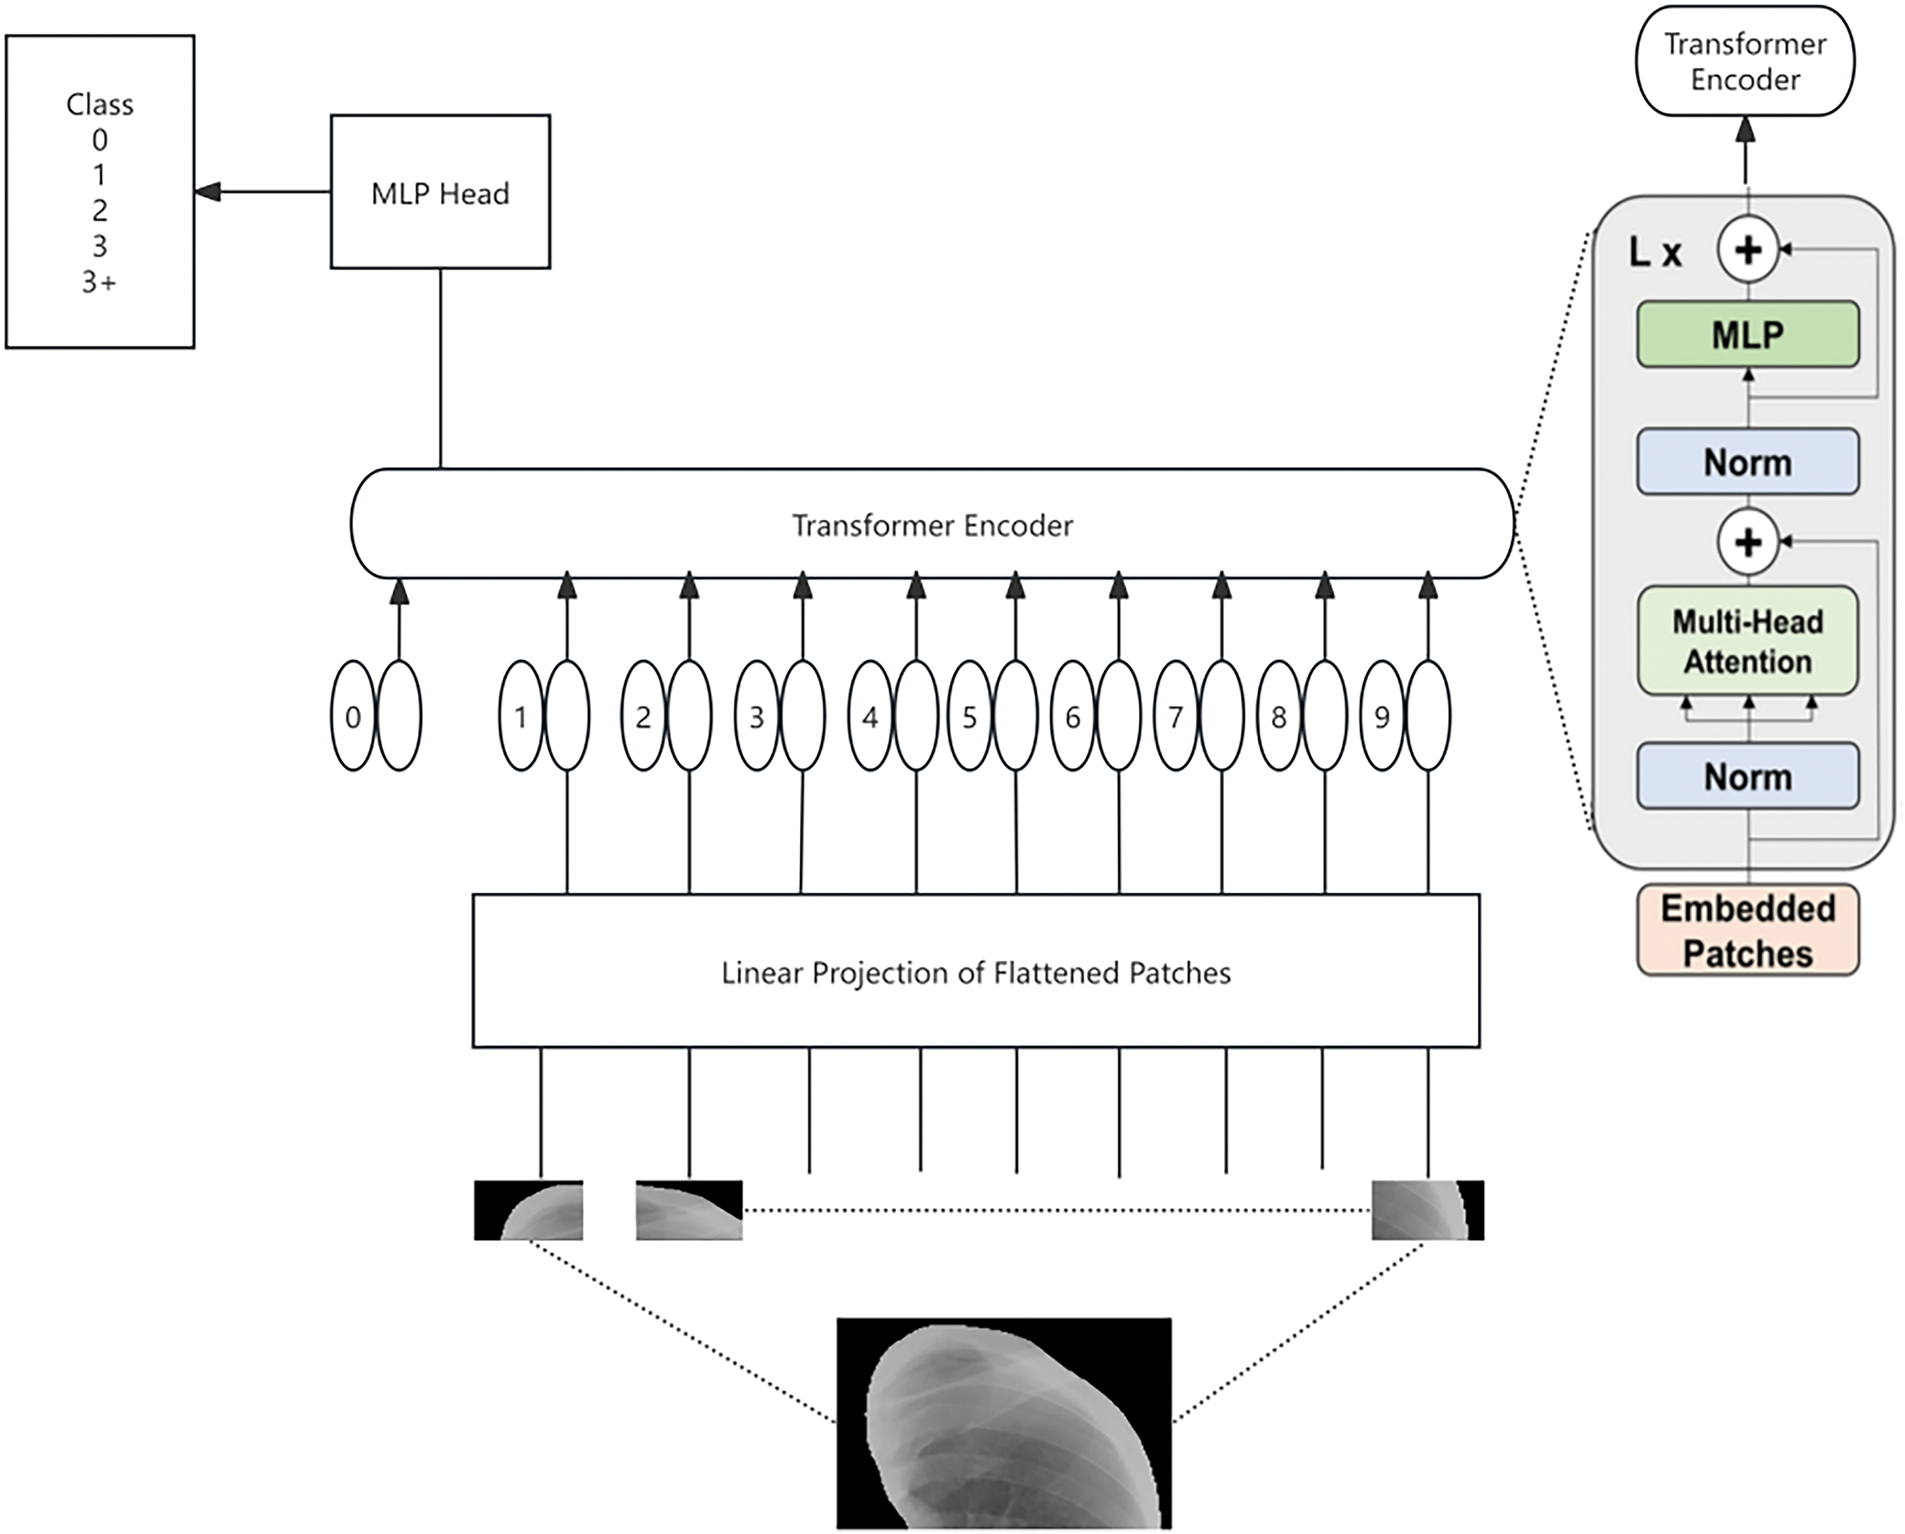
Figure 5: The structure diagram of the ViT model
To meet the input requirements of the ViT model, a standardized preprocessing workflow was applied to the image data. The input to the Vision Transformer model is a segmented lung image, which is resized to 256 × 256 pixels. Each input image is then divided into non-overlapping patches of size 16 × 16, resulting in a total of 256 patches per image. Each patch is flattened into a one-dimensional vector and projected into a 768-dimensional embedding space, transforming the patch into a fixed-dimensional representation suitable for subsequent processing by the Transformer module. Additionally, the images undergo center cropping to 224 × 224 pixels to ensure that the key lung regions are preserved. Each cropped image is then converted into a tensor and normalized to align its mean and standard deviation with those of the ImageNet dataset (mean: 0.485, 0.456, 0.406; standard deviation: 0.229, 0.224, 0.225). This preprocessing ensures compatibility with the ViT model’s requirements and optimizes the input data for effective feature extraction.
The ViT model processes the preprocessed input sequence, consisting of 256 patch embeddings and an additional classification token ([CLS]). Learnable positional encodings are added to each patch embedding to retain the spatial relationships between patches. The [CLS] token serves as a global feature aggregator and is utilized for downstream classification tasks. This input sequence is then fed into the stacked Transformer layers.
The core of the Vision Transformer consists of a series of stacked Transformer layers, each comprising a multi-head self-attention (MHSA) mechanism and a multi-layer perceptron (MLP) block. The MHSA computes the relationships between patches by projecting the input embeddings into Query, Key, and Value representations, enabling the model to capture both local and global patterns in the image. The MLP block further refines the features extracted from each patch using fully connected layers with nonlinear activation functions. Residual connections and layer normalization are incorporated to stabilize training and improve gradient propagation, ensuring the effective learning of complex features from the input data.
After processing through the Transformer layers, the updated classification token ([CLS]), which encapsulates the global features of the input image, is passed through a fully connected layer to predict the pneumoconiosis stage. The classification head maps the 768-dimensional [CLS] embedding to a probability distribution over the four pneumoconiosis stages (0, 1, 2, and 3+) using a Softmax function. The output of the model is a tensor that represents the likelihood of the input image belonging to each pneumoconiosis stage, facilitating reliable and interpretable predictions for clinical decision-making.
In this study, we employed the deep residual network (ResNet) model [17], specifically the ResNet50 version, to investigate its performance in image classification tasks. ResNet50 is a widely used deep learning model known for its introduction of the residual learning mechanism, which effectively addresses the degradation problem encountered when training deeper networks.
To meet the input requirements of the ResNet50 model, we performed a series of preprocessing operations on the image data. These operations included: Randomly cropping the images to 224 × 224 pixels. Applying random horizontal flipping to increase data diversity. Normalizing each image by subtracting the mean values of the ImageNet dataset (0.485, 0.456, 0.406) and dividing by the standard deviation values (0.229, 0.224, 0.225).
These preprocessing steps ensure that the images are appropriately scaled and normalized for optimal performance with the ResNet50 model.
In this study, to comprehensively evaluate the effectiveness of the ResNet and ViT models in the automatic diagnosis of pneumoconiosis, we employed two main statistical metrics: accuracy and specificity.
Accuracy: This metric measures the overall ability of the model to correctly diagnose both pneumoconiosis patients and healthy individuals. It encompasses the correct identification of patients (true positives) and the correct identification of healthy individuals (true negatives).
Specificity: This metric specifically assesses the model’s performance in accurately identifying individuals who do not have the disease (i.e., healthy individuals). High specificity indicates that the model excels in reducing false positives (misdiagnosing healthy individuals as diseased).
By using these evaluation metrics, we can gain a detailed understanding of the model’s effectiveness in distinguishing between healthy individuals and pneumoconiosis patients. This, in turn, validates the practicality and reliability of deep learning models in medical image diagnosis applications.
After splitting the dataset into training and test sets in an 8:2 ratio, the models were trained for 100 epochs. The models demonstrated a gradual improvement in accuracy on the test set, indicating effective learning from the training data. Ultimately, the models achieved higher accuracy and specificity compared to their initial states, validating the effectiveness of the residual learning structure.
As shown in Fig. 6, the ResNet model achieved an accuracy of 78.6% and a specificity of 89.5% on the test set.
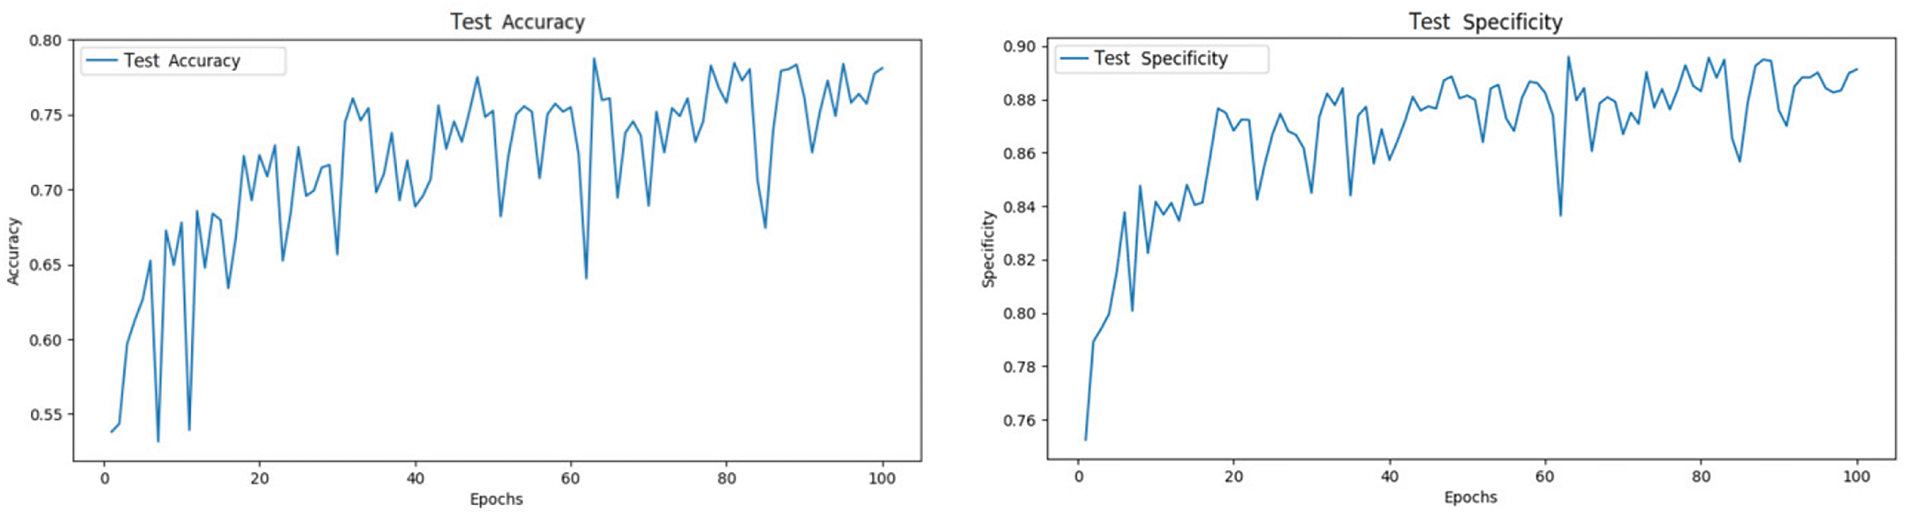
Figure 6: ResNet test set accuracy and specificity
After splitting the dataset into training and test sets in an 8:2 ratio, the models were trained for 100 epochs. The ViT model demonstrated significant performance improvements, with test accuracy gradually increasing and loss progressively decreasing. These results validate the effectiveness of the Transformer architecture in image classification tasks and highlight its potential advantages over traditional methods in handling large-scale image data.
As shown in Fig. 7, The ViT model achieved an accuracy of 78.8% and a specificity of 89.2% on the test set.
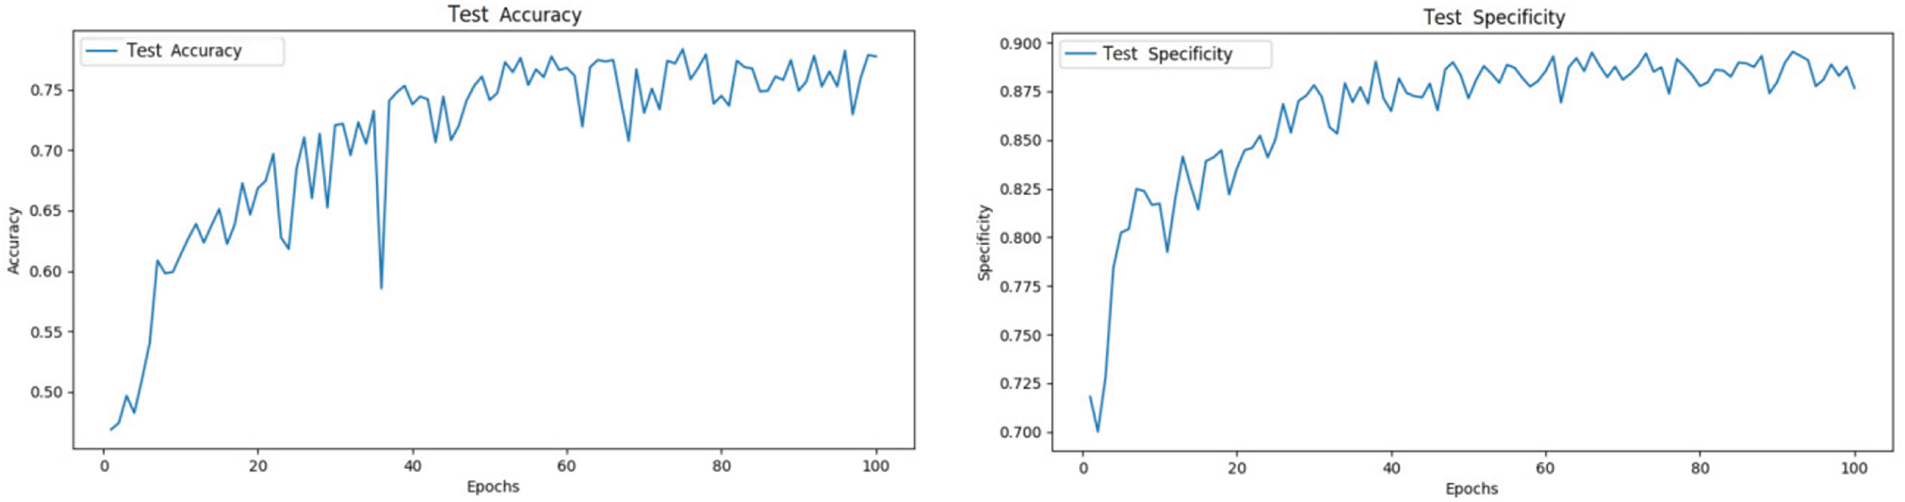
Figure 7: ViT test set accuracy and specificity
From the loss curves, as shown in Fig. 8, it can be observed that while ViT and ResNet exhibit comparable overall performance, ViT demonstrates significant advantages in terms of generalization and stability. Although ResNet’s training loss decreases more rapidly and achieves a lower final value, indicating stronger fitting ability on the training set, its test loss shows considerable fluctuations in the later stages, suggesting potential overfitting. In contrast, ViT’s training loss decreases more gradually but remains stable, with its test loss closely aligned with the training loss, reflecting superior generalization performance and robustness. This stability can be attributed to ViT’s multi-head self-attention mechanism, which effectively models global features, making it particularly advantageous in scenarios with complex data distributions or diverse characteristics. Therefore, while ResNet excels in training efficiency, ViT’s enhanced stability and generalization capabilities make it more reliable for practical applications, especially in tasks requiring robust handling of complex data distributions.
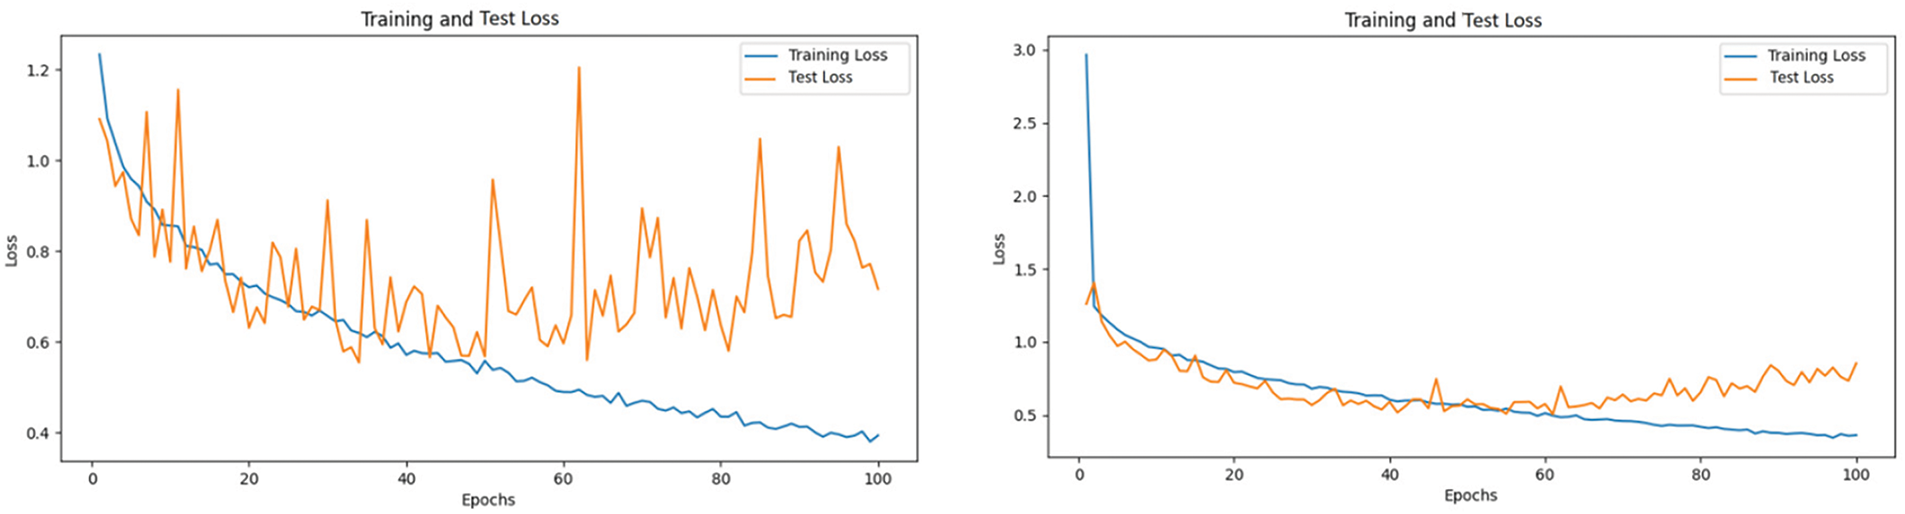
Figure 8: Training and test loss curves for resnet
As shown in Fig. 9, the confusion matrix illustrates the classification results of the ResNet and ViT models across the five categories. Notably, there is significant confusion between categories 0 and 1. Many instances labeled as category 0 were misclassified as category 1, and vice versa, indicating that the models struggled to distinguish between these two categories. This confusion could be due to the similarity in features between these categories, suggesting that the models need to learn and optimize the distinguishing features between these two classes more deeply.
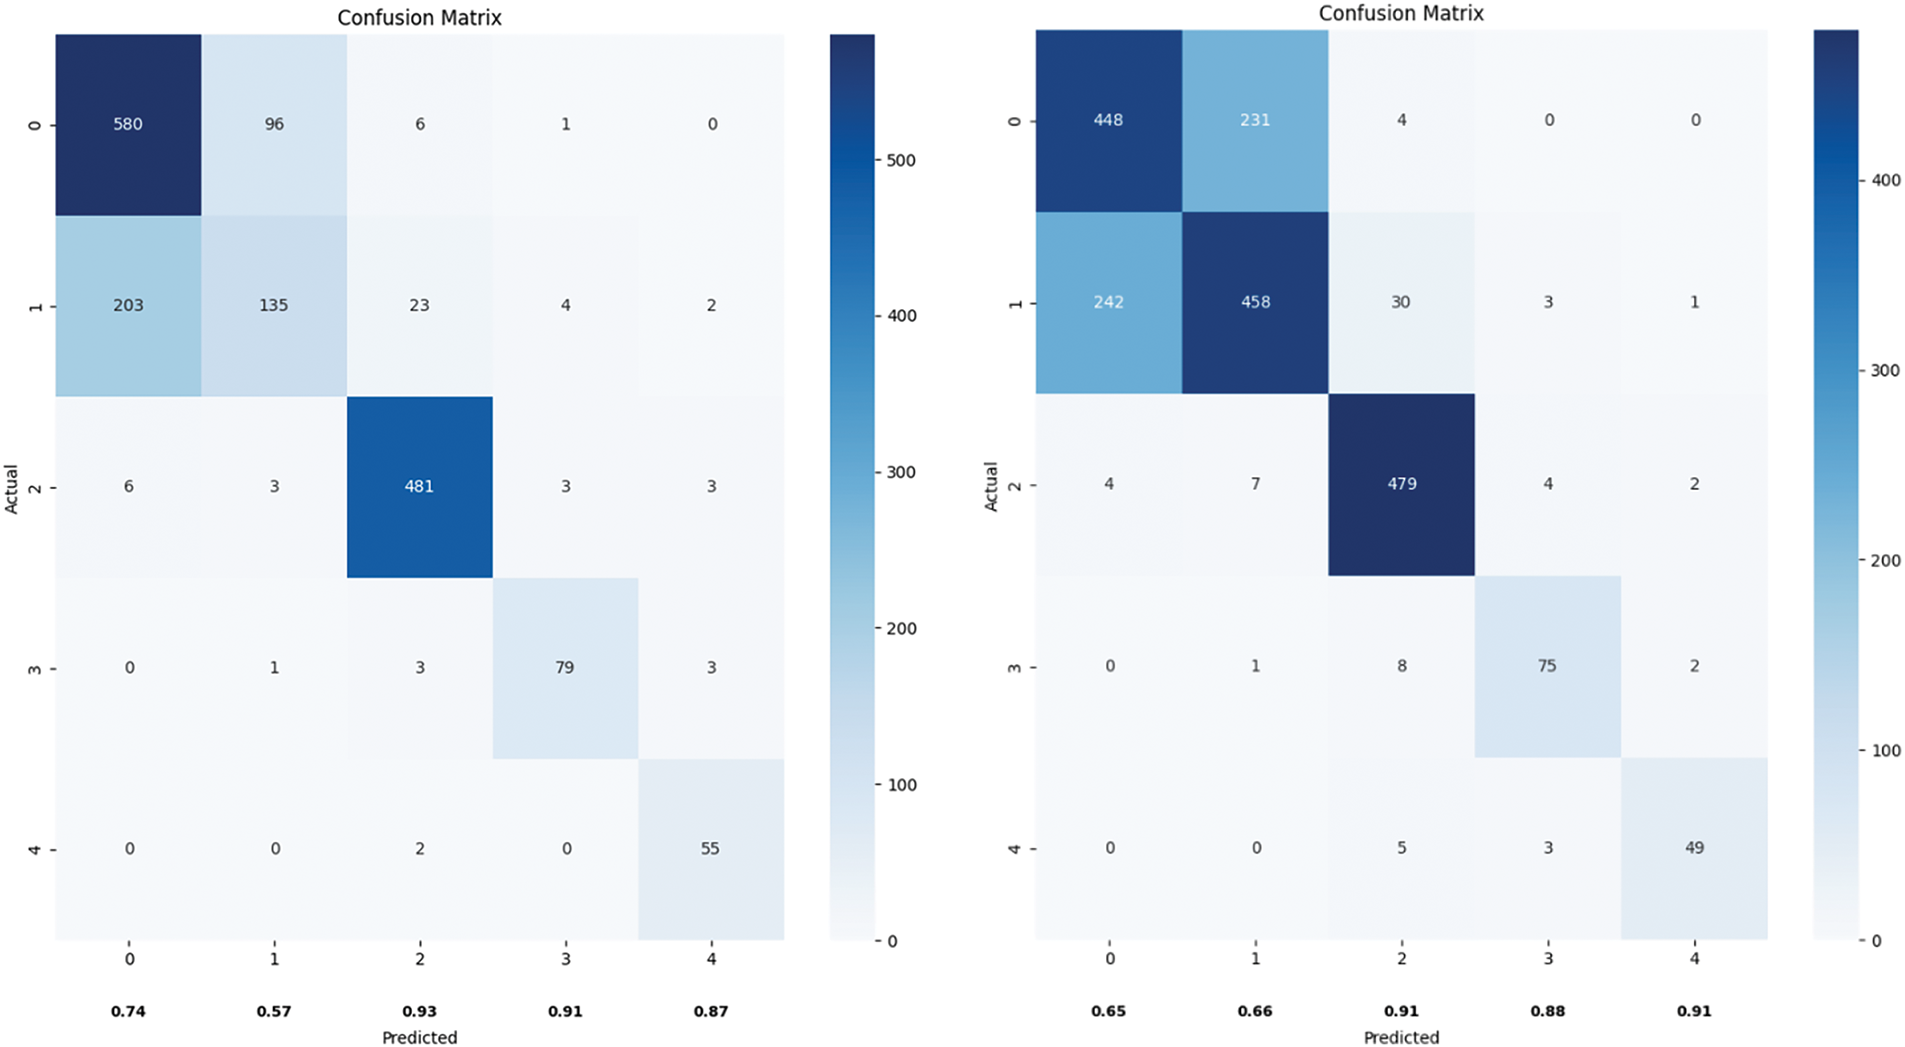
Figure 9: Confusion matrix plot of ResNet vs. ViT
Additionally, there were several misclassifications between categories 1 and 2, indicating that the models also need to improve feature extraction and classification decisions for these categories to enhance overall classification accuracy.
4.6 Model Component Evaluation
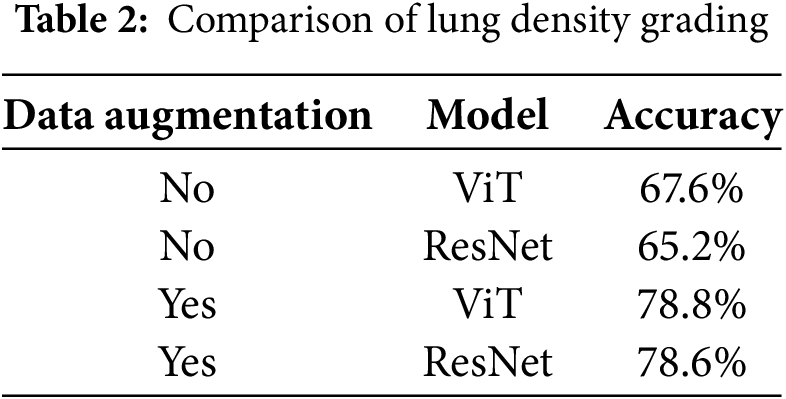
According to the experimental data, the performance of ViT and ResNet in the lung density prediction task is significantly influenced by data augmentation, as shown in Table 2. In medical image analysis, the Vision Transformer (ViT) demonstrates greater robustness in feature learning and adaptability to data augmentation strategies compared to the traditional convolutional neural network (ResNet) in lung density classification. The experimental results indicate that without data augmentation, the ViT model achieves an overall accuracy of 67.6%, outperforming ResNet (65.2%). The performance of ResNet is constrained by the induction bias of local convolutional kernels, leading to weaker generalization to complex texture features. After incorporating data augmentation, ViT’s accuracy significantly improves to 78.8%, slightly surpassing ResNet’s performance (78.6%).
The comparative experiment on pneumoconiosis grading, as presented in Table 3, further illustrates the dependency of ViT and ResNet models on the optimized combination of preprocessing strategies. The experimental results reveal that when lung segmentation is not applied and only regional segmentation with data augmentation is used, ViT and ResNet achieve accuracies of 50.8% and 55.6%, respectively. This suggests that while data augmentation alone can mitigate overfitting, its impact on enhancing the model’s ability to distinguish complex medical features remains limited. Introducing lung segmentation markedly increases ViT’s accuracy by 9.9 percentage points to 60.7%, surpassing ResNet, which improves by only 2.5 percentage points to 58.1%. This highlights the effectiveness of ViT’s global attention mechanism in suppressing background noise by accurately localizing the anatomical region of the lungs, whereas ResNet’s local convolutional features are less efficient in focusing on the target region under these conditions.
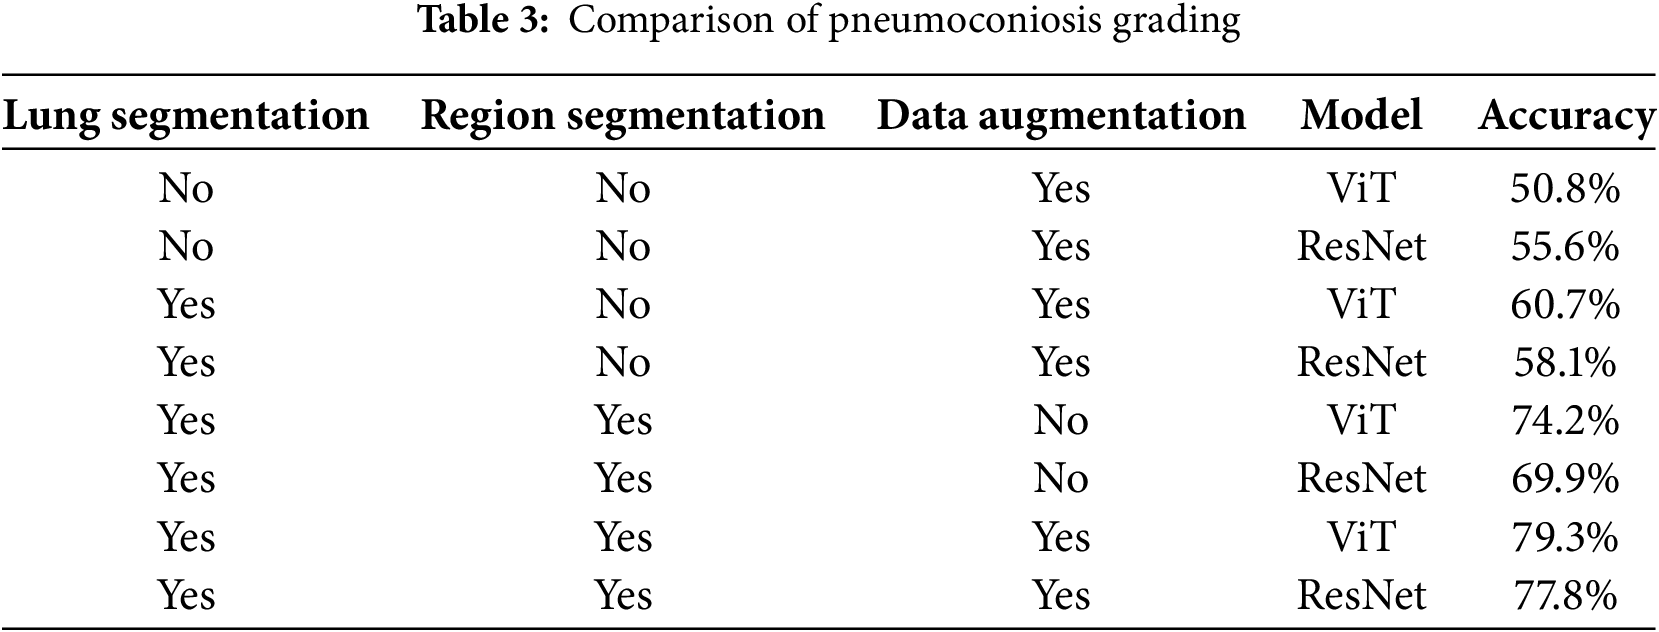
Without data augmentation, ViT’s accuracy further increases by 13.4 percentage points to 74.2%, exceeding ResNet by 11.8 percentage points (69.9%), thereby widening the performance gap. ViT’s self-attention mechanism dynamically captures pathological features across different lung regions, whereas ResNet, constrained by its hierarchical convolutional structure with a fixed receptive field, struggles to analyze long-range spatial correlations effectively. When the full preprocessing strategy including lung segmentation, regional segmentation, and data augmentation is applied, ViT achieves its highest accuracy of 79.3%, outperforming ResNet (77.8%) by 1.5 percentage points.
These results demonstrate that ViT exhibits superior robustness and classification accuracy in pneumoconiosis image analysis due to the deep integration of its global attention mechanism with anatomical priors. This makes ViT a more effective architectural choice for intelligent medical image diagnosis. Furthermore, a hierarchical preprocessing strategy, progressing from segmentation to data augmentation, is crucial for unlocking the full potential of these models.
In this study, we investigated the effectiveness of pneumoconiosis image diagnosis by leveraging the Vision Transformer (ViT) model alongside multiple image preprocessing techniques, including data augmentation and lung segmentation. The findings of this study demonstrate that these approaches collectively contribute to improving diagnostic accuracy while also providing insights into the automated assessment of pneumoconiosis using deep learning.
The experimental results underscore the effectiveness of deep learning in pneumoconiosis X-ray analysis. Specifically, by implementing lung segmentation and refining image regions, the models were able to more accurately identify pathological features. This observation aligns with existing literature, which suggests that precise regional localization significantly enhances the diagnostic performance of medical imaging models. Furthermore, our study evaluated the role of data augmentation, highlighting both its advantages and limitations. While augmentation improved model robustness and diversity, it was not a substitute for a larger, more comprehensive dataset. This finding suggests the need for further research into more sophisticated augmentation strategies tailored to medical imaging.
Additionally, our results demonstrate that the Vision Transformer (ViT) model effectively captures and differentiates radiographic features associated with pneumoconiosis diagnosis. Unlike conventional convolutional neural networks (CNNs), which primarily extract local features, ViT utilizes a patch-based self-attention mechanism that enables the analysis of both localized and global patterns across lung regions. This architectural advantage allows the model to detect subtle variations in opacity density, fibrosis formations, and abnormal textures, all of which are key indicators of pneumoconiosis severity. ViT leverages positional encodings to establish spatial relationships between lung zones. This mechanism enhances diagnostic accuracy. These results suggest that ViT offers advantages over conventional CNN-based methods in identifying pneumoconiosis-related features.
Despite the strengths of this study, several limitations should be acknowledged. First, the number of comparative models in this study was relatively limited. While the primary focus was on the ViT model, a more extensive evaluation incorporating additional deep-learning architectures could provide a more comprehensive benchmark for pneumoconiosis classification.
Second, this study employed a diagnostic approach based on lung zone segmentation, in which the overall pneumoconiosis severity was determined by aggregating the classification results of individual lung zones. This methodology aligns with standard clinical practice, where physicians assess pneumoconiosis severity by evaluating each lung zone independently before making an overall diagnosis. While this approach significantly reduces the time required for physicians to analyze and interpret X-ray images, it does not entirely replace the need for expert judgment. Physicians still need to review the classified lung zones and apply their clinical expertise to confirm the diagnosis, particularly in complex cases where additional contextual information from the X-ray may be necessary. Nevertheless, by providing structured and consistent zone-level classifications, this method greatly enhances diagnostic efficiency and supports a more streamlined decision-making process.
This study contributes to the advancement of pneumoconiosis image diagnosis by demonstrating the feasibility of ViT-based models in automated disease classification. Addressing the discussed limitations will be essential for improving model reliability and applicability in real-world medical scenarios.
In this study, we evaluated the effectiveness of Vision Transformer (ViT) models in pneumoconiosis image diagnosis, leveraging multiple preprocessing techniques, including data augmentation and lung segmentation. The results demonstrate that these approaches significantly enhance diagnostic accuracy and offer valuable insights into automated pneumoconiosis assessment using deep learning.
Our findings underscore the potential of deep learning in pneumoconiosis X-ray analysis. Specifically, the combination of lung segmentation and targeted region refinement enabled the models to more precisely identify pathological features. This observation aligns with existing literature, which highlights the importance of regional localization in improving diagnostic performance for medical imaging. Additionally, data augmentation was found to enhance model robustness and diversity. However, it is not a substitute for a larger, more comprehensive dataset. This suggests the need for more advanced augmentation strategies tailored to medical imaging to further improve model performance.
The ViT model proved effective in capturing and differentiating key radiographic features of pneumoconiosis. Unlike conventional convolutional neural networks (CNNs), which primarily focus on local features, ViT employs a patch-based self-attention mechanism that allows the model to analyze both localized and global patterns across lung regions. This capability enables ViT to detect subtle variations in opacity, fibrosis, and abnormal textures—critical indicators of pneumoconiosis severity. ViT’s use of positional encodings further strengthens its ability to establish spatial relationships between lung zones, enhancing diagnostic accuracy. These findings suggest that ViT has distinct advantages over traditional CNN-based methods in identifying pneumoconiosis-related features.
However, several limitations of this study should be noted. First, the range of comparative models was limited. While ViT was the primary focus, a broader evaluation incorporating additional deep-learning architectures would provide a more comprehensive benchmark for pneumoconiosis classification.
Second, the study relied on lung zone segmentation, where pneumoconiosis severity was determined by aggregating the classification results of individual lung zones. While this approach mirrors clinical practice, where physicians assess each lung zone independently before making an overall diagnosis, it does not fully replace expert judgment. Physicians still need to review the segmented regions and apply their clinical expertise to confirm diagnoses, particularly in complex cases. Nevertheless, by offering structured and consistent zone-level classifications, this methodology enhances diagnostic efficiency and supports a more streamlined decision-making process.
Acknowledgement: We would like to extend our sincere thanks to the Shanxi Center for Disease Control and Prevention for their valuable support and contributions to this study.
Funding Statement: This study was supported by the Key R&D Program of Shanxi Province (202102020101009).
Author Contributions: Qingpeng Wei: Conceptualization, Methodology, Supervision, Writing—Review & Editing. Wenai Song: Data Curation, Software, Formal Analysis, Writing—Original Draft. Lizhen Fu: test, Investigation, Data Analysis. Yi Lei: Project Administration, Resources, Visualization. Qing Wang: Writing—Review & Editing, Funding Acquisition. All authors reviewed the results and approved the final version of the manuscript.
Availability of Data and Materials: The raw images used and analyzed during the current study are available from the corresponding author upon reasonable request. The data are not publicly available due to information that could compromise the privacy of research.
Ethics Approval: The dataset used in this study was collected by the Occupational Disease Prevention Hospital of the Tongmei Group from 2020 to 2021, and informed consent was obtained from the hospital.
Conflicts of Interest: The authors declare no conflicts of interest to report regarding the present study.
References
1. National Health and Family Planning Commission of China. Diagnosis of occupational pneumoconiosis. [cited 2024 Jul 24]. Available from: http://www.nhfpc.gov.cn. [Google Scholar]
2. Thoracic Imaging and Occupational Diseases Standards Group. Medical Artificial Intelligence branch, chinese biomedical engineering society. Chinese expert consensus on pneumoconiosis data labeling specifications and quality control. J Environ Occup Med. 2020;37(6):523–9. [Google Scholar]
3. Devnath L, Summons P, Luo S, Wang D, Shaukat K, Hameed IA, et al. Computer-aided diagnosis of coal workers’ pneumoconiosis in chest X-ray radiographs using machine learning: a systematic literature review. Int J Environ Res Public Health. 2022;19:6439. [Google Scholar] [PubMed]
4. GB5906-1986. X-ray diagnostic criteria and treatment principles for pneumoconiosis. Beijing, China: General Administration of Quality Supervision, Inspection and Quarantine of the People’s Republic of China; 1986. [Google Scholar]
5. Arzhaeva Y, Wang D, Devnath L, Amirgholipour SK, McBean R, Hillhouse J, et al. Development of automated diagnostic tools for pneumoconiosis detection from chest X-ray radiographs. Canberra, Australia: CSIRO; 2019. Report No.: EP192938. [Google Scholar]
6. Okumura E, Kawashita I, Ishida T. Computerized analysis of pneumoconiosis in digital chest radiography: effect of artificial neural network trained with power spectra. J Digit Imaging. 2011;24(6):1126–32. [Google Scholar] [PubMed]
7. Okumura E, Kawashita I, Ishida T. Computerized classification of pneumoconiosis on digital chest radiography artificial neural network with three stages. J Digit Imaging. 2017;30(4):413–26. [Google Scholar] [PubMed]
8. Wang X, Yu J, Zhu Q, Li S, Zhao Z, Yang B, et al. Potential of deep learning in assessing pneumoconiosis depicted on digital chest radiography. Occup Environ Med. 2020;77(9):597–602. [Google Scholar]
9. Zheng R, Deng K, Jin H, Liu H, Zhang L. An improved CNN-based pneumoconiosis diagnosis method on an X-ray chest film. In: International Conference on Human-Centered Computing: 2019; 2019 Aug 5–7; Čačak, Serbia. Berlin/Heidelberg, Germany: Springer; 2019. p. 647–58. [Google Scholar]
10. Cao QW. Research on medical image segmentation model based on deep learning [dissertation]. Taiyuan, China: Taiyuan University of Technology; 2019. [Google Scholar]
11. Yang F, Tang ZR, Chen J, Tang M, Wang S, Qi W, et al. Pneumoconiosis computer-aided diagnosis system based on X-rays and deep learning. BMC Med Imaging. 2021;21:189. doi:10.1186/s12880-021-00723-z. [Google Scholar] [PubMed] [CrossRef]
12. Ronneberger O, Fischer P, Brox T. U-net: convolutional networks for biomedical image segmentation. In: Medical Image Computing and Computer-Assisted Intervention–MICCAI 2015: 18th International Conference; 2015 Oct 5–9; Munich, Germany. Berlin/Heidelberg, Germany: Springer International Publishing; 2015; p. 770–8. [Google Scholar]
13. Azam S, Montaha S, Rafid AR, Karim A, Jonkman M, De Boer F, et al. Pixel-level image analysis to derive the broncho-artery (BA) ratio employing HRCT scans: a computer-aided approach. Intell Syst Appl. 2023;20:200279. [Google Scholar]
14. Canny J. A computational approach to edge detection. IEEE Trans Pattern Anal Mach Intell. 1986;PAMI-8(6):679–98. [Google Scholar]
15. Chan RH, Ho CW, Nikolova M. Salt-and-pepper noise removal by median-type noise detectors and detail-preserving regularization. IEEE Trans Image Process. 2005;14(10):1479–85. [Google Scholar] [PubMed]
16. Dosovitskiy A, Beyer L, Kolesnikov A, Weissenborn D, Zhai X, Unterthiner T, et al. An image is worth 16 × 16 words: transformers for image recognition at scale. In: Proceedings of the International Conference on Learning Representations (ICLR); 2021 May 4; Vienna, Austria. [Google Scholar]
17. He K, Zhang X, Ren S, Sun J. Deep residual learning for image recognition. In: Proceedings of the IEEE Conference on Computer Vision and Pattern Recognition; 2016 Jun 27–30; Las Vegas, NV, USA. p. 770–8. [Google Scholar]
Cite This Article
 Copyright © 2025 The Author(s). Published by Tech Science Press.
This work is licensed under a Creative Commons Attribution 4.0 International License , which permits unrestricted use, distribution, and reproduction in any medium, provided the original work is properly cited.
 Downloads
 Citation Tools