
 Submit a Paper
 Propose a Special lssue
 Open Access
ARTICLE

Enhanced Classification of Brain Tumor Types Using Multi-Head Self-Attention and ResNeXt CNN
Pattern Recognition Lab, Department of Computer & Information Sciences, Pakistan Institute of Engineering & Applied Sciences, Nilore, 45650, Islamabad, Pakistan
* Corresponding Author: Muhammad Naeem. Email:
Journal on Artificial Intelligence 2025, 7, 115-141. https://doi.org/10.32604/jai.2025.062446
Received 18 December 2024; Accepted 29 April 2025; Issue published 30 May 2025
 View Full Text
 Download PDF
Abstract
Brain tumor identification is a challenging task in neuro-oncology. The brain’s complex anatomy makes it a crucial part of the central nervous system. Accurate tumor classification is crucial for clinical diagnosis and treatment planning. This research presents a significant advancement in the multi-classification of brain tumors. This paper proposed a novel architecture that integrates Enhanced ResNeXt 101_32×8d, a Convolutional Neural Network (CNN) with a multi-head self-attention (MHSA) mechanism. This combination harnesses the strengths of the feature extraction, feature representation by CNN, and long-range dependencies by MHSA. Magnetic Resonance Imaging (MRI) datasets were employed to check the effectiveness of the proposed architecture. The first dataset (DS-1, Msoud) included four brain tumor classes, and the second dataset (DS-2) contained seven brain tumor classes. This methodology effectively distinguished various tumor classes, achieving high accuracies of 99.75% on DS-1 and 98.80% on DS-2. These impressive results indicate the superior performance and adaptability of our model for multiclass brain tumor classification. Evaluation metrics such as accuracy, precision, recall, F1 score, and ROC (receiver operating characteristic) curve were utilized to comprehensively evaluate model validity. The performance results showed that the model is well-suited for clinical applications, with reduced errors and high accuracy.Keywords
The complex anatomy of the brain consists of distinct functional regions. Each region controls various biological processes in the nervous system [1]. A defining feature of brain tumors is the abnormal growth of brain cells, with over 120 recognized types capable of developing in the brain and skull. As one of the most lethal malignancies worldwide, these tumors contribute substantially to cancer-related mortality across all demographic strata, affecting individuals regardless of age or gender. Consequently, early and accurate tumor detection is critical for optimizing therapeutic outcomes and establishing standardized clinical management protocols. According to [2], the overall incidence rate of primary brain and CNS (Central nervous system) tumors in the U.S. is 25.34 cases per 100,000 people, totaling 467,894 cases. This includes 6.89 per 100,000 for malignant tumors (126,807 cases) and 18.46 per 100,000 for non-malignant tumors (341,087 cases).
Magnetic resonance imaging (MRI) [3] is an essential diagnostic tool for detecting brain tumors, offering detailed, high-resolution images of brain structures. Its non-invasive nature allows for clear visualization of soft tissues, which is crucial in assessing tumor presence, size, and location. While previous research primarily focused on three types of brain tumors—pituitary, meningioma, and glioma—this study expands its scope to include additional categories, specifically Astrocytomas, Neurocitoma, and Schwannomas.
The multi-classification of brain tumors advanced from traditional machine learning techniques to the more powerful deep neural networks (DNNs). It excels at automatically learning features from medical images [4]. Recently, attention mechanisms and transformer models, originally used in natural language processing, have been applied to improve accuracy and efficiency in brain tumor detection. By prioritizing important regions of an image, these methods capture complex patterns and context, leading to better diagnostic performance and enhanced precision in classifying various tumor types from MRI or CT (Computed Tomography) scans.
The integration of techniques, specifically the Multi-head Self Attention Module (MHSA) and the Resnext101_32×8d convolutional neural network module, has enhanced the proposed model’s learning capabilities. This advancement will aid in personalizing treatment strategies. It will promote early detection and monitoring, which ultimately optimizes clinical efficiency. The primary contributions are summarized below:
1. Novel Architecture: Our architecture combines the Multi-head Self Attention Module (MHSA) and Resnext101_32×8d Convolutional Neural Network. Multi-head Self Attention Module (MHSA) focuses on different parts of an input sequence simultaneously by using multiple attention “heads.”, while Resnext101_32×8d, an advanced version of ResNet with 101 layers, uses grouped convolutions to enhance feature extraction while minimizing parameters. This structure allows for high accuracy with optimized computation.
2. Multi-Class Brain Tumor Problem: Enhanced ability to learn and comparatively better precision to address the multi-class brain tumor classification encompassing seven distinct classes: Astrocitoma, Glioma, Meningioma, Neurocitoma, Normal, Pituitary, and Schwannoma.
3. High Accuracy: Achieving a test accuracy of 98.6% and a macro average accuracy of 99%, the model demonstrates superior performance in distinguishing between seven different brain tumor types, which can lead to more reliable diagnoses.
These benefits suggest that the model is a valuable tool in neuro-oncology for accurate, efficient, and clinically impactful brain tumor classification.
At present, modern research focuses on deep learning models for classifying brain tumors. For this purpose, various methodologies and architectures have been proposed by integrating machine learning techniques with deep learning models to enhance the classification accuracy of brain tumors. Advancements in artificial intelligence, particularly deep learning algorithms, have significantly improved the effectiveness of medical slice classification across different medical domains.
In [5], a 26-layer CNN-based Graph Neural Network (GNN) model is presented to deal with non-Euclidean distances in images. A pre-computed adjacency matrix is used to capture regional information. Image categorization and spatial relationship analysis are enhanced by this combination. In [6], a multilevel attention model for brain tumor classification is created using EfficientNetV2 with Efficient Triplet Attention (ETA) and Pyramid Split Attention (PSA) modules.
In [7] a new dimension called “cardinality” denotes the size of the transformation set introduced by the homogenous, multi-branch network design with minimal hyperparameter adjustment. ResNeXt models outperformed ResNet on the SliceNet-5K and COCO datasets, and they ranked second in the ILSVRC 2016 classification challenge. The deep ResNet-50 model [8] employs an improved ant colony optimization (IACO) method is suggested for brain tumor classification. It combines multi-population operators with a differential evolution strategy. ARM-Net, an attention-based residual multiscale CNN with a lightweight global attention module (LGAM), was introduced. The study [9] proposed using a multi-head attention network in conjunction with EfficientNet and multi-path convolution for grade classification, using the Jaccard coefficient.
The study [10] proposes brain tumor detection using an enhanced ResNet50 model, where feature extraction and transfer learning are fine-tuned with additional layers for improved performance. The novel deep-learning approach boosts classification accuracy for brain cancer using a pre-trained CNN model adapted for the task. In [11], the study introduced a novel deep learning approach using the EfficientNet family for improved brain tumor classification, utilizing 3064 T1-weighted CE MRI images with advanced preprocessing and augmentation. The results show that EfficientNetB07 achieves high classification accuracy.
The work [12] proposes an end-to-end optimized deep learning system for multimodal brain tumor classification, evaluated on the BRATS dataset. It uses hybrid histogram equalization with ant colony optimization, a nine-layer CNN, and feature optimization through differential evolution and moth flame optimization, followed by fusion and classification using a multi-class SVM (Support Vector Machine). In [13] evaluated the performance of five pre-trained deep learning models—ResNet50, Xception, EfficientNetV2-S, ResNet152V2, and VGG16—on a public MRI dataset for classifying glioma, meningioma, pituitary tumors, or no tumor. The models were assessed using various classification metrics.
Evolutionary optimization is presented for the classification of four brain tumor modalities (FLAIR, T1, T1ce, and T2) using extensive MRI datasets [11]. Using an enhanced Grey Wolf algorithm with Jaya algorithm criteria, a modified CNN architecture, and a Stack Encoder-Decoder network with ten convolutional layers, was optimized and assessed on the BraTS2020 and BraTS2021 datasets. Table 1 presented the journal references alongside the methodologies, datasets, and accuracy metrics of recent advancements in brain tumor classification.

We have used two open Kaggle datasets (Brain Tumor MRI Dataset 4 Classes, n.d.) for brain tumor classification. The main dataset Msoud (DS-1) contains 7023 MRI brain tumor scans. It has four groups: Glioma, Meningioma, Pituitary, and Normal. DS-1 joins three datasets: FigShare.com, SARTAJ along with Br35H. The dataset is divided into the training file directory and the test file directory. Table 2 shows the figures for each tumor group, and Fig. 1 presents the chart of the figures.

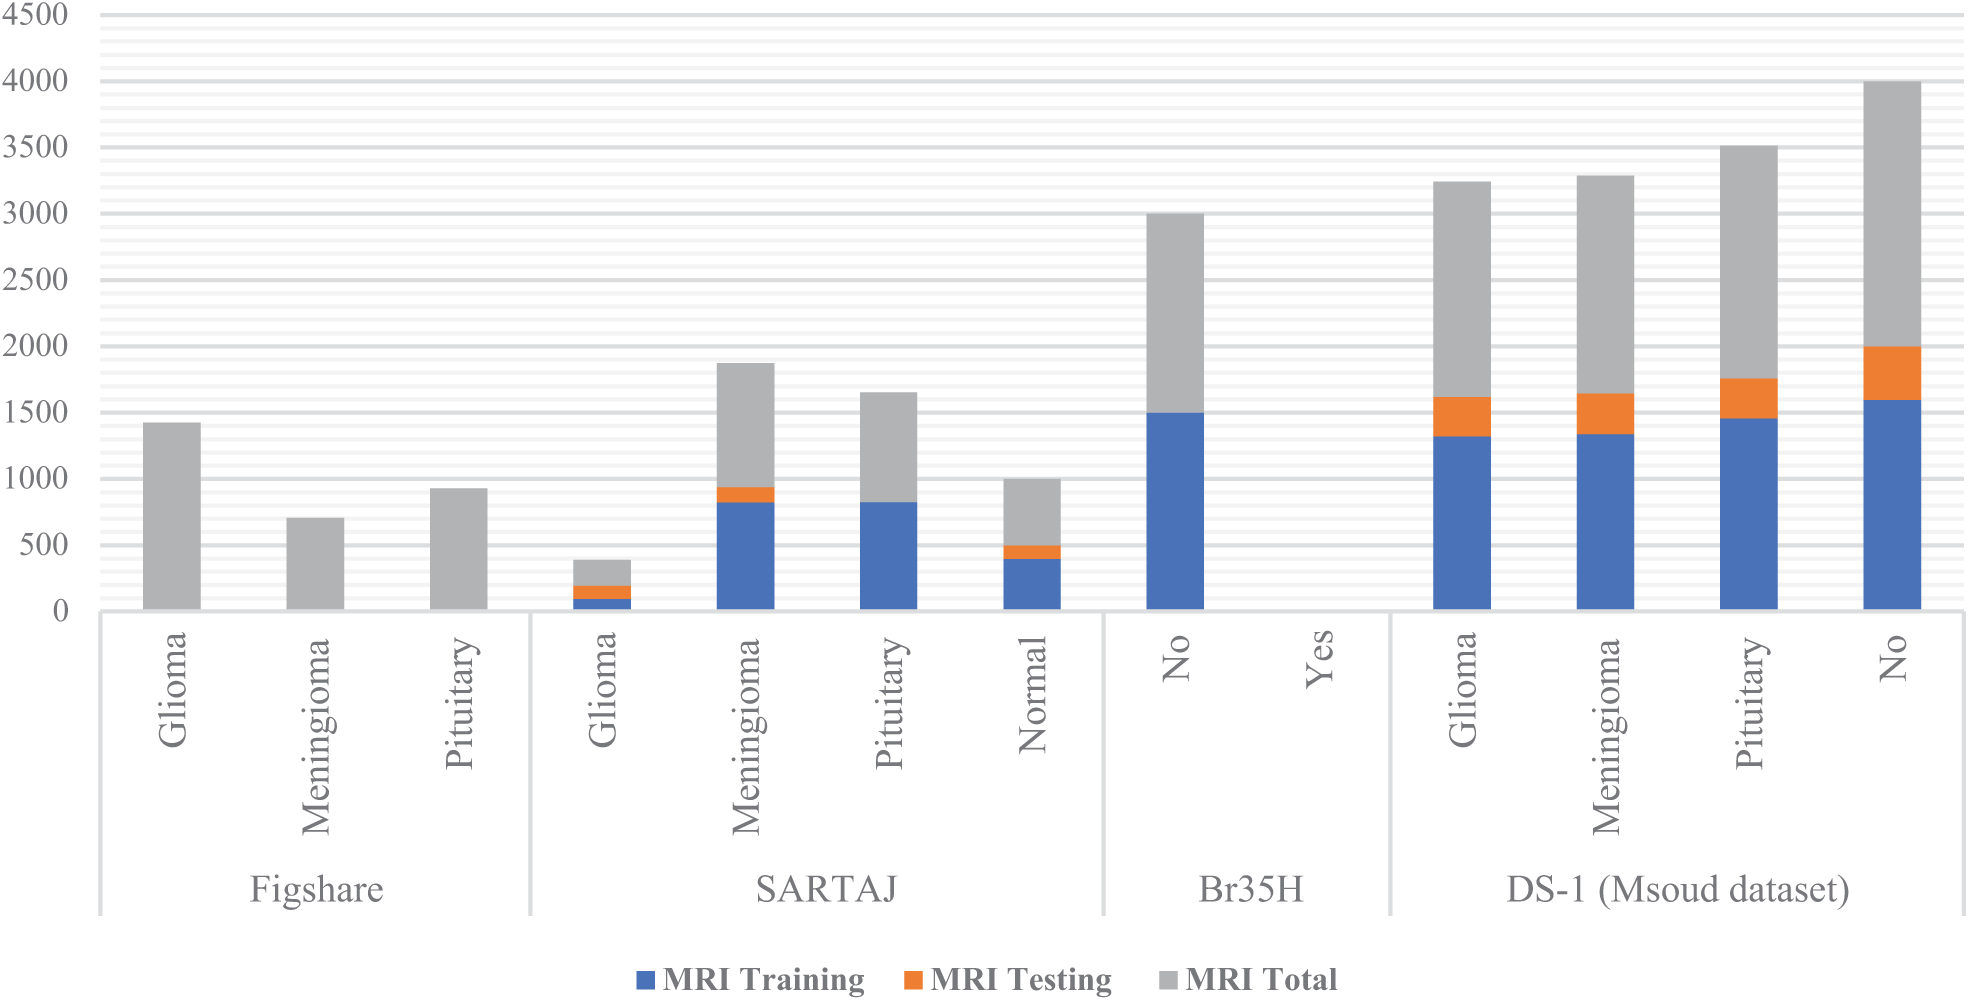
Figure 1: Brain tumor class distribution graph, training and test dataset, Msoud (DS-1)
The FigShare.com set gives 3064 MRI samples, which equal 44% of DS-1. It has three groups: Glioma, Meningioma, and Pituitary. The SARTAJ set gives 2459 samples, the same as 35% of DS-1. It holds four groups: Glioma, Meningioma, Pituitary, plus one without tumor. The normal Br35H set gives two groups. Yet the no-tumor class appears only in DS-1.
Our proposed model was validated on the enhanced brain tumor classes utilizing publicly available Brain Tumor MRI datasets from Kaggle [19]. This dataset (DS-2) is a collection of brain tumor MRI slices exhibiting various tumor sizes, shapes, and locations. Table 3 illustrates the distribution of MRI scans across the seven brain tumor classes for both training and testing datasets. Although there are fourteen classes in the original database. This study focused on the seven most significant brain tumor classes, which include 14,149 grayscale MRI brain tumor slices. The selected classes include Astrocytoma, Glioma, Meningioma, Neurocytoma, Pituitary, Schwannoma, and Normal. Fig. 2 displays the class wise visual representation of brain tumor MRI slices. Fig. 3 illustrated MRI scans of brian tumor classes.


Figure 2: Distribution graph of seven brain tumor classes (DS-2)

Figure 3: Class-wise brain tumor MRI slices
We introduced an efficient classification framework for brain tumors. The first stage initiates with pre-processing, which includes resizing, normalization, and standard deviation adjustments for both training and testing data. At the heart of our proposed system as shown by Fig. 4, is the combination of an enhanced ResNeXt 101_32×8d Convolutional Neural Networks (CNN) Module and an advanced deep learning technique known as the Multi-head Self Attention Module (MHSA). The enhanced ResNeXt serves as the main feature extractor, gathering structural and spatial details. The subsequent MHSA module then concentrates on identifying significant critical areas, capturing global contextual information that is essential for the classification process. The refined features are then passed to a fully connected layer, culminating in a softmax classifier that assigns the appropriate brain tumor category. Our proposed framework demonstrates high accuracy in predictions on the test dataset.

Figure 4: Proposed architecture for brain tumor multi-class classification
4.1 Proposed Architecture—Flowchart
Fig. 5 illustrates the flowchart of the proposed architecture. In Step 1, MRI scans are input for preprocessing. Step 2 involves feature extraction using ResNeXt, which serves as the backbone of the architecture. In Step 3, the extracted features are passed through a Multi-Head Self-Attention (MHSA) mechanism. Step 4 integrates MHSA with a ResNet layer. This is followed by Global Average Pooling in Step 5. Finally, Step 6 comprises a fully connected layer with a Softmax activation function to determine the class probabilities.
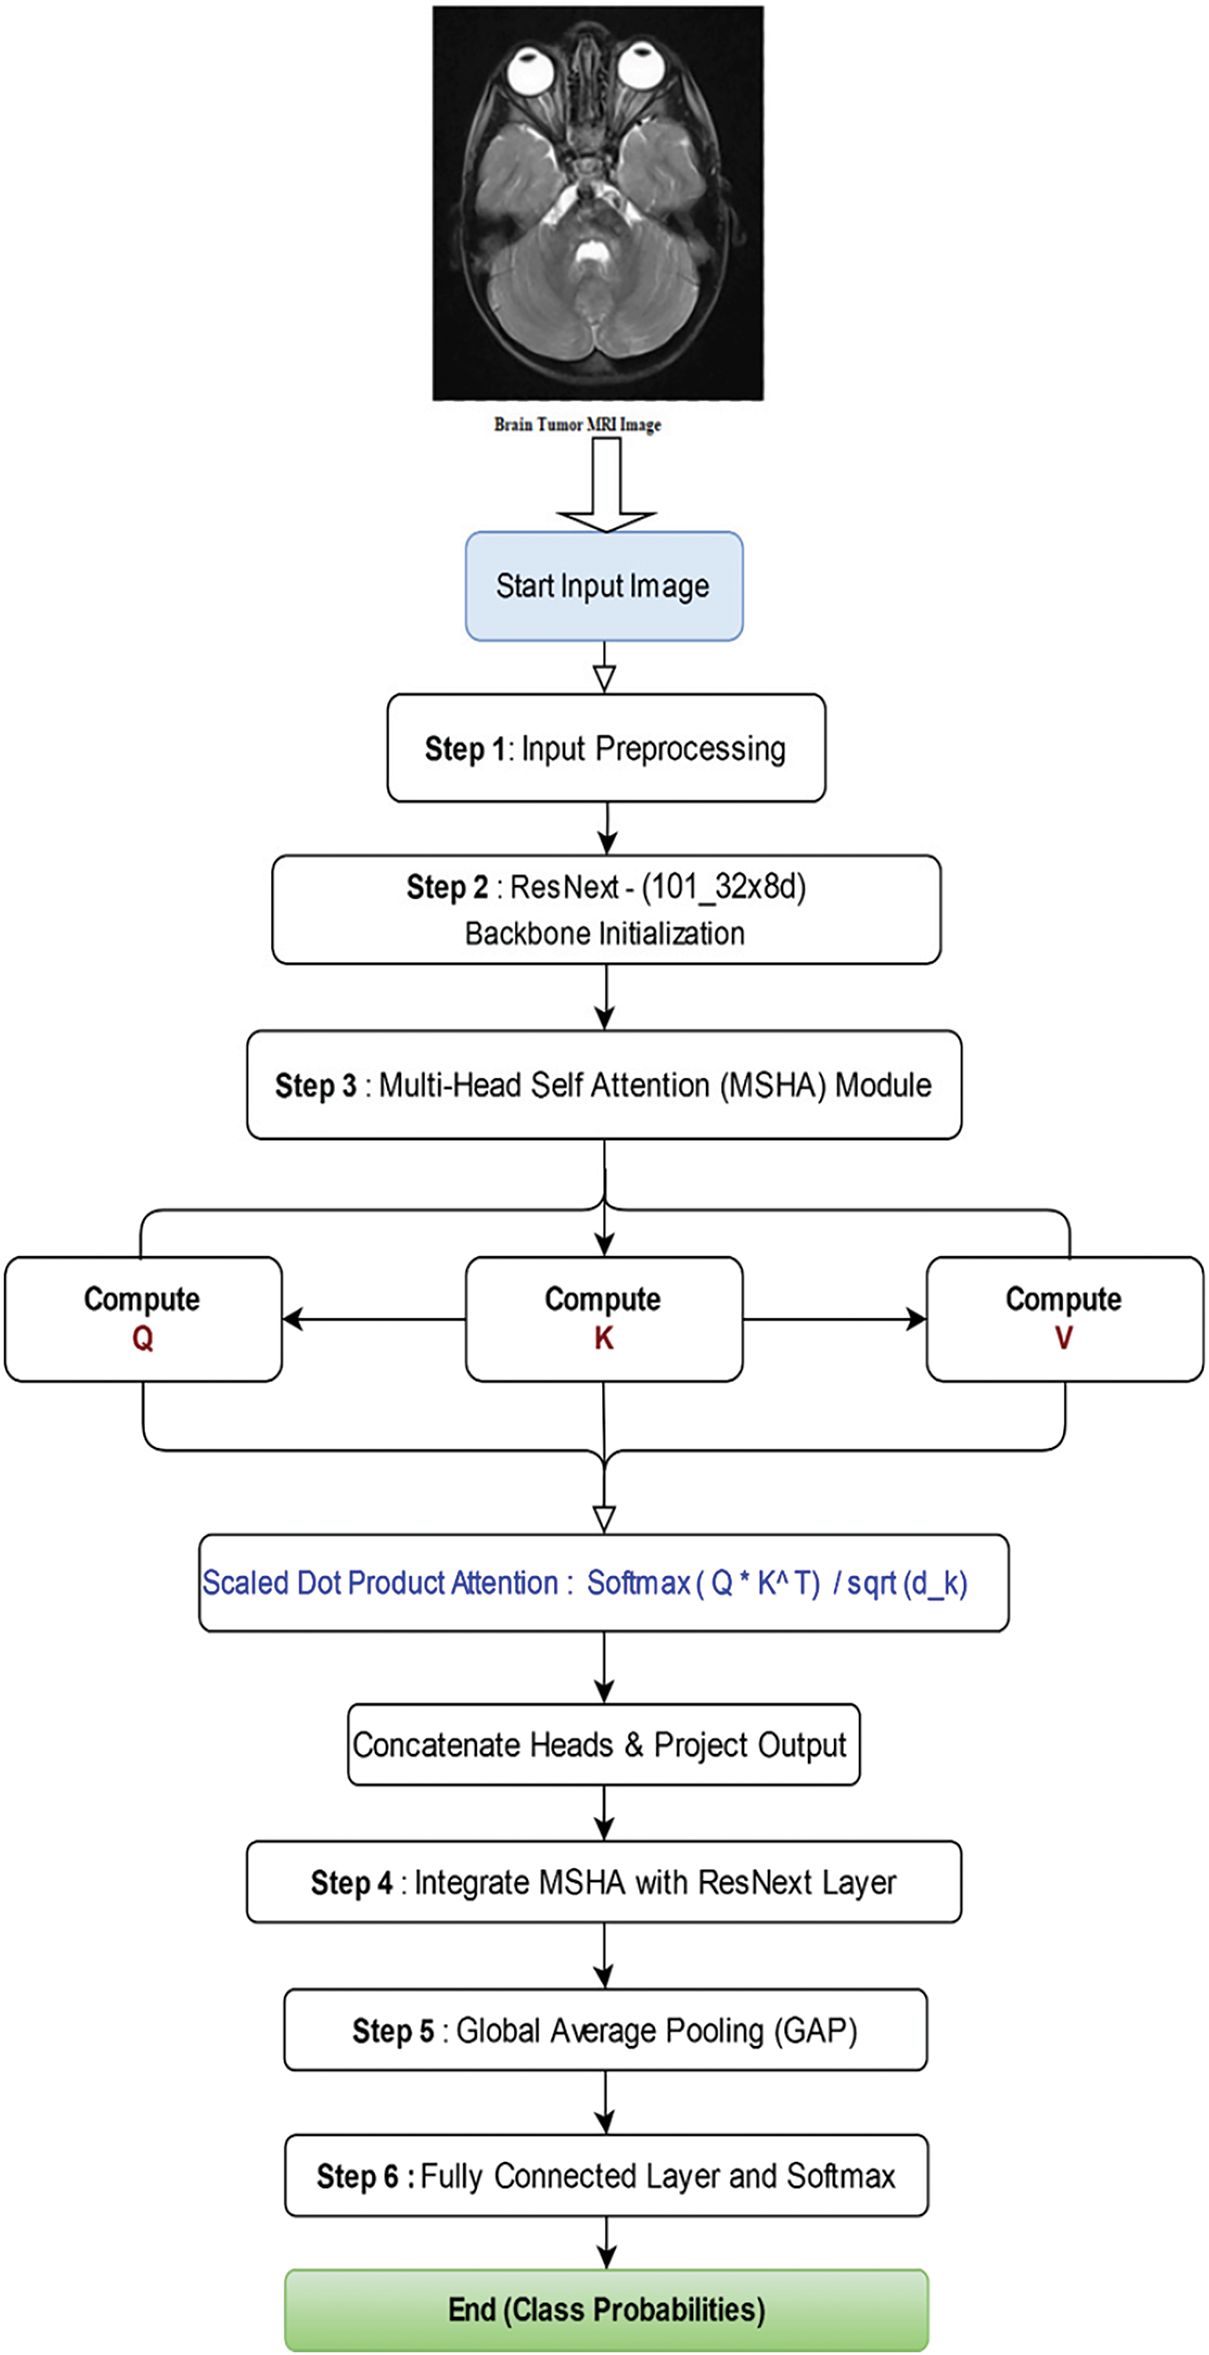
Figure 5: Flowchart of the proposed Algorithm
4.2 Enhanced Architecture of ResNeXt (101_32×8d)
The improved ResNeXt architecture outperforms the standard ResNeXt-101 (32×8d) model in terms of feature extraction, classification, and generalization. These modifications mostly consist of adding additional convolutional layers before and after the ResNeXt backbone, modifying the input layer, and strengthening the fully connected classifier as illustrated in Fig. 6.

Figure 6: Enhanced architecture of ResNeXt 101_32×8d
One of the most significant changes is the insertion of additional convolutional layers before the ResNeXt backbone, which improves the quality of feature representation. It is evident by Table 4, the original ResNeXt takes a three-channel RGB (Red, Green, Blue) image as input, our new design uses a two-layer convolutional block to transform it into a 128-channel feature map. This block features two convolutional layers: a 3 × 3 convolutional layer that expands the input to 128 channels and a 5 × 5 convolutional layer that increases the channel count from 3 to 64 channels following ReLU (Rectified Linear Unit) activation and batch normalization. These changes significantly improve the data feature extraction before it enters the ResNeXt model. To accommodate this adjustment, the initial convolutional layer of ResNeXt has been modified to accept 128-channel inputs rather than the standard three-channel format.

The ResNeXt backbone basic structure of clustered convolutions and residual connections has remained relatively stable. Following the ResNeXt layers, more convolutional layers are added to improve feature representation. Traditionally, the ResNeXt model generates 2048 channels, which are pooled and classified. This improved version includes two more convolutional layers before the final classification stage. This update reduces the number of feature channels from 2048 to 512, with intermediate phases of 1024. These layers use 3 × 3 convolutional filters, batch normalization, and ReLU activation to refine features and improve model expressiveness.
The fully connected classification layer has also been adjusted to enhance generalization and mitigate overfitting. Rather than sending the 2048-dimensional feature space directly to the target class, a two-layer classifier is implemented. To provide regularization, ReLU activation and a dropout rate of 0.3 are applied. The feature size is reduced from 512 to 256 in the fully connected (FC) layers. In the final FC layer, the 256-dimensional representations of the target classes are presented. This approach enhances classification accuracy while reducing the risk of overfitting. The additional convolutional layers contribute to improved generalization and classification performance.
4.3 Multi-Head Self Attention Model
A Multi-Head Self-Attention Model is used to assess the response at a specific position. It contributed to the overall output by considering the significance of each dependency contribution. The input image is linearly transformed, resulting in three head vectors: query (Q), key (K), and value (V). These features are subsequently subjected to the softmax classifier, as illustrated in Fig. 7. The Multi-Head Self-Attention mechanism computes the comprehensive representation of the image while focusing attention across multiple heads. It extracts features from distinct segments of the image. The subsequent equation is employed to calculate attention.

Figure 7: Flow chart architecture of multi-head self attention
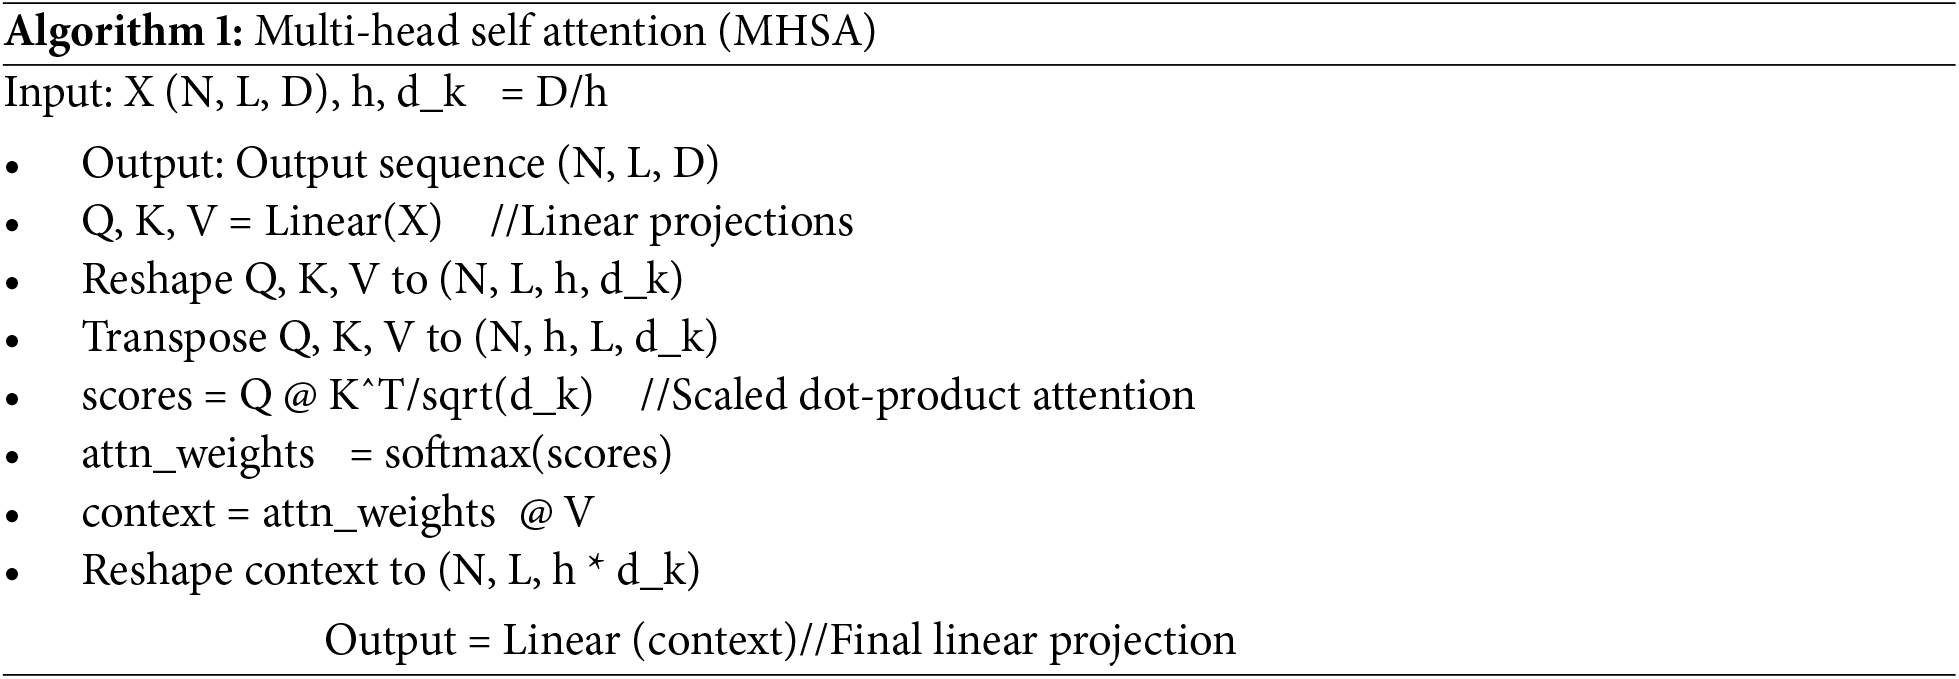
Different dimensions are mapped to spaces by a linear transformation. MASM emphasizes information from different subspaces and presentation as well as different locations [20]. The Algorithm 1 for multi-head self-attention is cited from the original source.
This section describes the application of the proposed model to the brain tumor datasets. It starts with pre-processing of data, and the model is evaluated by training and test results, relevant graphs, performance metrics, a Confusion matrix, and an ROC Curve. Moreover, the Grad-CAM (Gradient-weighted Class Activation Mapping) technique has been applied to provide visual explanations of the model’s focus areas for dataset 1.
Preprocessing plays an essential role in the optimization of deep learning models, particularly in the classification tasks of brain tumors. It emphasized pertinent features and mitigated distortion. The initial phase of preprocessing encompasses resizing the images to a standardized dimension, normalizing pixel intensity to achieve uniformity, and applying standard deviation adjustments to enhance robustness and generalizability for both training and testing data loaders. We have decreased the dimensions of the MRI slices from a high-resolution format of 512 × 512 pixels to the model standard of 224 × 224 pixels. The pixel intensity values were normalized using the means and standard deviations. (μ ± σ) calculated for the RGB channels, which were as follows: Red channel 0.485 ± 0.229, Green channel 0.456 ± 0.224, and Blue channel 0.406 ± 0.225. This phase enhances training efficiency by reducing biases and facilitating a more rapid convergence. Ultimately, we implemented data augmentation techniques by modifying brightness and contrast to diversify slice characteristics, mitigate overfitting, and enhance model performance by exposing a range of visual patterns.
The cloud based Kaggle training environment has been utilized for research having specification of CPU Intel Xeon (2 cores, 13 GB RAM) RAM of 16 GB, and GPU NVIDIA Tesla T4 (16 GB VRAM).
In this study, for accurate evaluation we implemented standard performance metrics. These include Receiver Operating Characteristic curves (ROC), precision, recall (sensitivity), accuracy and F1 score. These measures focus on their effectiveness in terms of overall performance in detecting brain tumors.
In the above equations, true positives (TP), true negatives (TN), false positives (FP), and false negatives (FN). Accuracy is the ratio of correct predictions to total predictions. Precision accounts for the positive predictions, while recall detects all instances of a specific class. The balance between recall and precision is the F1 score. The ROC curve is a graph that helps to visualize the tradeoff between sensitivity (true positive rate) and specificity (false positive rate).
The proposed model was trained using the Cross Entropy Loss function. It computes dissimilarity between actual and predicted class labels and assigns the correct class higher probabilities while penalizing incorrect predictions. We have employed Stochastic Gradient Descent (SGD) optimizer, 0.9 momentum, and 0.01 learning rate. For processing and fine tuning, the programming language Python was utilized with the PyTorch framework. The PyTorch format (N, C, H, W) has been utilized for data forwarding, where N is the batch size, C is number of channels, H and W are the image height and width. The (N) batch size is 32, (C) number of channels is 3. Regularization L2 applied with a weight decay coefficient of 5 × 10⁻⁴, which penalizes large weights.
Table 5 shows that various enhanced deep learning neural network models with Multi Head Self-Attention Module were assessed for the classification of DS-2 of brain tumors and analyzed by multiple performance metrics. ResNeXt 101_32×8d, Densenet201, Wide-ResNet50_2, Wide-ResNet101_2 and Densenet121 etc. ResNeXt 50_32×4d, and DenseNet201 were among the competing models. Across all tumor classes, the ResNeXt 101_32×8d model consistently had precision, recall, and F1-scores close to or around 1.00. It achieved the greatest testing accuracy of 98.21%. Strong performance was also demonstrated by Densenet201 and Wide-ResNet50_2, with testing accuracies of 98.15% and 98.12%, respectively, as illustrated in Fig. 8.

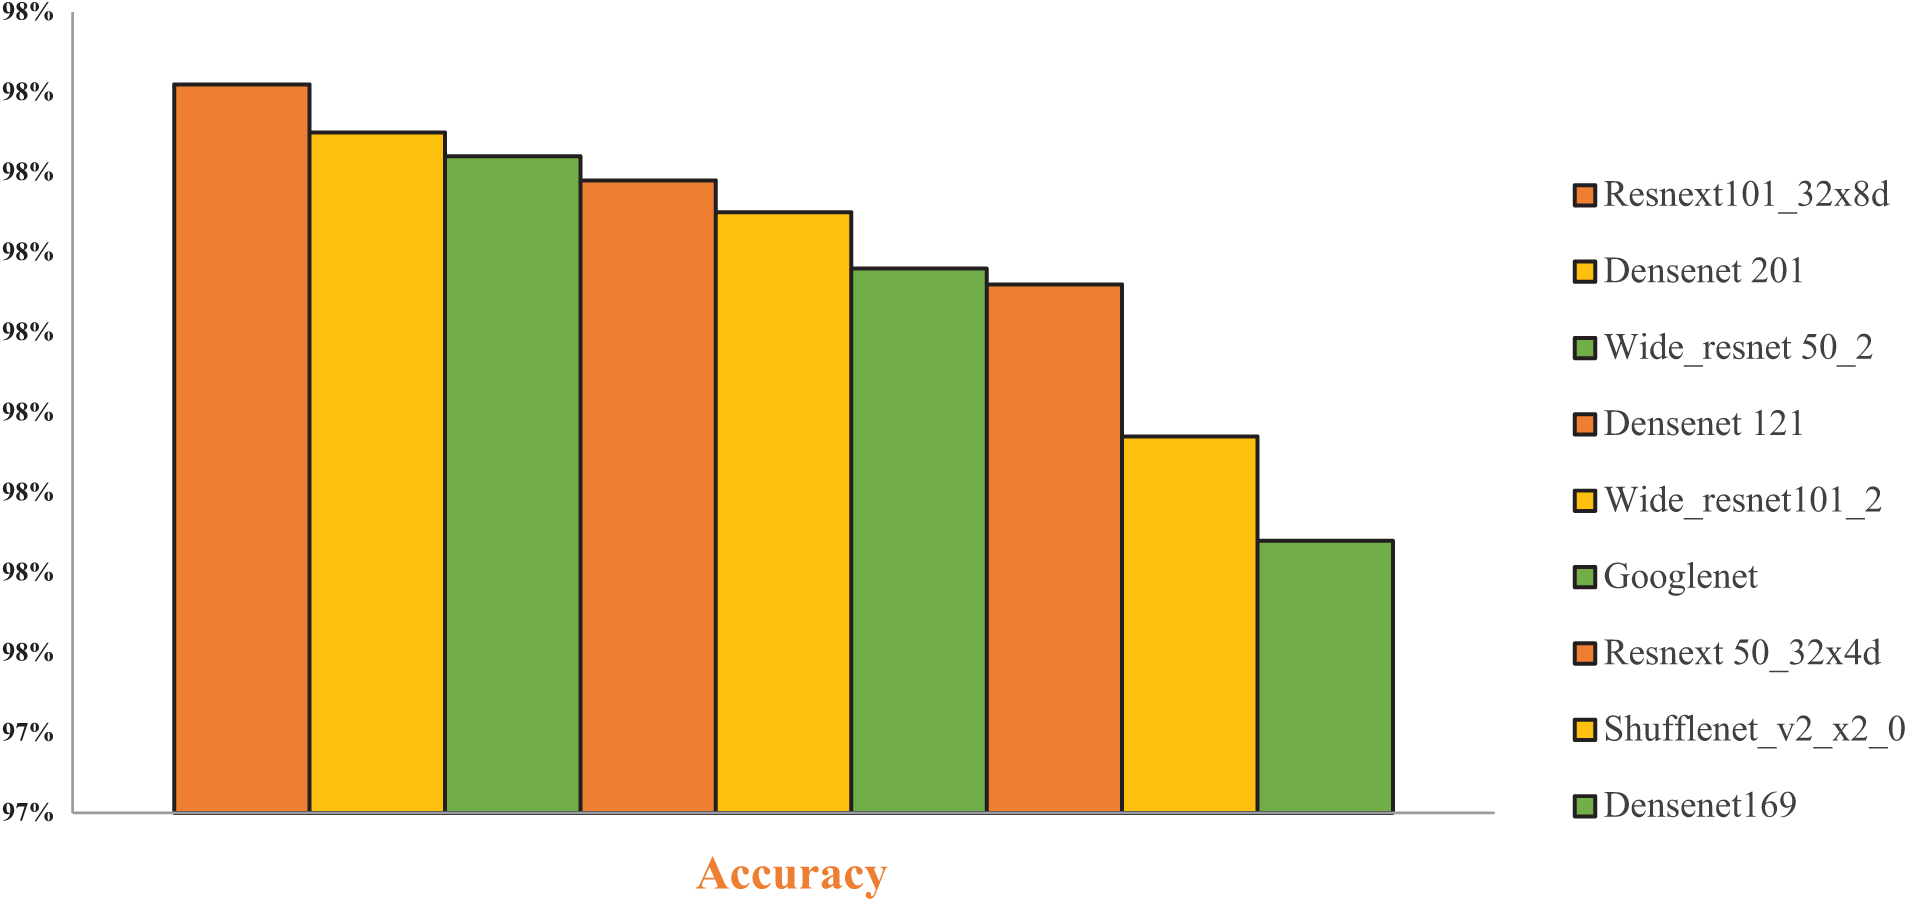
Figure 8: Performance graph of CNN models for DS-2
Table 6 compares different Convolutional Neural Network (CNN) models, each enhanced with a Multi-Head Self-Attention (MHSA) module, in terms of accuracy. Enhanced ResNeXt 101_32×8d + MHSA achieves the highest accuracy of 98.80%, EfficientNetB0 + MSHA at 98.31, and so on. These results highlighted that Enhanced ResNeXt 101_32×8d + MHSA delivers the best performance, demonstrating the benefit of adding self-attention modules to CNN architectures for enhancing classification accuracy.

Convolutional Block Attention Module (CBAM) was employed to asses performance by classification of DS-1 using two enhanced deep learning models. Table 7 depicts a testing accuracy of 97.7%, with ResNeXt 101_32×8d + CBAM Attention, while ResNeXt 50_32×4d + CBAM Attention Module was at 97.32%. Both models demonstrated comparable generalizability and efficient feature extraction for categorizing brain tumors. However, the accuracy of the Multi-Head Self-Attention Module is better than Convolutional Block Attention Module (CBAM).

Our proposed model used the best optimizer after employing several experiments with various optimizers. This includes Adam, RMSprop, Stochastic Gradient Descent (SGD), and Accelerated Stochastic Gradient Descent (ASGD). The results are given in Table 8. As can be seen from the table, the accuracy of SGD is 97.95%, while the accuracy of ASGD is 97.53%. At last, the RMSprop optimizer only exhibits 77.3%. To obtain the best results, we selected the SGD optimizer for our model, as illustrated in Fig. 9.


Figure 9: Precision recall and F-1 score graph for DS-2
5.6 Loss and Accuracy Measures
Dataset-1
Our proposed model achieved an impressive accuracy of 99.70% on Dataset 1, which contains four classes of brain tumor, namely Glioma, Meningioma, Pituitary, and Normal. Table 9 presented the pre-cision, recall, and F1 scores ranging from a perfect 1.0 to 0.98—for brain tumor classes such as Glioma, Meningioma, Pituitary, and Normal. It demonstrates our model’s ability to learn and classify mul-ti-class data with a high level of accuracy as illustrated in Fig. 10. The standard metrics comprise loss and accuracy graphs, a confusion matrix and ROC curve, further validating our model performance.


Figure 10: Performance graph of proposed model
Fig. 11 illustrates the classification performance of our proposed model in terms of loss and accuracy curves for different epochs. Loss plot on the left, the blue line represents the training loss, which starts high, drops sharply, and stabilizes at lower values, while the test loss, the orange line, initially decreases and fluctuates, gradually smoothing to near zero. The accuracy plot on the right shows the training accuracy, represented by the blue line, starting around 0.90% and quickly approaching 0.99%, which is almost perfect accuracy. The test accuracy fluctuates from 0.92% of the orange line to 0.99%. It demonstrates efficient learning and high performance.
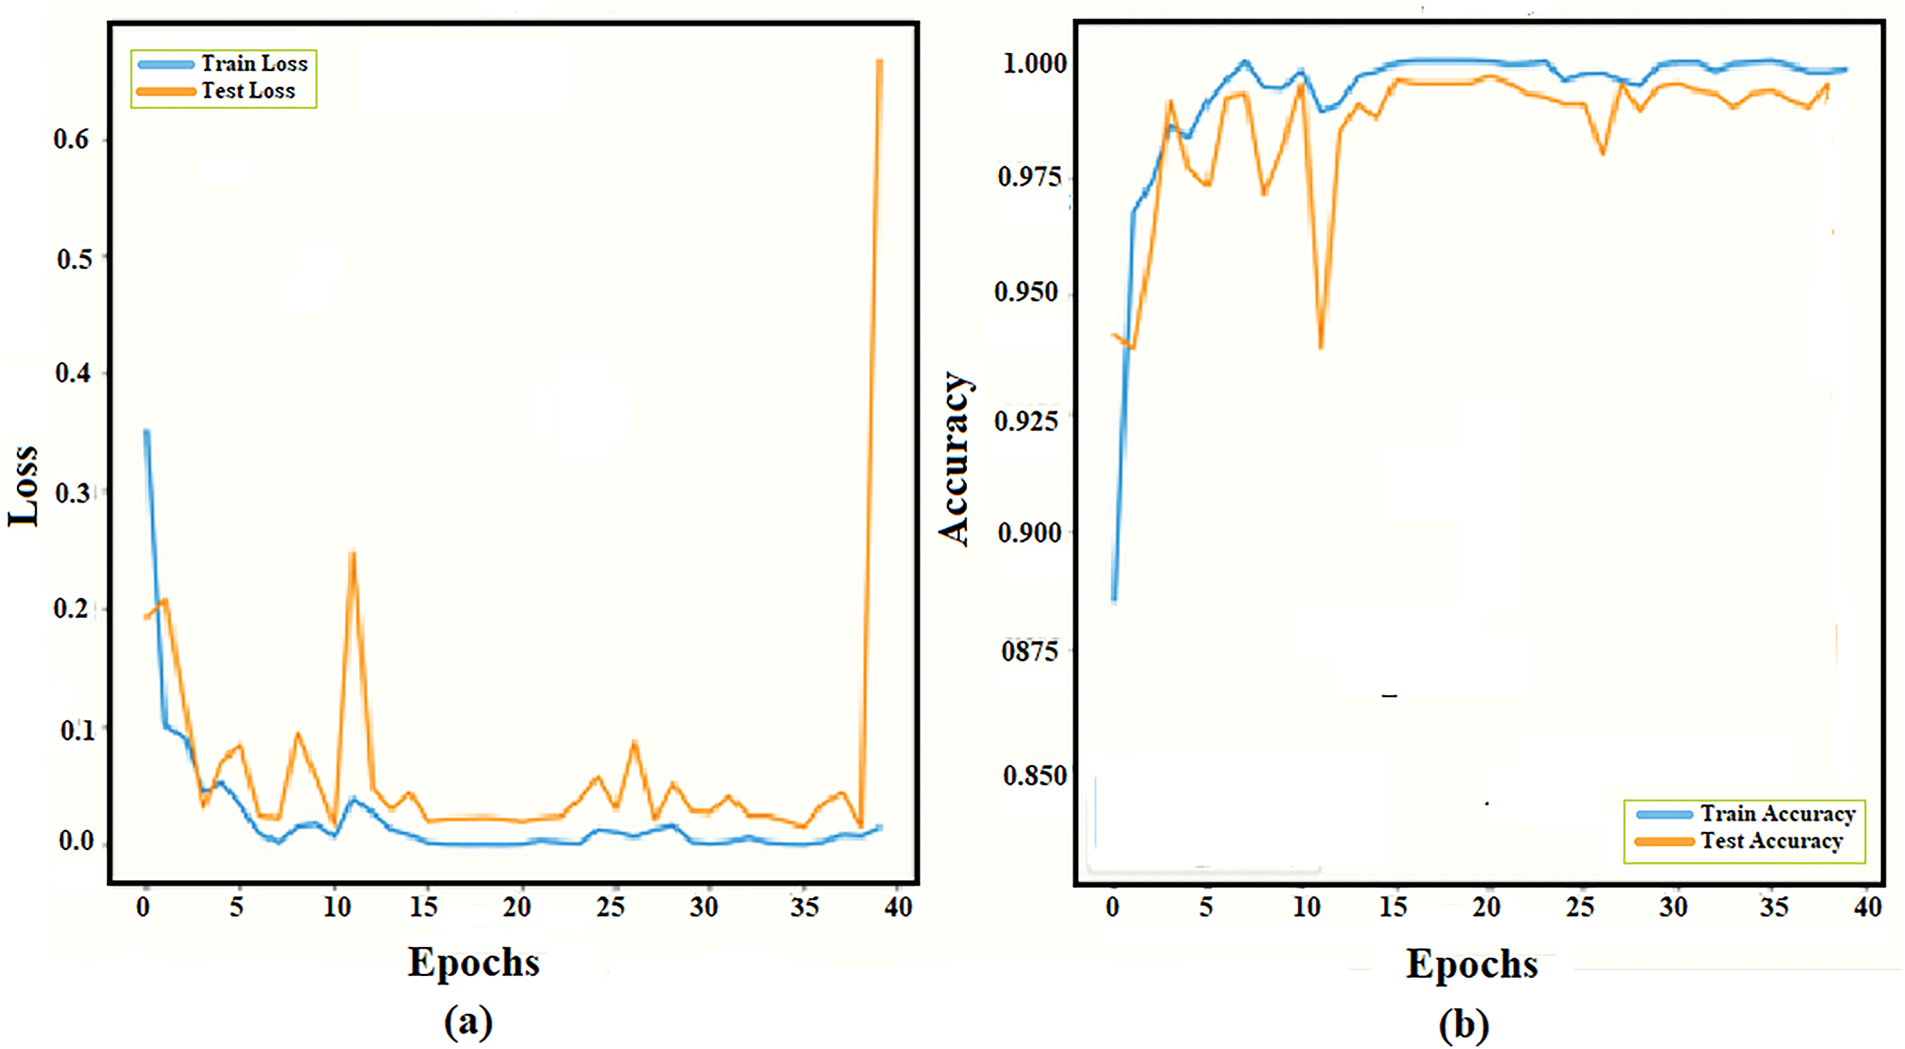
Figure 11: Training and testing data curve of the proposed architecture. DS-1 (a) Loss curve (b) Accuracy curve
A confusion matrix offers a visual representation of accuracy and errors. The axes are labeled “true label” for the y-axis and “predicted label” for the x-axis. It evaluates our model’s classification performance. Four brain tumor categories, namely Glioma, Meningioma, Normal, and Pituitary, are represented by the 4 × 4 matrix as depicted in Fig. 12. Proper classifications are displayed diagonally. True labels are shown in rows, and predicted labels are shown in columns. At diagonal Glioma (292), Meningioma (305), No Tumor (403), and Pituitary (299). Misclassifications shown by off-diagonal elements: Glioma (8), Meningioma (1), No Tumor (2), and Pituitary (1). Overall, our model performs well.

Figure 12: Confusion matrix of the proposed model for DS-1
ROC curve presents the graph between the true positive rate (sensitivity) and the false positive rate (1-specificity). The ability to distinguish between classes is measured by its AUC (Area under the Curve). A curve that approaches the upper-left corner of the graph indicates better model performance.
With near perfect classification (AUC = 0.99) for Glioma and Meningioma subsequently perfect classification (AUC = 1.00) for Normal and Pituitary classes, as depicted by Fig. 13. The closeness of all the curves to the ideal top-left corner showed accurate and error-free model performance.
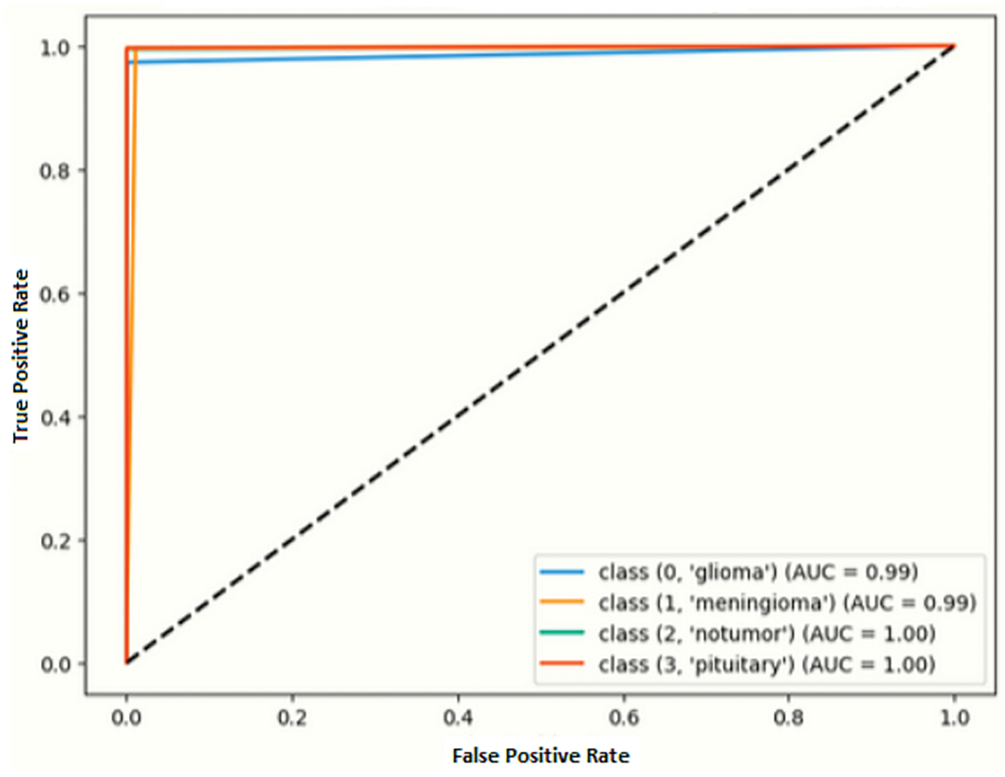
Figure 13: ROC curve of the proposed model for DS-1
Our proposed model achieved an impressive accuracy of 98.60% on Dataset 2, which contains seven classes of brain tumor, namely Astrocytoma, Glioma, Meningioma, Neurocitoma, Normal, Pituitary, and Schwannoma. It demonstrates our model’s ability to effectively learn and classify multi-class data with a high level of accuracy, as illustrated in Fig. 14. The standard metrics comprise loss and accuracy graphs, a confusion matrix, and an ROC curve to further validate our model performance.

Figure 14: Training and testing graph of the proposed Model on DS-2. (a) Loss curve (b) Accuracy curve
Seven brain tumor classes, including Astrocytoma, Glioma, Meningioma, Neurocitoma, Normal, Pituitary, and Schwannoma are represented by the 7 × 7 matrix. Proper classifications are displayed on the diagonal, which presents Astrocytoma (270), Glioma (441), Meningioma (415), Neurocytoma (845), Normal (479), Pituitary (331), and Schwannoma (316) as depicted by Fig. 15. The ROC curve shows perfect or near perfect classification, as illustrated in Fig. 16.

Figure 15: Confusion matrix of the proposed model on DS-2

Figure 16: ROC curve of the proposed model on DS-2
5.10 Performance Comparison of Proposed Model with Base Models
It is evident from Table 10, the results that our proposed method has outperformed all the other comparative methods with an accuracy of 99.70%. As illustrated in Fig. 17 that our proposed model is more reliable and accurate in classifying numerous categories of brain tumors.
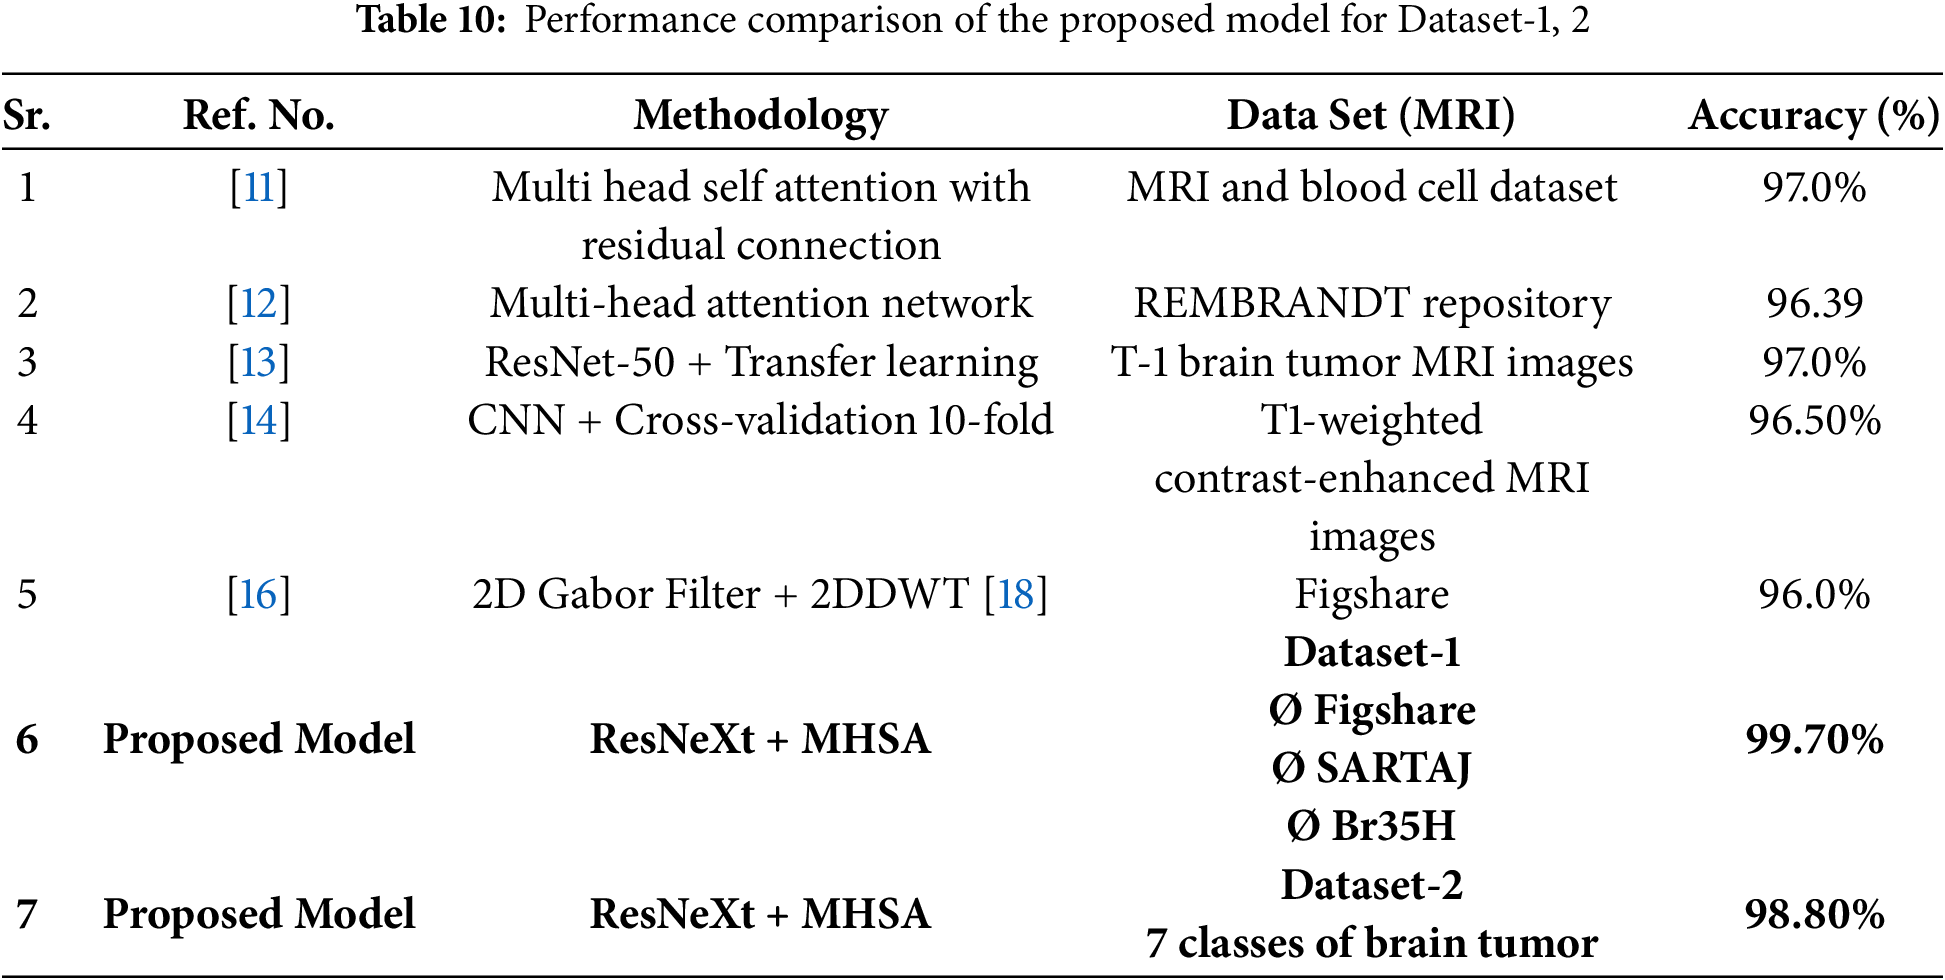
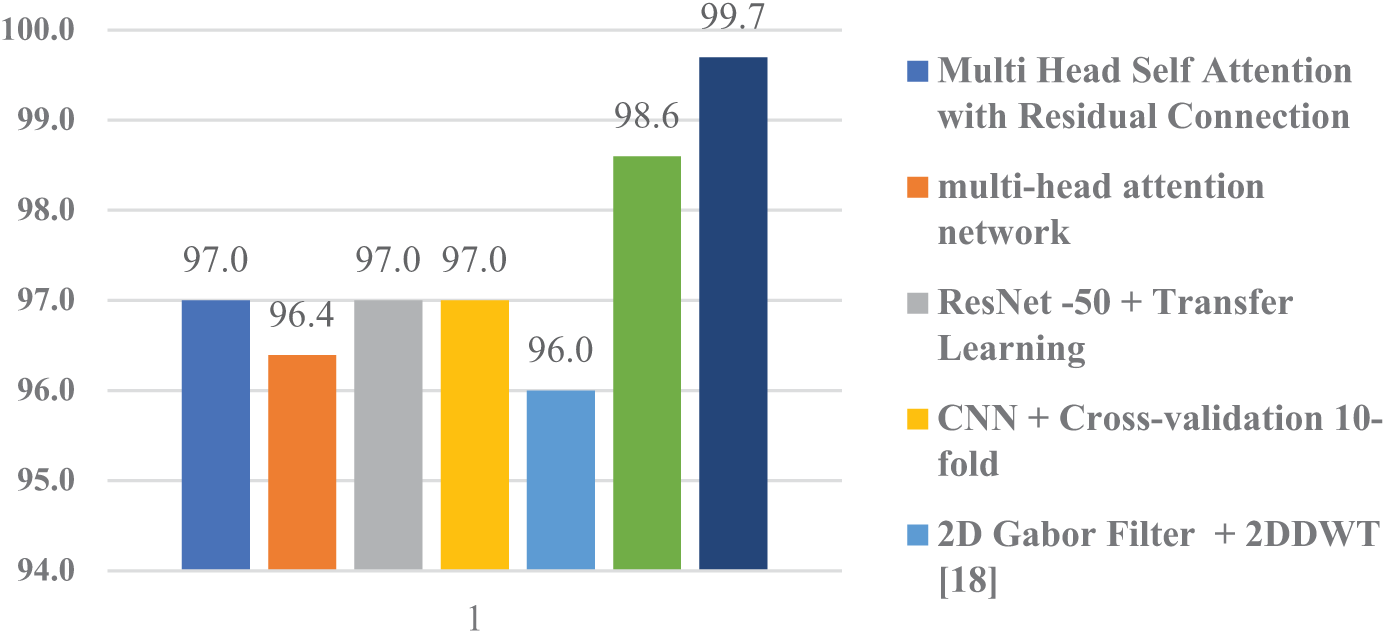
Figure 17: Performance comparison graph of proposed model with peers
5.11 Grad-CAM (Gradient-Weighted Class Activation Mapping)
Grad-CAM helps to understand where a Convolutional Neural Network (CNN) is focusing its attention. It is a visualization technique in deep learning, especially for image classification. The important regions of the input MRI image are highlighted by producing heat maps, as illustrated in Fig. 18. It influences the model’s interpretability, prediction, and support for deployment in critical systems. Identifying data leakage and checking by the model focuses on relevant regions.

Figure 18: Grad-cam images of the proposed model for DS-1
5.12 Time Complexity and Prediction
Table 11 presents the training time (seconds) comparison among various CNN models combined with a Multi-Head Self-Attention (MHSA). Our proposed model, enhanced ResNeXt 101_32×8d + MHSA takes training time (16,685 s), which is quite impressive. The longest training time (20,811 s) was taken by ResNeXt 101_32×8d + MHSA, while EfficientNetB0 + MSHA achieved the shortest training time (3384 s). Overall, models vary in trade-offs between training efficiency and accuracy, as illustrated in Fig. 19.

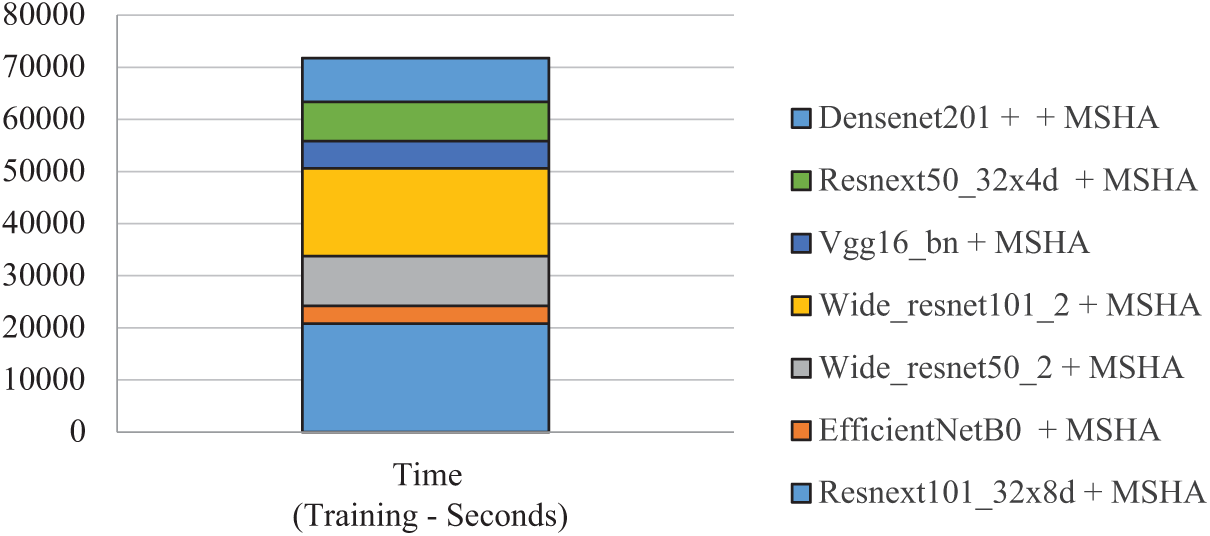
Figure 19: Time complexity of proposed model for DS-1
5.13 Calculating Confidence Intervals for Accuracy
By the Normal Approximation Method
This method assumes the sample size is large enough for the Central Limit Theorem to apply.
The formula for the confidence interval (CI) for accuracy is
where:
P^ = observed accuracy (proportion of correct predictions)
z = critical value from the standard normal distribution corresponding to the desired confidence level (e.g., 1.96 for 95% confidence)
n = total number of samples.
For Dataset-1
For Dataset-2
This research introduced a novel deep learning architecture that integrated an Enhanced ResNeXt 101_32×8d model (CNN) with a multi-head self-attention module (MSHA). The Enhanced ResNeXt 101_32×8d with additional covering layers and fine-tuning exhibited superior performance compared to the standard ResNeXt model. Our proposed model captures both global and local features. The CNN model extracts features such as local texture, pattern, and edge information. The multi-head self-attention module focuses on the global context and long-range dependencies. This arrangement efficiently discriminates elusive differences between various brain tumor types. In managing the complexities inherent in brain tumors, our proposed model exhibited improved performance, achieving a high accuracy of 99.70% with a macro average accuracy of 99%. Moreover, for DS-2, a secondary dataset comprising seven distinct brain tumor classes, the proposed model attained an accuracy of 98.80%, which is quite impressive. A key benefit of this research is its expansion of brain tumor classification from four to seven classes, while significantly improving the accuracy and reliability with regard to clinical tumor diagnosis and treatment.
First is the black box nature of the proposed model. The internal working of feature extraction by multiple layers, weights, and is unexplainable. This affects the fine-tuning predictions. However, the explainable AI (Artificial intelligence) technique provides insights into the model performance, thus improving interpretability.
Model Architectural Complexity
The complex architecture of the proposed model was designed to classify brain tumor MRI scans. The base of the model comprises an enhanced convolutional neural network of ResNeXt 101_32×8d with a multihead self-attention module. Local patterns are captured by the CNN component, whereas the MHSA module focuses on global context. Further research is being conducted on efficient and less complex models.
Data Availability
The quality and quantity of brain tumor MRI datasets have a substantial impact on deep learning. This affects generalization and resilience. Diverse modalities may improve the accuracy and diagnostic confidence. Consistent performance across various imaging modalities may reinforce the reliability of the results.
Medical Imaging Complexity and Size
MRI datasets usually face dissimilarities in brain tumor characteristics, such as patient age, sex, tumor stage, and progression. Each imaging modality (T1-weighted, T2-weighted, and FLAIR) highlights different tissue contrasts. The high resolution of the MRI scans (512 × 512 pixels) was reduced to 224 × 224 pixels. As a result, it blurs the image details such that bu4 processing becomes faster and consumes less power. High-resolution data encompassing all characteristics, such as patient age and sex, may help to address the challenge. Incorporating multimodal MRI data will improve the generalizability and diagnostic accuracy.
Processing time and Hardware Requirements (Scalability Issues)
The processing times for training the deep models are directly proportional to the hardware specifications. A significant amount of processing power and memory is required for large-scale datasets. It requires advanced processing capabilities such as Graphics Processing Units (GPUs) and Tensor Processing Units (TPUs). It applies parallel computations, which significantly reduces the training time. Due to the scarcity of such resources, the results faced longer processing times and delayed experimentation. More sophisticated and advanced resources may improve this situation. As observed from Table 11 of time complexity, Efficient Net validates its computational efficiency with respect to time in only 3384 s. This is highly advantageous in the real world.
Fine-Tuning of Hyperparameters
Hyperparameters, most commonly known as batch size, learning rate, weight decay, kernel size, stride, and dropout rates, require adjustments to optimize model performance. Improper tuning may result in poor generalization, as well as overfitting and under fitting. Meaningful patterns are captured using iterative testing.
One can begin with the baseline configuration. Furthermore, adjusting key parameters such as dropout rate, learning rate, kernel size, and stride systematically yielded improved results. Explainable AI (XAI) provides insights into model performance, thus improving interpretability and informed adjustments.
Future studies may extend the concept to sort malignancies other than brain cancer; this task might include liver, breast, and lung cancers. Each variety exhibits distinct characteristics, such as liver lesions with diverse textures and breast tumors with irregular forms. This job requires field-specific modifications and class-balancing approaches.
The following phase may include imaging tests such as PET (positron emission tomography) and CT. This improvement will increase the model’s dependability and accuracy in difficult clinical judgments where one imaging test may fall short.
Acknowledgement: All individuals acknowledged in this section have provided their consent to be included.
Funding Statement: The authors received no specific funding for this study.
Author Contributions: All research work was conducted by Muhammad Naeem and reviewed and validated by Abdul Majid. All authors reviewed the results and approved the final version of the manuscript.
Availability of Data and Materials: https://www.kaggle.com/datasets/masoudnickparvar/brain-tumor-mri-dataset (accessed on 29 April 2025). https://www.kaggle.com/datasets/hellojahid/brain-tumor-classification-15-classes (accessed on 29 April 2025).
Ethics Approval: Not applicable.
Conflicts of Interest: The authors declare no conflicts of interest to report regarding the present study.
References
1. Louis DN, Perry A, Wesseling P, Brat DJ, Cree IA, Figarella-Branger D, et al. The 2021 WHO classification of tumors of the central nervous system: a summary. Neuro-Oncol. 2021;23(8):1231–51. doi:10.1093/neuonc/noab106. [Google Scholar] [PubMed] [CrossRef]
2. The central brain tumor registry of the United States (CBTRUS). [cited 2025 Apr 20]. Available from: https://cbtrus.org/cbtrus-fact-sheet/. [Google Scholar]
3. Martucci M, Russo R, Schimperna F, D’Apolito G, Panfili M, Grimaldi A, et al. Magnetic resonance imaging of primary adult brain tumors: state of the art and future perspectives. Biomedicines. 2023;11(2):364. doi:10.3390/biomedicines11020364. [Google Scholar] [PubMed] [CrossRef]
4. Rastogi D, Johri P, Tiwari V, Elngar AA. Multi-class classification of brain tumour magnetic resonance images using multi-branch network with inception block and five-fold cross validation deep learning framework. Biomed Signal Process Control. 2024;88(5):105602. doi:10.1016/j.bspc.2023.105602. [Google Scholar] [CrossRef]
5. Ravinder M, Saluja G, Allabun S, Alqahtani MS, Abbas M, Othman M, et al. Enhanced brain tumor classification using graph convolutional neural network architecture. Sci Rep. 2023;13(1):14938. doi:10.1038/s41598-023-41407-8. [Google Scholar] [PubMed] [CrossRef]
6. Shi H, Wu X, Li X. Brain tumor classification based on multi-level attention. In: 2023 IEEE 6th International Conference on Electronic Information and Communication Technology (ICEICT); 2023 Jul 21–24; Qingdao, China. doi:10.1109/iceict57916.2023.10245579. [Google Scholar] [CrossRef]
7. Kordemir M, Cevik KK, Bozkurt A. A mask R-CNN approach for detection and classification of brain tumours from MR images. Comput Meth Biomech Biomed Eng Imag Vis. 2024;11(7):2301391. doi:10.1080/21681163.2023.2301391. [Google Scholar] [CrossRef]
8. Mehnatkesh H, Jalali SMJ, Khosravi A, Nahavandi S. An intelligent driven deep residual learning framework for brain tumor classification using MRI images. Expert Syst Appl. 2023;213(7):119087. doi:10.1016/j.eswa.2022.119087. [Google Scholar] [CrossRef]
9. Isunuri BV, Kakarla J. EfficientNet and multi-path convolution with multi-head attention network for brain tumor grade classification. Comput Electr Eng. 2023;108(11):108700. doi:10.1016/j.compeleceng.2023.108700. [Google Scholar] [CrossRef]
10. Sharma AK, Nandal A, Dhaka A, Zhou L, Alhudhaif A, Alenezi F, et al. Brain tumor classification using the modified ResNet50 model based on transfer learning. Biomed Signal Process Control. 2023;86(2):105299. doi:10.1016/j.bspc.2023.105299. [Google Scholar] [CrossRef]
11. Ullah MS, Khan MA, Almujally NA, Alhaisoni M, Akram T, Shabaz M. BrainNet: a fusion assisted novel optimal framework of residual blocks and stacked autoencoders for multimodal brain tumor classification. Sci Rep. 2024;14(1):5895. doi:10.1038/s41598-024-56657-3. [Google Scholar] [PubMed] [CrossRef]
12. Sharif MI, Li JP, Khan MA, Kadry S, Tariq U. M3BTCNet: multi model brain tumor classification using metaheuristic deep neural network features optimization. Neural Comput Appl. 2024;36(1):95–110. doi:10.1007/s00521-022-07204-6. [Google Scholar] [CrossRef]
13. Amarnath A, Al Bataineh A, Hansen JA. Transfer-learning approach for enhanced brain tumor classification in MRI imaging. BioMedInformatics. 2024;4(3):1745–56. doi:10.3390/biomedinformatics4030095. [Google Scholar] [CrossRef]
14. Sharma AK, Verma NK. A novel vision transformer with residual in self-attention for biomedical image classification. arXiv:2306.01594. 2023. doi:10.48550/arxiv.2306.01594. [Google Scholar] [CrossRef]
15. Celik M, Inik O. Development of hybrid models based on deep learning and optimized machine learning algorithms for brain tumor multi-classification. Expert Syst Appl. 2024;238(1):122159. doi:10.1016/j.eswa.2023.122159. [Google Scholar] [CrossRef]
16. Multi-class brain tumor classification using residual network and global average pooling. [cited 2024 Feb 24]. Available from: https://www.researchgate.net/publication/348519549_Multi-class_brain_tumor_classification_using_residual_network_and_global_average_pooling. [Google Scholar]
17. Classification of brain tumors from MRI images using a convolutional neural network. [cited 2024 Feb 24]. Available from: https://www.researchgate.net/publication/339994574_Classification_of_Brain_Tumors_from_MRI_Images_Using_a_Convolutional_Neural_Network. [Google Scholar]
18. Deepak S, Ameer PM. Brain tumor categorization from imbalanced MRI dataset using weighted loss and deep feature fusion. Neurocomputing. 2023;520(2):94–102. doi:10.1016/j.neucom.2022.11.039. [Google Scholar] [CrossRef]
19. Brain Tumor for 14 classes. [cited 2025 Apr 20]. Available from: https://www.kaggle.com/datasets/waseemnagahhenes/brain-tumor-for-14-classes. [Google Scholar]
20. Vaswani A, Shazeer N, Parmar N, Uszkoreit J, Jones L, Gomez AN, et al. Attention is all you need. arXiv:1706.03762. 2023. doi:10.48550/arXiv.1706.03762. [Google Scholar] [CrossRef]
Cite This Article
 Copyright © 2025 The Author(s). Published by Tech Science Press.
This work is licensed under a Creative Commons Attribution 4.0 International License , which permits unrestricted use, distribution, and reproduction in any medium, provided the original work is properly cited.
 Downloads
 Citation Tools