
 Submit a Paper
 Propose a Special lssue
 Open Access
ARTICLE

Innovative Concrete Cube Failure Mode Detection Using Image Processing and Machine Learning for Sustainable Construction Practices
1 E&TC Department, College of Engineering, Indira College of Engineering and Management and Research Scholar at Bharati Vidyapeeth (Deemed to be University), Pune, 411062, India
2 E&TC Department, College of Engineering, E&TC Bharati Vidyapeeth (Deemed to be University), Pune, 411043, India
3 Director, C-Probe Technologies Pvt. Ltd., Pune, 411043, India
* Corresponding Author: Meenakshi S. Patil. Email:
Journal on Artificial Intelligence 2025, 7, 289-300. https://doi.org/10.32604/jai.2025.069500
Received 24 June 2025; Accepted 19 August 2025; Issue published 12 September 2025
 View Full Text
 Download PDF
Abstract
This study seeks to establish a novel, semi-automatic system that utilizes Industry 4.0 principles to effectively determine both acceptable and rejectable concrete cubes with regard to their failure modes, significantly contributing to the dependability of concrete quality evaluations. The study utilizes image processing and machine learning (ML) methods, namely object detection models such as YOLOv8 and Convolutional Neural Networks (CNNs), to evaluate images of concrete cubes. These models are trained and validated on an extensive database of annotated images from real-world and laboratory conditions. Preliminary results indicate a good performance in the classification of concrete cube failure modes. The proposed system accurately identifies cracks, determines the severity of damage to structures, indicating the potential to minimize human errors and discrepancies that might occur through the current techniques to detect the failure mode of concrete cubes. The developed system could significantly improve the reliability of concrete cube assessments, reduce resource wastage, and contribute to more sustainable construction practices. By minimizing material costs and errors, this innovation supports the construction industry’s move towards sustainability.Keywords
Concrete is a fundamental building material, extensively used across various construction projects due to its durability and strength. As the second-most-used substance in the world, after water, concrete’s significance in modern infrastructure cannot be overstated [1,2]. However, ensuring the integrity and reliability of concrete structures necessitates rigorous testing, particularly through the compressive strength test of concrete cubes [3]. The concrete cube test method is used for assessing the compressive strength of concrete. Typically, in this method, a minimum of three cubes of dimension 100 mm × 100 mm × 100 mm is used if the aggregate size is less than 20 mm, and if the aggregate size is more than 20 mm, then three cubes of dimension 150 mm × 150 mm × 150 mm are used. Then the load is applied at the rate of 0–14 N per mm square per minute. According to the IS code, the variation in compressive strength of the cube should not exceed ±15%. Compressive strength of each cube can be calculated by dividing the load by the area of the face (100 × 100 or 150 × 150). These results are crucial in determining the strength of the concrete and whether it is suitable for construction. However, such tests can have unsatisfying failure modes due to multiple reasons such as human errors, the inaccuracy of the machine or the inconsistency of the cube preparation and handling [3].
Based on the style or type of crack, the pattern of damage, and the pattern of failure, the failure modes of concrete cubes can be generally divided into satisfactory and non-satisfactory failure modes. These failure modes provide insight into the quality and properties of the concrete. Satisfactory failure modes indicate that the concrete has behaved as expected under the applied load. These failures are usually characterized by a gradual and uniform fracture. Non-satisfactory failure modes indicate potential issues with the concrete mix, compaction, or curing process. These failures often exhibit irregular or sudden fractures. Figs. 1 and 2 display some samples of the satisfactory and unsatisfactory failures of cube specimen.
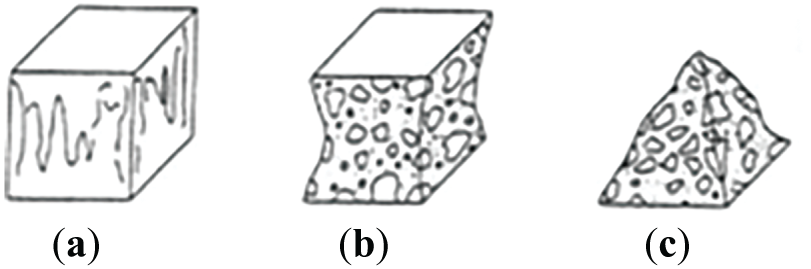
Figure 1: Satisfactory failures mode cube samples. (a) Non-explosive; (b) Semi-explosive shear; (c) Explosive shear
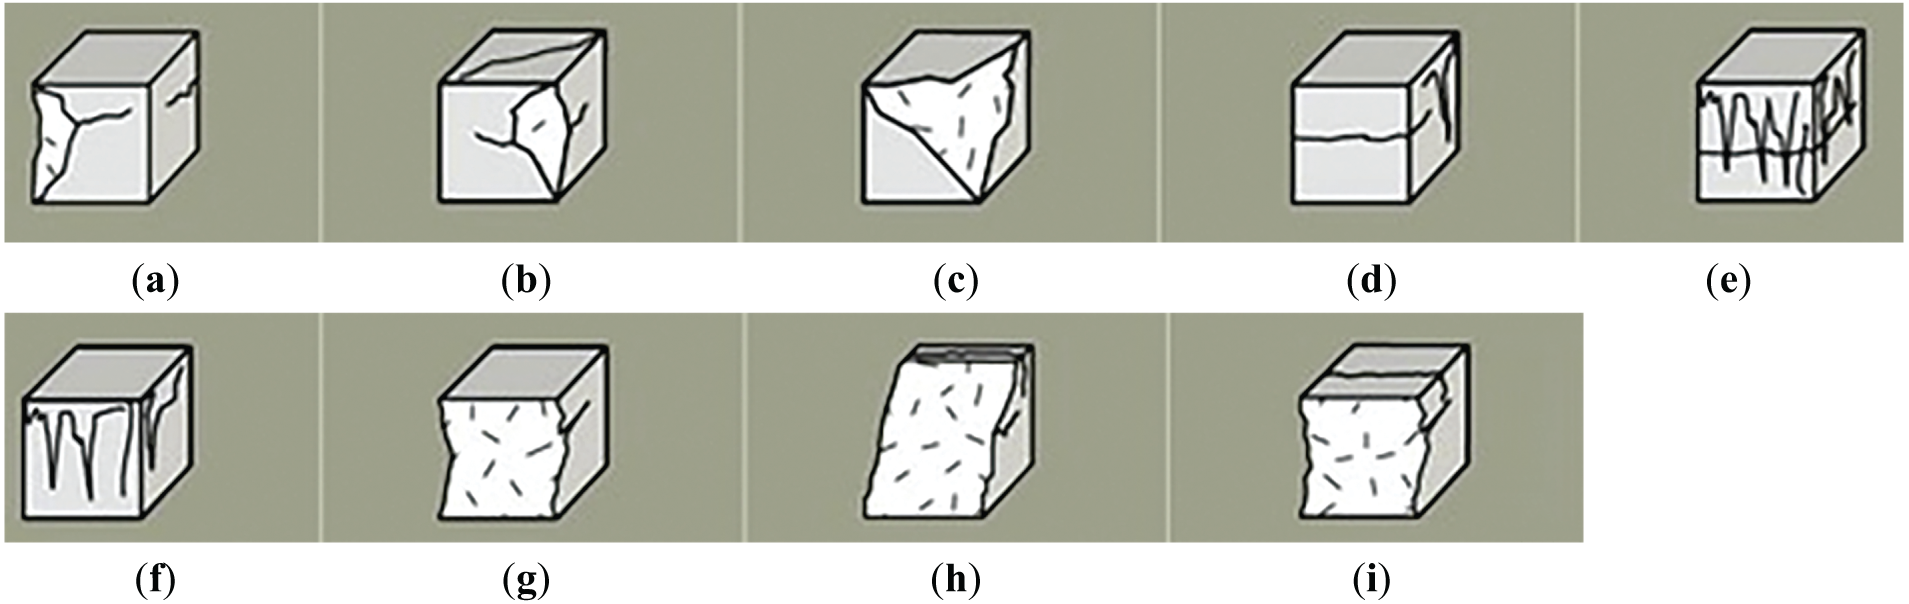
Figure 2: Unsatisfactory failure mode of the cube samples. (a) N1 Edge Tension; (b) N2 Edge Top Ten; (c) N3 Edge Eccentric; (d) N4 Side Tension Ecc; (e) N5 Sides Tension; (f) N6 Ecc; (g) N7 Edge Ecc Tension; (h) N8 Ecc Shear Top Tension; (i) N9 Edge Ecc Top Tension
The failure patterns observed during these tests can be due to a problem with the cube or the cube testing machine. Whenever the concrete cube casting is done, it is necessary that the size of the cube be correct, and it should be a cube only. When the cube attains sufficient strength, then only the demolding of the cube should be done; otherwise, the cube’s corners and edges will be damaged, and it will lead to an unsatisfactory failure mode of the cube. If there is much variation in the size of the cube, then this also leads to an unsatisfactory failure mode of the cube. These discrepancies highlight the need for a more systematic and reliable approach to evaluating concrete cube failures [4]. Recent developments in Industry 4.0 technologies, such as computer vision, image processing, and ML, offer promising solutions for automating and enhancing the concrete cube testing process. This leads to a satisfactory failure mode of the cube. There is extensive research conducted on concrete strength testing and detection of cracks in concrete structures, but very little research has been done on identifying the failure mode of the concrete cube. Nowadays, in the construction field, the concrete cube failure mode detection is not done properly, and if it is done but it is subjective in nature. Current methods rely heavily on manual inspection and subjective judgment, which are prone to errors and inconsistencies. The impact of this is that 80% of cubes are wrongly selected, which leads to higher usage of cement, finally responsible for global warming. This research aims to narrow the gap by developing a semi-automatic system utilizing image processing and ML techniques to objectively identify and categorize concrete cube failure modes.
This study proposes the implementation of an Industry 4.0 solution in the construction field, leveraging advanced technologies to enhance the accuracy and reliability of concrete cube failure mode identification and reduce human intervention. By using both image processing and ML, the system will analyze damage areas, crack patterns, and other relevant features to determine the acceptability of concrete cubes. This innovative approach not only seeks to reduce human error and improve testing accuracy but also ensures a sustainable approach for testing by minimizing cement used, which is associated with high carbon emissions [5].
2 Advancements in Image Processing and ML for Concrete Analysis
In concrete, compressive strength is important for a number of reasons. It is important for all phases of construction as well as the assessment of the technical condition of existing structures [1]. Then, determining the compressive strength offers a more accurate and economic design of existing structures, enabling more buildings to be preserved without structural measures [6]. Cement porosity, water-cement ratio, compaction and curing conditions, aggregate size and mineralogy, and types of stresses and load rate can all affect the strength of concrete [7]. To reduce the incidence of structural failures, in-situ concrete used in building construction should have significant compressive strength [8]. A systematic hybrid machine-learning model based on the firefly algorithm and random forest model to precisely anticipate the compressive strength of concrete was introduced (Pham et al., 2016). In general, the compressive strength of concrete, a predominant construction material, is very important for the sustainability, safety, and load-bearing capacity of concrete structures. As pointed out by Shahrokhinasab et al. [9], manual inspection is laborious, prone to human error, and cannot provide the necessary level of accuracy and consistency. The subjective nature of qualitative data can also result in discrepancies in its interpretation and have an impact on the quality of the assessment [10]. Concrete is one of the main materials used in construction and mustundergo strict testing for strength and durability. The compressive strength test utilizing standard concrete cubes is the most important test in this respect [9]. The results show whether a concrete mix has the necessary strength for loads carried on buildings and other structures, so it’s vital to have accurate information.
2.1 Advancements in Image Processing for Crack Detection
In recent years, there have been many improvements made in image processing techniques identified in the field of construction to analyze various aspects to minimize the failure ratio that results in safety. Researchers have successfully used different techniques in image processing for analyzing the cracks and assessing damage. By using an image-based system, we can remotely assess the area that is inaccessible, and it also reduces human intervention to get the correct record for future analysis. Shahrokhinasab et al. [9] specifically focus on two main crack evaluation approaches: image processing and targeting. While the image processing approach excels in identifying cracks, it sometimes misinterprets surface noise as cracks. Conversely, the targeting approach, while precise in locating cracks, may struggle with accurately determining their exact positions. These limitations underscore the need for more sophisticated techniques.
2.2 ML and Its Application in Concrete Analysis
ML is a component of artificial intelligence that emphasizes developing algorithms and designing models that enable computers to automatically study patterns and make future predictions or decisions without using any separate programming for it. It involves the use of mathematical processing to enable computers to automatically identify similar structures, extract meaningful insights from available data, and improve future predictions. ML algorithms are developed on a large amount of data, which serves as examples or input-output pairs. The algorithms analyze data, identify patterns, and learn from them to make future analyses or take corrective measures when introduced to fresh and unseen data. ML can be used in concrete analysis. Researchers are increasingly exploring the potential of ML algorithms to automate and enhance various aspects of concrete assessment, including failure mode detection [11].
2.3 Industry 4.0 and Its Impact on Construction
Industry 4.0 plays a crucial role in transforming the construction industry, and it is undergoing a transformative phase driven by the principles of Industry 4.0. This leads to automation, data exchange, and interconnected systems to enhance productivity, efficiency, and sustainability. The main part of Industry 4.0 is the integration of advanced technologies like image processing and ML, and it paves a path to a new era in the construction industry [12].
2.4 Research Gap and Objectives
Despite the advancements in image processing and ML, there is still a noticeable gap in the application of automated concrete cube failure mode detection. Even today, no technology has been developed that provides an accurate, objective, and efficient assessment of concrete cube failure mode identification; hence, 80% of the cubes are wrongly selected in the construction industry. By automating this crucial aspect of concrete testing, this research contributes to the developing sector of intelligent construction, promoting sustainability and enhancing the reliability of concrete structures.
This research employs a multi-faceted methodology integrating image processing, ML, and principles of Industry 4.0 to develop a robust system for automated concrete cube failure mode detection. The approach encompasses the following key stages, which are also depicted in Fig. 3.
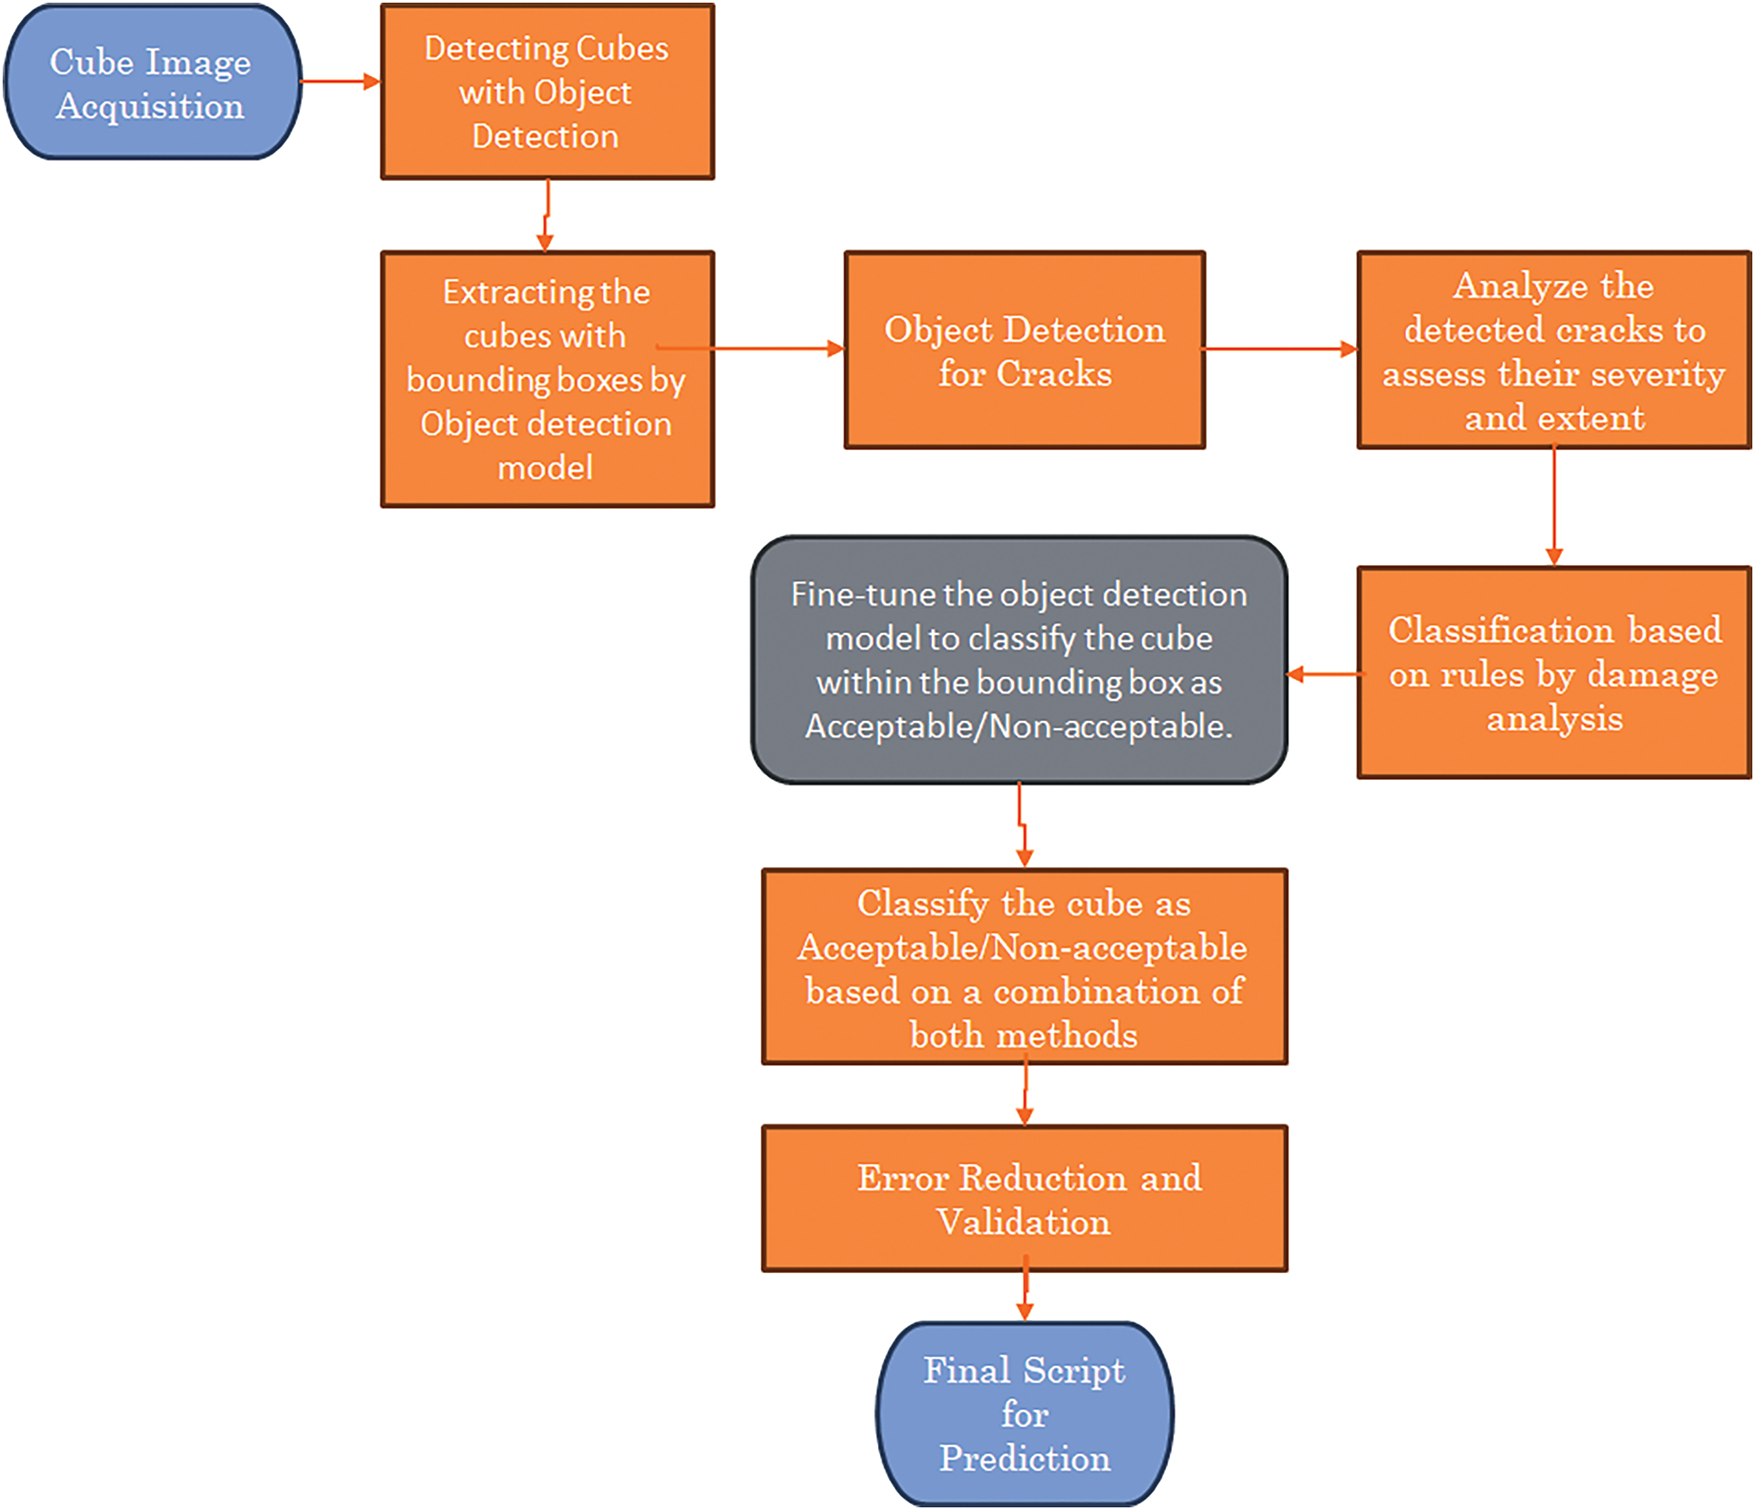
Figure 3: Block diagram
3.1 Data Acquisition and Preparation Detection
A dataset of 1200 concrete cube images is compiled from various construction sites, capturing real-world testing conditions and data augmentation. Each concrete cube is represented by six images, one of each face. By using image augmentation techniques, the dataset images are expanded. The acquired images were meticulously annotated by experienced civil engineering professionals. These annotations clearly delineate whether the cube’s failure mode is satisfactory or non-satisfactory. Further identification of failure modes was based on observed crack patterns and damage areas, with manual annotations conducted according to BS EN 12390-3 standards.
3.2.1 Object Detection for Cube
As the images captured contain some unwanted background images also so it is necessary to extract the cubes from the background image. For this purpose, YOLOv8 (You Only Look Once, version 8) is used for object detection to locate and classify the concrete cubes within the images. This technique results in fast and precise identification of the cube regions, which can be subsequently extracted [13]. This article provides a comprehensive guide to using YOLOv8 for cube detection. The first step is dataset preparation, and it involves gathering the concrete cube images with their bounding boxes standardized to showcase each cube. This is followed by the annotation for image labelling, which is to get a trusted ground truth for the future of model training. One such tool is Labelling, which is often used to draw bounding boxes around the cubes manually and assign a label of “cube” to them. After the data is annotated correctly, it will be divided into train and test sets. This division also allows the model to be trained and then tested on unseen data, to obtain a performance assessment.
The YOLOv8 model was trained on the annotated dataset to enable precise detection and prediction of bounding boxes around each individual cube. YOLO works with a specific process for recognizing the bounding box. First, in the grid creation step, each image is divided into an N × N grid. Now, an object is detected only if the center of the object is found in a grid cell. After that, each grid cell predicts with some confidence scores of its bounding box whether there is an object inside. In addition, at the class probability prediction step, each grid cell computes conditional probabilities for various object classes depending on whether an object is present in that bounding 4 box. The latest version of YOLO, YOLOv8, determines the precise center coordinates (x, y), width (w), and height (h) of each bounding box.
Center Coordinates:
Width and Height:
σ as the sigmoid function mapping values to (0, 1).
Using sigma σ for tx, ty constrains the predicted center offsets to lie within the current grid cell, ensuring stable localization. The symbol e(·) is the exponential function; applying etw and eth guarantees that the predicted width and height are strictly positive and scales them smoothly relative to prior sizes
σ(tx), σ(ty) learn fine offsets placing the predicted box center inside the responsible grid cell that covers the cube; this aligns the box with the visual center of the cube face even when lighting or background varies.
(cx,cy) identify which region of the image (grid cell) is responsible for the prediction, tying localization to a coarse spatial prior.
(pw, ph) encode the typical cube face size in the images.
The exponential scaling etw, eth adjusts these priors to fit each instance, capturing variations due to camera distance, perspective, or partial occlusion.
Together, these components allow the model to produce centred, positive-sized boxes that tightly enclose the cube, which is critical for the downstream crack analysis and failure-mode classification.
3.2.2 Object Detection for Cracks
YOLOv8 was used to detect and classify cracks on concrete cubes, assessing their severity and extent. Key features such as the number of cracks, length, width, and area were extracted. The next step was to determine if the cube’s failure mode was acceptable. If cracks or damage appeared on the top and bottom faces, the cube was classified as non-acceptable with references to IS 516:1959 or BS EN 12390-3 standards, and cracks on load application faces indicate structural integrity compromise. If these faces were smooth and all four side faces had a similar crack pattern, it was considered acceptable. Otherwise, the cube was deemed unacceptable. To ensure accurate detection, the Intersection over Union (IoU) metric was used to evaluate the overlap between predicted and actual bounding boxes by calculating their intersection and union, with IoU measured as their ratio [14,15].
IoU quantifies the accuracy of a predicted bounding box relative to the ground truth. An IoU of 1 indicates a perfect overlap, while an IoU of 0 means no overlap. Generally, IoU > 0.5 is considered a good prediction. In evaluation metrics like Mean Average Precision (mAP), a detection is deemed correct if its IoU surpasses a set threshold, typically 0.5.
4.1 Various Matrices and Loss Function
Fig. 4 illustrates various metrics and loss functions during the training and validation phases of an ML model related to object detection for a concrete cube.
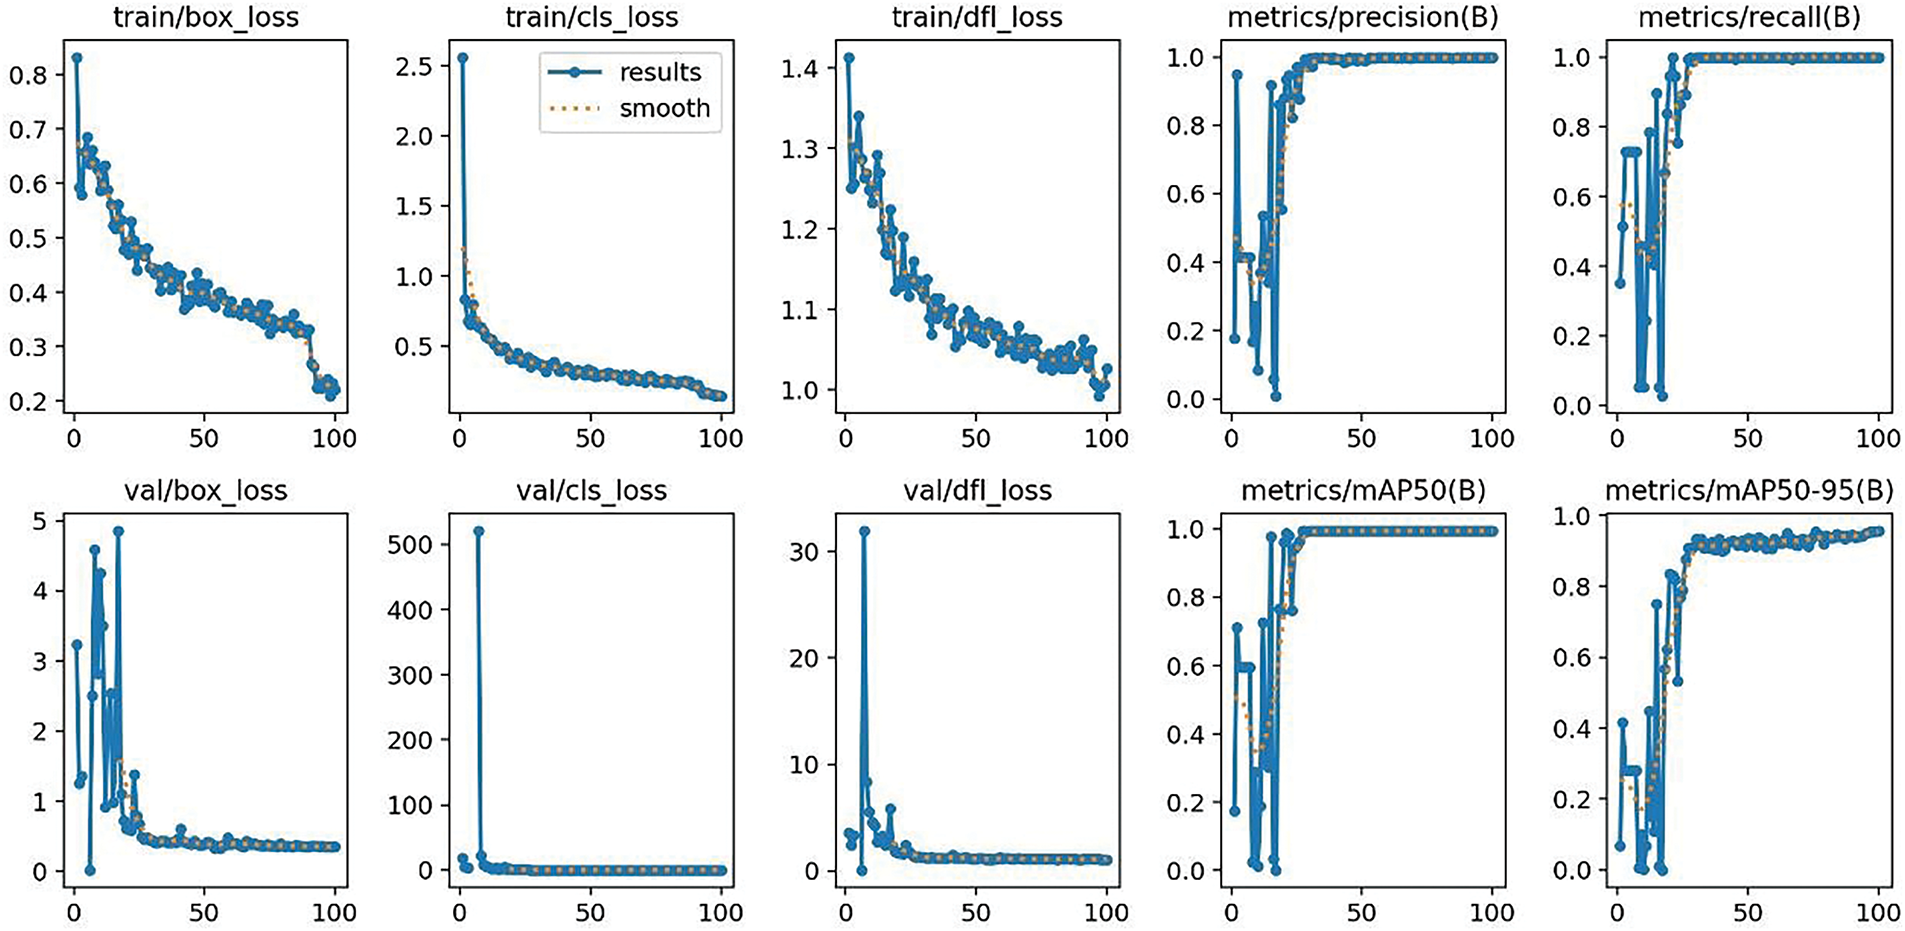
Figure 4: Various metrics and loss functions
Training Losses:
During training, different loss metrics help evaluate the model’s learning progress. The train/box_loss graph tracks the regression loss for bounding box prediction. Initially high at 0.8, the loss steadily decreases to 0.2 by epoch 100, indicating improved accuracy in bounding box predictions. The train/cls_loss graph represents classification loss, which starts at 2.5 and drops significantly to 0.1 by epoch 100, reflecting enhanced classification accuracy. The train/dfl_loss curve corresponds to a loss used for distribution focal loss or an equivalent metric. It starts at 1.4 and goes down to 0.8 at epoch 100, indicating good model improvement during training.
Metrics:
The model precision on the metrics/precision(B) graph shows the precision of the model during training. Precision is low initially, but rises quickly and plateaus around 1.0, which shows that the model is very accurate in predicting the positive class and makes few false positive errors. Once again, the metrics/recall(B) graph follows recall; we start with a low level of recall, but we achieve a very high level that stabilizes around 0.9. This indicates that the model is able to detect a large portion of all the relevant examples, exhibiting good detection performance.
Validation Losses:
The val/box_loss graph is apparently more fluctuating than the training loss, but the trend is that the loss decays from 5 to 1, so the model seems to generalize well to temperature variance. The val/cls_loss graph follows the validation classification loss, which, although really high (>500) at first, falls and stabilizes at about 1.0, indicating a considerable improvement in classification accuracy! The val/dfl_loss graph means validation distribution focal loss as well. Starting at a rather high score of 30, it shows a very quick fall and a stabilization around 1.0, showing a decent improvement in model performance.
Validation Metrics:
Validation mean Average Precision (mAP) at 50% intersection over union (IoU) threshold. It quickly ascends and stabilizes at ~1.0, suggesting very good performance in terms of precision and recall at this threshold. The second graph (metrics/mAP50-95(B) shows the mean Average Precision averaged between IoU thresholds between 50% and 95%. It increases evenly and plateaus around 0.8, indicating a good performance in various levels of IoU, thus showing the capability of this model in detecting objects with more or less precise overlap.
It can be seen that the training and validation losses (box_loss, cls_loss, and dfl_loss) are substantially reduced, and the model is learning to adapt and generalize well. For precision, recall, and mAP metrics (including mAP50), the values are hovering around 1.0 for precision and mAP50 and approximately 0.9 for recall, indicating that the model has excellent accuracy and robustness. The training seemed to work well since the losses are decreasing and performance metrics are on the rise, indicating the model is well-trained to predict properly.
4.2 Confusion Matrix for Cube and Background Classification
As shown in Fig. 5, the confusion matrix indicates no True Negatives (TN) for the “background” class. This outcome is a direct result of the test dataset composition, which, in its current form, contains only images with concrete cubes as the primary objects of interest and does not include negative samples representing diverse backgrounds without cubes. Consequently, while the model demonstrated perfect detection of cube instances (100% precision and recall for the “cube” class), it was not exposed to pure background scenarios during testing, making it impossible to compute TN for the “background” category. To address this limitation and to better evaluate the robustness and generalization of the detection model, we plan to expand the dataset in future work to incorporate varied background scenes. These will include laboratory tables, testing machines without cubes, and outdoor construction-site settings with partial occlusions and background clutter. Such additions will enable a more realistic performance evaluation for both classes and help identify any tendency of the model to generate false positives in complex, real-world environments.
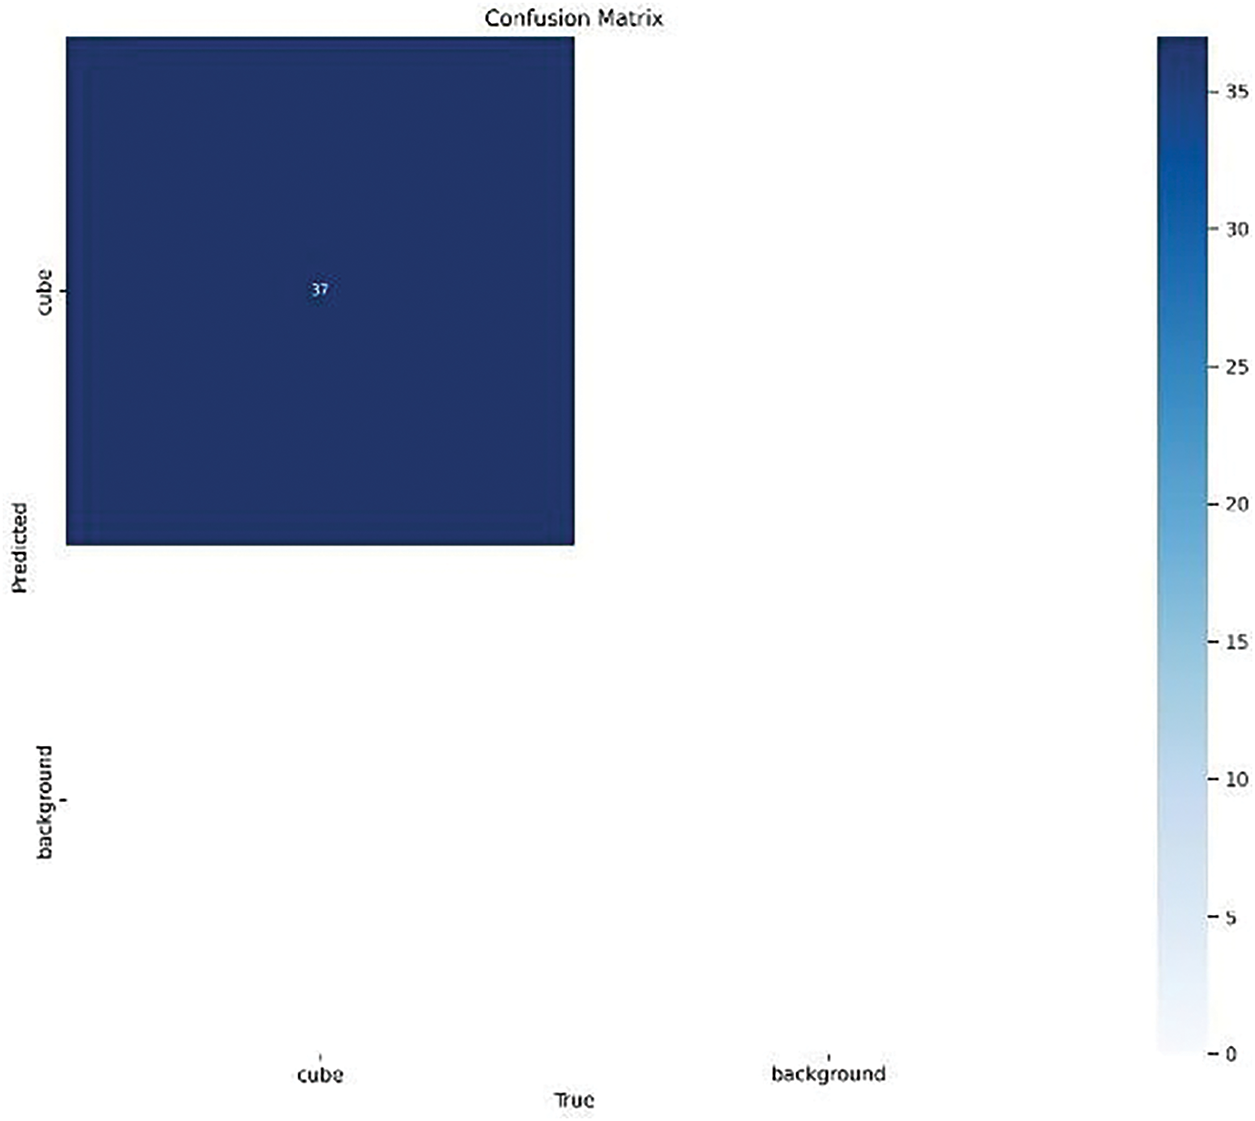
Figure 5: Confusion matrix
4.3 Precision and Recall for Cube Detection
The relationship between precision and recall for the “cube” class is shown in Fig. 6 in terms of a Precision-Recall Curve. Precision measures the proportion of positively predicted cases that are correctly predicted (true positives) among all the positive predicted cases (true positives and false positives). It measures the probability that the model’s positive classifications are correct. Recall, in contrast, is the ratio of true positive predictions to all actual positives (true positives and false negatives) and measures how well our model can find all relevant cases. The curve helps to evaluate the trade-off between precision and recall, giving an idea of how well the model can identify the “cube” class.
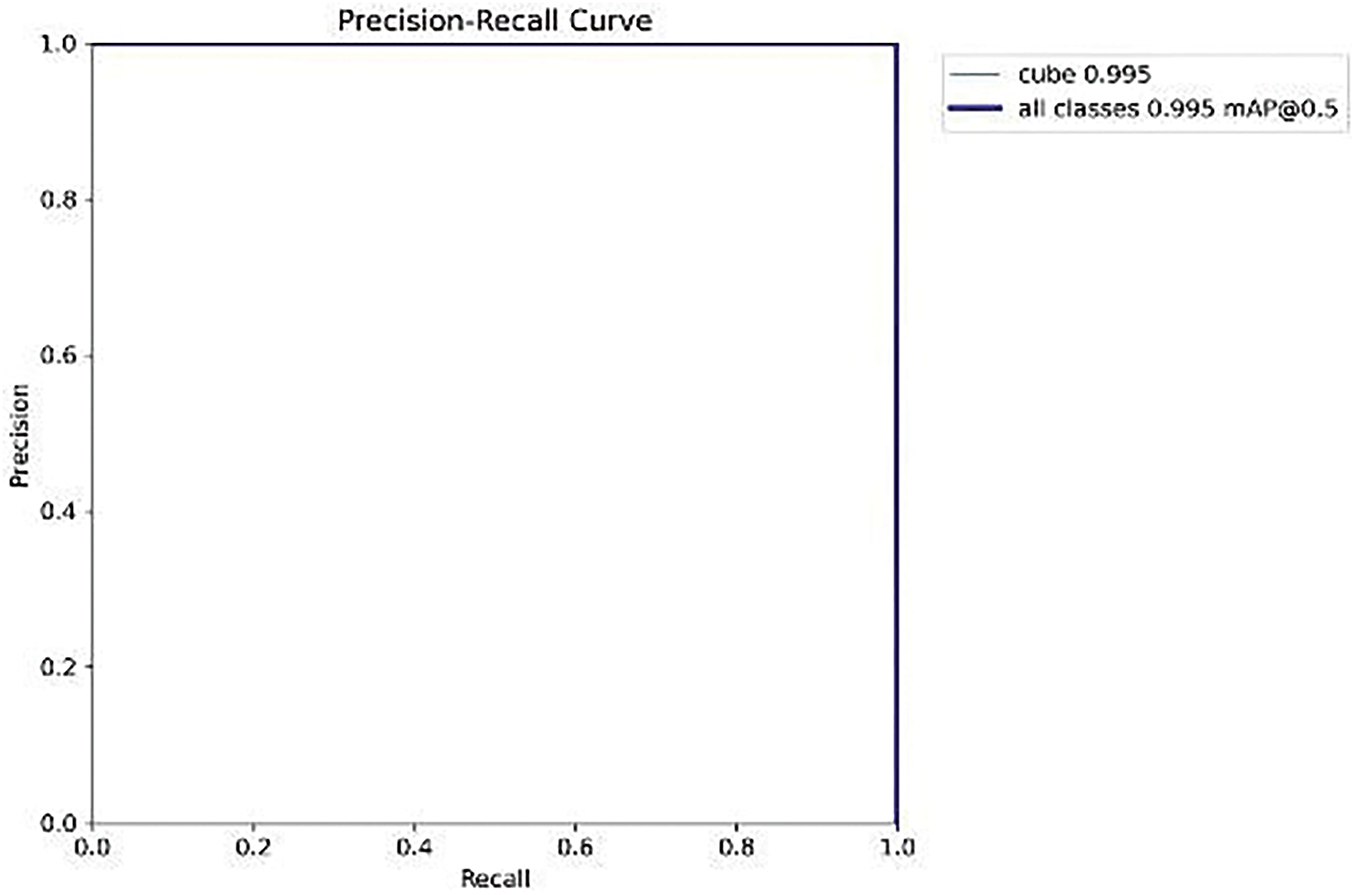
Figure 6: Precision-recall curve
The Precision-Recall Curve indicates this model has extremely high accuracy in recognizing the “cube” class. The curve is almost always near 1.0 in this case, meaning the model gets its positive predictions right almost all of the time (high precision). Moreover, the model has a recall of 1.0 for the “cube” class, which means it identifies all instances of cube without missing any. 0.995 mAP on “cube” class and overall, 0.995 mAP at IoU threshold 0.5 indicates the model’s excellent ability to detect and classify cubes. This curve illustrates the good precision and recall of the model, with no false negative predictions and only a few false positives. Thus, the model presents a highly reliable prediction of instances of ‘cube’ in the images.
4.4 Training and Validation Metrics of a Crack Detection Model
As evidenced by graphs in Fig. 7, the crack detection model is learning over time evidenced by lower losses and higher precision, recall, and mean Average Precision scores. The training and validation metrics show consistent behaviour, indicating that the model generalizes well to unseen data and is not overfit. These increases in mAP50 and mAP50-95 are especially promising, as they demonstrate consistent performance at varying levels of intersection-over-union.
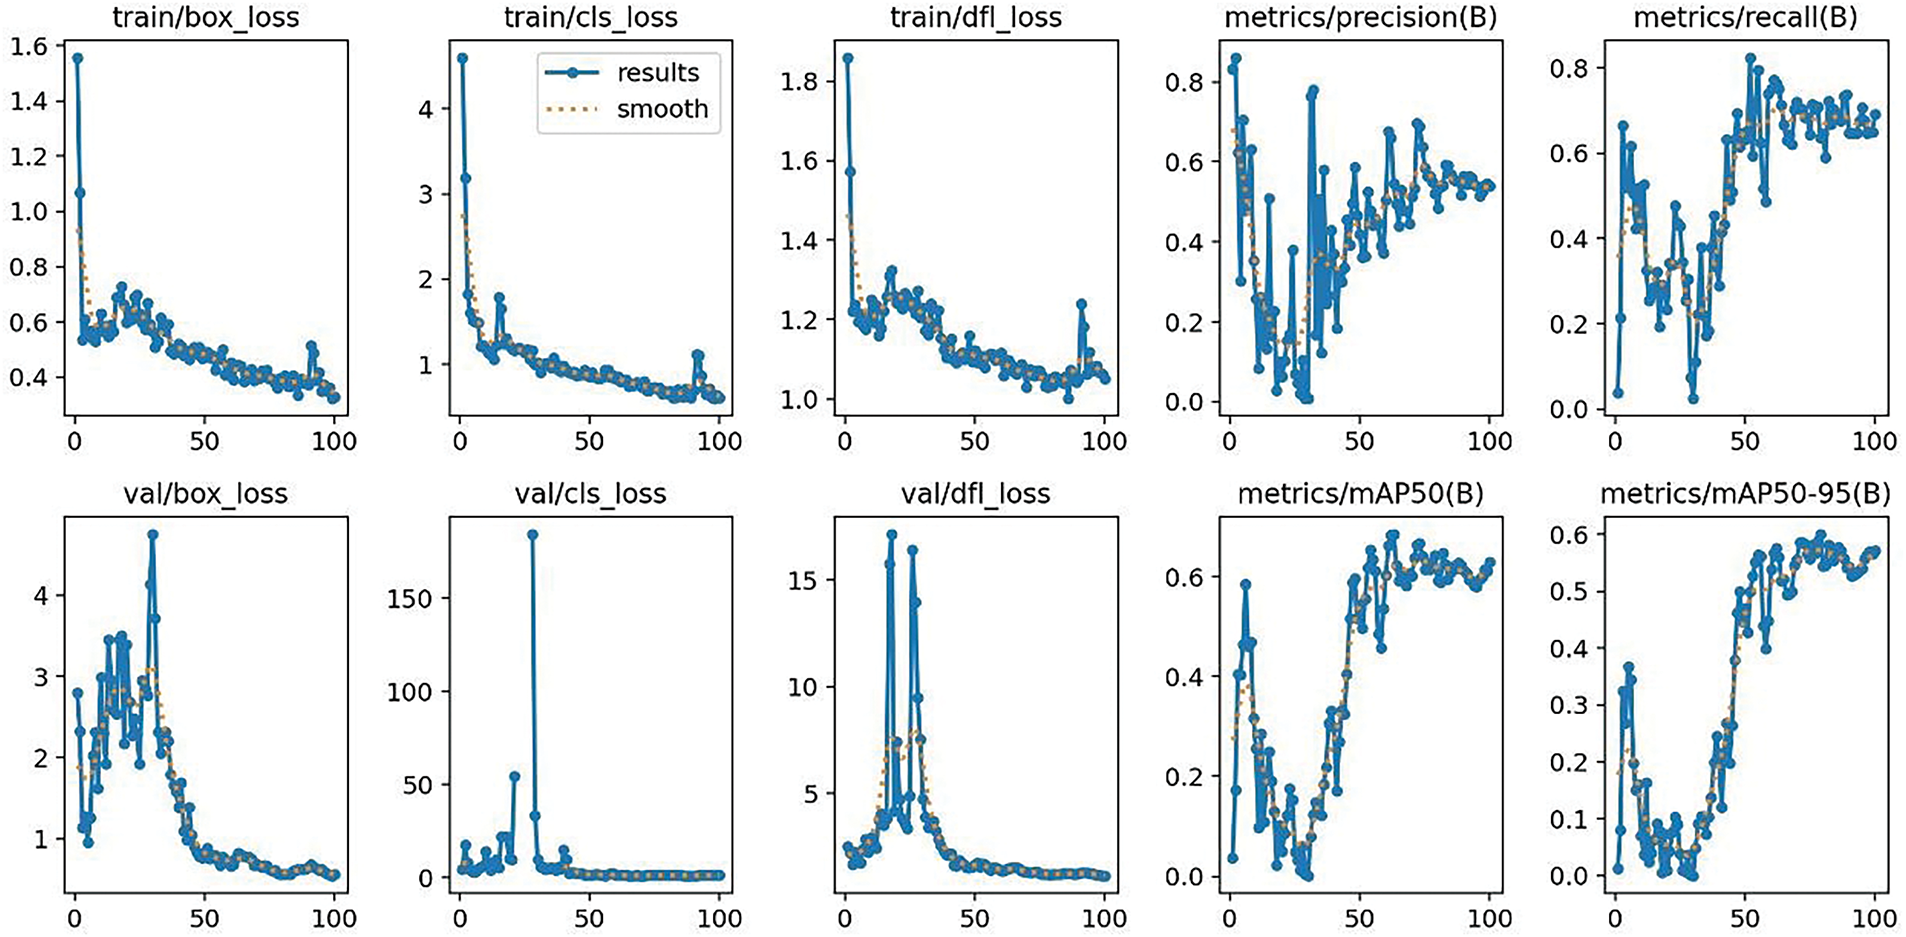
Figure 7: Training and validation metrics
4.5 Precision-Recall (PR) Curve for Crack Detection Model
This metric is the mean Average Precision (mAP) over all classes at IoU = 0.5. The metrics are also calculated over the entire dataset, which means that the curve integrates how it performs in detecting cracks, cracked surfaces, and smooth surfaces. The curve shape in Fig. 8 suggests that some of these classes perform better than others. There is a precision-recall trade-off for all classes. A common trend in classification problems is that as recall increases, precision goes down, and vice versa. The model detects the smooth surface the most, the inflated surface the second most, and cracks with the least amount of success. The mAPs for smooth surfaces show high scores because they are well distinguished from other classes, whereas cracks are more difficult to detect as they are not always captured at the image level.
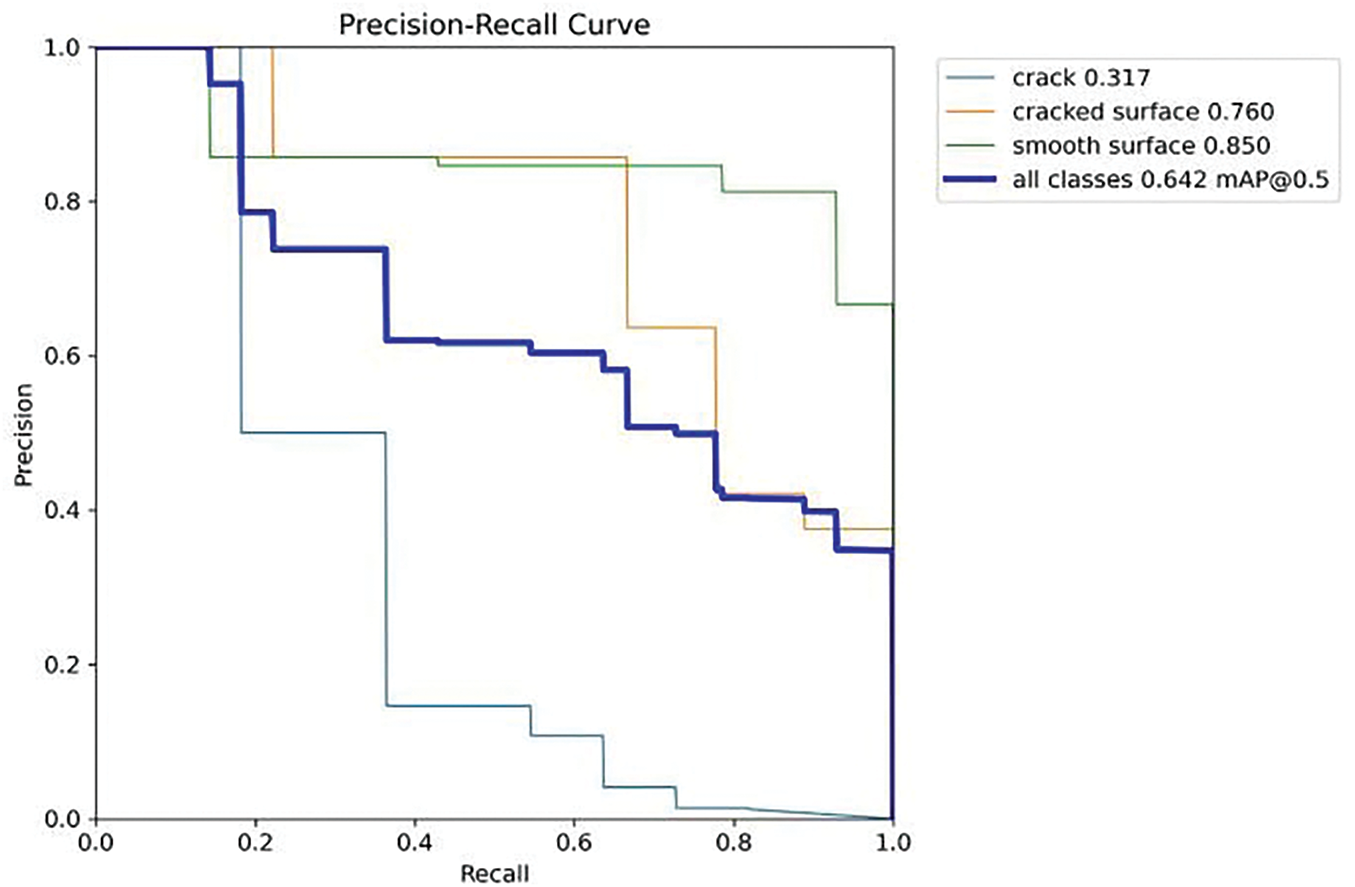
Figure 8: Precision-Recall (PR) curve for a crack detection model
The Precision-Recall curve helps reveal moments in which the crack detection model excels, as well as moments in which it needs improvement, across the classes. The model performs well in detecting smooth surfaces and cracked surfaces, but lags behind in detecting individual cracks. Our overall mAP of 0.642 shows promising but improvable performance in crack detection.
While the model achieved excellent performance in cube detection (mAP = 0.995), the overall mAP for crack detection is relatively lower at 0.642. This discrepancy can be attributed to several factors. First, fine cracks on concrete cube surfaces may not be captured clearly in the dataset images due to camera resolution limitations and compression artifacts. Second, lighting conditions and shadows during image acquisition can obscure or exaggerate surface features, making accurate crack localization more challenging. Third, class imbalance between “smooth surface” and “crack” classes may bias the model towards the more prevalent class, reducing recall for fine cracks.
The results from this study showed how the YOLOv8 model was able to automate the detection and classification of failure modes of a concrete cube into satisfactory or non-satisfactory classes. The performance of the model was evaluated through Intersection over Union (IoU) for object detection and precision, recall, and F1-score for classification, demonstrating the strong ability of the model in accurately identifying and categorizing concrete cube failure modes according to the pattern of crack. We evaluated the implementation of the approach in the real-time processing of concrete cube assessment, which has been successfully implemented. Not only did this increase robustness, but it also sped up the evaluation process and thus ensured the quality of a scalable solution. However, difficulties were faced, especially in the dataset collection. Because cubes are often wrongly categorized under a zero failure mode in the construction industry, acceptable images of cube failures are usually challenging to track down in the database. Likewise, how the data was captured, including lighting conditions, cube positioning, and background noise, impacted detection accuracy. Overlapping or indistinct damage created difficulties for accurate classification in more complicated crack patterns. The systematic collection of weather data will be done in the future, and data quality can be improved, as well as feature extraction algorithms and classification algorithms. Such advancements pave the path for a more robust research domain that applies deep learning in structural engineering, specifically for concrete, and will ultimately influence the entire field of structural engineering as we know it.
Acknowledgement: The authors thank C-Probe Technologies Pvt. Ltd. for support in analyzing the concrete cubes as acceptable and non-acceptable and for providing the dataset and authentication.
Funding Statement: The authors received no specific funding for this study.
Author Contributions: Meenakshi S. Patil—Conceptualization, writing, methodology; Rajesh B. Ghongade—Supervision, review; Hemant B. Dhonde—Industry support, validation. All authors reviewed the results and approved the final version of the manuscript.
Availability of Data and Materials: The data that support the findings of this study are available from the Corresponding Author, Meenakshi S. Patil, upon reasonable request.
Ethics Approval: Not applicable.
Conflicts of Interest: The authors declare no conflicts of interest to report regarding the present study.
References
1. Sadouskaya A, Leanovich S, Budrevich N, Polonina E. The compressive strength of steel fibre reinforced concrete obtained by testing cubes and cylinders. EDP Sci. 2021;350:00008. doi:10.1051/matecconf/202135000008. [Google Scholar] [CrossRef]
2. Girma M, Demiss BA. Fresh, mechanical, and microstructural properties investigation on the combined effect of biomedical waste incinerator ash and bagasse ash for high-strength concrete. Adv Mater Sci Eng. 2022;2022:5685372. doi:10.1155/2022/5685372. [Google Scholar] [CrossRef]
3. Kim J, Cho Y, Lee J, Kim YH. Defect detection and characterization in concrete based on FEM and ultrasonic techniques. Materials. 2022;15:8160. doi:10.3390/ma15228160. [Google Scholar] [PubMed] [CrossRef]
4. Halstead PE. The significance of concrete cube tests. Mag Concr Res. 1969;21:187–94. doi:10.1680/macr.1969.21.69.187. [Google Scholar] [CrossRef]
5. Downey A, D’Alessandro A, Ubertini F, Laflamme S. Automated crack detection in conductive smart-concrete structures using a resistor mesh model. Meas Sci Technol. 2018;29:035107. doi:10.1088/1361-6501/aa9fb8. [Google Scholar] [CrossRef]
6. Mukhopadhyay T, Naskar S, Dey S, Chakrabarti A. Condition assessment and strengthening of aged structures: perspectives based on a critical case study. Pract Period Struct Des Constr. 2019;24(3):05019003. doi:10.1061/(ASCE)SC.1943-5576.0000431. [Google Scholar] [CrossRef]
7. Chong FY, An YN, Wang P. Research on factors affecting reinforced concrete durability. Adv Mater Res. 2014;898:403–6. doi:10.4028/www.scientific.net/AMR.898.403. [Google Scholar] [CrossRef]
8. Wang S, Cheng X, Li Y, Song X, Guo R, Zhang H, et al. Rapid visual simulation of the progressive collapse of regular reinforced concrete frame structures based on machine learning and physics engine. Eng Struct. 2023;286:116129. doi:10.1016/j.engstruct.2023.116129. [Google Scholar] [CrossRef]
9. Shahrokhinasab E, Hosseinzadeh N, Monirabbasi A, Torkaman S. Performance of image-based crack detection systems in concrete structures. J Soft Comput Civ Eng. 2020;4:127–39. [Google Scholar]
10. Patil MS, Ghongade RB, Dhonde HB. Concrete cube crack detection using machine learning and image processing. In: 2024 5th IEEE Global Conference for Advancement in Technology (GCAT); 2024 Oct 4–6. Bangalore, India. doi:10.1109/GCAT62922.2024.10924086. [Google Scholar] [CrossRef]
11. Taffese WZ, Sistonen E. Machine learning for durability and service-life assessment of reinforced concrete structures: recent advances and future directions. Autom Constr. 2017;77:1–14. doi:10.1016/j.autcon.2017.01.016. [Google Scholar] [CrossRef]
12. Shafei H, Radzi AR, Algahtany M, Rahman RA. Construction 4.0 technologies and decision-making: a systematic review and gap analysis. Buildings. 2022;12:2206. doi:10.3390/buildings12122206. [Google Scholar] [CrossRef]
13. Del Savio AA, Luna Torres A, Cárdenas Salas D, Vergara Olivera MA, Urday Ibarra GT. Detection and evaluation of construction cracks through image analysis using computer vision. Appl Sci. 2023;13:9662. doi:10.3390/app13179662. [Google Scholar] [CrossRef]
14. Ding J, Xue N, Xia GS, Bai X, Yang W, Yang MY, et al. Object detection in aerial images: a large-scale benchmark and challenges. IEEE Trans Pattern Anal Mach Intell. 2021;44(11):7778–96. doi:10.1109/TPAMI.2021.3117983. [Google Scholar] [PubMed] [CrossRef]
15. Rajesh S, Jinesh Babu KS, Chengathir Selvi M, Chellapandian M. Automated surface crack identification of reinforced concrete members using an improved YOLOv4-tiny-based crack detection model. Buildings. 2024;14(11):3402. doi:10.3390/buildings14113402. [Google Scholar] [CrossRef]
Cite This Article
 Copyright © 2025 The Author(s). Published by Tech Science Press.
This work is licensed under a Creative Commons Attribution 4.0 International License , which permits unrestricted use, distribution, and reproduction in any medium, provided the original work is properly cited.
 Downloads
 Citation Tools