
 Submit a Paper
 Propose a Special lssue
 Open Access
ARTICLE

Two-Stage Location Method for TCSC Considering Transmission Congestion Alleviating Coherence
School of Electric Power Engineering, School of Shenguorong, Nanjing Institute of Technology, Nanjing, 211167, China
* Corresponding Author: Fan Chen. Email:
Journal on Artificial Intelligence 2025, 7, 365-380. https://doi.org/10.32604/jai.2025.069903
Received 02 July 2025; Accepted 10 September 2025; Issue published 06 October 2025
 View Full Text
 Download PDF
Abstract
The Thyristor-Controlled Series Compensator (TCSC) presents an effective solution for mitigating transmission congestion in power systems by regulating the distribution of line power flow. However, inherent faults within the TCSC may lead to an unintended intensification of transmission congestion in other sections of the system post-installation, resulting in non-coherent phenomena of line blocking. In response to this challenge, this paper introduces a novel two-stage site selection method for TCSC, emphasizing the enhancement of coherence in addressing line-blocking issues. Through rigorous non-coherent verification, this method mitigates the risk of line congestion deterioration due to TCSC faults. In the initial stage of the proposed method, TCSC faults are not considered during the extraction of system states. System state analysis is performed based on the TCSC site selection model, aiming to minimize system load reduction. The preliminary recommended installation position for TCSC is determined by sorting the frequency of TCSC installation occurrences on lines extracted from the analyzed system states. In the subsequent stage, accounting for the influence of TCSC faults on line faults, system operating states are extracted. Line and system congestion indices are calculated through the statistical analysis of the system state analysis results. The installation of TCSC at the preliminary position is scrutinized to identify non-coherent phenomena of line congestion on other lines. If such phenomena are observed, the installation position is excluded, and the TCSC site selection process is reinitiated based on the methodology from the first stage. To validate the effectiveness of the proposed method, a case study is conducted on a modified RBTS test system. The case study results indicate that, compared with TCSC siting schemes that do not consider transmission congestion non-coherency, the proposed non-coherency-based siting scheme reduces the system congestion expectation (SCE) and system congestion probability (SCP) by 17.7% and 11.4%, respectively, while lowering the LOLP and EENS by 2.56% and 4.55%, respectively. These results demonstrate that the proposed method can effectively alleviate transmission congestion and enhance the overall reliability of the system.Keywords
With the development of the economy and changes in national energy policies, the electricity system load and various forms of renewable energy continue to increase. When the construction of the transmission network fails to meet demand, the electricity system may experience line blocking [1], which refers to the restriction of electric current flow caused by transmission capacity limits and consequently affects the stable operation of the power grid. However, the reliability and security of the electricity system have always been a top priority, and transmission congestion exacerbates the power supply crisis and poses a threat to the electricity system [2]. Therefore, it is of great significance to alleviate transmission congestion and improve the service life and operational flexibility of the power grid in emergency situations.
Measures to alleviate transmission congestion can be considered from two aspects: expanding line capacity and improving the utilization of existing lines. In terms of expanding line capacity, reference [3] has expanded the transmission capacity of existing lines by constructing new transmission lines, thereby alleviating the transmission congestion caused by the integration of renewable energy. Reference [4] proposes a multi-objective optimization framework that takes into account the perspectives of both energy storage system owners and system operators in congestion management. By simultaneously constructing new transmission lines and installing energy storage devices, the transmission capacity is expanded to mitigate transmission congestion. However, expansion measures such as building new transmission lines may be constrained by transmission corridors and environmental protection issues. On the other hand, reference [5] presents a stochastic scheduling method that flexibly adjusts the reserved spare capacity of transmission lines based on the actual operating conditions of the system, ensuring that the lines have sufficient transmission capacity to cope with various system operating states, thus maximizing the alleviation of transmission congestion. Reference [6] enhances the available transmission capacity by installing various Flexible Alternating Current Transmission Systems (FACTS) devices, indirectly mitigating transmission congestion. Thyristor Controlled Series Capacitor (TCSC) is a series-type FACTS device with a simple topology of the main circuit, requiring no interface equipment such as high-voltage transformers. It can be easily retrofitted to existing conventional series compensation stations, providing good economic benefits. Moreover, TCSC can quickly and flexibly switch between capacitive and inductive characteristics [7], making it suitable for controlling power flow in the system to alleviate transmission congestion.
The ability of TCSC to alleviate transmission congestion is closely related to its installation location. If the installation location is not appropriate, it will reduce the transmission capacity of the system [8]. Therefore, to maximize the use of TCSC to improve the ability to alleviate transmission congestion, it is necessary to determine the appropriate installation location. Reference [9] uses actual power flow and sensitivity indices to determine the optimal installation location of FACTS devices such as TCSC, and uses a combination of FACTS devices and congestion management methods to alleviate transmission congestion. Reference [10] selected the installation location of FACTS components such as TCSC by solving a mixed-integer nonlinear programming location model and uses the flow control ability of FACTS components such as TCSC to alleviate transmission congestion in the system. Reference [11] proposed a two-stage stochastic optimization model and uses the model to determine the optimal installation location of TCSC and uses TCSC to reduce transmission congestion and wind curtailment caused by congestion. Although references [9–11] selected the installation location of TCSC through different models and processing methods, they all assume that TCSC is completely reliable, and do not pay attention to the impact of TCSC component failure on the system and lines. The power system has non-homogeneous phenomena [12,13], that is, adding (removing) components will reduce (increase) the reliability of the system. Therefore, the newly added TCSC component may reduce the reliability of some lines in the system due to its own failure, thereby reducing the transmission capacity of the system and ultimately causing congestion. Regarding the impact of investment component failures such as TCSC on the transmission capacity of the system: Reference [14] studied the non-homogeneous phenomena of parallel multi-line transmission capacity, and the research results showed that due to the random failure of components such as lines and circuit breakers, the transmission capacity of three-line transmission in some cases is lower than that of two-line transmission. Reference [15] studied the impact of TCSC and its bypass circuit breaker failures on reliability non-coherent phenomena from the perspective of transmission capacity and system reliability of TCSC-installed lines. The so-called non-coherent phenomenon of system reliability refers to a situation in which the installation of additional components fails to enhance overall system reliability [16]. As a FACTS device, the TCSC is intended to increase transmission capability and mitigate line blocking. Nevertheless, its inherent failure rate and the choice of installation location may lead to unintended consequences: while alleviating power blocking on the targeted line, it can simultaneously exacerbate power blocking on other lines [17,18], leading to the emergence of Non-Coherent Blocking Phenomena, which ultimately diminishes the transmission capability of the system.
To address the above issue, this paper proposes a two-stage location method that considers TCSC component failures and the impact of TCSC access on the transmission capacity of all lines. The non-homogeneous phenomena caused by TCSC failures are considered as a necessary factor in selecting suitable installation locations based on traditional location results. In the first stage, ignoring the impact of TCSC failures, the TCSC installation location that minimizes the load reduction caused by congestion is selected based on the TCSC location model under different system states, and the line with the highest occurrence frequency is selected as the preliminary location. In the second stage, TCSC components are installed at the determined preliminary location, and it is verified whether TCSC failures will cause non-homogeneous phenomena that worsen congestion on the lines. If this occurs, the location is excluded and re-selected until non-homogeneous phenomena no longer occur, and the final installation location is determined.
2 TCSC Location Model Based on Minimum System Load Reduction
TCSC has the capability to alleviate the congestion of transmission lines and the overall system. However, the occurrence of faults in TCSC may increase the probability of lines being taken out of service, resulting in an increased burden on other lines to handle the transmission tasks. This could lead to a non-coherence degradation phenomenon where other lines may experience worsened congestion. To ensure that TCSC effectively mitigates congestion on transmission lines without exacerbating congestion on other lines, a two-stage siting approach, taking into account the synchronous phenomenon, is proposed to determine the installation location of TCSC. In the first stage, a siting model is established without considering TCSC faults. The optimal installation location of TCSC is then solved for different system states, with the most frequently occurring location identified as the preliminary position. In the second stage, the im-pact of TCSC faults on the identified preliminary location is assessed. If a non-coherence phenomenon is detected, the location is excluded and the siting process is repeated; otherwise, the location is confirmed as the final installation site.
In the first stage, the TCSC siting model is established based on the direct current power flow load reduction model [19], with the objective of minimizing the load shed-ding resulting from transmission congestion. Its objective function is:
where
The power balance constraint is:
where
The line flow constraint is:
where
The generator output constraint is:
where
The load reduction constraint is:
The transmission capacity constraint for the line is:
where
The TCSC control parameter constraints are:
where
The installation location constraints for TCSC are:
where
3 Two-Stage Siting Method of TCSC Considering Coherence of Line Congestion Improvement
When the line flow exceeds the maximum rated capacity of the line, it indicates that the line is blocked [20]. TCSC can improve the transmission capacity of the transmission line and the transmission congestion of the system. However, the access of TCSC may lead to the aggravation of the blocking phenomenon of some lines, that is, the phenomenon of blocking improvement non-coherence. This is mainly because TCSC itself has a certain failure rate, which increases the fault probability of the line installed with TCSC. When the installed line transmits a large amount of load, the increase of the fault probability of the installed line will increase the probability of blocking other lines, and the blocking indicators of some lines may be non-coherent.
Due to inherent faults in TCSC, the failure rate of the lines equipped with TCSC increases. To assess the occurrence of non-coherent phenomena in line blocking indicators, it is necessary to extract multiple system states for state analysis under the condition of fixed TCSC installation positions, enabling the statistical analysis of the blocking probability indicators for each line. Therefore, the research approach of this paper involves a two-stage process to determine the TCSC location. In the first stage, TCSC faults are not considered, and the preliminary installation position is determined through the TCSC location model. Subsequently, in the second stage, TCSC faults are taken into account, and the system is examined for the occurrence of non-coherent phenomena after TCSC is installed at the preliminary location. If no non-coherent phenomena occur, the previously selected TCSC location is confirmed as the final installation position. Otherwise, the initially selected installation position is excluded.
3.1 Stage One: Selection of Preliminary TCSC Installation Location
In this study, the non-sequential Monte Carlo method is employed to sample component states, forming the system states. With the sampled system states, the TCSC siting model is solved. The preliminary installation location is determined by selecting the position that occurs most frequently across all states. The specific steps are as follows:
Step 1: Input parameters for the power transmission system and reliability, including network topology parameters, electrical parameters of generators and lines, load parameters, and parameters for generator unavailability.
Step 2: Determine the search scope for TCSC installation lines.
Step 3: Utilize the non-sequential Monte Carlo method [21] to extract system states, encompassing the states of generators and transmission lines.
Step 4: Calculate line flows.
Step 5: Determine the presence of transmission congestion; if present, proceed to Step 6. Otherwise, move to Step 9.
Step 6: Perform optimal load reduction optimization without considering TCSC component integration. This involves solving the optimal load reduction model in the TCSC siting model, ignoring TCSC control parameter constraints and TCSC installation location constraints.
Step 7: Assess whether the system experiences load reduction. If so, proceed to Step 8; otherwise, move to Step 9.
Step 8: Solving the TCSC site selection model involves determining the optimal installation location for TCSC and documenting the geographical coordinates of the selected location on the transmission line.
Step 9: Check if the system sampling is complete. If yes, proceed to Step 10; otherwise, return to Step 3.
Step 10: Aggregate statistics on the occurrence of TCSC installation lines.
Both line flow calculation and optimal load reduction optimization are based on the direct current power flow reduction model. Once all the installation lines have been statistically determined across all states, select the line with the highest frequency of occurrence as the preliminary installation line. After installing TCSC on the preliminary line, consider its fault model to statistically analyze the congestion indicators for all lines before and after TCSC installation, enabling the identification of potential non-synchronous phenomena. Given that both the selection and verification processes are related to transmission congestion under different system states, the procedural steps in these two stages are quite similar.
3.2 Stage Two: Verification of TCSC Location Considering Non-Coherent Phenomena
3.2.1 Transmission Line Model Considering TCSC Faults
Taking into account both the faults in the line itself and the operating modes of TCSC components, the operational states of a line containing TCSC can be classified into four categories: (1) normal operation of the line with both TCSC modules compensating; (2) normal operation of the line with a single TCSC module compensating; (3) normal operation of the line with no TCSC compensation; (4) line outage. The probabilities of these line operational states [15] are determined by:
where
It indicates that the probability of the line exiting operation increases from
3.2.2 Site Selection Method for TCSC Considering Non-Coherent Phenomena
When the increase in the fault rate of a line leads to degradation in the congestion indicators of other lines, it indicates the occurrence of non-coherence phenomena. In such cases, it is necessary to reevaluate the sitting, excluding the line from the search scope. The calculation of congestion indicators in power transmission is similar to the steps and content of power system reliability assessment. The required line flow calculations and load reduction optimizations during the process are based on the DC power flow reduction model. The TCSC site selection method, considering the non-coherence phenomena, the TCSC site selection method is outlined as follows:
Step 1: Determine the TCSC installation line based on the statistical data from the first stage, selecting the line with the highest occurrence frequency in the statistical data as the preliminary installation line.
Step 2: Utilize the non-sequential Monte Carlo method to extract generator, transmission line, and TCSC operational states.
Step 3: Determine the series-compensated line state based on the line and TCSC operational states.
Step 4: Calculate line flows.
Step 5: Determine the presence of transmission congestion; if present, proceed to Step 6. Otherwise, move to Step 9.
Step 6: Perform optimal load reduction optimization considering TCSC integration. This involves solving the optimal load reduction model in the TCSC siting model, taking into account TCSC installation location constraints.
Step 7: Assess whether the system experiences load reduction. If so, proceed to Step 8; otherwise, move to Step 9.
Step 8: Calculate the transmission congestion indicators for the system and lines using Eqs. (13)–(16), including line congestion quantity, system congestion probability, and system congestion quantity. When the sample size is sufficiently large, the sampling frequency of the system states can be used as an unbiased estimate of its probability. Combined with literature [22], the congestion indicators are defined as the following equations:
where
The system congestion probability (SCP) is defined as:
where
The system congestion energy (SCE) is defined as:
where
Step 9: Check if the system sampling is complete. If yes, continue; otherwise, return to Step 2.
Step 10: Determine if non-coherence phenomena occur. If yes, exclude the line from the TCSC installation line search scope and return to Section 3.1, Step 2; otherwise, proceed to Step 11.
Step 11: Confirm the line as the final installation line.
In conclusion, the two-stage site selection process for TCSC, considering non-coherence phenomena, is illustrated in Fig. 1 (Algorithm 1).

Figure 1: TCSC site selection flow chart
The pseudocode corresponding to Fig. 1 is presented as follows:

4 Experimental Results and Analysis
To better investigate the impact of TCSC on the transmission congestion of the system, this study made modifications to the RBTS system. Firstly, a new line L10 was added between nodes BUS5 and BUS6, with parameters identical to line L9, resulting in the MRBTS system. Subsequently, the following modifications were made to the MRBTS system: (1) All nodes’ active loads were increased by a factor of 1.3; (2) At node BUS1, one additional 20 MW generator was added, with parameters identical to the original 20 MW generator at node BUS1 in the RBTS system; (3) At node BUS2, two additional 20 MW generators were added, with parameters identical to the original 20 MW generator at node BUS2 in the RBTS system. Meanwhile, the following five schemes are set:
Case A: None TCSC.
Case B: TCSC Installation on Line L2 with Failure Consideration.
Case C: TCSC Installation on Line L2 without Failure Consideration.
Case D: TCSC Installation on Line L3 with Failure Consideration.
Case E: TCSC Installation on Line L3 without Failure Consideration.
The modified system is referred to as the MMRBTS system, and the system configuration is shown in Fig. 2.

Figure 2: Single-line diagram of MMRBTS system
4.1 Analysis of Non-Coherent Phenomena in Line Blocking Induced by TCSC Faults
Assuming a TCSC fault probability of 0.0005, the calculated results for the system congestion index (SCE) are presented in Table 1, where SCE is measured in MWh/year. From Table 1, it can be observed that: (1) Without considering TCSC faults, the installation of TCSC on the line significantly improves the system congestion index (SCE). However, when TCSC faults are taken into account, the improvement in the SCE due to TCSC installation is very limited. (2) Without considering TCSC faults, TCSC has no impact on the system congestion probability index (SCP). However, when considering TCSC faults, the system congestion probability index (SCP) actually increases, indicating the occurrence of non-coherence phenomena.

The results of the line congestion index calculations are presented in Table 2, with the congestion index values for each line before TCSC installation shown in the second column of Table 2. It is evident from Table 2 that the congestion situation is most severe for lines L2 and L3. Consequently, attempts were made to install TCSC components on lines L2 and L3, followed by testing for synchronicity at these locations.

From Tables 1 and 2, the following observations can be made: (1) Without considering TCSC faults, the installation of TCSC on the line significantly improves the system congestion index (SCE). For instance, when TCSC is installed on line L3, the congestion energy decreases from 782.41 to 643.71 MWh/year, corresponding to a 17.7% reduction. Similarly, the congestion energy on line L2 decreases from 334.29 to 221.99 MWh/year, and that on line L3 decreases from 414.91 to 277.89 MWh/year, both showing substantial improvements without introducing non-coherence phenomena. (2) When TCSC faults are considered, the improvement in SCE becomes very limited. For example, the overall system SCE decreases only from 782.41 to 743.84 MWh/year, a reduction of merely 4.9%. Moreover, local congestion indices even deteriorate when TCSC is installed on line L2, its congestion energy increases from 334.29 to 428.18 MWh/year, and when installed on line L3, its congestion energy rises from 414.91 to 508.80 MWh/year. These results provide clear evidence of non-coherence phenomena, where TCSC faults not only offset the expected benefits but also aggravate congestion in specific lines.
Regarding the system congestion probability index (SCP), it is observed that without considering TCSC faults, SCP remains unchanged, whereas with TCSC faults, SCP increases, further confirming the occurrence of the non-coherence phenomenon.
To further analyze the impact of TCSC faults on the transmission congestion index, an analysis was conducted to calculate the variation in the system congestion index for line L3 before and after the installation of TCSC, considering different TCSC fault rates. The specific results are depicted in Fig. 3.

Figure 3: Change of system congestion index with TCSC failure rate
As shown in Fig. 3, it is evident that after the installation of TCSC on line L3, the overall System Congestion Probability (SCP) consistently exhibits non-coherence phenomena with an increase in the TCSC fault rate. This is attributed to TCSC faults leading to the withdrawal of the affected line from operation, thereby increasing the probability of system congestion when TCSC is installed on certain lines. Meanwhile, the overall System Congestion Index (SCE) transitions from synchronous to non-coherent as the TCSC fault rate increases. In the initial stages of low TCSC fault rates, the infrequent instances of TCSC faults causing line withdrawals do not significantly offset the enhanced transmission capacity provided by normal TCSC operation. However, as the TCSC fault rate further increases, the increased frequency of line withdrawals negates the benefits of TCSC’s normal operation, causing the congestion index to shift from overall synchronous to overall non-coherence.
In conclusion, TCSC component faults lead to the deterioration of local and system congestion indices, inducing non-coherence phenomena. As the TCSC fault probability increases, the overall System Congestion Index (SCE) shifts from synchronous to non-coherent. Therefore, in the TCSC site selection process, it is imperative to consider the impact of non-coherence phenomena resulting from TCSC component faults.
4.2 Analysis of TCSC Site Selection Considering Coherence
This study employs a two-stage site selection method, considering non-coherence phenomena, to address the impact of TCSC faults. The TCSC site selection results before and after considering non-coherence phenomena are compared. The site selection process and outcomes are presented in Table 3, while the test results for different installation locations are outlined in Table 4.


Table 3 illustrates the site selection process and outcomes before and after considering non-coherence phenomena. The results without considering non-coherence phenomena are presented in Table 3. It is observed from Table 3 that, based on the data obtained from solving the TCSC site selection model for all states, line L4 appears most frequently.
When considering non-coherence phenomena, as indicated by the data in Table 1, TCSC installation on lines L2 and L3 leads to non-coherence occurrences in the system. Therefore, in the first site selection process, lines L2 and L3 are excluded. The preliminary solution suggests that line L4 appears most frequently. However, validation data in Table 4 reveals that TCSC installation on line L4 induces non-coherence congestion phenomena. Consequently, lines L2, L3, and L4 are excluded in subsequent site selection processes. After the third site selection, line L1 is identified as the installation location without non-coherent phenomena.
According to the verification results in Table 4, installing TCSC at different locations leads to varying degrees of congestion deterioration on other lines when TCSC faults are considered. Specifically, when TCSC is placed on line L4, the congestion energy of L5 increases from 14.54 to 16.90 MWh/year, a deterioration of 16.2%. When installed on line L5, the congestion energy of L4 rises from 7.65 to 10.01 MWh/year, a deterioration of 30.8%. In contrast, when TCSC is installed at the final selected location, line L1, no congestion deterioration occurs; instead, the congestion energies of L2 and L3 decrease significantly from 334.29 and 414.91 MWh/year to 237.73 and 295.33 MWh/year, representing reductions of 28.9% and 28.8%, respectively. These results demonstrate the strong congestion-mitigation effect of the proposed siting strategy.
By combining the outcomes of Tables 1 and 4, the proposed two-stage siting method ultimately identifies line L1 as the optimal installation location for TCSC. Under this configuration, and with TCSC faults considered, the system congestion energy (SCE) decreases from 782.41 MWh/year (without TCSC) to 643.71 MWh/year, corresponding to a 17.7% reduction, while the system congestion probability (SCP) falls from 0.0035 to 0.0031, a reduction of 11.4%. Compared with traditional siting approaches that neglect TCSC faults, the proposed method not only ensures effective congestion relief but also prevents local deterioration caused by TCSC faults, thereby enhancing the overall reliability of system operation.
4.3 Analysis of the Impact of TCSC Siting on System Reliability
Variations in TCSC placement schemes lead to differences in system power flow distribution, which subsequently affect the system reliability indices. In this section, we present a comparative analysis of system reliability indices under two scenarios: TCSC placement considering congestion non-coherent characteristics and TCSC placement without considering congestion non-coherent characteristics. To evaluate system reliability, the loss of load probability (LOLP) and the expected energy not supplied (EENS) are selected as the key performance indices. The corresponding results are summarized in Table 5.
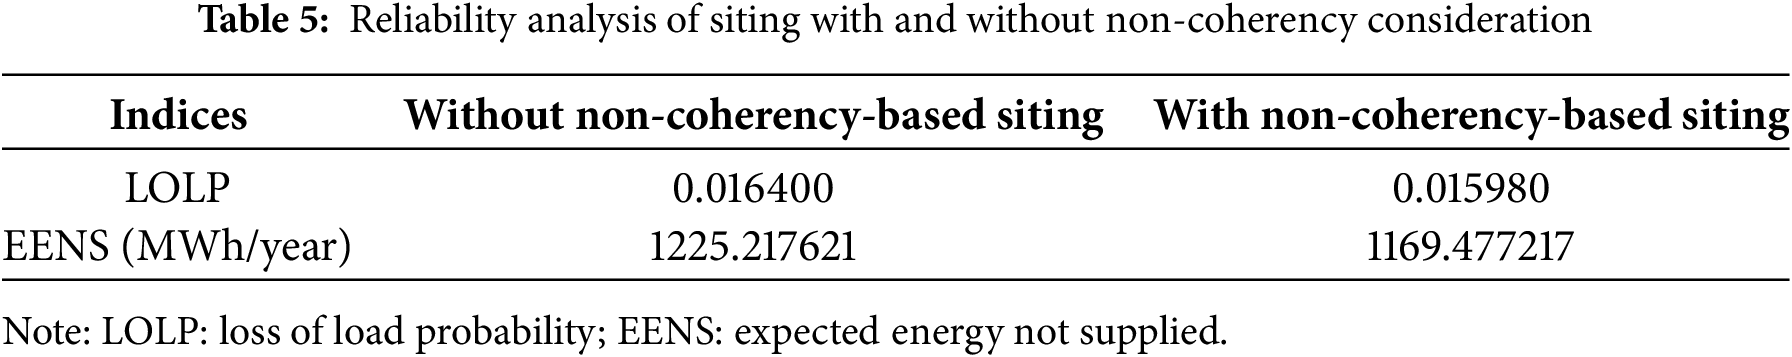
As shown in Table 5, the LOLP decreases from 0.016400 to 0.015980, representing a relative reduction of approximately 2.56%. The main reason is that, with TCSC placement considering non-coherent characteristics, the installation of TCSC improves the power flow of critical transmission lines, effectively mitigating the impact of TCSC outages on system power flow and reducing the probability of load loss caused by non-coherent congestion. From an operational risk perspective, the 2.56% reduction in LOLP means fewer instances where the system will fail to meet demand, effectively reducing the risk of failure caused by system overload. A stable power supply not only improves system reliability but also allows the system to maintain higher flexibility when faced with high-load conditions. Meanwhile, the EENS decreases from 1225.22 to 1169.48 MWh, with a relative reduction of about 4.55%. For the system, a 4.55% reduction in EENS means a significant decrease in the need for forced load shedding during periods of system congestion. Specifically, the reduction in EENS by approximately 56 MWh can supply electricity to 2300 households for one day. This more substantial decrease indicates that considering non-coherent placement can, to some extent, optimize power flow distribution, enhance system supply capability, and reduce load curtailment, thereby further improving overall system reliability.
These results demonstrate that incorporating non-coherent placement can significantly enhance system reliability, alleviate the non-coherent congestion phenomena caused by TCSC installation, and improve system operational stability and resilience under high-load conditions.
This study investigates the optimized location model of Thyristor-Controlled Series Compensator (TCSC) and the non-coherent phenomenon where certain transmission lines experience exacerbated blocking due to TCSC faults. In response to this phenomenon, a two-stage TCSC site selection method is proposed, considering the improvement of coherence in transmission line blocking. Case studies were conducted using a modified RBTS system, leading to the following conclusions:
(1) Due to inherent TCSC faults, the installation of TCSC at inappropriate locations can result in a non-coherent phenomenon, leading to exacerbated line blocking on specific transmission lines.
(2) Incorporating a coherence verification for line blocking into the initial TCSC site selection can yield an optimal TCSC location scheme that favors enhancing coherence in blocking for multiple transmission lines.
Acknowledgement: Not applicable.
Funding Statement: This work was supported by Graduate Research and Innovation Program Project of Nanjing Institute of Technology (No. TB202517078).
Author Contributions: The authors confirm contribution to the paper as follows: Conceptualization: Fan Chen; methodology: Xian Bao and Jianlin Liu; software: Xian Bao and Jianlin Liu; validation: Xian Bao and Man Wang; formal analysis: Qiang Zhang; investigation: Jianlin Liu and Qiang Zhang; writing—original draft preparation: Xian Bao; writing—review and editing: Xian Bao and Man Wang. All authors reviewed the results and approved the final version of the manuscript.
Availability of Data and Materials: The authors confirm that the data supporting the findings of this study are available within the article.
Ethics Approval: Not applicable.
Conflicts of Interest: The authors declare no conflicts of interest to report regarding the present study.
Glossary
| The load reduction at node | |
| The output of generator | |
| The active power load at node | |
| The lower of the generator output | |
| The upper of the generator output | |
| The total number of nodes | |
| The number of generators | |
| The total number of lines in the system | |
| The total number of TCSCs installed in the system | |
| The actual operating power for the line | |
| The rated capacity for the line | |
| The i-th TCSC | |
| The lower limits for the compensation degree of the i-th TCSC | |
| The upper limits for the compensation degree of the i-th TCSC | |
| The installation location for the i-th TCSC | |
| The vector formed by | |
| The vector formed by | |
| The vector formed by | |
| The matrix representing the relationship between active power flow under fault conditions and injected power | |
| The matrix of active power flow on the line after a fault | |
| The availability of the line | |
| The unavailability of the line | |
| The congestion capacity of line | |
| The actual operating power of line | |
| The number of system states | |
| The number of states in which the system experiences congestion | |
| The load reduction caused by congestion under the |
References
1. Zhou W, Li H, Su X, Xiang T. PSASP-based city grid ring-closing strategy research and corresponding risk assessment. In: Proceedings of the 2019 IEEE Innovative Smart Grid Technologies—Asia (ISGT Asia); 2019 May 21–24; Chengdu, China. p. 48–53. [Google Scholar]
2. Sharma A, Jain SK. Gravitational search assisted algorithm for TCSC placement for congestion control in deregulated power system. Electr Power Syst Res. 2019;174(5):105874. doi:10.1016/j.epsr.2019.105874. [Google Scholar] [CrossRef]
3. Mazaheri H, Moeini-Aghtaie M. Data-driven joint TEP-BESS co-planning scheme to relieve transmission lines congestion: a min-max regret method. Sustain Energy Technol Assess. 2022;53(2):102676. doi:10.1016/j.seta.2022.102676. [Google Scholar] [CrossRef]
4. Tarashandeh N, Karimi A. Utilization of energy storage systems in congestion management of transmission networks with incentive-based approach for investors. J Energy Storage. 2021;33(1):102034. doi:10.1016/j.est.2020.102034. [Google Scholar] [CrossRef]
5. Xu X, Yan Z, Shahidehpour M, Li Z, Yan M, Kong X. Data-driven risk-averse two-stage optimal stochastic scheduling of energy and reserve with correlated wind power. IEEE Trans Sustain Energy. 2019;11(1):436–47. doi:10.1109/tste.2019.2894693. [Google Scholar] [CrossRef]
6. Sadiq AA, Buhari M, Adamu SS, Musa H. Coordination of multi-type FACTS for available transfer capability enhancement using PI–PSO. IET Gener Transm Distrib. 2020;14(21):4866–77. doi:10.1049/iet-gtd.2020.0886. [Google Scholar] [CrossRef]
7. Kamel S, Abokrisha M, Selim A, Jurado F. Power flow control of power systems based on a simple TCSC model. Ain Shams Eng J. 2021;12(3):2781–8. doi:10.1016/j.asej.2020.11.023. [Google Scholar] [CrossRef]
8. El-Azab M, Omran WA, Mekhamer SF, Talaat HE. Allocation of FACTS devices using a probabilistic multi-objective approach incorporating various sources of uncertainty and dynamic line rating. IEEE Access. 2020;8:167647–64. doi:10.1109/access.2020.3023744. [Google Scholar] [CrossRef]
9. Guguloth R, Kumar TS. Congestion management in restructured power systems for smart cities in India. Comput Electr Eng. 2018;65(01):79–89. doi:10.1016/j.compeleceng.2017.04.016. [Google Scholar] [CrossRef]
10. Sang Y, Sahraei-Ardakani M. The interdependence between transmission switching and variable-impedance series FACTS devices. IEEE Trans Power Syst. 2017;33(3):2792–803. doi:10.1109/tpwrs.2017.2756074. [Google Scholar] [CrossRef]
11. Sang Y, Sahraei-Ardakani M, Parvania M. Stochastic transmission impedance control for enhanced wind energy integration. IEEE Trans Sustain Energy. 2017;9(3):1108–17. doi:10.1109/tste.2017.2770129. [Google Scholar] [CrossRef]
12. Sedlacek P, Zaitseva E, Levashenko V, Kvassay M. Critical state of non-coherent multi-state system. Reliab Eng Syst Saf. 2021;215(6):107824. doi:10.1016/j.ress.2021.107824. [Google Scholar] [CrossRef]
13. Zaitseva E, Levashenko V, Sedlacek P, Kvassay M, Rabcan J. Logical differential calculus for calculation of Birnbaum importance of non-coherent system. Reliab Eng Syst Saf. 2021;215(2):107829. doi:10.1016/j.ress.2021.107829. [Google Scholar] [CrossRef]
14. Hu Y, Bo Y. Reliability on distributed system considering transmission lines. In: Proceedings of the 2022 5th International Conference on Power and Energy Applications (ICPEA); 2022 Nov 18–20; Guangzhou, China. p. 459–63. [Google Scholar]
15. Ding J, Xie K, Hu B, Shao C, Niu T, Li C, et al. Mixed aleatory-epistemic uncertainty modeling of wind power forecast errors in operation reliability evaluation of power systems. J Mod Power Syst Clean Energy. 2022;10(5):1174–83. [Google Scholar]
16. Ji J, Wan L, Jiang Z, Yang Q. Recognizing the reliability non-coherence components of bulk power systems based on reliability indices decomposition method. In: Proceedings of the 2012 International Conference on Control Engineering and Communication Technology; 2012 Dec 7–9; Shenyang, China. p. 283–6. [Google Scholar]
17. Zhao Y, Qiu Y, Su X. Operating risk assessment model of power grid with TCSC. Electr Power Autom Equip. 2014;34(7):50–8. [Google Scholar]
18. Cheng L, Sun Y, Yang K, Zhang S, Gao F, Song Y, et al. Operating reliability research of transmission line considering TCSC. Power Syst Technol. 2015;39(03):751–6. [Google Scholar]
19. Li W. Risk assessment of power systems: models, methods, and applications. Hoboken, NJ, USA: John Wiley & Sons, Inc.; 2014. [Google Scholar]
20. Hosseini SE, Khajehzadeh A, Eslami M. Simultaneous employment of generation rescheduling and incentive-based demand response programs for congestion management in case of contingency. J Mod Power Syst Clean Energy. 2021;10(4):902–12. [Google Scholar]
21. Firouzi M, Samimi A, Salami A. Reliability evaluation of a composite power system in the presence of renewable generations. Reliab Eng Syst Saf. 2022;222(2):108396. doi:10.1016/j.ress.2022.108396. [Google Scholar] [CrossRef]
22. Gan M, Xie K, Li C. Transmission congestion tracing technique and its application to recognize weak parts of bulk power systems. J Mod Power Syst Clean Energy. 2017;5(5):725–34. doi:10.1007/s40565-016-0230-7. [Google Scholar] [CrossRef]
Cite This Article
 Copyright © 2025 The Author(s). Published by Tech Science Press.
This work is licensed under a Creative Commons Attribution 4.0 International License , which permits unrestricted use, distribution, and reproduction in any medium, provided the original work is properly cited.
 Downloads
 Citation Tools