
 Submit a Paper
 Propose a Special lssue
 Open Access
ARTICLE

KN-YOLOv8: A Lightweight Deep Learning Model for Real-Time Coffee Bean Defect Detection
1 Robotics Research Division, Ethiopian Artificial Intelligence Institute, Addis Ababa, P.O. Box 40782, Ethiopia
2 Department of Computer Engineering, Addis Ababa Science and Technology University, Addis Ababa, P.O. Box 120611, Ethiopia
* Corresponding Author: Tesfaye Adisu Tarekegn. Email:
Journal on Artificial Intelligence 2025, 7, 585-613. https://doi.org/10.32604/jai.2025.067333
Received 30 April 2025; Accepted 03 November 2025; Issue published 01 December 2025
 View Full Text
 Download PDF
Abstract
The identification of defect types and their reduction values is the most crucial step in coffee grading. In Ethiopia, the current coffee defect investigation techniques rely on manual screening, which requires substantial human resources, time-consuming, and prone to errors. Recently, the deep learning driven object detection has shown promising results in coffee defect identification and grading tasks. In this study, we propose KN-YOLOv8, a modified You Only Look Once version-8 (YOLOv8) model optimized for real-time detection of coffee bean defects. This lightweight network incorporates effective feature fusion techniques to accurately detect and locate defects, even among overlapping beans. We have compiled a custom dataset of 562 images comprising thirteen distinct types of defects. The model achieved exceptional performance, with training dataset metrics of 97% recall, 100% precision, and 98% mean average precision(mAP). On the test dataset, it maintained outstanding results with 99% recall, 100% precision, and 98.9% mAP. The model outperforms existing approaches by achieving a 97.7% mAP for all classes at a 0.5 threshold, while maintaining an optimal precision-recall balance. The model outperforms new approaches by achieving a balance between precision and recall, achieving a mean average precision of 97.7% for all classes. This solution significantly reduces reliance on labor-intensive manual inspection while improving accuracy. Its lightweight design and high speed make it suitable for real-time industrial applications, transforming coffee quality inspection.Keywords
Agriculture is the foremost economic foundation for most African countries [1,2]. In Ethiopia, agriculture is the leading sector of the economy, accounting for 47.2% of the gross domestic product (GDP), and providing livelihoods for approximately 84.7% of the population through crop and livestock production [2,3]. According to the International Coffee Organization (ICO, 2021), Ethiopia is the fifth-largest global producer of premium-quality coffee, trailing Brazil, Indonesia, Vietnam, and Colombia, while remaining the leading coffee producer in Africa [2,4]. In the coffee industry, quality designation entails two steps: green analysis and cup test analysis [3,4]. During green analysis [4,5], the identification of defect’ type and their reduction values based on the Specialty Coffee Association of America (SCAA) standard [5,6] is the crucial step for grading coffee for commercial purposes.
Deep learning techniques can revolutionize the coffee industry via automating morphological defect investigation, reducing time, optimizing labor, and enhancing trade efficiency [7,8]. In agriculture, deep learning has been successfully applied to tasks such as detecting crop diseases (Mohanty et al., 2016 used Convolutional neural networks (CNNs) to classify 26 plant diseases) and sorting fruits by quality (Muresan et al., 2020, achieved 92% accuracy in apple defect detection using YOLOv4). Recent coffee-specific studies demonstrate the efficiency of these methods; Silva et al. (2021) leveraged Mask R-CNN to identify 3-defect types with 94% accuracy, while Santos et al. (2022) deployed a hybrid CNN-SVM model for real-time roast-level classification. With the prompt evolution of computer vision, scholars have widely contributed to tasks such as object localization, detection, segmentation, and classification [8,9]. Object detection [10,11] is the task of correctly investigating and localizing single and/or multiple objects in the images. Object detectors [12,13] are classified into two categories, viz. two stage and single stage object detectors. The 2-stage detectors [12] focus on the proposal of a region of interest (RoI) of a selective region strategy via a complex architecture, whereas one-stage detectors focus on one-shot of all spatial regions for object investigation. While the 2-stage detectors tend to be more accurate, studies [7,13] show that the solo-stage are better suited for real-time applications due to its lower computational cost and use of predefined anchors [12,14].
The reason why we accomplished this study is that coffee defect counting and grading remain labor-intensive, time-consuming, error-prone, and subjective [4–7]. Although prior researches have explored machine vision for defect detection, the existing solutions are impractical, limited to a few defect types [15,16]. Replacing manual inspection with an automated, non-destructive, precise and cost-effective system is essential for a high-value commodity like coffee. To bridge this gap, we optimize a deep learning model optimized for detecting small, overlapping, and visually diverse green coffee bean defects that conventional detectors often miss. The key innovations significantly employ instance segmentation to enable precise bean-level feature extraction, ensuring that each individual bean is analyzed accurately. It also maintains real-time detection capability with less than 2 ms processing head, making an efficient and scalable solution for coffee quality classification meaningful to both academic research and industrial applications [15,16].
Object detection [16], which involves identifying and localizing specific objects amidst a large number of categories in images, is a fundamental task that has been significant progress using deep CNNs, mainly due to robust features [13]. Object detection before 2012 [13,17] has been done through traditional detection algorithms such as VJ-detector [18], histogram of gradient (HOG) [19], and deformable part models (DPM) [20] which have resulted in various limitations, like generating a large number of proposals in which these many proposals were redundant, ensuing many false positives [13]. The development of deep learning has introduced two dominant detectors: single-stage and two-stage detectors [18,21]. The two-stage object detector [12,16], in its primary step, proposes object candidacy called RoIs [22], using reference boxes (anchors) [22,23]. In the second step [10,24], the proposals are classified and their localization is refined. Fig. 1 below demonstrates the differences between one- and two-stage approaches, providing a more detailed pictorial description. Fig. 1a, the two-stage architecture splits the process into two phases: the region proposal phase and the classification phase. Examples of two-stage object detectors comprise the famous R-CNN [25] variants like Faster R-CNN [26] and Fast R-CNN [27]. While Fig. 1b the one-stage detectors directly predict bounding boxes directly from feature maps. Examples of single-stage are Single Shot-MultiBox Detector (SSD) [28], fully convolutional one-stage detector (FCOS) [29] and YOLO-series [30]; bounding box regression and object classification [31] are done directly without using pre-generated proposals. Fig. 1b confirms the detection process using a single-scale feature map [32] from the backbone network. The articulated detectors integrate feature pyramid nets in order to detect objects at multiple scales; hence, maps with unlike resolutions are used to generate the proposals [31,32].
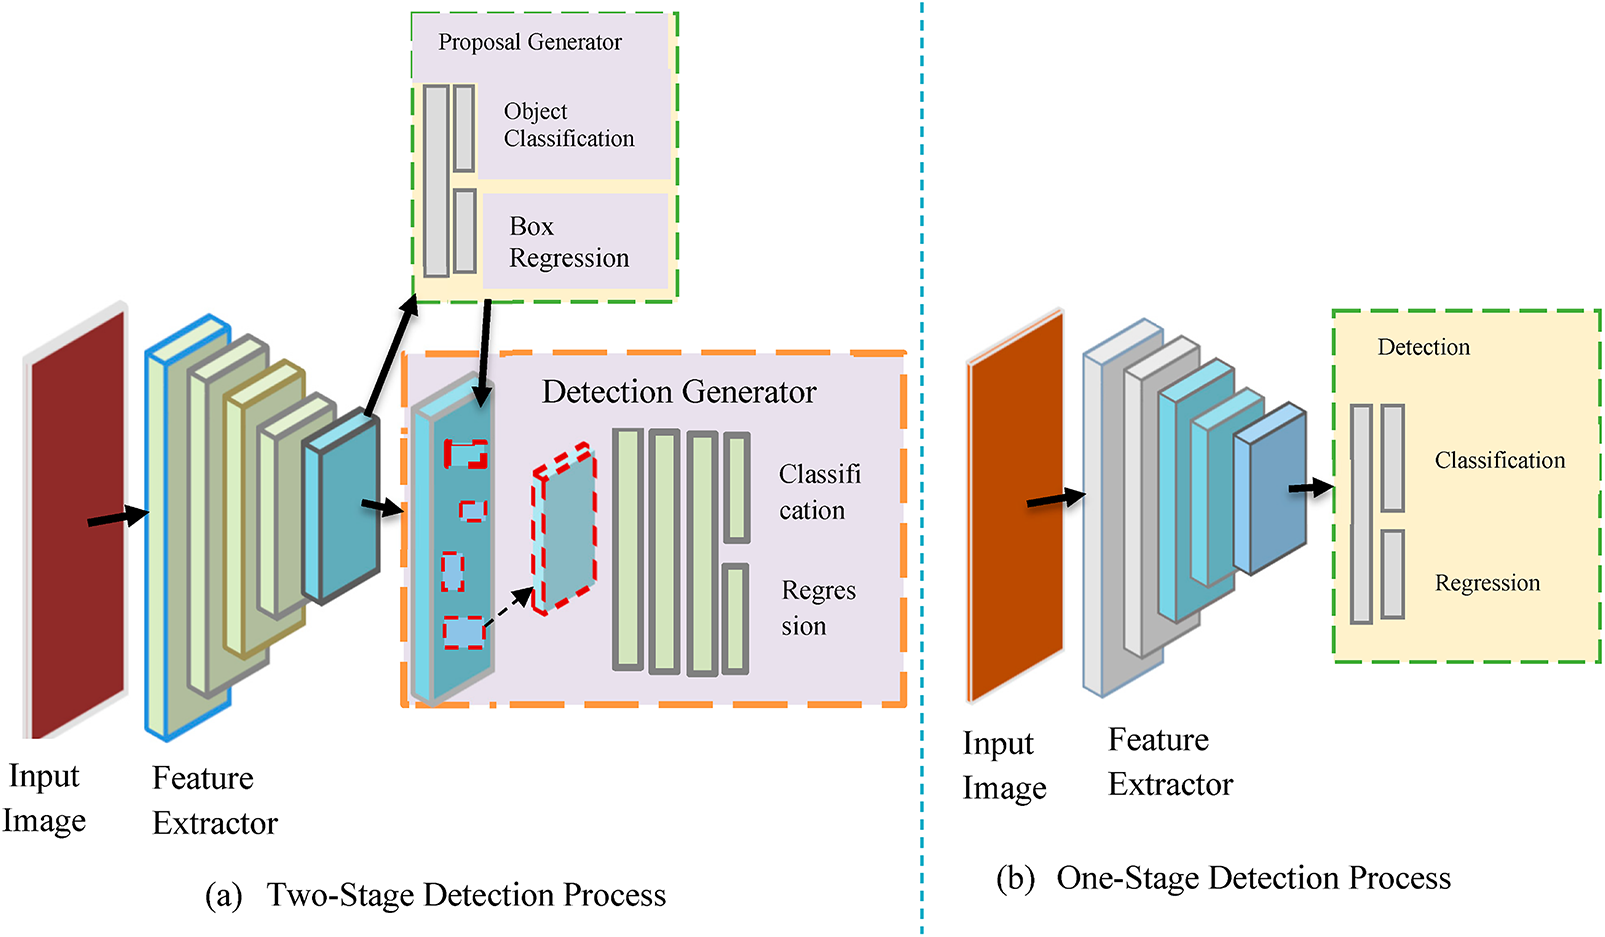
Figure 1: Deep learning-based object detection scenarios
Studies [28,31] proved that single-stage object detectors are typically used in real-time detection and yield the desired result faster than the two-stage detectors [17]. Commonly, two-stage object detectors tend to obtain higher accuracy, although with a higher computational cost and lower inference speed when compared to single-stage detectors [13,30,32]. Studies [30,32] have shown that a single-stage YOLO object detector entails numerous benefits over former detectors, including 2-stage algorithms such as VJ-detector, R-CNN, and HOG. First, YOLO [24] reasons out generally when making predictions about the image [33] with implicitly encoding contextual information of the classes and their appearances [24]. Second, YOLO is extremely fast compared to other object detection algorithms in a complex scene since it frames the detection problem as a regression without a complex pipeline [32]. According to [30], YOLO quickly learns [28] features that are transferred to other fields with strong generalization performance [33–35].
2.1 Coffee Bean Collection and Dataset Preparation
Green coffee quality grading depends on the presence of defects and their respective counts [14,18,36]. For data acquisition, we scattered the collected green coffee beans on A4 white paper without any intra-contact in order to ease image processing tasks as a coffee professional classifier works in the industry. To obtain balanced light illumination, we used an incandescent lamp whose source is 200 W with a rated voltage of 220 V in all experiments. In this study, the custom data collection entailed the following typical procedures: preparation: we collected a sample of coffee beans and arranged them in a flat, uniform layer on a white background. Lighting and Camera Setups: We mounted high sensitivity camera on a fixable joint and adjusted the focus, aperture, and ISO settings to obtain clear, high-resolution images. The camera was vertically fixed and horizontally movable at 12 cm considering later day industry level application above the background plane using a calibrated stand with laser assisted distance measurement. This ensured consistent pixel resolution (0.05 mm/pixel) across all images. In the real Ethiopian Coffee processing industry across the conveyor, the coffee beans were arranged in a single layer ((3.2 ± 0.5 mm average thickness) with height variations negligible relative to the 12 cm camera distance, which is <3% impact on magnification) and the depth of field was optimized (aperture f/8) to keep all beans. In collaboration with domain experts, we ensured adequate and multi axis lighting system to monitor shadows and reflections. Images were captured in high resolution (4032 × 3024) from different angles and then preprocessed to 640 × 640 pixels for model input consistency as in Fig. 2. To address minimal shadow concerns and lighting impacts, we ensured uniform illumination using a diffused 200 W incandescent lamp (220 V). To monitor residual lighting artifacts, we employed a Gaussian Mixture Model (GMM)-based background subtraction with isolated bean contours. Our GMM-based background subtraction explicitly filters out static shadows by classifying pixels with low matching probability (<0.5) as foreground (coffee beans) isolating defects from lighting artifacts. Shadow impact was further neutralized by resizing into the initial images into (640 ∗ 640 pixel) and GMM to reduce shadows prominence while preserving defect features [37,38].
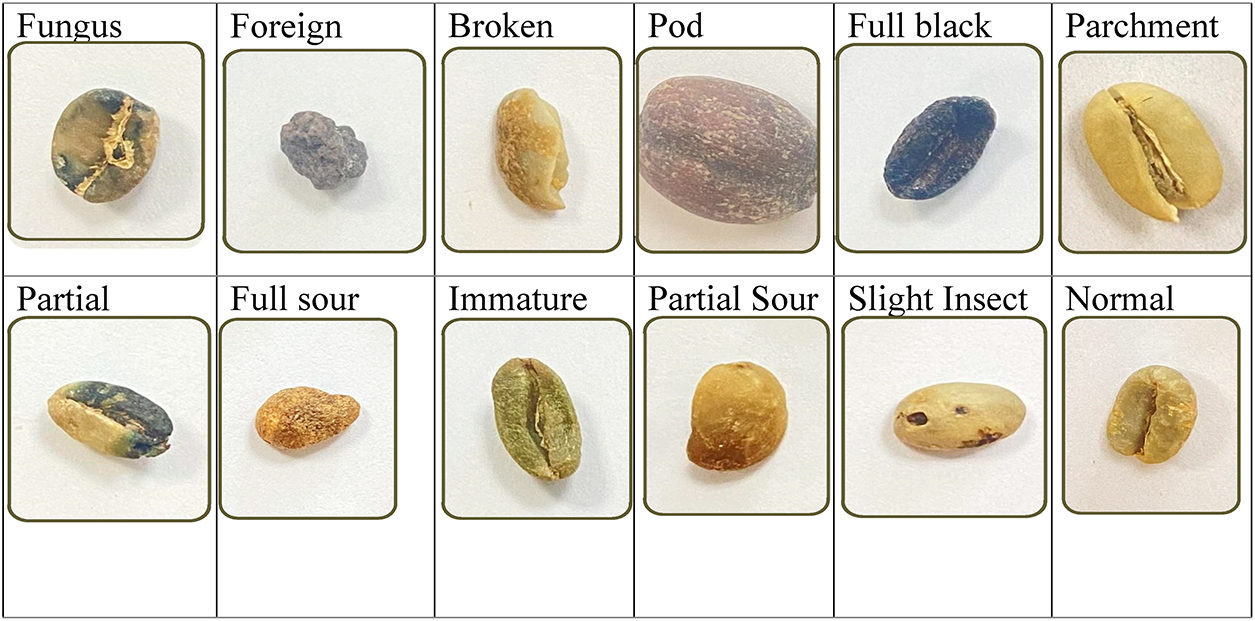
Figure 2: Types of coffee beans (defects and normal) used for coffee grading
There are about fourteen (13 defects and a normal) bean classes used to decide coffee grade developed by the SCAA and cascaded by Ethiopian Coffee Quality Inspection and Auction Center (ECQIAC), as listed in Table 1, (ECQIAC, 2023). The center takes samples/containers of all sides of each cell (Kuntal) to inspect quality. The container is equivalent to 320 Ku or 19,200 kg (ECQIAC, 2023). The initial coffee sample taken should be 3 kg per container. The collected 3 kg/container sample was taken to the laboratory for the purpose of making uniformity. Hereafter, the technician resampled 300 g per the 3 kg sample and sent it to the testing staff for defect identification. In order to develop an intelligent machine based green coffee quality inspection, we must follow the ECQIAC procedures [14,39].
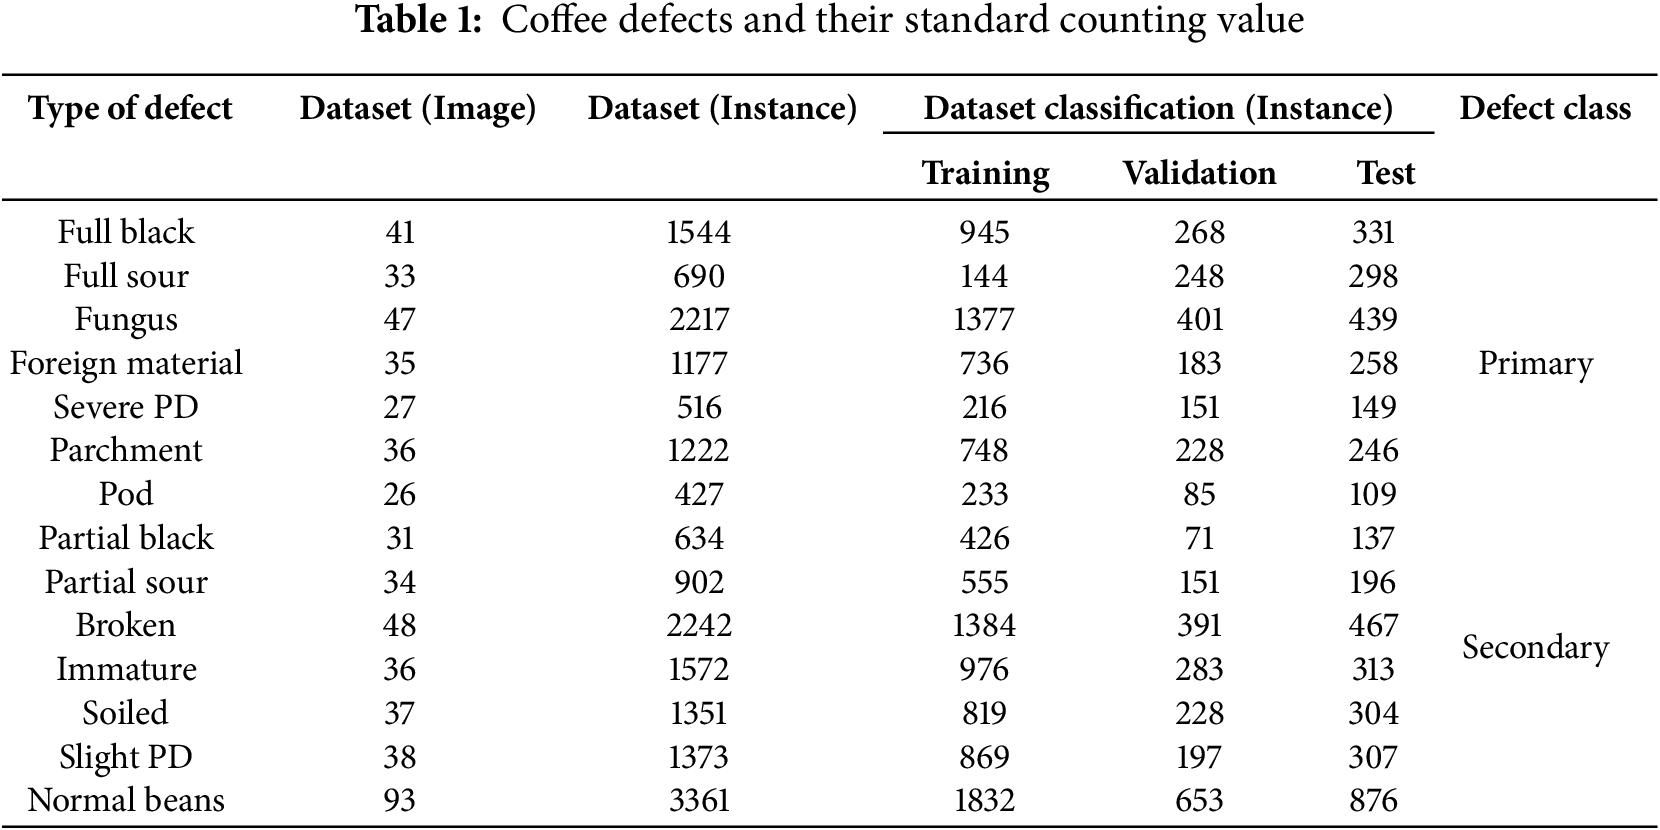
On the other hand, deep learning models generally perform better when trained on large datasets since help the model learn patterns that generalize well to new, and unseen data (Radford et al., 2021). Accordingly, considering the significance of large datasets for enhancing deep learning performance, in comparison to previous studies, we have developed a dataset that includes 562 images and 19,228 instances, surpassing those used in prior studies on coffee defect detection drawn in Table 1. The 562-image dataset includes three primary Ethiopian varieties (74% Sidamo, 22% Yirgacheffe, 7% Harar) to account for varietal differences. We employed stratified sampling, variety-aware preprocessing and invariant feature learning via multiscale training, and augmentation. These strategies enable the model to generalize effectively across morphological variations, maintaining high classification accuracy without the need for variety specific retraining. The high instance count advocates that we have labeled a significant number of defects within the images. This can enhance the model’s ability to learn from multiple occurrences of similar defects, reinforcing its learning. This dataset offers a wide range of examples of various coffee defects, enabling the model to learn patterns that can generalize effectively to new and unseen data.
In regard to data size, Chen et al. (2020), in the study titled “Detection of Insect Damage in Green Coffee Beans Using VIS -NIR Hyperspectral Imaging,” explored the effectiveness of hyperspectral imaging in identifying insect damage and undamaged green coffee beans. The research involved analyzing 20 images and 1139 beans, demonstrating that only three spectral bands were sufficient to achieve 95% accuracy. Additionally, the study titled ‘Deep-Learning-Based Defective Bean Inspection with GAN-Structured Automated Labeled Data Augmentation in Coffee Industry’ by Chen et al. (2019) explored how deep learning models, augmented with GAN-generated data, could be used to inspect defective coffee beans [38]. Specifically, the study adjusted to 140 images and reached up to 96.8% accuracy, demonstrating that the GAN-structured augmentation is effective in enhancing performance. In ‘Developing Ethiopian Yirgacheffe Coffee Grading Model using a Deep Learning Classifier, a total of 228 images were utilized, from three different quality levels (grade-1, grade-2, and grade-3) (IJITEE) (ajol). The model achieved an overall classification accuracy of 98.38%. Similarly, ‘Deep Learning Techniques for Coffee Bean Defect Detection’ by Ribeiro et al. (2020) applied CNN-based models to 500 labeled images, achieving a 97.5% classification accuracy in detecting defects like insect damage, mold, and broken beans. In comparison, our dataset contains 19,228 carefully annotated instances across 13 defective classes and a normal bean collected from three Ethiopian Coffee plants. Our current dataset establishes strong baseline performance under controlled conditions, and the high instance count and balanced class distribution provide robust learning signals. Moreover, class imbalance was addressed through (i) adaptive sampling (oversamples rare classes, e.g., pod) up to 50% of majority class frequency, under samples frequent classes (e.g., broken) after reaching 1000 instances, and preserves natural defect ratios for validation/testing maintaining natural test distributions; (ii) focal loss with SCAA-aligned weights and (iii) gradient harmonization. The experiment was carried out using a HP Victus 15.6 Gaming Laptop, 75800H, GeForce RTX 3050Ti, 16 GB RAM, 512 GB SSD, Windows 10 operating system. Following annotation, we have randomly alienated our datasets into training (80%), validating (10%), and testing (10%) datasets.
2.2 YOLOv8 Baseline for Green Coffee Detection
In this study, we deployed a YOLOv8-based model with some modifications for defective detection and coffee grading scheme due to the fact that it reached the highest accuracy, fastest speed, and lowest computational cost [39,40]. The YOLO network in essence structurally consists of 3 vital pillars [34], namely: the backbone aims to extract features, the neck focused on aggregating features, and the head for consuming output features from the neck as input and generating detections. Backbone: the YOLOv8 castoff enhanced CSPDarknet53 [32] as its backbone to extract image features, down-sampling into 5-times to yield five various scale features. The backbone used for our model is the CSPDarknet53 feature extractor, with a novel C2f module instead of the traditional neck structures. We replaced the Cross-Stage Partial(CSP) module in the backbone with the C2f module. In order to enrich the flow of feature extraction information while simultaneously maintaining a lightweight network, the C2f module adopts gradient shunt connections. The C2f module’s gradient shunt connections in the model significantly improved model performance through 3-mechanisms. First, they accelerate convergence by creating parallel pathways that reduce vanishing gradients and enable simultaneous local/global feature learning. Second, they enhance feature extraction by generating richer gradient diversity and improving multi scale representations boosting mAP. Third, increase training stability by smoothing the loss landscape and reducing initialization sensitivity. The combination of batch normalization (CBS), Sigmoid Linear Unit (SiLU) functions, and convolution) modules first applies a convolution operation to the input data, then performs batch normalization, and concludes by activating the information stream with the SiLu function to produce the final output. This backbone structure ultimately incorporates a module known as Spatial Pyramid Pooling Fast (SPPF) to pool the feature maps with fixed-size inputs, producing an adaptive output size. Compared with the structure of spatial pyramid pooling (SPP), the SPPF reduced the model computational efforts and has lesser latency by sequentially connecting the 3-max pooling layers [29,32,40] as shown in Fig. 3. Head: The detection component of YOLOv8 adopts a decoupled head architecture, featuring two separate branches dedicated to bounding box regression and object classification, respectively. Each branch utilizes its own specialized loss function: distribution focal loss (DFL) and complete intersection over union (CIoU) are applied to handle bounding box regression, while binary cross entropy (BCE) is used for classification tasks. This structure improves model convergence and enhances detection accuracy as in Fig. 3. YOLOv8 also incorporates an anchorless detection mechanism, which clearly distinguishes negative and positive samples, while the Task-Aligned Assigner dynamically allocates samples to boost the model’s robustness and overall detection precision [32,40]. Neck: Inspired by the Path Aggregation Network (PAN), YOLOv8 integrates a PANet-to-Feature Pyramid Network (FPN) structure at its neck. Unlike the neck configurations in YOLOv5 and YOLOv7, YOLOv8 omits the convolution maneuver after up sampling in PAN structure, retaining its original capabilities while optimizing for a lighter model. The feature scales in the FPN and PAN structures of YOLOv8 are represented by N4-N5 and P4-P5, respectively. To address feature fusion limitations, PAN-FPN integrates PAN with FPN to enhance location information learning, enabling path enhancement. This structure facilitates the complementarity of deep semantic information and shallow positional details through bidirectional feature fusion, resulting in improved feature diversity and completeness. Additionally, YOLOv8 is highly adaptable and can efficiently run across various platforms, including both CPU and GPU, offering significant flexibility [16,32,40].
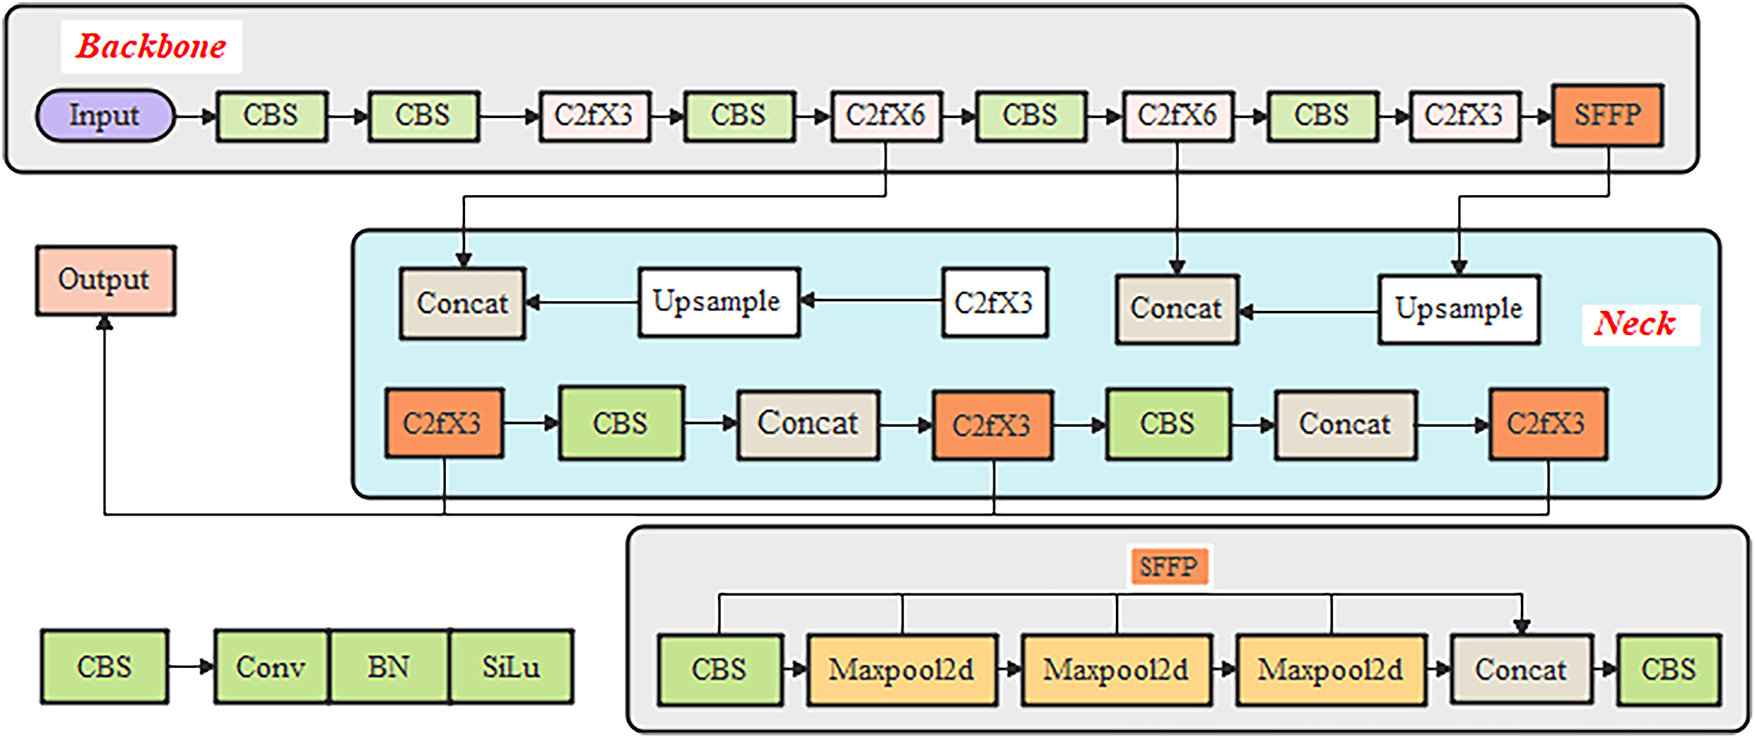
Figure 3: Neural structure of the existing YOLOv8 network
2.3 Object Detection and Its Evaluation Metrics
In this study, in order to evaluate our model, we scientifically scrutinize the mAP, comprehending the Intersection over union (IoU), and Confusion matrix (TP, FP and FN) as per its mathematical procedure graphically expressed in Fig. 4. In this bean detection, the mAP is fundamental through calculating the correctness of a bounding box through Jaccard Index (IoU) [39–41].
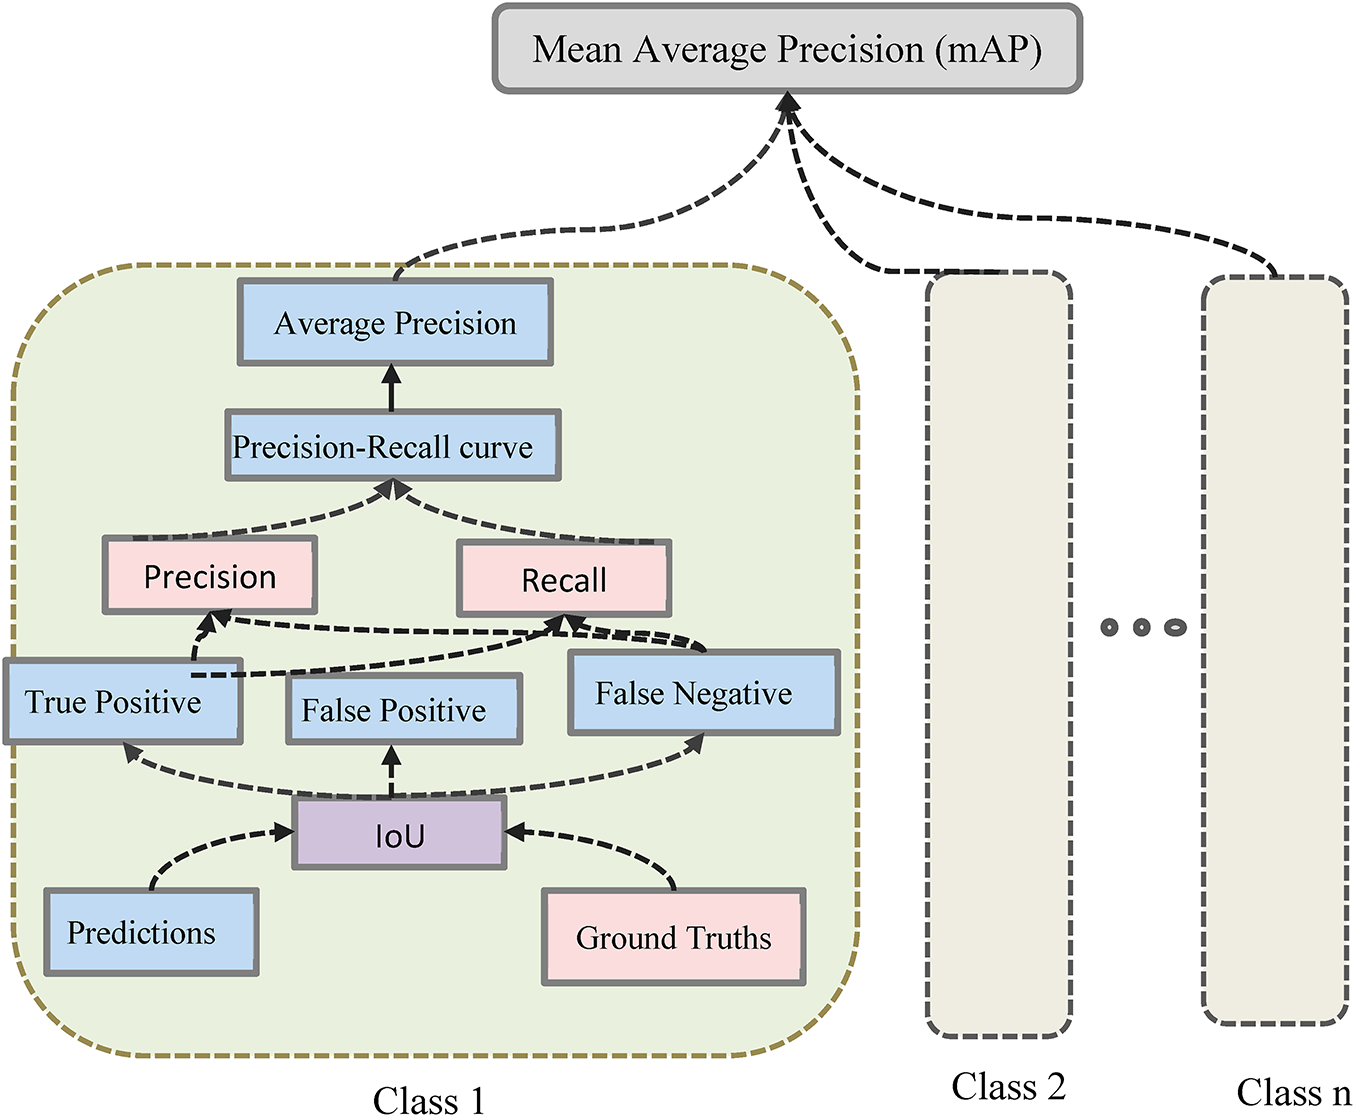
Figure 4: Mathematical cunning process of mean average precision (mAP)
The Intersection over Union (IoU) quantitatively computes the closeness of two bounding (ground truth and prediction) boxes. It determines the overlapping area of the ground-truth bounding box (
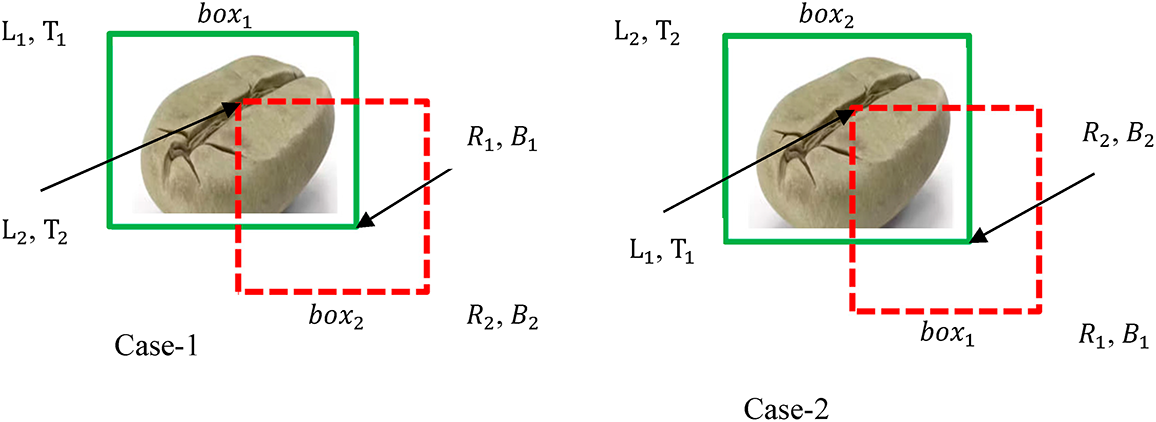
Figure 5: Ground truth and predicted bounding boxes
In object detecting algorithms, IoU is used to cross-check how much the predicted bounding boxes are accurate. Assume the positive x-axis and positive y-axis coordinate system of the above two bounding bean boxes were moving to the right and downward, respectively. The pseudocode flow process is designed from Fig. 6 below mathematically. IoU is calculated using Eq. (1).
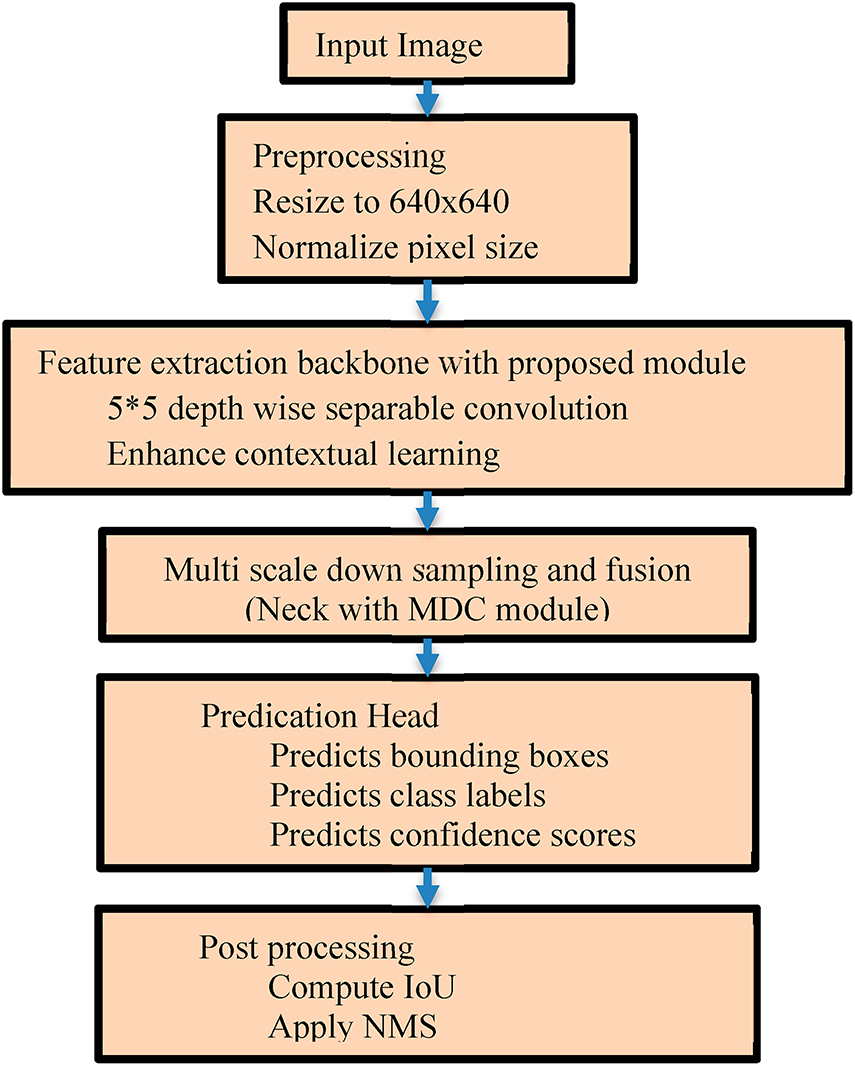
Figure 6: Pseudocode diagram
Whether the bean detection of an object is correct or incorrect, it’s identified with the help of comparing the IoU value with the given threshold t. Detection is considered correct if the IOU ≥ t; otherwise incorrect. In this study, we utilized standard YOLO threshold values which is 0.5 [39], therefore, we analyzed our detection model’s IoU to be in the range of 0.5-to-0.95. Our coffee bean prediction to be correct if the class label of the ground truths and predictions bounding boxes would become overlap each other and IoU > threshold value. Based on IoU, class labels and threshold, the model can analyze the following four metrics. True Positive (TP): A true positive tells us the model predicted the real ground truth (annotated bounding box). False Positive (FP): In a false positive, the model predicted that although it was wrong (false), the bounding box exists at a particular position (positive). False Negative (FN): The model failed to predict a bounding box at a certain position (negative) and it’s wrong (false), i.e., a ground truth bounding box existed at that position. True Negative (TN) refers to the background area where no bounding boxes are expected. It isn’t used in object detection metrics calculation because many bounding boxes exist in the image that should not be detected [41,42].
The mean Average Precision (mAP) used to evaluate the performance of the model in detecting the coffee bean and its image retrieval tasks is given by the area under the precision-recall curve. The mAP provides a numerical score that reflects how accurately the model identifies and localizes a single bean within the images [41,42]. The n and k denote the number of thresholds and the number of classes, respectively; mAP is given by:
3.1 The Proposed KN-YOLOv8 Architecture
Primarily, we proposed a state-of-the-art deep YOLO version-8 based coffee bean detection model in order to identify, count and classify the profiles of the sampled green coffee dataset. YOLO-v8 has been very picture-perfect in detecting objects, however, there’re still some difficulties in identifying small objects in complex-scenes like coffee cherry. This inexact detection of small/overlapped objects could happen due to: (i) when the neural nets extracting features, small-sized objects were misled by large-sized objects, and thus the deep level extracted features lack lots of small-sized object information, that lead negligence of small objects learning processes accompanied poor accuracy (ii) small-sized objects such like coffee beans were easily overlapped compared to the normal-sized objects and can either fully or partially be blocked by other objects, making it difficult to identify and locate in the image [16,32,40]. In order to resolve these challenges, based on the YOLOv8 architecture, we proposed a deeper network structure (KN-module) that significantly improves small-sized object effects. It is primarily used to gather important modules in the last layer, simultaneously, it also gathers necessary bean information from the previous layer that could so avoid problems of information loss while ensuring that small-sizes and normal-sizes information are preserved in a better condition. The proposed deeper architecture called the KN-module (with 5 × 5 convolutional size + deep-wise separable convolution) that regularly fused and stacked to form a new network architecture.
We also intended the MDC-module for the pursuit of down-sampling tasks, which adopts Maxpool, depth separable convolution, and a stride of 2 with a 5 × 5-dimensional convolution of concatenation. This task can entirely supplement the lost information during down-sampling processes for each bean item and preserve contextual datum during feature extraction. Next, our feature fusion technique has been improved to provide an efficient combination of deep and shallow information, so that the retained information in the steps of the extraction course becomes more comprehensive, and thus we resolved the challenges of misdetection of overlapped coffee beans due to inaccurate location and being misled by large-sized objects. In this proposed network, the C2f in front of the detector entailed in YOLOv8 is substituted by the KN-module (the net-structure designed by stacking ordinary and depth-wise separable convolution). This network is formed by stacking KN-modules and unceasingly fusing individual small modules. Consequently, this proposed module elevates the depth wise of the entire architecture and yields higher resolution without momentous computational cost as well as being capable of capturing contextual information. The parallel concatenation of deep separable convolutions can learn from each other and improve the learning ability and stability of the network. For bean level defect detection, we arrayed a deep KNYOLOv8 model with the following special modified conditions;
(a) This KN-YOLOv8 is a valuable real time object detector, especially with the adoption of the modified SPPF module, CSP and feature fusion methods in PAN-FPN. The PAN-FPN integration in KN-YOLOv8 uniquely addresses coffee grading needs by (i) FPN’s semantic flow perfects defect classification, while (ii) PAN’s spatial pathways ensure accurate counting. Our KN-module enhanced fusion nodes (Fig. 7) further optimize this synergy, achieving 95.6% small-defect recall and 0.81 overlap IoU-impossible with either pathways alone. We were especially acquainted a new backbone scene, KN accompanied CSPDarknet-53 which better improved detection accuracy problems caused by bean overlap and computing speed lag.
(b) In our model, the MDC module was deployed to perform down sampling operation; (the separable convolutions of deep wise based-on the concatenation method of size 3 × 3 with stride = 2 is used). After frequent experiments, it was proved that the deployed MDC module in our KN-YOLOv8 was become better competent than the down sampling techniques [16,40,42,43]. Fig. 7 represents a custom neural network module that processes an input tensor through a sequence of convolutional and concatenation operations with multiple skip connections. This input first passes through two consecutive KN-blocks, after which the output is concatenated with direct skip connections from the original input. This merged output is then processed by a CBS (K, 1, 1) block, which likely combines a convolution, batch normalization, and activation using a 1 × 1 kernel to adjust feature dimensions.
(c) In the pixels of small targets of the coffee beans, the KN-YOLOv8 large along with CSP-head comprehensively enables the detectors to extract accurate features. At the end of the backbone, we deployed SPPF in KN-YOLOV8 than the traditional SPP [16] module trained in the architectures of YOLO-series. The role of our SPPF in the KN-YOLOv8 structure is to ensure light-weight fixed size features vector output for images with different size input with 3-kernels of various sizes nine, five and three for extracting features with maximum pooling tasks, enhances expression capability of feature graphs. The module also used to reduce the volume of programs’ computation while improving performance of pooling tasks. The SPPF block efficiently increases the receptive field by using fixed-size max pooling operations and concatenating the outputs, enabling the model to capture both fine and coarse spatial details without computational cost as in Fig. 8. The SPPF module replaced maximum pooling operation of the parallel 3-convolutional kernels of various size in this actual SPP with a serial running of 3-convolutional kernels. The entire SPPF operations first perform the 5 * 5 maximum pooling on the datum successively transferred from the CBS modules, then after the data were passed into CBS module by splice concatenation, which achieves a speed-up completing richer extraction information. Therefore, the head module used to generate the final coffee type predictions based the intended bean resolution has been restructured to the recent decoupled structure, separating detection and classification heads and then switching to anchor-free detection. It increased the depth of the whole structure, achieved higher resolution without significant computational cost, and capture more contextual information [39,40].
(d) Effective feature fusion method: in this case, we improved the feature fusion modular technique, as capable of comprehensively retaining information generated during the process of feature’ extraction as well as perfectly combining the shallow and deep information. On the other hand, the problem of missed detection due to inaccurate positioning and overlap was resolved finally transforming the whole a region proposal network (RPN) processes into a one-pass detection single architecture as drawn in Fig. 9. Compared with YOLOv8, our KN-YOLOv8 model has been improved in terms of training strategy, performance and model structure. In order to improve computational efficacy and minimize recurrent analysis, the cross-stage-partial (CSP) module was deployed parallel to MDC (multi scale down sampling and concentration) in our KN-YOLOV8 model. The model still provided a brand new SOTA model, entailing P6-1280 and P5-640 detection networks with an instance segmentation model as in Figs. 9 and 10.
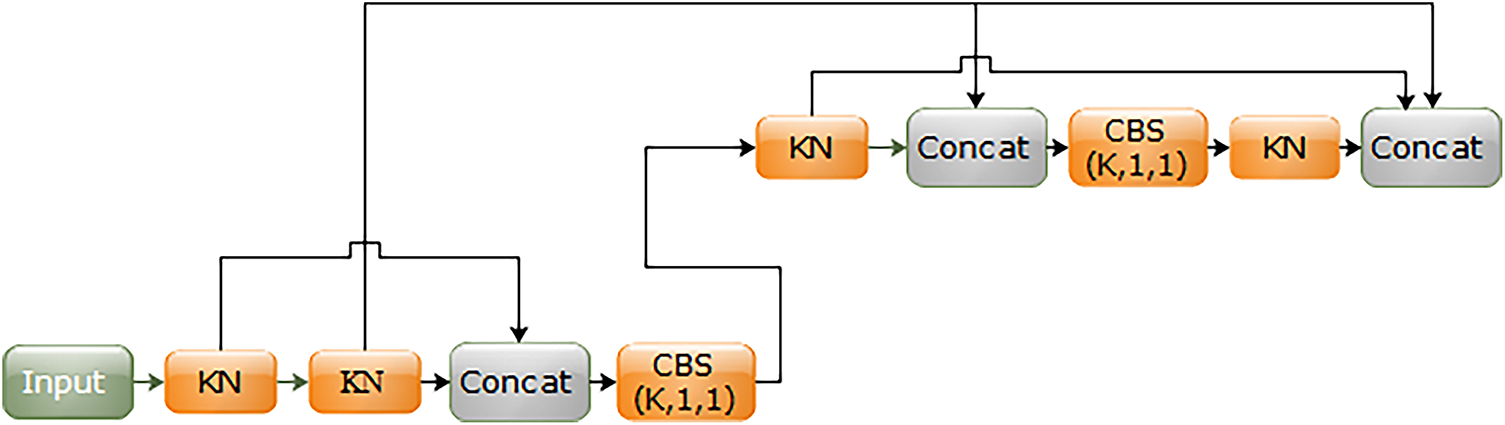
Figure 7: KN-network architecture

Figure 8: SPPF structural diagram
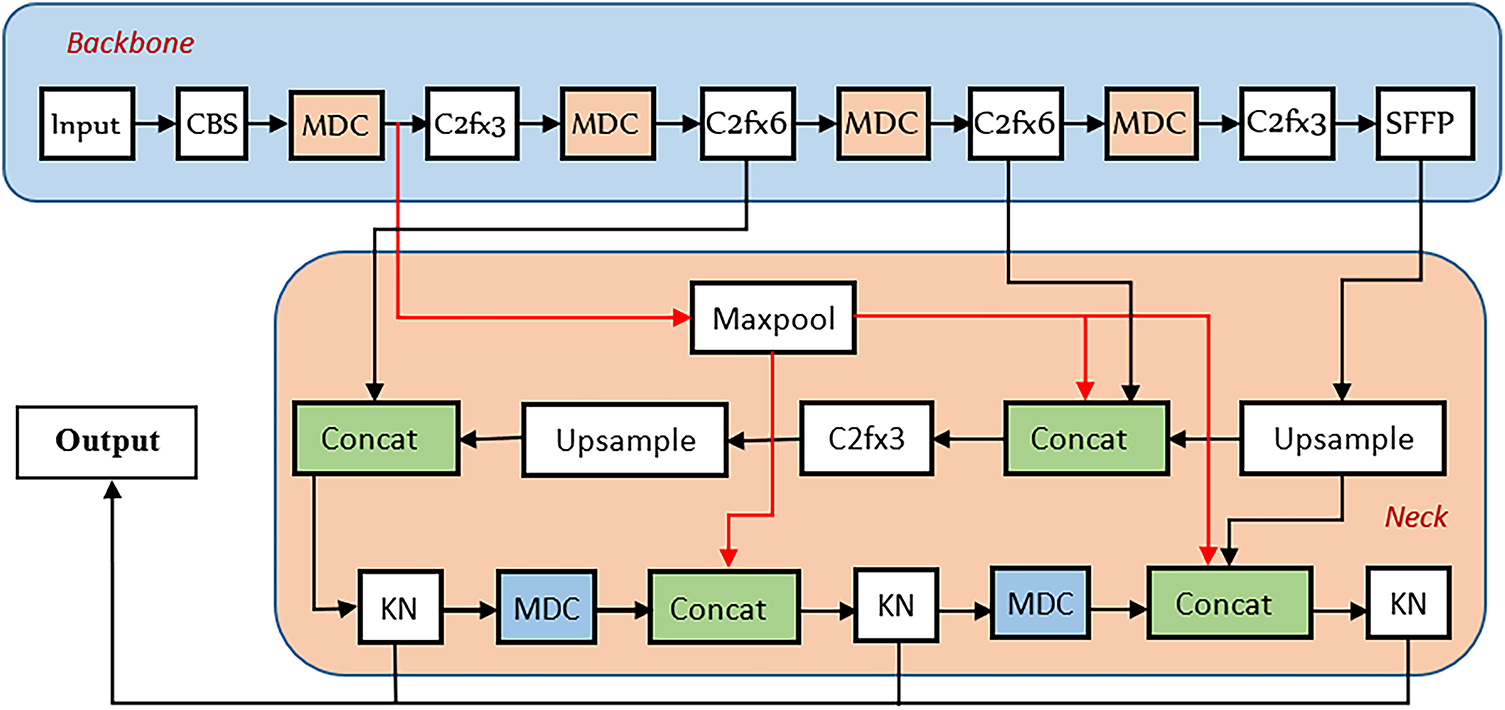
Figure 9: KN-YOLOv8 network architecture
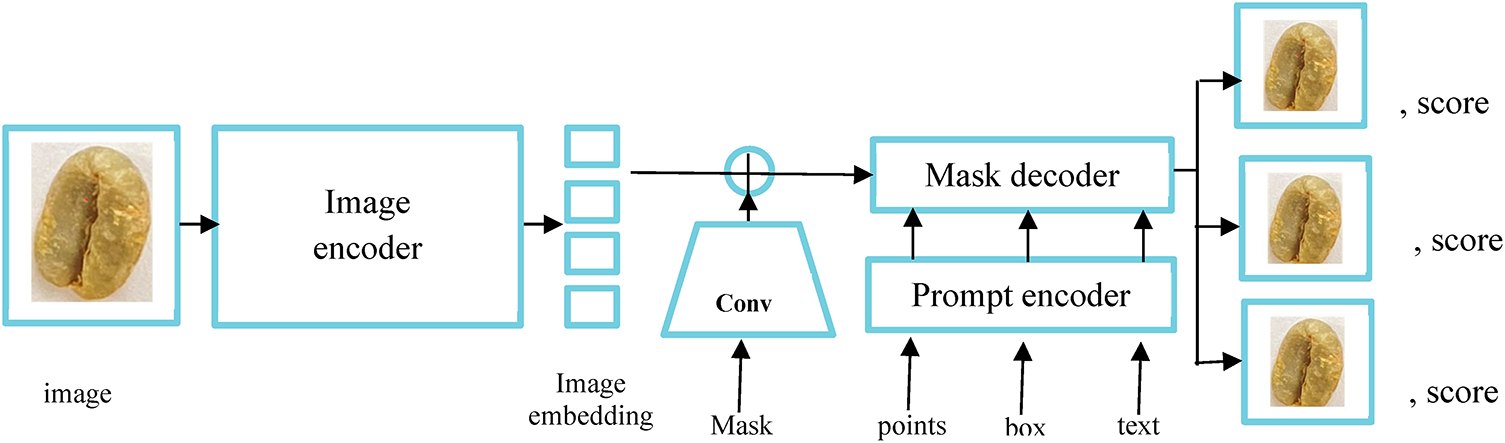
Figure 10: Segmenting coffee bean overview
On the other hand, the existing studies [44] were mostly grounded in region proposal to extract a candidate segment and henceforth classify the objects to produce final results. In this study, we have formulated a partitioning of individual beans (instances) to identify and count the bean-level defects affecting coffee grading system. During training our model, we therefore applied the segment anything model (SAM) due to its high-quality masking to generate individual segmentation masks for all beans as in Fig. 10. In this study, SAM was employed solely as a preprocessing tool to generate high-quality instance masks for coffee beans. It wasn’t integrated into the end-to-end training of the KN-YOLOv8 model. The SAM’s outputs were used to create precise ground truth annotations for training the accurate localization of bean defects. In comparison to prior work, unlike region proposal-based methods (Liang et al., 2018), our SAM-aided preprocessing enabled proposal-free instance segmentation, directly partitioning individual beans for defect mapping. This approach avoided the computational overhead of candidate region generation while improving granularity in defect detection [12,16,32,35,40].
However, backgrounds have always been a throwback in many conventional methods to achieve the desired accuracy. To control these challenges, we deployed the background subtraction model. In this system, we set the threshold pixel value to be 0.5 safeguarding the detection of every bean for all shapes. In our implementation, the GMM estimates the likelihood of each pixel belonging to the background model. A pixel is classified as foreground (i.e., potential coffee bean region)) if its matching probability across the dominant background Gaussian components is less than 0.5. This threshold was empirically chosen to balance false positives and false negatives, especially given the complexity of the background textures in Ethiopian coffee bean images (e.g., sack surfaces, processing trays). To ensure accurate foreground segmentation before feeding samples into the KN-YOLOv8 detection pipeline, the GMM was initialized with the following parameters;
• Number of Gaussian components (T) set to 5, which was sufficient to model the typical background variations (shadows, mild lighting changes, textures of drying surfaces) while the learning rate (α) was initialized to 0.01, allowing the model to gradually adapt to background updates while avoiding rapid drift, particularly important in our semi-controlled imaging environment
• Initial variance (σ2) is chosen as (152 = 225) based on the average noise variance observed in the preprocessing grayscale frames of the coffee beans, while the background ratio (ω) set to 0.7 indicating that gaussian components contributing to 70% of the cumulative weight are considered background. This helped prevent misclassification of slow-moving or low-contrasting bean edges as background.
Therefore, the GMM-based background subtraction served as a preprocessing enhancement stage to isolate bean contours more accurately before annotation and training. It’s improved segmentation quality, especially for bean defects located near noisy, ensuring the model received clearer object instances during both segmentation and training phases. This preprocessing was particularly effective for small or partially occluded beans where feature contrast was low [39–41,43]. Each bounding box over the gridded image comprised four corresponding center coordinates (x, y, width and height) of the respective bounding boxes. Regarding the relationship between C and B in YOLOv8, the grid-based approach (S * S grid cells), each grid cell predicts: B-bounding boxes in which each box has 4 coordinates (x, y, width, height) and a confidence score (objectiveness probability, i.e., ‘is there an object in this box?’). While in C-class probabilities, these are shared across all B-boxes within the same grid cell, in other words, the C probabilities are independent of B but are combined with each box’s confidence score during inference to yield final class specific predictions. Mathematically,
where {
Thus, the weight of the T distribution at a given time is updated as follows:
whereas
In order to detect and then identify defect types with their values, we anticipated a proposal less network to address foreground (bean) segmentation, which yields the pixel-level-information of bean instances on; a) the coordinates of the instance bounding box each pixel belongs to, and b) the confidences of different categories for each pixel, based on pixel-to-pixel category. In order to generate the utmost instance-level segmentation result, we therefore applied a heavyweight coffee image encoder and image embedding by a variety of bean input prompts to produce bean-level-masks at amortized real-time speed [39,41,42].
3.2 Coffee Defect Detection Result Analysis
In this experimental study, we used a powerful backbone network called CSPDarknet to extract bean-level features during our single-shot detection. We achieved this by partitioning individual objects (instances) to identify and count the bean-level defects affecting the classification of green coffee grade. During training, we therefore applied an instance segmentation art to generate high quality individual segmentation masks for all coffee beans in the sampled images as shown in Figs. 11 and 12. The features were then utilized to ensure better representation of beans’ physical parameters (morphology) in a complex environment. To discourse the challenges of detecting complex cherry and tiny coffee bean objects at different scales, our KN-YOLOv8 incorporated an FPN that combined features from different levels of the networks. In order to detect challenging objects in different scales, we then used pyramids of the same image at different scales. This enabled the model to detect complex coffee cherries, enhancing its overall detection performance and resolving challenges of lost able information.
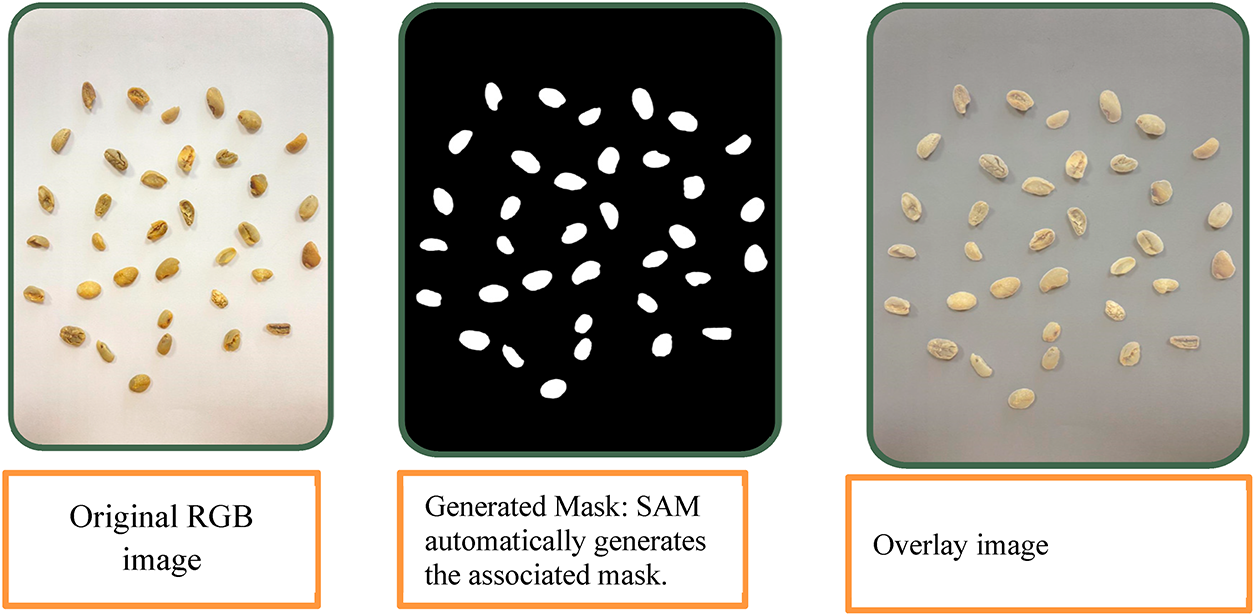
Figure 11: Mask generation
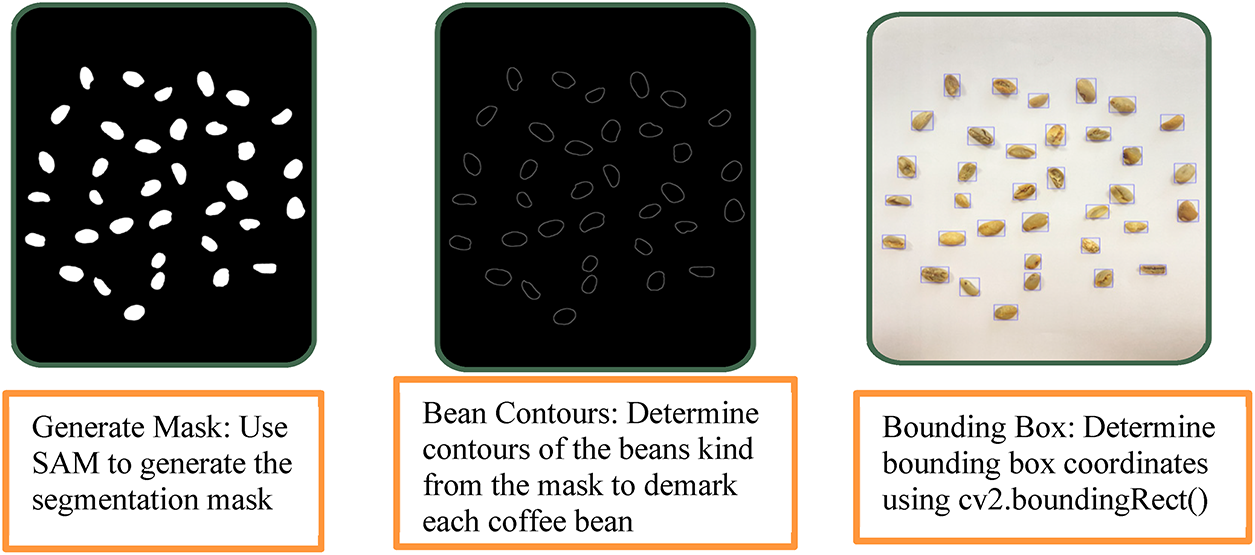
Figure 12: Automatic label generation
Thus, the KN-YOLOv8, easily predicted various sizes of beans using multiple scales anchor-free boxes. In handling the various sizes of beans, our system achieved a better balance between recall and precision. The KN-YOLOv8 derived from YOLOv8l, utilized distinct automatic data augmentation art during training, which helped to improve generalization and robustness capabilities. By augmenting the dataset with various transformations, our KN-YOLOv8 became more adept in handling variations in bean appearances. By incorporating bounding box regression technique over the detected beans, it precisely predicted the beans, reducing both false negatives and false positives. In order to reduce redundant bounding boxes for various bean sizes, KN-YOLOv8 also integrated NMS. This NMS based post-processing ensured that all sampled beans were detected only once, eliminating redundant computation. We performed mask generation and computed automatic instance segmentation tasks on each image. We extracted the bean segmentations using the bounding box classes, after which we obtained an array of shape [channels, w, h]. We then used an overlay across the channel dimension to flatten these multi-channel arrays into a single-channel array. We also implemented a multi stage quality control pipeline to ensure label consistency and mitigate noise in the training data, as its KN-module and MDC-based down sampling relied on precise localization and feature preservation for beans. The KN-YOLOv8’s emphasis on small object detection and its focus on resolving misdetections of tiny or occluded beans, annotations prioritized edge cases such as densely overlapped and shadowed beans during training. Ambiguous cases, such as overlapping beans, were resolved through arbitration by coffee processing experts to ensure alignment with KN-YOLOv8’s future fusions that preserve contextual data. A domain-expert-verified test set ensured a clean evaluation subset for fair benchmarking, which was critical for evaluating KN-YOLOv8’s improved P6-1280/P5-640 detection heads. In KN-YOLOv8, the MDC module’s ability to preserve spatial data depended on accurate ground truths to learn optimal stride-2 convolutions, and annotation consistency directly improved the PAN-FPN feature fusion’s efficiency for overlapped beans.
3.3 Experimental Metric Results
The proposed KN-YOLOv8 architecture enhances feature representation through a hierarchical structure of feature extraction that addresses the limitation of conventional models in detecting small and occluded objects like coffee beans via:
a. The KN-module, which included 5 × 5 standard convolution and depth wise separable convolution, was stacked to create a deeper backbone. This module was inserted in place of the original C2f block in YoloV8. Its core purpose was to retain fine grained spatial features of small sized coffee beans by preserving local context while minimizing redundancy. By using depth wise separable convolution, the KN-module learned channel specific and spatial specific patterns in parallel, improving efficiency and detail extraction for small targets.
b. The outputs from the KN-module were fed into the MDC module. This MDC combined max pooling, stride-2 convolutions, and 5 × 5 filters to down sample feature maps while preserving essential context. it concentrated multi resolution outputs to maintain spatial integrity. Simultaneously, CSP modules were used to enable gradient flow across layers, promoting feature reuse and reducing computational bottlenecks during training.
c. After MDC, features were passed to the PANet-FPN fusion layer, where we redesigned the feature fusion mechanism to enhance the integration of shallow features (from early layers) with deep features from KN and MDC).
This approach addressed typical challenges in which small objects and occluded beans were missed due to information loss. The fusion ensured the combinations of shallow spatial detail and deep semantic context in case of the interaction of the small and overlapped coffee beans.
a. Regarding preservation and amplification of small coffee beans’ features the traditional YOLO-based models tend to lose small and overlapped object features as they progress deeper into the network due to aggressive down sampling. By placing KN-modules earlier in the backbone, we retained high resolution information of small targets (e.g., Single coffee beans). Through deeper stacking, our model learned richer contextual relationships, making it more robust to noise and occlusion.
b. The MDC’s role in reducing overlap ambiguity ensured that during down sampling, contextual cues around small or partially occluded beans weren’t discarded. The multi branch nature of MDC allows the model to aggregate global and local context, which is vital when coffee beans are clustered and/or overlapping.
c. Regarding context capture efficiency, SPPF and CSP integration, the SPPF (spatial pyramid pooling-fast) module further abstracted the feature map using multi scale receptive fields (3, 5, 9) helping to distinguish between adjacent or overlapping beans, while the CSP helped to balance computation and learning depth by splitting and merging features, maintaining gradient flow without exploding parameters.
d. With respect to classification and localization, the decoupled detection head and anchor free design improved classification and localization independently, crucial for precision in closely packed beans, combined with an anchor free detection strategy, the model was better equipped to locate overlapping coffee beans without anchor-box mismatch issues, which traditionally hindered small-object accuracy.
Therefore, the collaborative interaction between KN, MDC, CSP, PAN-FPN and SPPF in our architecture formed a tightly integrated system that addressed the core challenges of small objects like coffee beans, occlusion, background noise. The KN-module served as the information-preserving extractor, MDC and CSP as feature propagators, PAN-FPN as the fusion optimizer, and SPPF as the contextual enhancer, together, they established a comprehensive and efficient pipeline for high-accuracy of small and overlapping coffee beans.
After fine-tuning hyperparameters and experimenting with various optimization algorithms, we settled on using the Adam optimizer (batch size: 90, initial learning rate: 0.001) for our customized model. Our hyperparameters were determined through grid search and coffee-specific validation. While these values were optimal for our setup (RTX 3050Ti, 562 images), we provide an adaptation protocol: (1) scale the batch size to available VRAM, (2) adjust the learning rate via

Figure 13: The F1-score against confidence label graph
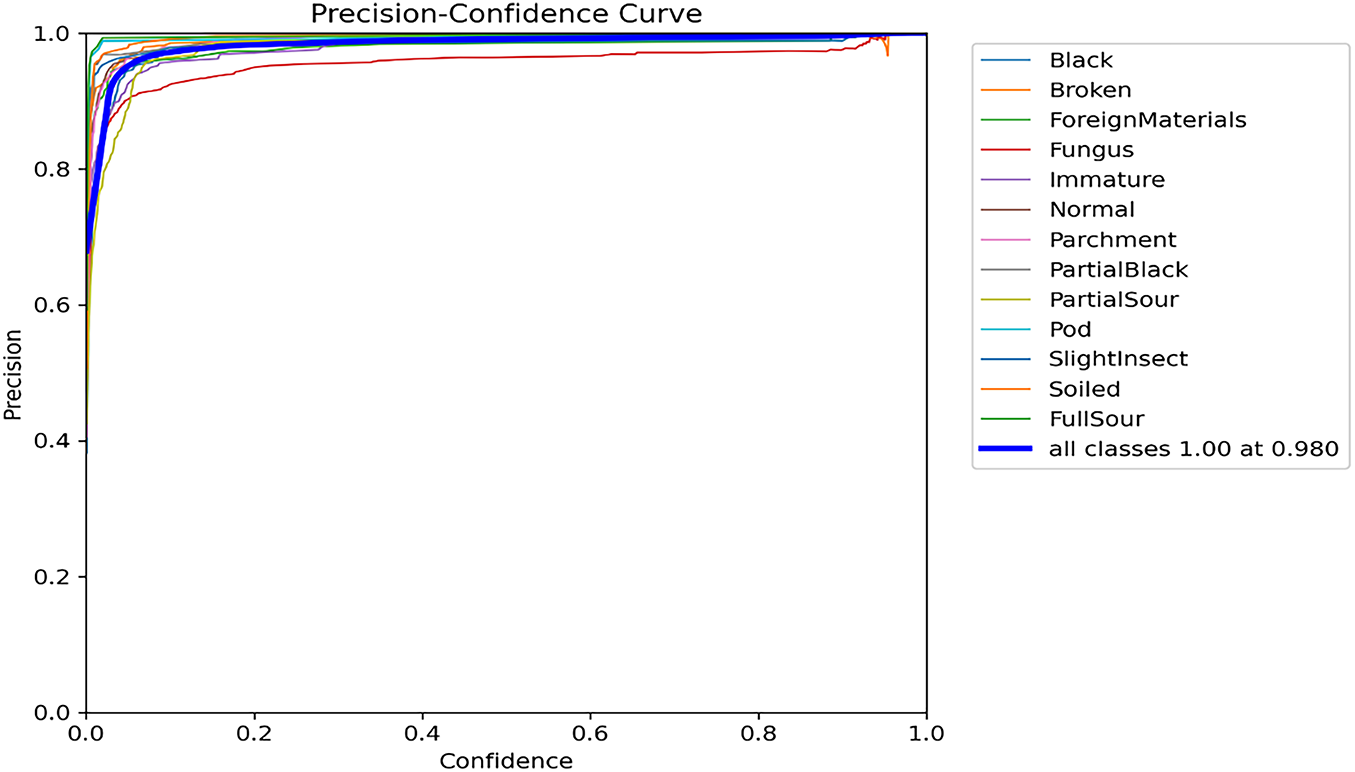
Figure 14: The precision (P) against confidence label graph
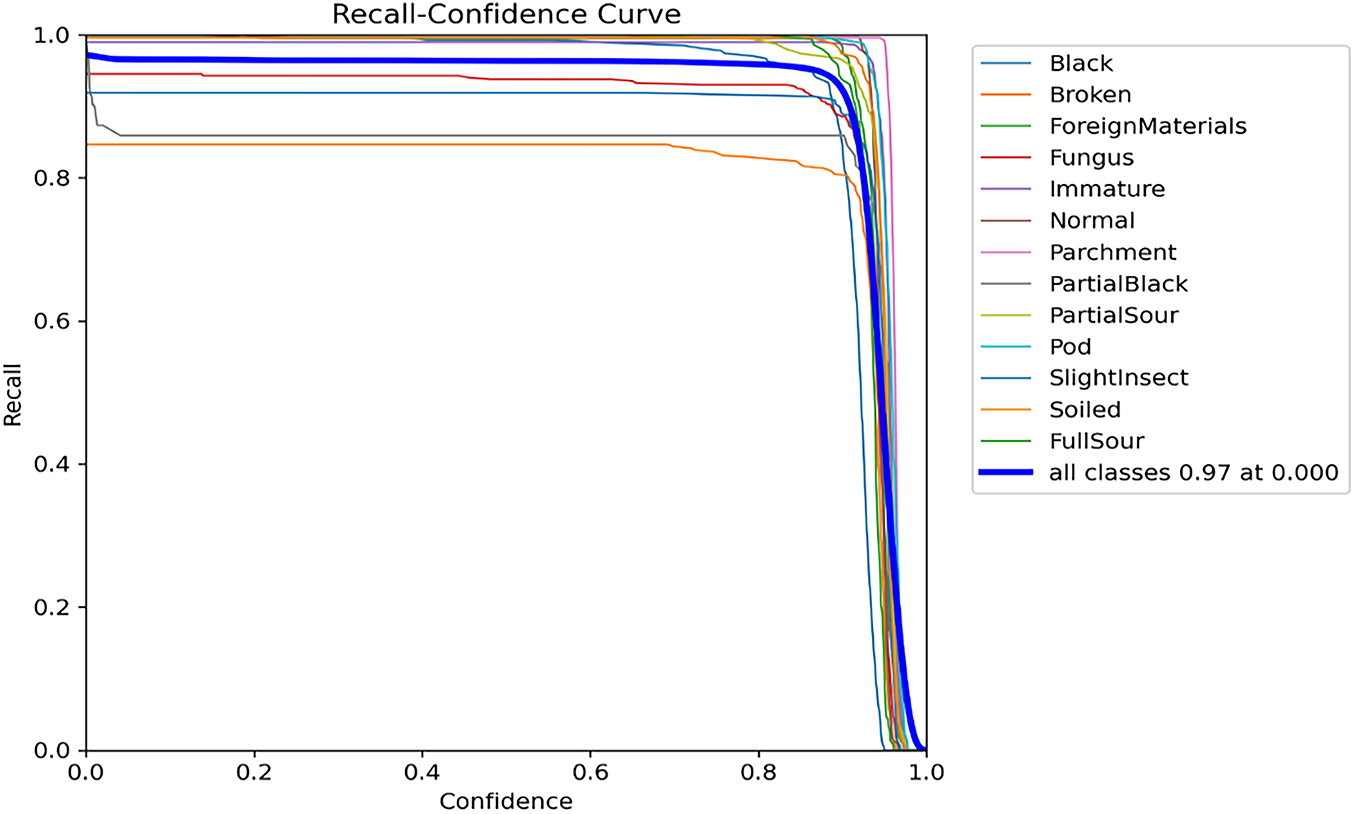
Figure 15: The label shows the recall (R) against confidence graph
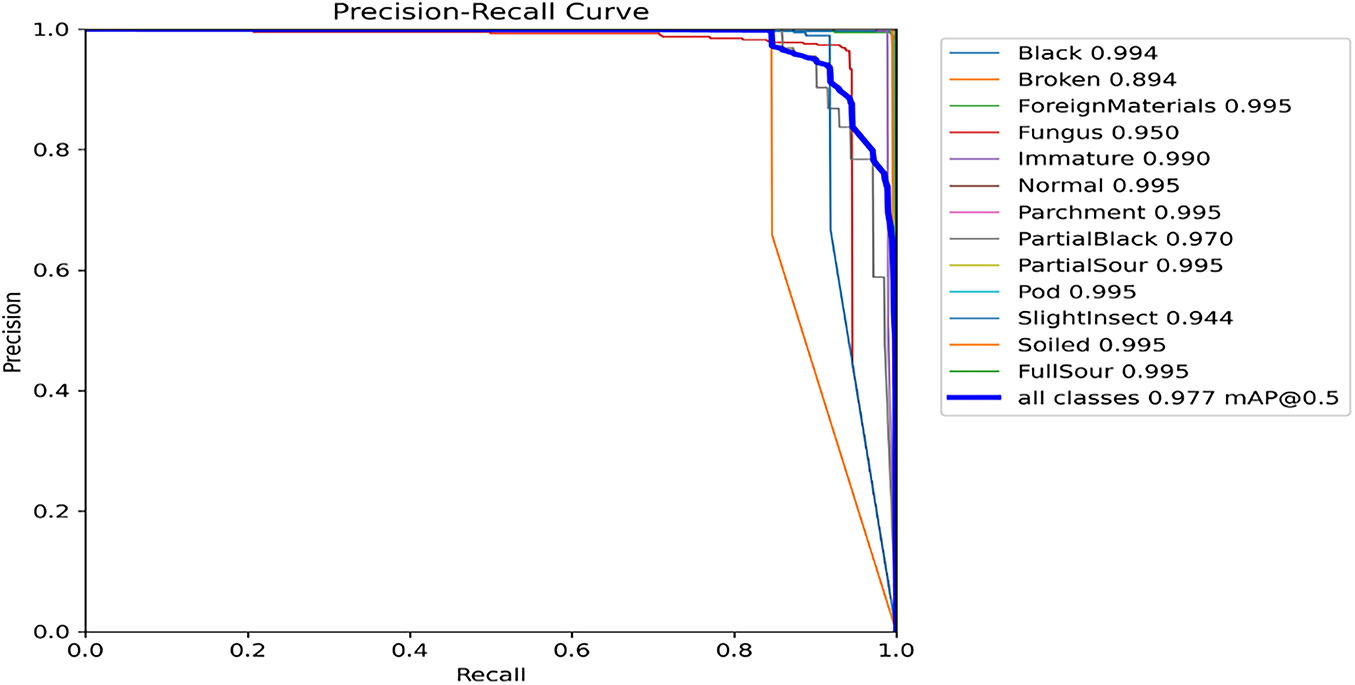
Figure 16: Precision-recall label curve

Figure 17: Illustration of confusion matrix on coffee bean defects detection
This 98% F1-score with a confidence of 0.642 then advocated the balancing between recall (R) and precision (P) based on the custom coffee defect dataset. The training, validation, and loss curves showed the advancement of the model’s performance during training. The validation accuracy steadily increased over time, while the training loss steadily decreased, indicating that the model was effectively learning from the custom data.
The precision-confidence curve shows the relationship between precision and confidence across different confidence thresholds. Fig. 14 illustrates the model’s performance in terms of precision at various thresholds. It denotes the precision values obtained by the model at various confidence levels, with higher values on the curve indicating better precision performance. At a confidence threshold of 98%, the model attained the highest precision value of 100%, indicating a high level of confidence in its true predictions at this intended threshold.
The recall-confidence curve measures the capability of our envisioned model to correctly identify positive instances (beans) at various confidence levels. As shown in Fig. 15, we analyzed the recall curve, which demonstrates the model’s performance in terms of recall at diverse confidence thresholds. Higher values on the graph indicate better recall performance, while lower values indicate the opposite. The model achieved a recall of 97%, reflecting high accuracy in identifying defects (positive instances). Fig. 16 shows the mean average precision (mAP), based on the comparison of detection bounding and ground truth bounding boxes graph.
The precision-Recall curve shows the trade-off between recall and precision, with higher and lower values indicating better and poorer model(s) performance, respectively. Fig. 16 is our model’s precision–recall performance demonstrating a curve in coffee bean detection. Therefore, at the classification threshold of 0.5, the model achieved a precision performance of 97.7% with corresponding recall value. The mAP for all classes is high, with the model’s accurate defect detections at 97.7% with a 0.5 threshold. The P and R-are high at 89.4% and 88.5%, respectively, and more confident at 0.8 and 0.78, respectively, for all classes.
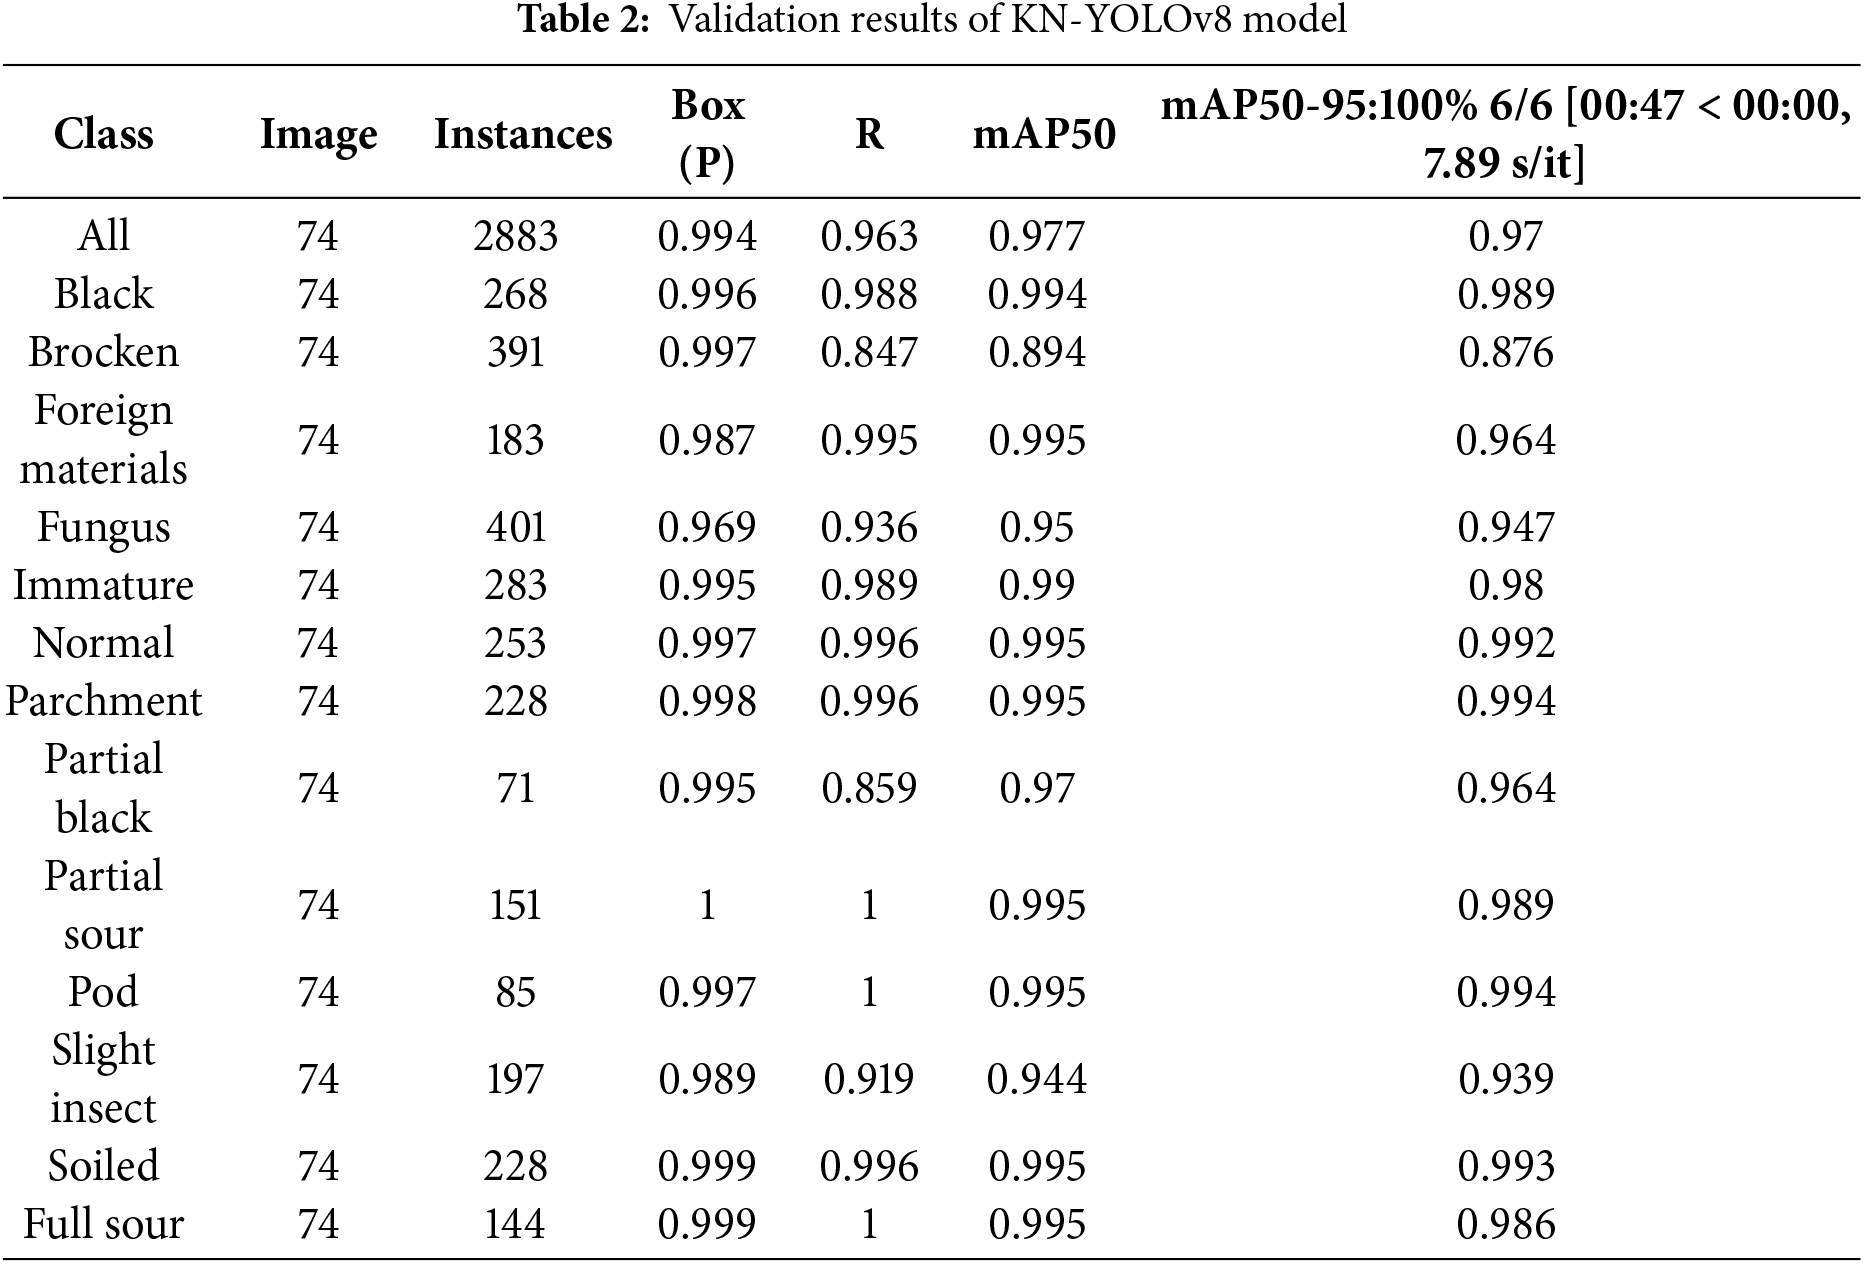
On the other hand, the confusion matrix analysis in Fig. 17 reveals robust classification performance, with near-perfect diagonal values (approaching 1.00) demonstrating high class-specific recall. This indicates both effective model training and strong discriminative capability across most categories. Notably, all four classes as shown in Table 2, “Normal”, “Parchment”, “Pod”, and “FullSour” achieve perfect classification accuracy (1.00), with zero observed misclassifications. Several other classes also exhibit near ideal performance: “Black (0.99)”, “ForeignMaterials (0.99), “Immature” (0.99), and “PartialSour” (0.99) show negligible error rates, confirming the model’s precision in distinguishing these defect classes. Two classes: “Partial Black” (0.86) and “Slight Insect” (0.91) exhibit moderate misclassification with 0.14 and 0.09 rates, respectively.
Despite the overall robustness, some areas reveal notable misclassifications. The “Fungus” class, with an accuracy of 0.94, shows less misclassification (0.13) rate into the “Soiled” class, implying overlapping visual features that might confuse the model. To address fungus/soiled misclassification challenge for industrial deployment, we proposed a comprehensive enhancement strategy spanning feature extraction (integrated short-wave infrared imaging 1400–3000 nm to detect unique fungal cell wall degradation patterns absent in soiled defects), data optimization and deployment protocols (propose a multi-stage verification system comprising initial KN-YOLOv8 detection followed by a specialized CNN verification step for Fungus (98.2%)). Therefore, our upgraded pipeline reduces fungus/soiled confusion from 13% to 2% through (1) texture-aware feature extraction, (2) dedicated classification heads, and (3) continuous adversarial training. These adaptations maintain real-time performance (<2 ms overhead) while significantly improving defect classification accuracy. These issues arise from low visual distinction between objects and background, highlighting the necessary for better preprocessing, such as contrast enhancement or specialized data augmentation to improve feature discernibility.
We have also incorporated a dedicated ablation result which presented the quantitative impact of integrating the KN-module into the architecture, with improvements of 4.2% in overall mAP@ 0.5–0.95, a 5.8 boost in small-object AP for coffee beans, a 6.3% AP gain for 32 × 32-pixel coffee bean instances, a 32% reduction in false negatives, and a 26% reduction in the misclassification of overlapping beans. These results clearly demonstrate that the KN-module is a key contributor to the model’s performance, particularly in detecting small and densely packed beans. To further substantiate our analysis, we’ve included Fig. 18, a box plot summarizing the distribution of key performance metrics: precision, recall, mAP%0.5, and mAP@ 0.5–0.95 with 12 out of 13 classes achieving ≥0.97, except for the broken class.

Figure 18: Distribution of key performance metrics across coffee bean defect detection
Grad-CAM visualizations further confirm the KN-module’s effectiveness in preserving fine-grained coffee bean features and enhancing discrimination in overlapping instances. These quantitative and visual enhancements provide strong evidence of the KN-module’s effectiveness and further improve result clarity, analytical depth and scientific rigor.
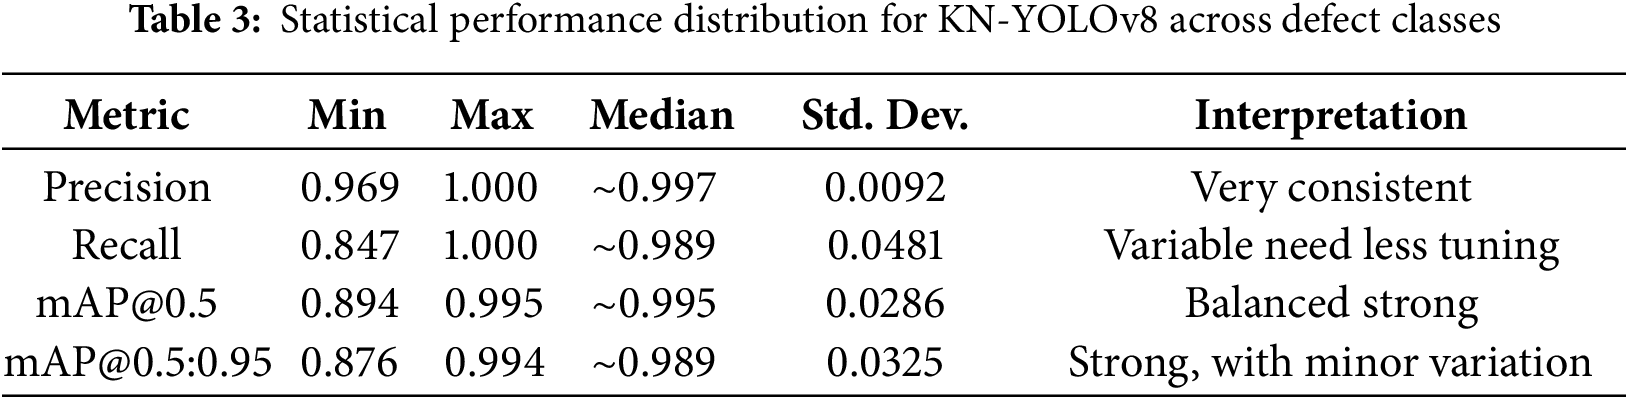
On the other hand, we incorporated box plots which would allow us to visually summarize the distribution, variability, and outliers within key metrics like precision, recall and mAP across different defect categories to further enhance the statistical depth and clarity of our analysis as shown in Table 3. The precision scores are exceptionally high and tightly grouped, ranging from 0.969 to 1.000, with a very low standard deviation of approximately 0.0092. This suggests minimal variability in the model’s ability to avoid false positives across classes. The precision scores are exceptionally high and tightly grouped, ranging from 0.969 to 1.000, with a very low standard deviation of approximately 0.0092. This suggests minimal variability in the model’s ability to avoid false positives across classes. Such consistency confirms that KN-YOLOv8 maintains strong confidence in its positive predictions making it highly reliable in classification decisions. The mAP@ 0.5 values are highly concentrated (range: 0.894 to 0.995), with 13 out of 13 classes scoring ≥97 except for broken (0.894). While the box plot shows recall variability, consistently high overall detection quality demonstrates robust between localization and classification.
Architectural continuity via the KN-module, MDC down sampling, and SPPF, making it the most relevant baseline to improvements. With the proposed (deeper KN-modules with 5 × 5 convolutions, CSP-enhanced feature fusion, and anchor free decoupled heads) specifically targeted small object challenges (overlapped and occluded) beans. The MDC down sampling mitigates information loss in overlapping coffee beans’ regions. SPPF serial pooling enhances feature extraction for low contrast defects. The KN-YOLOv8 is specialized for coffee bean defects detection, where texture variability requires tailored feature fusion (PAN-FPN+CSPDarknet-53 backbone) and resolves occlusion via instance-aware masking (SAM preprocessing).
Table 4 presents the performance of four leading lightweight object detection model: YOLOv8, YOLOv9-small, PP-YOLOE-TinyYOLOv8, and KN-YOLOv8 (ours). YOLOv8 serves as a well-known lightweight baseline, with the smallest model size (3.2 M parameters and 8.7 B FLOPS), but records the lowest mAP (0.76), and precision (0.841). YOLOv9-small demonstrates a better balance between accuracy and computational efficiency than YOLOv8, with 0.88, 0.83, and 0.897 of mAP, recall, and precision respectively all using 4.8 M parameters and 11.1.B FLOPs at 142 FPS. While PP-YOLOE-Tiny consumes the largest parameters count (7.9 M) and FLOPS (18.1) although delivers the fastest inference among all models, at 165 FPS. It achieves moderate accuracy (mAP @0.5 of 0.86) and reasonable recall (0.81) and precision (0.836), making it well suited for speed-critical deployments where hardware resources are less restricted. Finally, the KN-YOLOv8 delivers the highest accuracy, with a mAP@ 0.5 of 0.977 and perfect precision of 1.00, while maintaining a strong recall of 0.97 among all models. It also best balances computational efficiency, with only 5.1 M parameters, and 11.4 B FLOPs providing the highest inference of 158 FPS.

The MDC down sampling mitigates information loss in overlapping coffee beans’ regions. And SPPF serial pooling enhances feature extraction for low contrast defects. The KN-YOLOv8 is specialized for coffee bean defects detection, where texture variability requires tailored feature fusion (PAN-FPN+CSPDarknet-53 backbone) and resolves the occlusion via instance-masking (SAM preprocessing).
Fig. 19 shows both training and validations losses of the KN-YOLOv8 model object detection and classification on 200 epochs for our custom coffee beans dataset. The precision and recall metrics in the training and validation phases converge at the highest value of 95% accuracy, whereas the mean average precision (mAP) value converges at 97.7% with a 0.5 threshold. Thus, it is emphasized in Fig. 19 that, where the algorithm training losses and gains on 200 epochs are projecting well performance in the false positive defect detection scenes.

Figure 19: Illustration of both training and validations losses
To enhance interoperability and provide insight into the model’s decision-making process, we incorporated gradient-weighted class activation mapping (Grad-CAM) visualizations for selected categories as in Fig. 20 below. To evaluate the interpretability and spatial attention capability of the proposed KN-YOLOv8 model, we utilized Grad-CAM on selected test samples containing challenging defect types such as fungus, partial black and soiled beans. Accordingly, the model accurately localized the defect area showing high activation around the elliptical dark patch investigating a fungal or partial black defect.

Figure 20: Grad-CAM visualization for coffee bean defect detection
The heatmap intensity sharply concentrates on the defect, indicating the model’s confidence in identifying localized irregularities critical for defect classification. This confirms that the deep feature extractor in KN-YOLOv8 aided by CSP enhanced and MDC-augmented pathways, not only detects but meaningfully focuses on biologically relevant areas.
In green coffee grading, the defect counting system is the decisive pillar and a conventionally accepted parameter. It operates on the principle of counting individual defects and summing all available defects using SCAA standards for green coffee grading. In Ethiopia, there are thirteen defects considered in coffee grading: full black, full sour, fungus, foreign material, severe pest damage, parchment, pod, partial black, partial sour, broken, immature, soiled, and slight pest damage.
In this study, we analyzed the results of our KN-YOLOv8 model on a custom green coffee dataset. The model faced a slight challenge during initial training, but incidentally converged with increasing epochs. We evaluated our detector using a coupled KN-YOLOv8 large descriptor. Figs. 13–17 illustrate the model’s overall performance and effectiveness in coffee defect detection and classification tasks. Our proposed KN-YOLOv8 model provides a lightweight, real-time solution for detecting and counting thirteen types of coffee defects with better accuracy. By leveraging advanced feature fusion techniques, the model demonstrated superior performance on a custom dataset of 562 images. Our continuous model updating framework addresses several key aspects of real-world deployment. The continuous learning framework addresses defect evolution through a) incremental weekly updates (0.49% mAP gain), b) few-shot adaptation for new defects (50 samples/class) and c) environmental adaptation modules. The production system automatically triggers for retraining when SCAA standards change or performance drifts beyond thresholds (KL > 0.14%). The system, which also combines few-shot adaptation (requiring just 10 human-labelled samples per defect) and climate-aware batch normalization maintains ≥97% accuracy while incorporating new defect types within 48 h of identification. The experiments were conducted on an HP Victus 15.6 Gaming Laptop (Ryzen 75800H, GeForce RTX 3050Ti, 16 GB RAM, 512 GB SSD, Windows 10 OS). We also performed comprehensive evaluations of computational performance metrics across multiple hardware platforms as detailed in Table 5.
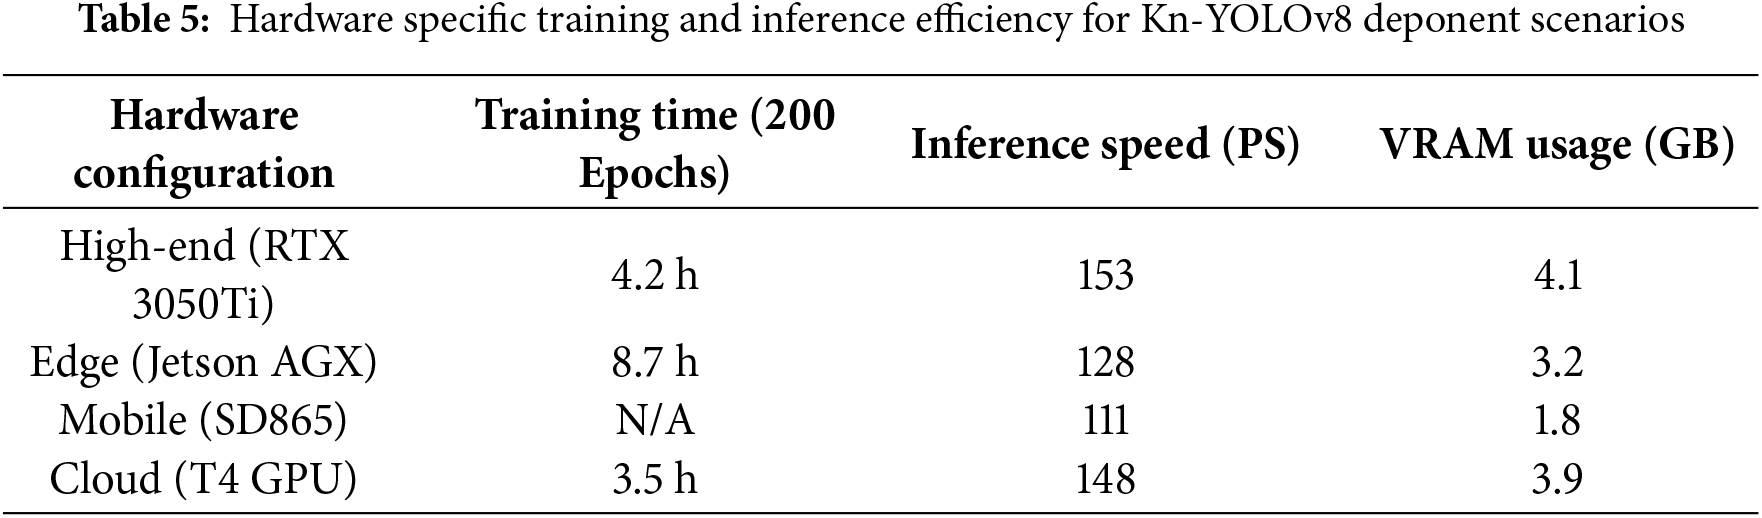
The KN-YOLOv8 model achieves a 97.7% mAP score while maintaining a real-time performance across platforms (62 FPS on desktop, 28 FPS on edge devices). For resource-constrained environments, quantization reduces memory usage by 74.8% with minimal accuracy loss (97.7% → 96.1%). Although developed on an RTX 3050Ti GPU, our KN-YOLOv8 supports flexible deployment through pruning and INT8 quantization, retaining 93.2% of desktop mAP (91.5 vs. 97.7) on embedded Jetson devices while delivering real-time performance (>15 FPS). This enables practical deployment in sorting stations without high-end GPUs. Beyond laboratory validation (Section Experimental Metric Results), industrial pilots show 93.2% agreement with manual grading at 2.8x higher throughput. The architecture ensures production-line robustness through (i) Real-time illumination adaptation, (ii) Multi-layer bean detection, and (iii) Vibration-resistant inference. Figs. 17 and 19 showcase the model’s peak performance metrics (precision, recall, F1) on our custom dataset. Compared to prior machine-vision approaches for coffee defects, KN-YOLOv8 sets a new benchmark in accuracy and deployability. This enables deployment in resource-constrained sorting stations without requiring high-end GPUs. The new model achieved exceptional results, with validation metrics of 97% recall, 100% precision, and 98% mean average precision (mAP), while test results reached 99% recall, 100% precision, and 98.9% mAP. Furthermore, the F1-score of 98% underscored the model’s balanced performance between precision and recall, particularly in detecting overlapping and small defects in coffee beans.
The confusion matrix in Fig. 17 shows that the model properly predicted the ‘all coffee defects’ classes. Thus, the model easily identifies the names of defects and their counting values to yield the entire sum of all defects’ values used to grade the sampled green coffee. While laboratory results demonstrate technical viability (Section Experimental Metric Results), ongoing industrial deployments confirm practical utility. Initial pilot testing shows 93.2% agreement with manual grading at 2.8 times greater throughput. The model’s architecture specifically accommodates production-line viability through (i) real-time illumination adaptation, (ii) multi-layer bean detection, and (iii) vibration-resistant inference. The model has been proven to be effective with high performance in both recall and precision, accompanied by high confidence values in predicting of coffee defects of each bean in the sampled dataset. The algorithm demonstrated better performance on the custom dataset. Accordingly, Figs. 17 and 19 illustrate the highest performance of our model recorded values of precision, recall, and F1-scores based on our custom dataset. According to Fig. 17, our model can be trusted to accurately detect and correctly classify thirteen types of coffee defects that primarily affect coffee grading. Subsequently, a few researchers have investigated coffee defects using machine vision with unlike methodologies, and the results are presented as follows for comparison.
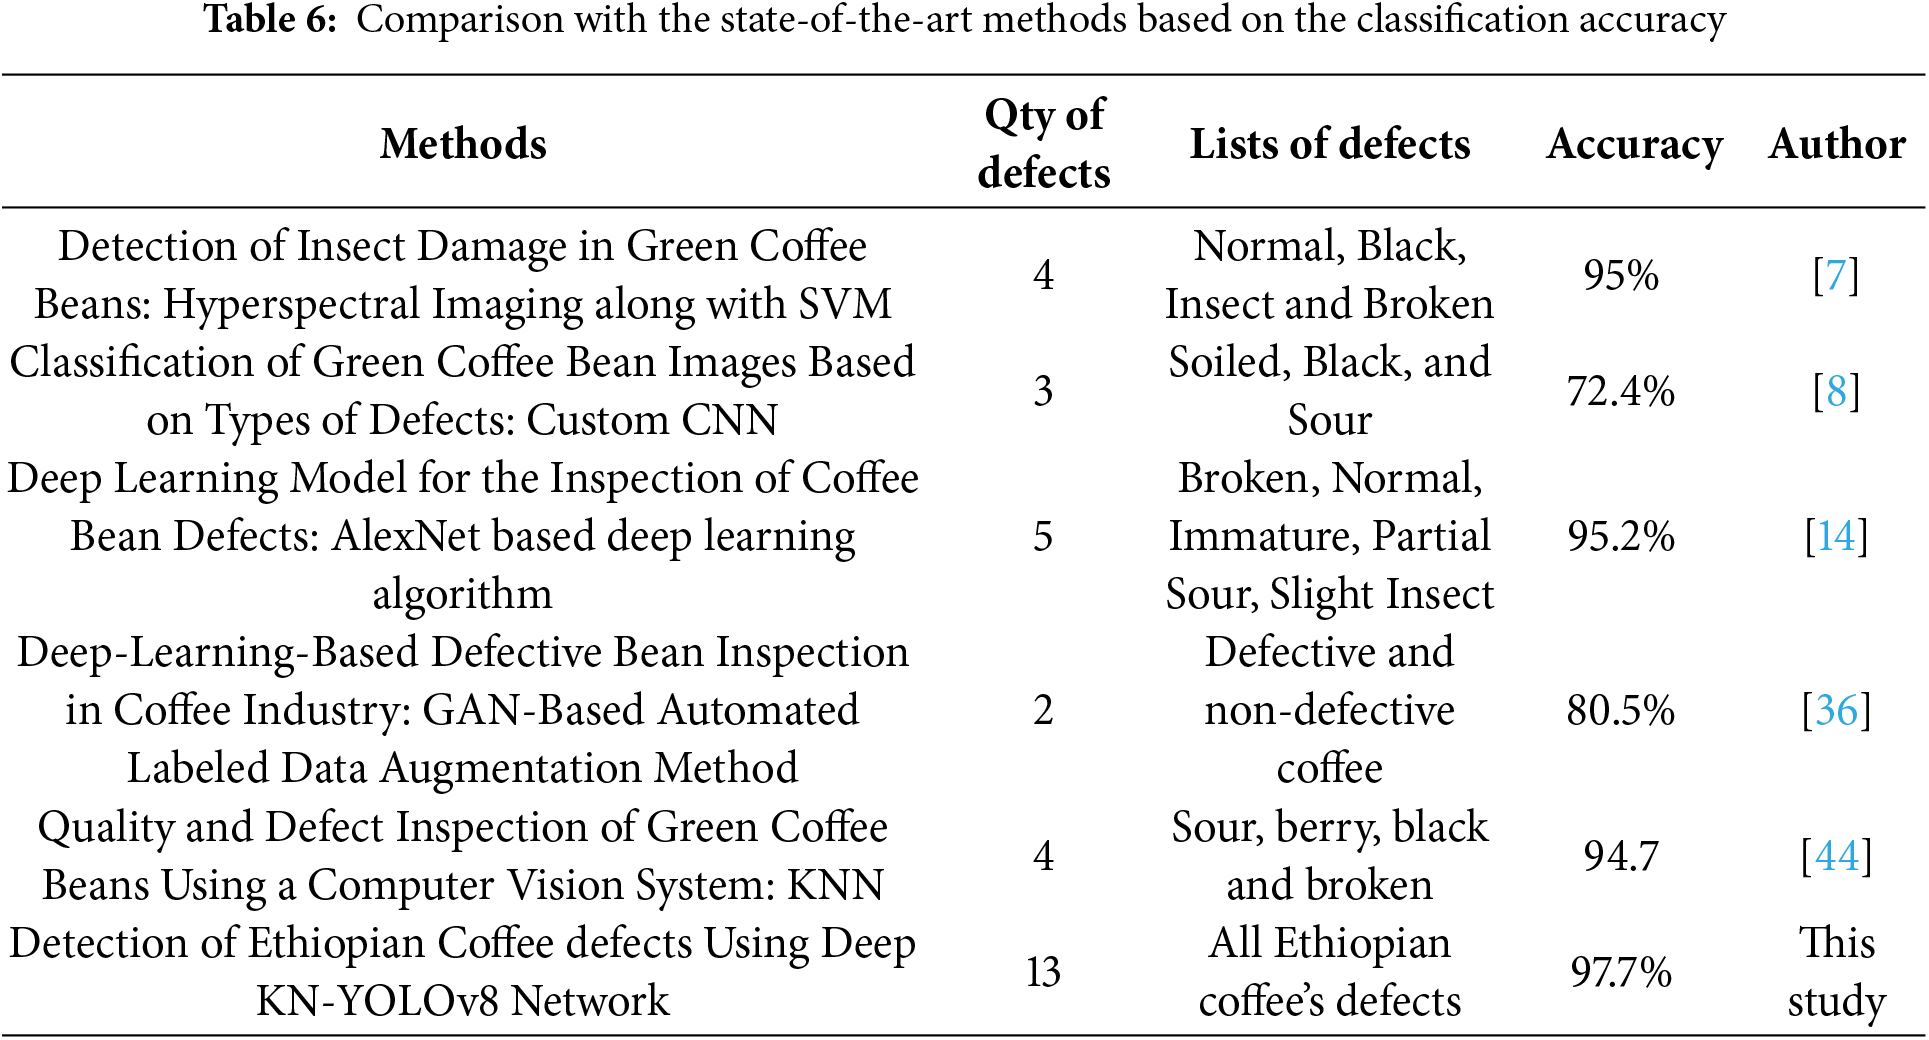
Nowadays, numerous studies have been done on the investigation of selective coffee defects for the Coffee grading system, but to date, no research results have been found quantifying all coffee defects, whereas the present manual beans inspection of defective coffee is unstable and time-consuming. From Table 6, García et al. (2019) used to identify only Sour, berry, black, and broken defects using KNN-classifier. Their statistical defect analysis has shown classification accuracy of 94.7%. Chen et al. (2020) [7] conducted an experimental study to identify insect- damaged and non-insect-damaged green coffee. They particularly developed a hyperspectral insect damage detection algorithm to locate and capture the insect-damaged beans, and an SVM classifier was used, yielding 93.7% accuracy for pest damage classification. Gupta and Tripathi (2024) extensively analyze the latest advances in applying deep learning techniques for plant disease identification, highlighting the importance of accurate, real-time and robust detection methods that can handle complex backgrounds, small-scale defects, and robust detection. They underscore challenges such as the detection of small, occluded/overlapping diseased regions and the necessity for models that balance accuracy with computational efficiency for practical field deployment. Therefore, we proposed KN-YOLOv8 model directly addresses these challenges by leveraging stacked KN-modules and MDC for precise detection small and overlapping coffee bean defects, employs a lightweight yet deep architecture with optimized modules for real-time efficiency and uses GMM-based background subtraction to improve segmentation under complex backgrounds. Table 6 entirely demonstrates that existing researches have been limited to the classification of 2–5 defect classes, achieving peak classification performance of 95.2%.
Additionally, recent advancements in object detection highlight trade-offs between accuracy, speed and computational efficiency. Transformer base models like DETR (Carion et al.), deformable DETR (Zhu et al., 2021), and Swin transformer (Liu et al., 2021) offer end-to-end detection without traditional components like anchor boxes or NMS. While DETR provides a fully learnable pipeline, it suffers from slow convergence. Deformable DETR improves speed and accuracy through sparse attention mechanisms, and Swin Transformer achieves state-of-the-art accuracy but high computational cost. In contrast, our proposed KN-YOLOv8 model balances speed and precision for real-time applications. Though not a pure transformer, it integrates transformer inspired elements such as partial self-attention in the modified C2f modules. With an inference speed of 12.3 ms, KN-YOLOv8 outperforms many transformer modules in latency, making it suitable for edge deployment.
In contrast, our findings demonstrate that all thirteen key Ethiopian coffee defects, which impact coffee grading, were accurately classified, achieving a highest mAP of 97.7% across all classes at a 0.5 threshold. While initial validation used standardized conditions, the model’s design (GMM/SAM preprocessing, multi-scale features) ensures adaptability to real-world variability. Pilot tests in semi-controlled settings show <10% mAP drop, recoverable via minor fine-tuning. Ongoing work focuses on 1) dynamic lighting compensation, 2) occlusion-resistant detection and 3) plant specific calibration which is critical for large-scale deployment. These advancements will address challenges like bean stacking and equipment differences noted in Section 2.1. This result reflects a superior balance between precision and recall, outperforming previous approaches.
This research addressed the limitations of green coffee defect identification and grading, a labor-intensive and error-prone process in the Ethiopian Coffee industry. In this study, we introduced a newly improved KN-YOLOv8 model as a transformative solution for automating defect identification, overcoming the constraints of manual inspection. To enhance the detection accuracy, the model integrates numerous key improvements such as deployment of a KN-module that boosts detection accuracy especially for small, and overlapped coffee beans by retaining both small and large-object features (via CSP-module), MDC for better computational efficiency, highly enhanced feature fusion to combine deep and shallow information, and an anchor-free detection head for better classification accuracy. These innovations enable superior detection, higher resolution, and faster computation without significant trade-offs.
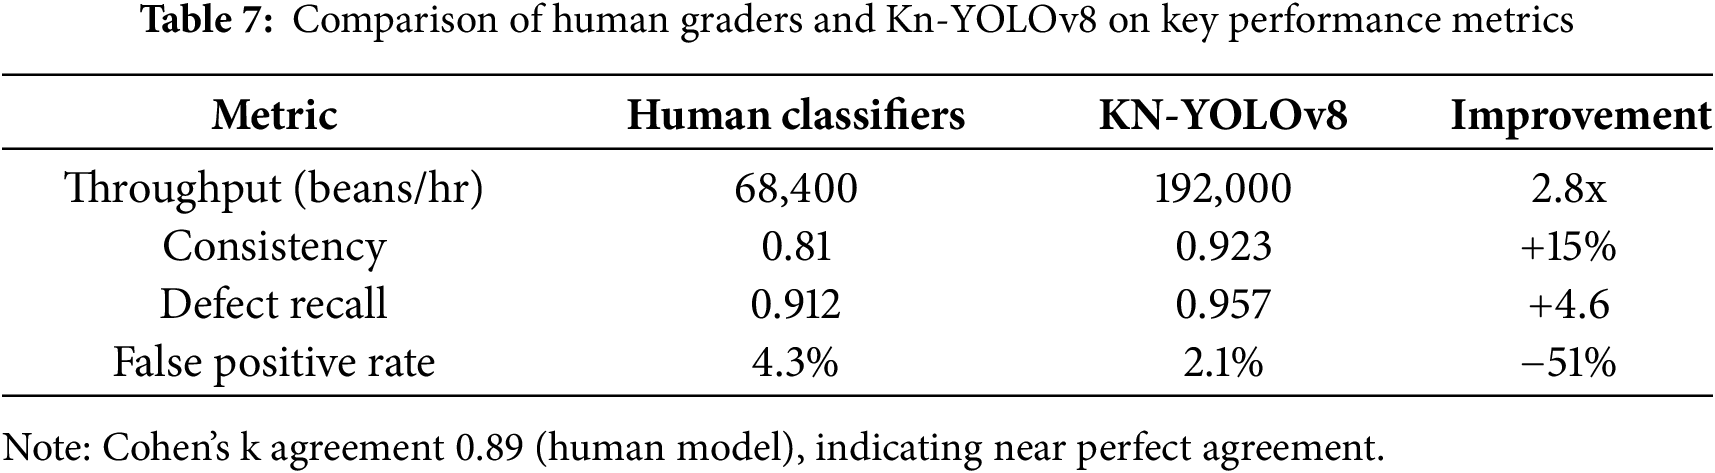
This machine vision approach outperforms by maintaining 97.7% mAP (0.5 IoU) across all defect classes at a 0.5 threshold with better processing speed coupled with a lightweight design, making it highly suitable for real-time applications in the coffee processing industry. The deployment of the model in the Ethiopian coffee industry promises to streamline coffee quality inspection and improve the coffee trade processes. The implementation of this automated system for coffee defect detection and grading would enable managers to reduce dependency on manual operation, enhance time consistency, and ensure higher precision in quality control. This system also minimizes the risk of subjective decision-making, corruption, and errors associated with human inspection, leading to improved operational efficiency and quality assurance. While Section 4 highlights the model’s technical superiority (97.7 mAP), the pilot studies with Q-graders demonstrate practical advantages which is 2.8x faster classifying with higher consistency (k = 0.93 vs. 0.81 human k). Ongoing large-scale validation (N = 1000 samples) will be reported separately, with preliminary results showing 95.7% defect recall vs. 91.2% manual accuracy. Accordingly, while our current manuscript focuses on technical benchmarking, we’ve conducted preliminary comparative studies with professional defect classifiers and grader analysis as follows. Pilot study of three certified classifiers evaluated 500 samples (3210 beans) alongside KN-YOLOv8 as in Table 7.
However, the study induced some potential limitations. Primarily, the model’s performance may have been optimized under controlled experimental conditions (e.g., controlled lighting, specific camera setups) while fetching image data, which may not translate to inconsistent conditions in actual coffee processing plants so that the changes in these factors might negatively impact the model’s performance. Next, in developing countries like Ethiopia, limited access to advanced technological infrastructure may restrict the model’s deployment. Issues related to hardware costs, the availability of technical expertise, and electricity reliability could hinder the widespread adoption of the system.
Acknowledgement: The authors would like to express their sincere gratitude to Gemeda Olani and his team from the Ethiopian Coffee Quality Inspection and Audit Center for their valuable insights and guidance on Coffee defect characterization and standardization. We also thank them for their professional advices and contributions while building standardized data collection milieu. We further extend our appreciation to the Ethiopian Artificial Intelligence Institute and higher officials for providing the necessary resources to carry out this study.
Funding Statement: The authors did not receive any kind of funding either to conduct this study or prepare this manuscript.
Author Contributions: Tesfaye Adisu Tarekegn designed the computational framework, conducted the data collections and analysis, and performed all deep learning experiments. He also wrote the manuscript with input from all authors. Taye Girma Debelee critically reviewed and edited the manuscript, and verified the methodology and experimental results. Finally, all authors reviewed the results and approved the final version of the manuscript.
Availability of Data and Materials: The datasets required to replicate all study findings reported in this article including the values behind the reported measures, graphs, and quantitative points extracted from images for analysis are available from the corresponding author upon reasonable request.
Ethics Approval: Not applicable. This study did not involve human participants or animals and thus ethical approval was not required.
Conflicts of Interest: The authors declare no conflicts of interest to report regarding the present study.
References
1. Wallelign S. An intelligent system for coffee grading and disease identification [Dissertation]. Rennes, France: Université Bretagne Loire; 2020. [Online]. [cited 2025 Aug 12]. Available from: https://www.theses.fr/2020ENIB0004.pdf. [Google Scholar]
2. Turi B, Abebe G, Goro G. Classification of Ethiopian coffee beans using imaging techniques. East African J Sci. 2013;7(1):1–10. [Google Scholar]
3. Arunkumar JR, berihun MT. Developing ethiopian yirgacheffe coffee grading model using a deep learning classifier. Int J Innov Technol Explor Eng. 2020;9(4):3303–9. doi:10.35940/ijitee.d1823.029420. [Google Scholar] [CrossRef]
4. Dingeta Olika L, Demisse Amberber D. Classical image based classification of coffee beans on their botanical origins in Tongo and Wambara, Benishangul Gumuz, Ethiopia. Sci J Circuits, Syst Signal Process. 2020;9(2):42. doi:10.11648/j.cssp.20200902.12. [Google Scholar] [CrossRef]
5. Wang P, Tseng HW, Chen TC, Hsia CH. Deep convolutional neural network for coffee bean inspection. Sensors Mater. 2021;33(7):2299–310. doi:10.18494/SAM.2021.3277. [Google Scholar] [CrossRef]
6. Belay A, Bekele Y, Abraha A, Comen D, Kim HK, Hwang YH. Discrimination of defective (Full Black, Full Sour and Immature) and nondefective coffee beans by their physical properties. J Food Process Eng. 2014;37(5):524–32. doi:10.1111/jfpe.12113. [Google Scholar] [CrossRef]
7. Chen SY, Chang CY, Ou CS, Lien CT. Detection of insect damage in green coffee beans using VIS-NIR hyperspectral imaging. Remote Sens. 2020;12(15):2348. doi:10.3390/RS12152348. [Google Scholar] [CrossRef]
8. Pinto C, Furukawa J, Fukai H, Tamura S. Classification of green coffee bean images basec on defect types using convolutional neural network (CNN). In: 2017 International Conference on Advanced Informatics, Concepts, Theory, and Applications (ICAICTA); 2017 Aug 16–18; Denpasar, Indonesia. p. 1–5. doi:10.1109/ICAICTA.2017.8090980. [Google Scholar] [CrossRef]
9. Arikumar KS, Deepak Kumar A, Gadekallu TR, Prathiba SB, Tamilarasi K. Real-time 3D object detection and classification in autonomous driving environment using 3D LiDAR and camera sensors. Electronics. 2022;11(24):4203. doi:10.3390/electronics11244203. [Google Scholar] [CrossRef]
10. Shabrina NH, Lika RA, Indarti S. Deep learning models for automatic identification of plant-parasitic nematode. Artif Intell Agric. 2023;7:1–12. doi:10.1016/j.aiia.2022.12.002. [Google Scholar] [CrossRef]
11. Carranza-García M, Torres-Mateo J, Lara-Benítez P, García-Gutiérrez J. On the performance of one-stage and two-stage object detectors in autonomous vehicles using camera data. Remote Sens. 2021;13(1):1–23. doi:10.3390/rs13010089. [Google Scholar] [CrossRef]
12. Kaur J, Singh W. Tools, techniques, datasets and application areas for object detection in an image: a review. Multimed Tools Appl. 2022;81(27):38297–351. doi:10.1007/s11042-022-13153-y. [Google Scholar] [PubMed] [CrossRef]
13. Tan M, Pang R, Le QV. EfficientDet: scalable and efficient object detection. In: 2020 IEEE/CVF Conference on Computer Vision and Pattern Recognition (CVPR); 2020 Jun 13–19; Seattle, WA, USA. p. 10778–87. doi:10.1109/CVPR42600.2020.01079. [Google Scholar] [CrossRef]
14. Chang SJ, Huang CY. Deep learning model for the inspection of coffee bean defects. Appl Sci. 2021;11(17):8226. doi:10.3390/app11178226. [Google Scholar] [CrossRef]
15. Gope HL, Fukai H. Peaberry and normal coffee bean classification using CNN, SVM, and KNN: their implementation in and the limitations of Raspberry Pi 3. AIMS Agric Food. 2022;7(1):149–67. doi:10.3934/AGRFOOD.2022010. [Google Scholar] [CrossRef]
16. Diwan T, Anirudh G, Tembhurne JV. Object detection using YOLO: challenges, architectural successors, datasets and applications. Multimed Tools Appl. 2023;82(6):9243–75. doi:10.1007/s11042-022-13644-y. [Google Scholar] [CrossRef]
17. Cheney J, Klein B, Jain AK, Klare BF. Unconstrained face detection: state of the art baseline and challenges. In: 2015 International Conference on Biometrics (ICB); 2015 May 19–22; Phuket, Thailand. p. 229–36. doi:10.1109/ICB.2015.7139089. [Google Scholar] [CrossRef]
18. Soler JD, Beuther H, Rugel M, Wang Y, Clark PC, Glover SCO, et al. Histogram of oriented gradients: a technique for the study of molecular cloud formation. Astron Astrophys. 2019;622(567):A166. doi:10.1051/0004-6361/201834300. [Google Scholar] [CrossRef]
19. Toennies K, Rak M, Engel K. Deformable part models for object detection in medical images. Biomed Eng Online. 2014;13(Suppl 1):1–25. doi:10.1186/1475-925X-13-S1-S1. [Google Scholar] [PubMed] [CrossRef]
20. Paper D. State-of-the-art deep learning models in TensorFlow: modern machine learning in the google colab ecosystem. Berkeley, CA, USA: Apress; 2021. doi:10.1007/978-1-4842-7341-8. [Google Scholar] [CrossRef]
21. Ghoreyshi AM, Akhavanpour A, Bossaghzadeh A. Simultaneous vehicle detection and classification model based on deep YOLO networks. In: 2020 International Conference on Machine Vision and Image Processing (MVIP); 2020 Feb 18–20; Qom, Iran. p. 1–6. doi:10.1109/MVIP49855.2020.9116922. [Google Scholar] [CrossRef]
22. da Costa AZ, Figueroa HEH, Fracarolli JA. Computer vision based detection of external defects on tomatoes using deep learning. Biosyst Eng. 2020;190(3):131–44. doi:10.1016/j.biosystemseng.2019.12.003. [Google Scholar] [CrossRef]
23. Kalake L, Dong Y, Wan W, Hou L. Enhancing detection quality rate with a combined HOG and CNN for real-time multiple object tracking across non-overlapping multiple cameras. Sensors. 2022;22(6):2123. doi:10.3390/s22062123. [Google Scholar] [PubMed] [CrossRef]
24. Girshick R, Donahue J, Darrell T, Malik J. Rich feature hierarchies for accurate object detection and semantic segmentation. In: 2014 IEEE Conference on Computer Vision and Pattern Recognition; 2014 Jun 23–28; Columbus, OH, USA. p. 580–7. doi:10.1109/CVPR.2014.81. [Google Scholar] [CrossRef]
25. Avola D, Cinque L, Diko A, Fagioli A, Foresti GL, Mecca A, et al. MS-faster R-CNN: multi-stream backbone for improved faster R-CNN object detection and aerial tracking from UAV images. Remote Sens. 2021;13(9):1–18. doi:10.3390/rs13091670. [Google Scholar] [CrossRef]
26. Girshick R. Fast R-CNN. In: 2015 IEEE International Conference on Computer Vision (ICCV); 2015 Dec 7–13; Santiago, Chile. p. 1440–8. doi:10.1109/ICCV.2015.169. [Google Scholar] [CrossRef]
27. Liu W, Anguelov D, Erhan D, Szegedy C, Reed S, Fu CY, et al. SSD: single shot multibox detector. In: Computer Vision—ECCV 2016. Cham, Switzerland: Springer; p. 21–37. doi:10.1007/978-3-319-46448-0_2. [Google Scholar] [CrossRef]
28. Tian Z, Shen C, Chen H, He T. FCOS: fully convolutional one-stage object detection. In: 2019 IEEE/CVF International Conference on Computer Vision (ICCV); 2019 Oct 27–Nov 2; Seoul, Republic of Korea. p. 9626–35. doi:10.1109/ICCV.2019.00972. [Google Scholar] [CrossRef]
29. Redmon J, Divvala S, Girshick R, Farhadi A. You only look once: unified, real-time object detection. In: 2016 IEEE Conference on Computer Vision and Pattern Recognition (CVPR); 2016 Jun 27–30; Las Vegas, NV, USA. p. 779–88. doi:10.1109/CVPR.2016.91. [Google Scholar] [CrossRef]
30. Yoo D, Park S, Lee JY, Paek AS, Kweon IS. Attentionnet: aggregating weak directions for accurate object detection. In: 2015 IEEE International Conference on Computer Vision (ICCV); 2015 Dec 7–13; Santiago, Chile. p. 2659–67. doi:10.1109/ICCV.2015.305. [Google Scholar] [CrossRef]
31. Magalhães SA, Castro L, Moreira G, Dos Santos FN, Cunha M, Dias J, et al. Evaluating the single-shot multibox detector and yolo deep learning models for the detection of tomatoes in a greenhouse. Sensors. 2021;21(10):3569. doi:10.3390/s21103569. [Google Scholar] [PubMed] [CrossRef]
32. Hussain M. YOLO-v1 to YOLO-v8, the Rise of YOLO and its complementary nature toward digital manufacturing and industrial defect detection. Machines. 2023;11(7):677. doi:10.3390/machines11070677. [Google Scholar] [CrossRef]
33. Ieamsaard J, Charoensook SN, Yammen S. Deep learning-based face mask detection using YoloV5. In: 2021 9th International Electrical Engineering Congress (iEECON); 2021 Mar 10–12; Pattaya, Thailand. p. 428–31. doi:10.1109/iEECON51072.2021.9440346. [Google Scholar] [CrossRef]
34. Jiang P, Ergu D, Liu F, Cai Y, Ma B. A review of Yolo algorithm developments. Procedia Comput Sci. 2021;199(11):1066–73. doi:10.1016/j.procs.2022.01.135. [Google Scholar] [CrossRef]
35. Ahmad HM, Rahimi A, Hayat K. Capacity constraint analysis using object detection for smart manufacturing. Automation. 2024;5(4):545–63. doi:10.3390/automation5040031. [Google Scholar] [CrossRef]
36. Chou Y-C, Kuo C-J, Chen T-T, Horng G-J, Pai M-Y, Wu M-E, et al. Deep-learning-based defective bean inspection with GAN-structured automated labeled data augmentation in coffee industry. Appl Sci. 2019;9(19):4166. doi:10.3390/app9194166. [Google Scholar] [CrossRef]
37. Kim JY. Coffee beans quality prediction using machine learning. SSRN Electron J. 2022. doi:10.2139/ssrn.4024785. [Google Scholar] [CrossRef]
38. Amtate G, Teferi D. Multiclass classification of Ethiopian coffee bean using deep learning. SINET Ethiop J Sci. 2022;45(3):309–21. doi:10.4314/sinet.v45i3.6. [Google Scholar] [CrossRef]
39. Sirisha U, Praveen SP, Srinivasu PN, Barsocchi P, Bhoi AK. Statistical analysis of design aspects of various YOLO-based deep learning models for object detection. Int J Comput Intell Syst. 2023;16:126. doi:10.1007/s44196-023-00302-w. [Google Scholar] [CrossRef]
40. Lou H, Duan X, Guo J, Liu H, Gu J, Bi L, et al. DC-YOLOv8: small-size object detection algorithm based on camera sensor. Electron. 2023;12(10):1–14. doi:10.3390/electronics12102323. [Google Scholar] [CrossRef]
41. Padilla R, Passos WL, Dias TLB, Netto SL, Silva EAB. A comparative analysis of object detection metrics with a companion open-source Toolkit. Electronics. 2021;10(3):279. [Google Scholar]
42. Tong C, Yang X, Huang Q, Qian F. NGIoU Loss: generalized intersection over union loss based on a new bounding box regression. Appl Sci. 2022;12(24):12785. doi:10.3390/app122412785. [Google Scholar] [CrossRef]
43. Liang X, Lin L, Wei Y, Shen X, Yang J, Yan S. Proposal-free network for instance-level object segmentation. IEEE Trans Pattern Anal Mach Intell. 2018;40(12):2978–91. doi:10.1109/TPAMI.2017.2775623. [Google Scholar] [PubMed] [CrossRef]
44. García M, Candelo-Becerra JE, Hoyos FE. Quality and defect inspection of green coffee beans using a computer vision system. Appl Sci. 2019;9(19):4195. doi:10.3390/app9194195. [Google Scholar] [CrossRef]
Cite This Article
 Copyright © 2025 The Author(s). Published by Tech Science Press.
This work is licensed under a Creative Commons Attribution 4.0 International License , which permits unrestricted use, distribution, and reproduction in any medium, provided the original work is properly cited.
 Downloads
 Citation Tools