
 Submit a Paper
 Propose a Special lssue
 Open Access
ARTICLE

Cost and Time Optimization of Cloud Services in Arduino-Based Internet of Things Systems for Energy Applications
1 Department of Innovation Science, School of Environment and Society, Institute of Science Tokyo, Minato-ku, Tokyo, 108-0023, Japan
2 Computer Engineering Department, Azad University, Saveh City, 81318, Iran
3 Department of Transdisciplinary Science and Engineering, School of Environment and Society, Institute of Science Tokyo, Yokohama, 226-8503, Japan
* Corresponding Author: Reza Nadimi. Email:
Journal on Internet of Things 2025, 7, 49-69. https://doi.org/10.32604/jiot.2025.070822
Received 24 July 2025; Accepted 29 August 2025; Issue published 30 September 2025
 View Full Text
 Download PDF
Abstract
Existing Internet of Things (IoT) systems that rely on Amazon Web Services (AWS) often encounter inefficiencies in data retrieval and high operational costs, especially when using DynamoDB for large-scale sensor data. These limitations hinder the scalability and responsiveness of applications such as remote energy monitoring systems. This research focuses on designing and developing an Arduino-based IoT system aimed at optimizing data transmission costs by concentrating on these services. The proposed method employs AWS Lambda functions with Amazon Relational Database Service (RDS) to facilitate the transmission of data collected from temperature and humidity sensors to the RDS database. In contrast, the conventional method utilizes Amazon DynamoDB for storing the same sensor data. Data were collected from 01 April 2022, to 26 August 2022, in Tokyo, Japan, focusing on temperature and relative humidity with a resolution of one minute. The efficiency of the two methods—conventional and proposed—was assessed in terms of both time and cost metrics, with a particular focus on data retrieval. The conventional method exhibited linear time complexity, leading to longer data retrieval times as the dataset grew, mainly due to DynamoDB’s pagination requirements and the parsing of payload data during the reading process. In contrast, the proposed method significantly reduced retrieval times for larger datasets by parsing payload data before writing it to the RDS database. Cost analysis revealed a savings of $1.56 per month with the adoption of the proposed approach for a 20-gigabyte database.Keywords
Data communication in power systems, especially in decentralized energy environments [1], plays a pivotal role in optimizing performance, enhancing reliability, and ensuring effective system management [2,3]. With the rapid expansion of distributed energy resources and smart grid applications, modern power systems increasingly rely on large-scale data collection and analysis to support critical functions such as demand forecasting, fault detection, energy optimization, and predictive maintenance [4,5].
To facilitate this data-driven ecosystem, a wide array of technologies—including distributed control systems, supervisory control and data acquisition (SCADA) systems, data loggers, and Internet of Things (IoT) devices—have been deployed to remotely monitor and control power generation units [6,7]. Among these, the IoT has emerged as a cornerstone of modern power systems, offering real-time data acquisition, cloud-based analytics, and remote accessibility. It bridges resource-constrained physical devices with scalable cloud infrastructure, such as Amazon Web Services (AWS), Google Cloud Platform, and Microsoft Azure [8,9] using various communication protocols1.
Once collected, IoT data traverses a data flow pipeline that includes transmission, storage, computing, and retrieval, often leveraging Wi-Fi, cellular, or other wireless protocols. Cloud services then provide advanced analytics to support data-driven decision-making [10–12].
Despite the growing body of work on IoT for power systems, a significant research gap remains in the cost analysis and optimization of cloud-based data storage and retrieval—particularly within the AWS ecosystem, which dominates enterprise IoT deployments [13,14]. While some studies have examined cloud platform comparisons and general cost-reduction strategies—such as caching and reuse techniques in IaaS environments [15], or cross-platform cost analyses based on device number2 of IoT services on AWS, Azure, and Google Cloud [16]—they often lack the fine-grained focus required for service-level cost modeling. More recent efforts have tried to formalize AWS cost estimation through mathematical models that account for architectural robustness, team expertise, and requirement clarity [17]; however, these approaches do not specifically assess the cost and performance implications of key AWS services like relational databases (RDS) and DynamoDB in real-world IoT scenarios.
The existing literature concerning comprehensive studies that optimize both data storage and retrieval costs within the AWS platform through an in-depth analysis of its diverse services. From storage insight, both RDS and DynamoDB are fully managed database solutions within the AWS ecosystem. RDS employs Structured Query Language (SQL) for data storage and retrieval, whereas DynamoDB functions as a NoSQL database, thereby eliminating the need for SQL [18]. DynamoDB is especially effective in managing high traffic volumes and storing data in key-value or document formats. However, its scanning and data retrieval processes are less efficient [19], and its performance degrades as the database size increases, primarily due to the inherent challenges associated with pagination. In contrast, optimized partition keys, sort keys, and the use of global or local secondary indexes can enhance query performance in both databases, helping to avoid full-table scans, which differs from the limitations imposed by DynamoDB’s pagination.
Unlike previous studies, this paper goes beyond hardware design and general cloud usage by conducting a detailed, service-level cost and performance analysis of AWS offerings, particularly focusing on DynamoDB vs. RDS for IoT-based data storage and retrieval. It introduces a novel architecture combining AWS Lambda with RDS, evaluates it against the default DynamoDB-based IoT Rule Engine pipeline, and demonstrates its practicality using a real-world Arduino-based prototype. No previous literature has provided such a focused comparison between AWS services in an IoT energy monitoring context, making this work distinct in its scope, depth, and practical implications.
To address these shortcomings, this paper offers the following key contributions:
1- A comprehensive cost analysis of AWS services related to IoT-based data handling—focusing on data storage, computing, and retrieval rather than only transmission.
2- A novel architecture that integrates Python-based AWS Lambda functions with Amazon RDS (relational database service) as an alternative to the traditional pipeline using DynamoDB and AWS Rule Engine.
3- A working prototype based on Arduino and sensor hardware, demonstrating real-world energy monitoring using temperature and humidity sensors.
4- A comparative performance and cost evaluation between DynamoDB and RDS under realistic data loads, identifying situations where RDS with Lambda provides better cost efficiency and scalability.
5- A full-stack design involving sensor data collection, cloud transmission, storage architecture, and retrieval methods optimized for business analytics.
The scope of this paper is confined to AWS cloud services in the context of IoT-based power system monitoring. This includes the design and implementation of a cost-efficient, scalable data handling pipeline using off-the-shelf microcontrollers (Arduino), common IoT sensors, and AWS services such as RDS, DynamoDB, and Lambda.
1- The potential impact of this work lies in its practicality and cost-efficiency, which can be adopted by:
2- Researchers and developers seeking optimized cloud-based architectures for energy applications.
3- Energy companies and utilities needing scalable, real-time IoT solutions for renewable integration and demand-side management.
4- Policy-makers and engineers working toward digital transformation in energy sectors, especially in developing regions where cost sensitivity is paramount.
1.4 The Role of Sensors in Cost-Optimized IoT Energy Systems Using Cloud and Fog Architectures
Sensors are the foundational components of IoT systems, serving as the primary interface between physical environments and digital platforms [20]. In energy applications, they enable real-time monitoring of critical parameters such as temperature, humidity, current, voltage, vibration, and energy consumption [21,22]. These measurements support various functions, including fault detection, demand-side energy management, predictive maintenance, and environmental condition tracking within smart grids and renewable energy systems [23,24]. The integration of sensors allows power systems to operate with greater intelligence and responsiveness, feeding accurate data into cloud platforms for analysis, automation, and optimization [25]. In this study, low-cost temperature and humidity sensors are employed not merely as a data source, but as a representation of broader sensing technologies used in energy monitoring systems. Highlighting the role of sensors in the overall architecture helps underscore the end-to-end value chain—from physical measurement to cloud-based decision-making—that this paper seeks to optimize through improved data handling techniques.
Concurrently, the convergence of IoT systems with cloud and fog computing has intensified the demand for cost-effective, energy-efficient, and responsive service delivery frameworks. A range of recent studies have addressed critical challenges in this domain, including energy consumption, resource allocation, and workload distribution across heterogeneous and dynamic IoT environments. For example, ref. [26] introduces the Cost Optimization in the cloud/fog environment based on Task Deadline (COTD) algorithm, which reduces operational costs while satisfying task deadlines, outperforming existing service brokerage methods in both cost efficiency and response time. In parallel, ref. [27] proposes the Option Pricing based Geographical Load Balancing (OptionGLB) algorithm, which minimizes energy costs in geo-distributed data centers by leveraging call options in electricity markets. In [28], the Cost, Load, Energy and Makespan based Optimized task scheduler (CLEMO) is introduced, employing a genetic algorithm to efficiently schedule dependent tasks across cloud-fog resources, achieving significant improvements in cost reduction, energy efficiency, and resource utilization.
Moreover, ref. [29] develops the Energy-saving Strategy based on Sleep and Adaptive Service-rate Tuning (ES-SAST), which models cloud task arrivals using Markov processes and dynamically adjusts service rates, yielding average reductions of 3% in power consumption, 19% in latency, and 37% in system loss rates. The work in [30] introduces TPMCD (ThroughPut and Cost optimizing Method for Clustering tasks and hybrid containers in the cloud Data center), which enhances load balancing, minimizes redundancy, and improves throughput and execution time by utilizing task classification and container-based deployment strategies.
Finally, ref. [31] presents a hybrid predictive framework that integrates IoT sensor data with the TCN-GRU-NBeat (NGT) model and Seagull Optimization Algorithm (SOA). This model enables real-time optimization of storage migration in cloud data centers and achieves an average energy cost reduction of 23.88%, while surpassing traditional machine learning models in predictive accuracy.
Collectively, these contributions emphasize the pivotal role of sensors within cost-optimized, cloud-integrated IoT energy systems. Beyond data acquisition, sensors enable real-time situational awareness, empower intelligent decision-making, and serve as enablers for a wide range of optimization strategies spanning energy consumption, cost reduction, and quality of service. The integration of sensor technologies with cloud and fog computing architectures thus represents a key foundation for the development of scalable, efficient, and sustainable next-generation energy systems.
The remainder of this paper is organized as follows: Section 2 reviews recent studies on IoT applications related to energy usage. Section 3 outlines the research methodology, including the design of the Arduino system, conventional and proposed methods for cloud data transmission, as well as the data collection process and its duration. Section 4 presents the results derived from the methodology. Finally, Section 5 summarizes the key findings of the study.
2 Literature Review and Shortcomings of Previous Studies
A variety of research efforts have examined the application of IoT technologies in energy systems, emphasizing their solutions and benefits for optimizing energy usage. These studies provide detailed insights into the hardware and software architectures of IoT systems. The hardware architecture of the IoT investigates the impact of various microcontrollers3, actuators4, and sensors5 on the accuracy of data collection at desired resolutions, as well as their integration with smart grid systems. Conversely, the software architecture encompasses multiple domains, including data collection, transmission, storage, processing, visualization, and security.
Table 1 outlines each study’s focus, primary contributions, and limitations—particularly with respect to cloud platform usage and cost optimization. While these studies collectively highlight the promise of IoT in energy systems, they generally focus on hardware implementation, data transmission, or high-level visualization. None investigate the internal cost-performance trade-offs within AWS services—such as the differences between DynamoDB and RDS, or the use of AWS Lambda for scalable data pipelines.

The present research advances the field by offering a detailed cost-performance analysis of AWS services tailored for IoT-based energy monitoring systems. It introduces an alternative cloud architecture that combines AWS Lambda with RDS, moving away from the conventional DynamoDB and Rule Engine pipeline. To validate this approach, a complete prototype system—using Arduino microcontrollers and environmental sensors—is developed and tested. The study compares both performance and cost across DynamoDB and RDS under real-world conditions and proposes an optimized end-to-end design for scalable, cost-effective IoT data handling suited to business analytics applications.
As illustrated in Fig. 1, the IoT architecture examined in this study comprises four distinct layers: the sensor layer, field gateway layer, AWS cloud gateway layer, and business analytics layer. In the sensor layer, temperature and relative humidity data are collected via the Digital Temperature and Humidity Sensor (DHT-11) sensor interfaced with an Arduino, designated as a “physical thing.” This data is subsequently transmitted to AWS IoT Core, identified as a “virtual thing,” through the field gateway layer. The AWS cloud gateway is responsible for receiving, processing, and analyzing the incoming data, as well as managing and visualizing the processed information. The business analytics layer leverages this processed data to generate insights that enhance decision-making processes.
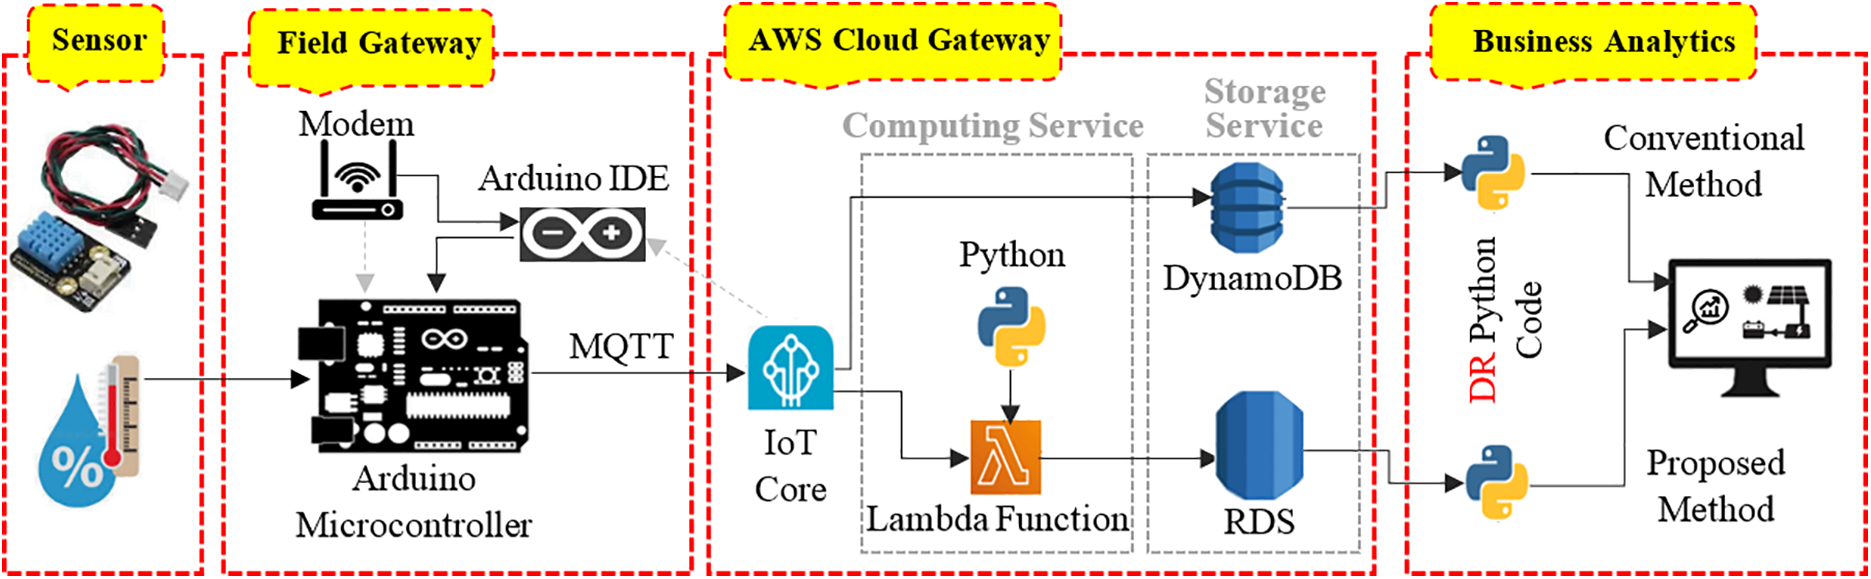
Figure 1: Proposed vs. conventional data retrieval models (DR: stands for data retrieval)
According to Fig. 1, both the conventional and proposed methods employ these four layers. However, the primary distinction between the two methodologies lies in the use of two distinct AWS database services, both of which operate under the PostgreSQL engine. The conventional method is based on the widely adopted AWS IoT data storage architecture, where data is directly streamed from IoT Core to DynamoDB. This configuration reflects a mainstream practice in many cloud-based IoT deployments due to its scalability and serverless architecture. The conventional approach utilizes the non-relational DynamoDB database, whereas the proposed method leverages the RDS database. This transition to a relational database architecture facilitates enhanced search capabilities and greater flexibility in data management and retrieval. In contrast, DynamoDB implements pagination for data searches, which can result in increased data retrieval times, particularly as the volume of stored data escalates.
The proposed methodology employs a Lambda function in conjunction with customized Python code to parse a payload received via the Message Queuing Telemetry Transport (MQTT) protocol6 into multiple values, including temperature, relative humidity, and timestamp. The Lambda function enables the execution of Python code without the necessity of establishing a dedicated Python environment, incurring costs only for the actual computing time utilized. While the implementation of the AWS Lambda service introduces additional operational costs, the overall data retrieval expenses are mitigated through efficient parsing and subsequent storage of the segmented payload data in the RDS database.
Fig. 2 illustrates the assembly of a basic Arduino circuit on a breadboard, powered by a 3.3 V source. This circuit includes a DHT-11 used for ambient data collection. The DHT-11 utilizes a capacitive humidity sensor along with a thermistor to precisely measure the ambient temperature and relative humidity, transmitting this data as a digital signal through its data pin. The Arduino Nano serves as the microcontroller for processing and transmitting the temperature and humidity data to the AWS cloud. The corresponding Arduino code is developed within the Integrated Development Environment (IDE) and subsequently uploaded to the Arduino Nano. This code establishes a connection between the physical sensor (DHT-11) and a virtual thing created in AWS IoT Core.
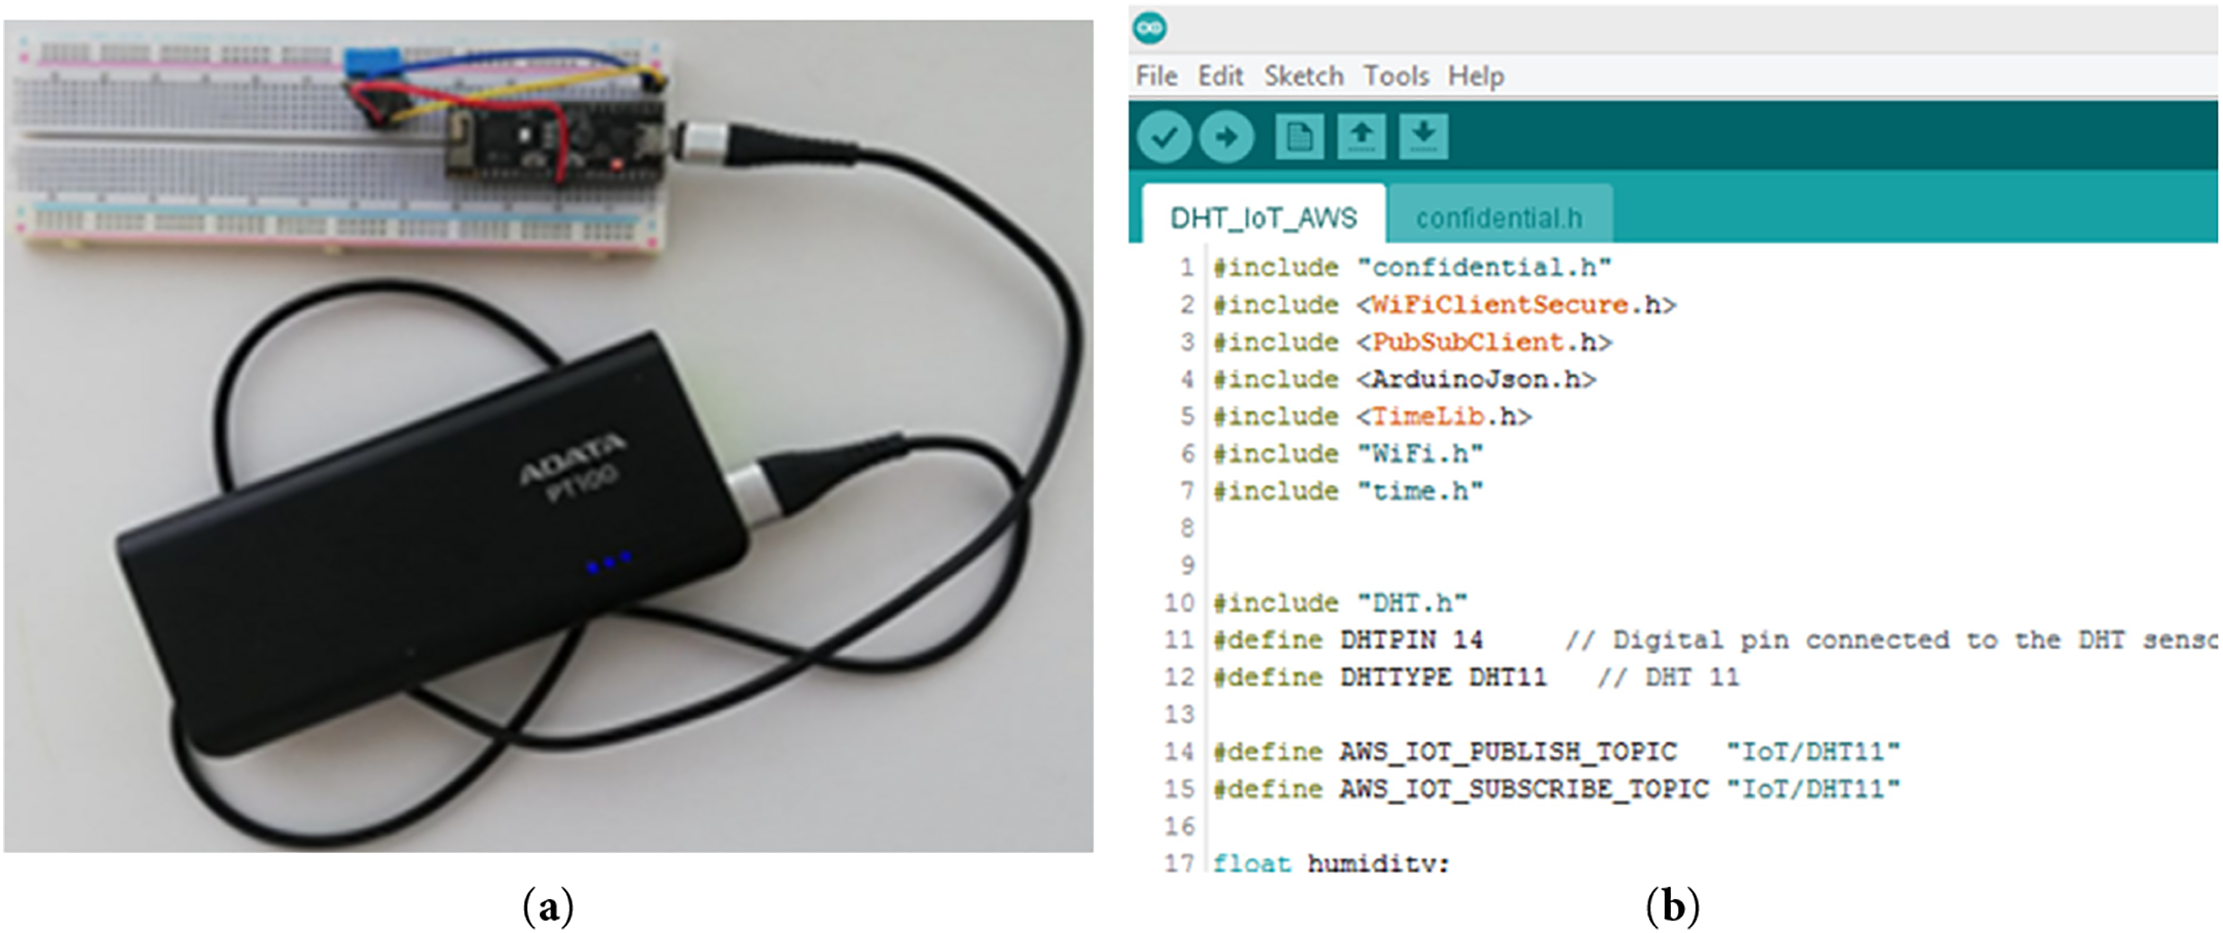
Figure 2: Arduino Nano setup (a), Arduino code under within IDE (b)
To facilitate efficient data transmission and reception over cloud networks characterized by limited bandwidth, AWS IoT Core employs the MQTT protocol. Upon the creation of a virtual thing within AWS IoT Core, a unique certificate and associated credentials are generated. These authentication details are integrated into the IDE code, enabling secure and effective data transmission from the DHT-11 sensor to the AWS cloud infrastructure.
3.2 Conventional Method of Data Transmission
In the context of integrating AWS IoT Core with DynamoDB, data transmission is facilitated through the implementation of predefined rules within the IoT Core framework. In other words, the AWS platform utilizes predefined rules to facilitate interactions among its various services. As shown in Fig. 3, each data payload consists of a string format encapsulating temperature, relative humidity, and timestamp information. This structured string necessitates parsing during the data retrieval process to assess the presence of specific records within a paginated query context.
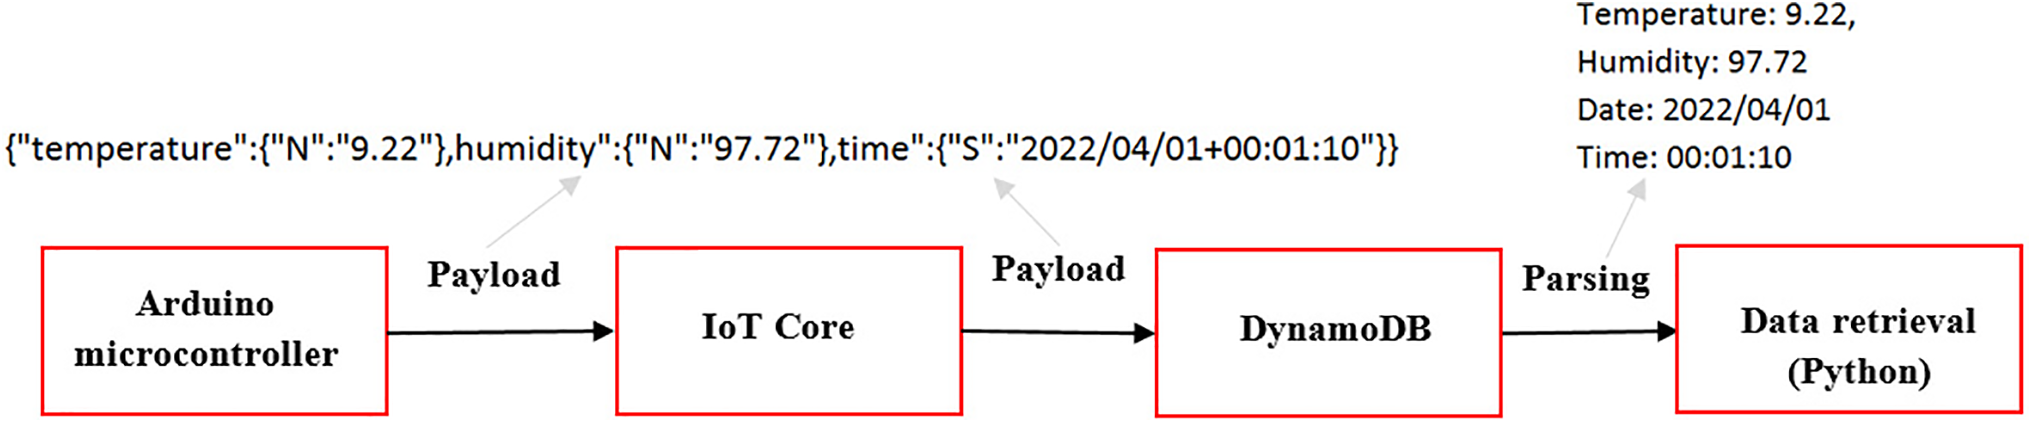
Figure 3: Data transmission from Arduino to DynamoDB
The implementation of both parsing and paginated querying introduces additional complexities that can adversely affect the overall data retrieval efficiency. This is particularly pertinent given the limitations imposed by AWS DynamoDB’s provisioned read capacity units. Consequently, the combination of these processes may lead to increased latency in data access. In other words, by employing pagination technique, the system can limit the number of items retrieved in a single request, thereby minimizing the associated costs incurred per read operation. Although this technique has been designed to enhance the efficiency of data retrieval operations, the read and write capacity of DynamoDB, which is directly tied to operational costs, can impose limitations on data flow, particularly in the context of data retrieval (see Fig. 4).
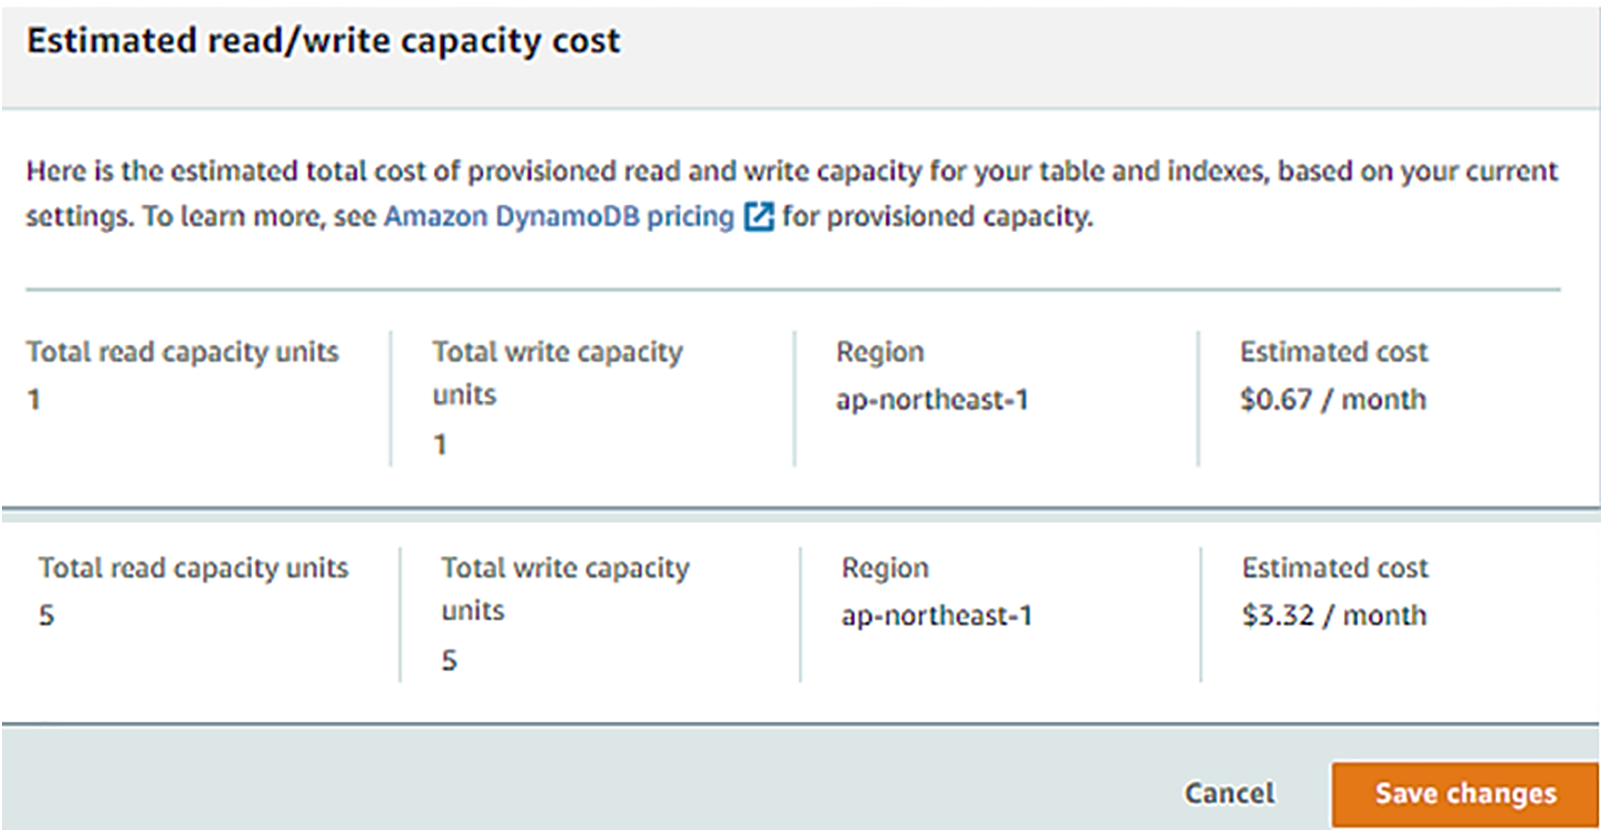
Figure 4: Estimated read/write capacity cost for DynamoDB based on AWS
In this study, the total read and write capacity was initially set to one capacity unit. The data transmission from the Arduino to AWS is 1 set of data per minute, which is consistent with writing capacity. However, the Python program developed for data retrieval (reading) encountered performance issues, resulting in slower execution and occasional stalling. To address these challenges, the read capacity was increased to five units, equating to the retrieval of approximately 10,000 records. This adjustment facilitated improved data retrieval speeds, although it increased monthly operational costs from $0.67 to $3.32, as illustrated in Fig. 4. It is important to note that the daily data transmission from the Arduino to AWS amounts to 1440 records, resulting in a minimum of five pages of data per month. Consequently, continuous querying of these pages1 is necessary to identify specific records of interest. The incorporation of an additional filter within the pagination process serves to limit the volume of data retrieved from DynamoDB. Nevertheless, this filtering approach will still utilize read capacity units based on the total amount of data retrieved for each page, underscoring the need for careful management of capacity to balance performance and cost-effectiveness.
3.3 Proposed Model of Data Transmission
The proposed methodology emphasizes the parsing of payload data prior to its storage in an AWS RDS. In contrast to the built-in integration capabilities of DynamoDB with AWS IoT Core, the proposed approach necessitates the deployment of an AWS Lambda function to establish a connection between IoT Core and RDS. This involves implementing a Python script within the Lambda function that defines the requisite rules for data transfer as shown in Fig. 5.
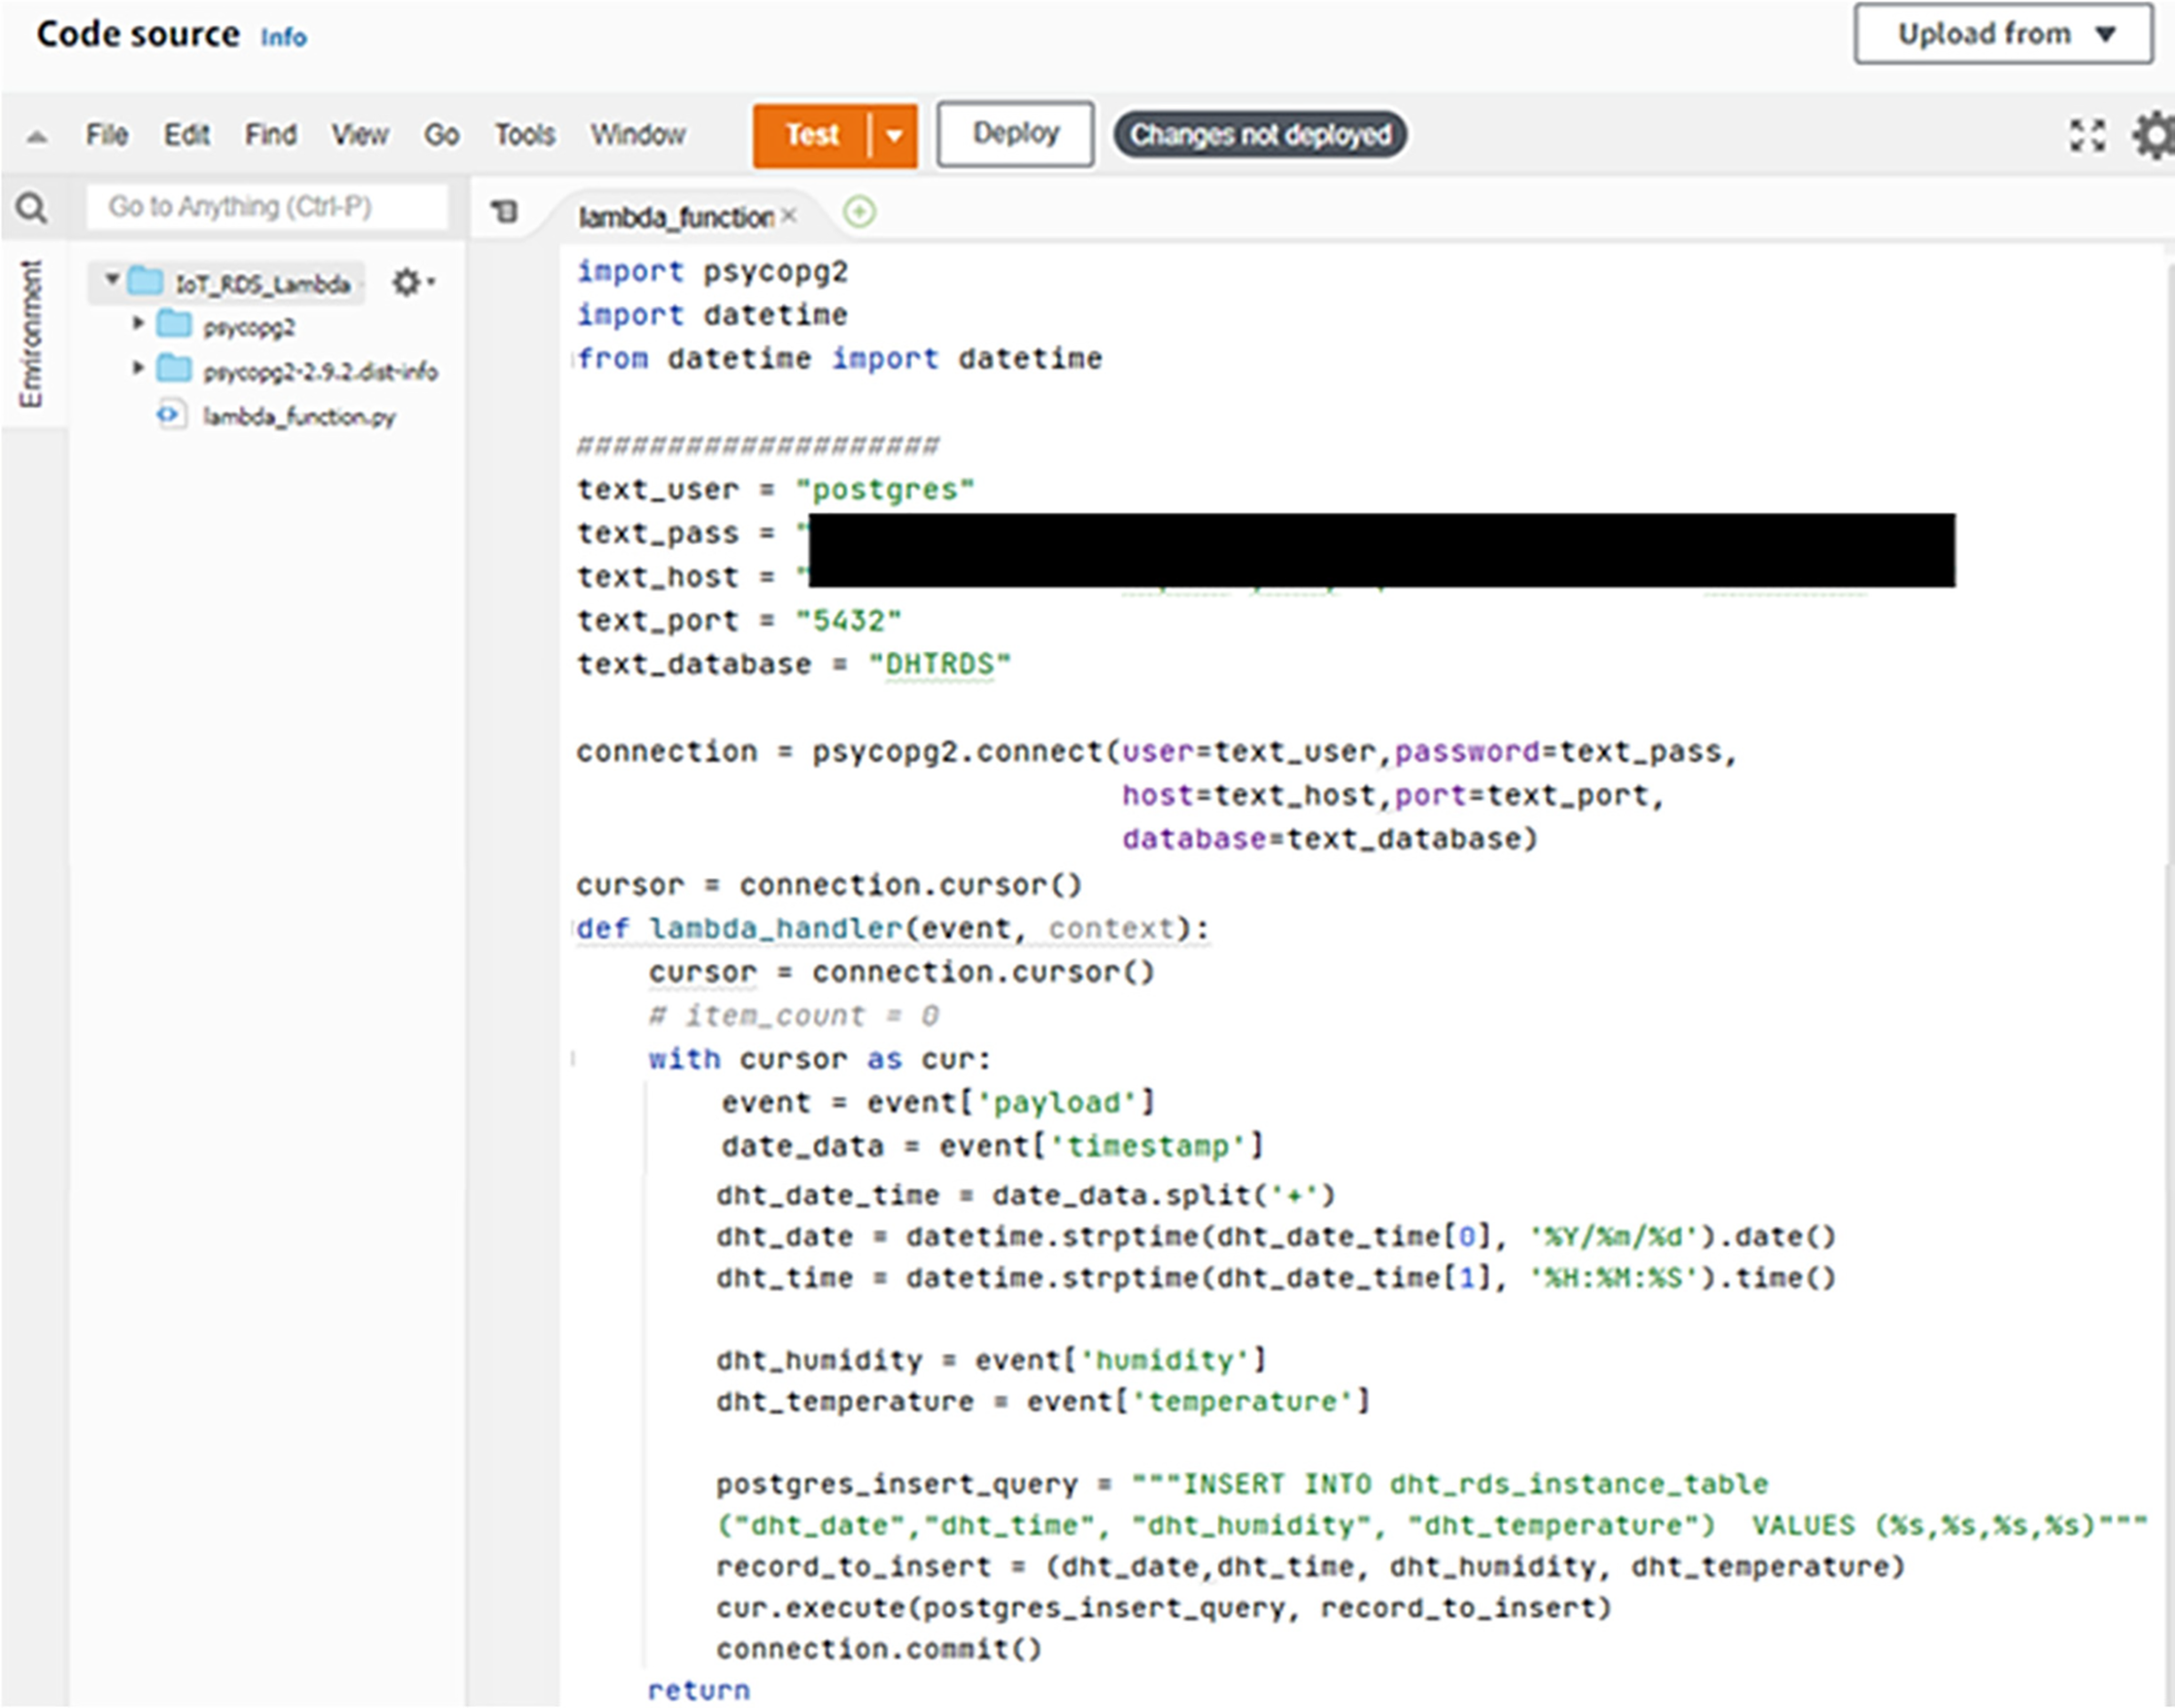
Figure 5: AWS Lambda function along with Python script to parse the input payload
The Python code is responsible for parsing the incoming payload, which is then formatted appropriately for storage in the RDS, as depicted in Fig. 6. A significant advantage of this approach lies in the temporal gap between successive DHT data readings, which occurs at one-minute intervals. This interval provides sufficient processing time for the Lambda function to effectively split the string-encoded data and perform the necessary parsing operations prior to insertion into the RDS.
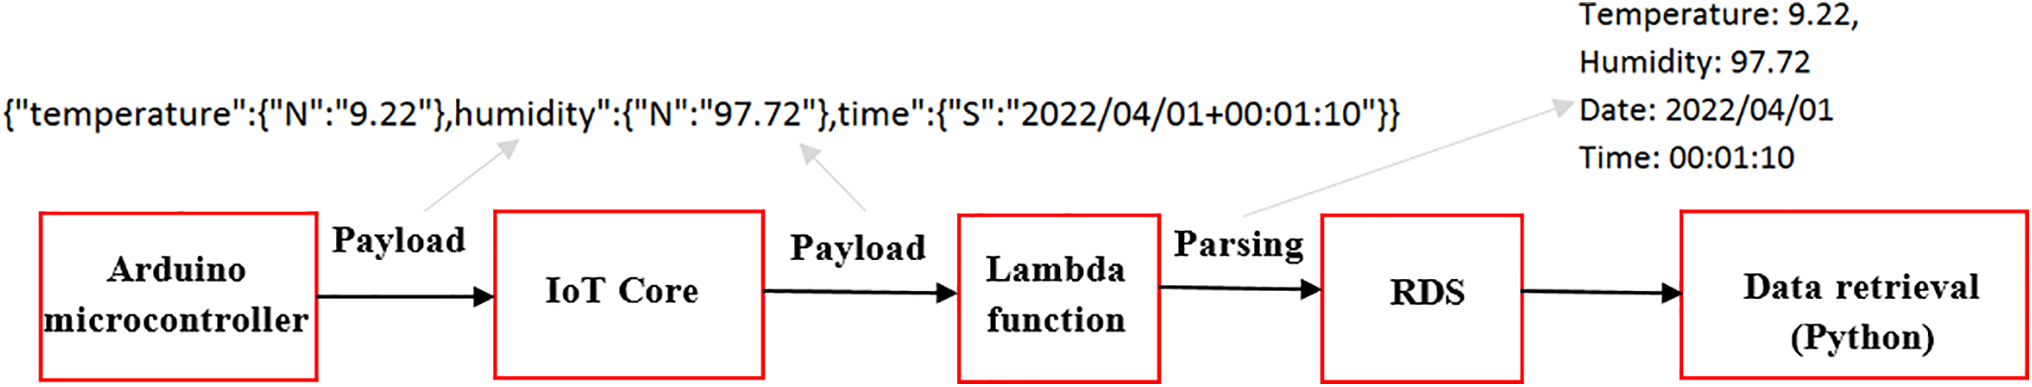
Figure 6: Data transmission from Arduino to RDS
Moreover, by structuring the data in a relational format, the retrieval process can leverage well-established search algorithms, such as B-Trees [52], to find specific records with greater efficiency compared to the conventional method. This optimization enhances the overall performance of data access within the system, thereby improving the efficacy of data management and analysis in IoT applications.
A one-tailed paired t-test is conducted to determine whether the retrieval time of the proposed method is statistically less than that of the conventional method. The hypotheses are formulated as follows [53]:
where
Eq. (2) represents the probability that a value from a t-distribution (with n − 1 degrees of freedom) exceeds the calculated test statistic, t. To compute the test statistic, the difference between each pair is calculated as:
where xi and yi represent the retrieval times using the conventional and proposed methods, respectively. The paired t-test statistic is then computed using the formula:
where
This study applies a confidence interval (CI) to calculate if the interval is likely to contain the true population parameter (e.g., a mean or mean difference) with a certain level of confidence—usually 95%. In the context of a paired t-test, a confidence interval estimates the true mean difference between two related measurements (e.g., before and after treatment or conventional vs. proposed method). The confidence interval estimates the range in which the true mean difference μd_between the paired observations lies, with a specified level of confidence (e.g., 95%).
where
The data utilized in this study were collected from an observational site located at coordinates 35°31′16.5″ N and 139°28′10.2″ E in Machida City, Tokyo, Japan. Data collection spanned from 01 April 2022, to 26 July 2022, with a temporal resolution of one minute. Table 2 summarizes descriptive statistics of the collected dataset for the period from April to July 2022. Analysis reveals a trend of increasing average monthly temperature and relative humidity throughout the study period. Table 2 also presents the minimum and maximum values recorded for the collected data during the same timeframe.

It is important to note that data loss during collection was observed and recorded in each month, as shown in Table 2. These missing data points were primarily caused by network-related issues, such as temporary disconnections or unstable internet connectivity at the deployment site. This natural data loss reflects real-world communication fluctuations, which were not artificially controlled or simulated. As such, the dataset inherently includes the effects of intermittent network connectivity, contributing to the realism of the performance analysis.
To support reproducibility and facilitate implementation by practitioners, we provide both the pseudocode and corresponding Python code that describe the conventional and proposed data retrieval methods, as illustrated in Fig. 1. These implementations are available in the GitHub repository linked in the Code Availability section of this study. The pseudocode outlines the complete data processing workflow—from sensor data acquisition using Arduino and transmission via MQTT protocol, to storage in Amazon DynamoDB and subsequent retrieval and parsing using Python. All inputs and outputs are explicitly defined, and consistent variable naming conventions are employed to ensure coherence with the terminology used throughout the manuscript. This comprehensive presentation aims to enhance transparency, support validation, and promote ease of adoption in related research and practical deployments.
This section presents a comparative analysis of data retrieval efficiency, focusing on both time and cost considerations. The assessment encompasses the conventional method and the proposed method.
4.1 Time Analysis of Data Retrieval
The time efficiency of data retrieval serves as a pivotal metric influencing overall system performance. This study investigates the data retrieval duration across three temporal scales: one day, one month, and monthly cumulative data.
4.1.1 Time Efficiency for One-Day Scale
To assess the retrieval time, a sample of 12 days (three days per each month) was selected for comparative analysis between the conventional and proposed methods. Utilizing Python, the data retrieval process is designed to extract a maximum of 1440 data points per day (24 h × 60 min). However, it is observed that the time required for searching increases as the database expands.
As shown in Fig. 7, the conventional method (Upper half) typically exhibits linear time complexity, resulting in longer retrieval durations as the dataset scales and pagination in the DynamoDB. In contrast, the proposed method (Lower half) leverages advanced algorithms and data structures designed to optimize query execution. Preliminary results indicate a significant reduction in retrieval time, particularly for larger datasets, due to improved indexing and caching mechanisms in the RDS database.
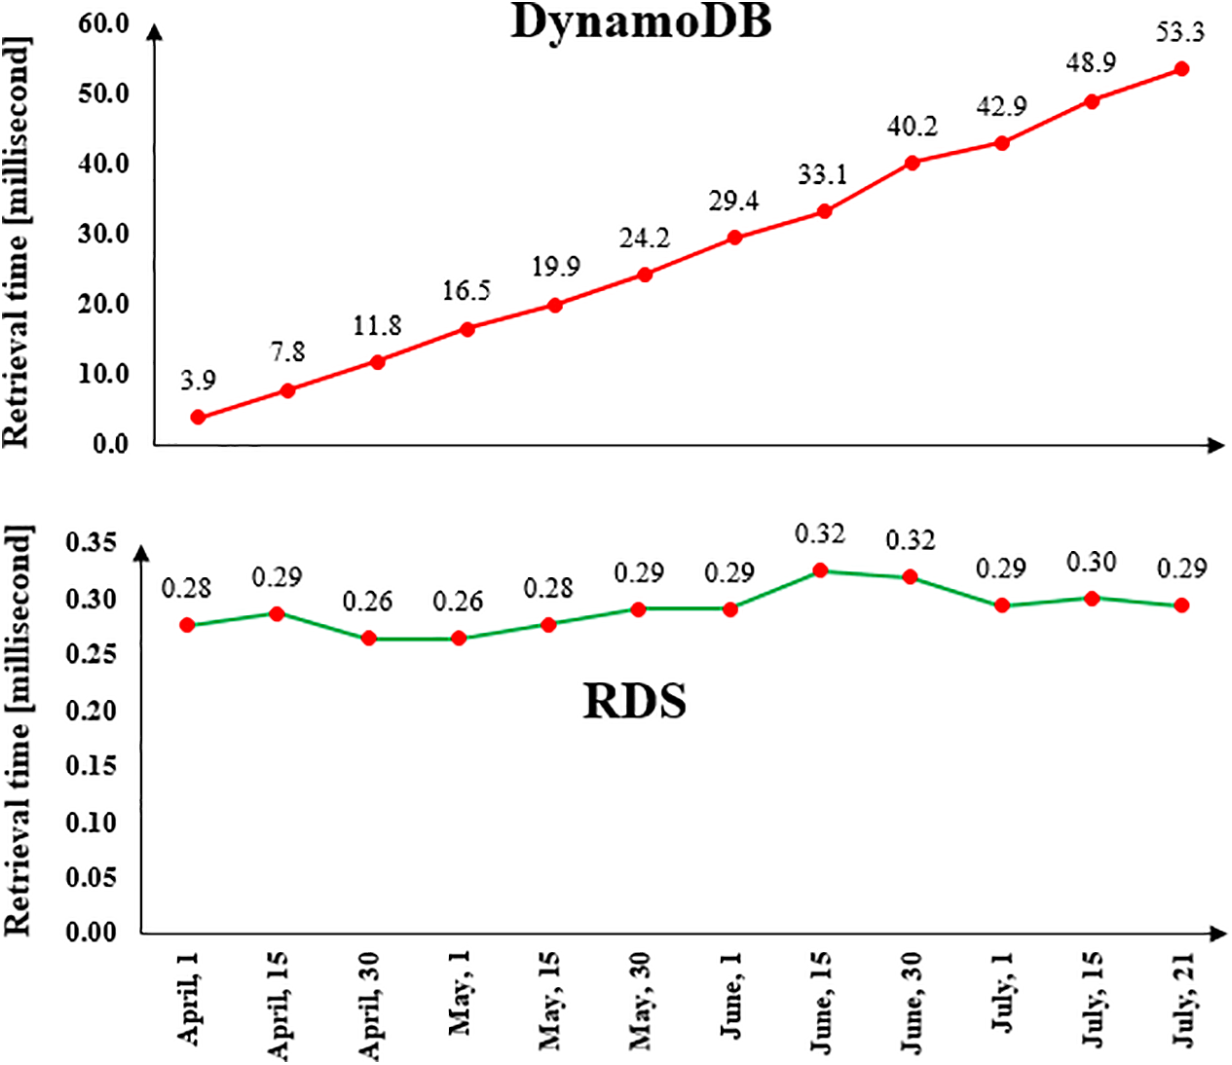
Figure 7: Data retrieval time for one-day scale
Statistical analysis was performed to evaluate whether a significant difference exists between the retrieval times of the two methods. The paired t-test yielded a t-statistic of 5.7967, indicating a strong deviation from the null hypothesis in favor of the alternative. The corresponding one-tailed p-value was 5.9930 × 10⁻⁵, which is substantially lower than the significance level α = 0.05, leading to the rejection of the null hypothesis. The mean difference in retrieval time between the conventional and proposed methods was 27.4274 ms, suggesting that, on average, the conventional method is slower by approximately 27.43 ms. Furthermore, the 90% one-sided confidence interval was calculated as (18.9301, ∞) milliseconds, indicating that with 90% confidence, the true mean reduction in retrieval time achieved by the proposed method is at least 18.93 ms.
4.1.2 Time Efficiency for One-Month Scale
Fig. 8 illustrates the data retrieval times associated with both the conventional and proposed methods for one-month scale. The conventional method, which utilizes DynamoDB, necessitates the conversion of string payload data during the querying process to adhere to the total read and write capacity. As depicted in Fig. 8, the data retrieval duration for the one-month period demonstrates a linear increase from April to July. This trend underscores the limitations imposed by the total read and write capacity, primarily due to the pagination mechanism inherent in DynamoDB.
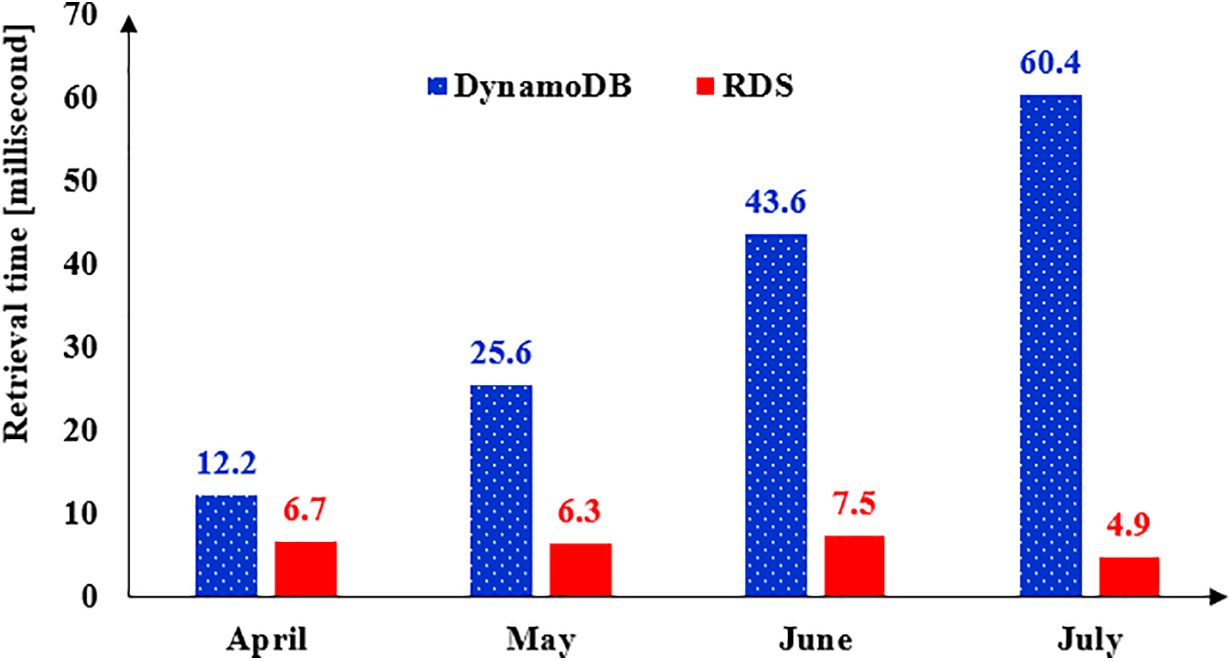
Figure 8: Data retrieval time for one-month scale
In contrast, the proposed method addresses these limitations by converting the string payload prior to storage in the RDS database. While this approach introduces some overhead during data retrieval due to the structured nature of the database, it ultimately facilitates more efficient data management. The conversion process reduces the complexities associated with querying, which can mitigate the impact of capacity constraints experienced in the conventional method.
4.1.3 Time Efficiency for Monthly Cumulative Scale
Fig. 9 displays the results of monthly cumulative data retrieval in which both methods represent a growing trend, while the slope of retrieval time growth in the conventional method is much larger than the proposed method. In fact, the starting timestamp, April 1st, does not change in the data retrieval code of the Python, but the finishing timestamp is changed by moving toward July. The results of the monthly cumulative scale indicate a same problem in the DynamoDB which increases the retrieval time in the convention method.
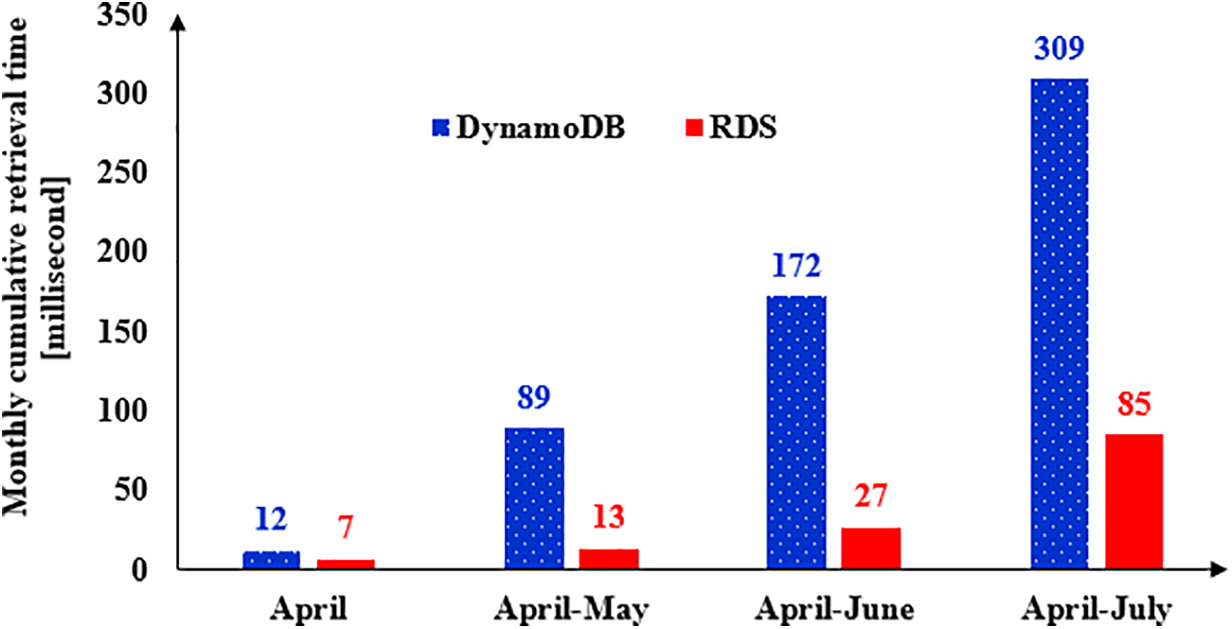
Figure 9: Data retrieval time for monthly cumulative scale
Fig. 9 presents the results of the monthly cumulative data retrieval, illustrating a discernible growth trend for both methods. Notably, the slope of the retrieval time increase for the conventional method is significantly steeper compared to that of the proposed method. The data retrieval code implemented in Python maintains a constant starting timestamp of April 1st, while the finishing timestamp progresses towards July. This fixed starting point allows for a direct comparison of retrieval durations over the specified period. The results from the monthly cumulative analysis reveal a persistent issue with the conventional method utilizing DynamoDB, wherein the retrieval time increases substantially as the dataset expands.
This trend in three scales of analysis highlights the inherent limitations of DynamoDB, particularly in terms of scalability and efficiency during data retrieval processes. In contrast, the proposed method exhibits a more moderate increase in retrieval time, suggesting improved efficiency in handling larger datasets. These findings underscore the advantages of the proposed method in mitigating the challenges associated with data retrieval in expansive databases.
4.2 Cost Analysis of Data Retrieval
According to Fig. 1, the costs associated with the two methods remain identical up to the IoT Core component. However, variability in costs arises subsequently due to the different AWS services employed in the AWS section. This study specifically examines the contributions of DynamoDB, RDS, and Lambda function services, which are the primary sources of cost differentiation between the two methods based on Eq. (6).
4.2.1 Cost Calculation for the Prosposed Method
The proposed model incurs costs associated with the implementation of a Lambda function and Amazon RDS services. Initial cost data for these components are summarized in Table 3.

To calculate the monthly costs associated with the proposed model’s services, the following steps were performed:
1. Data payload size calculation: The data payload utilized in this study is 15 bytes, composed of the following elements: temperature (4 bytes), relative humidity (4 bytes), date (4 bytes), and time (3 bytes).
2. Monthly request calculation: For a month comprising 30 days, the total number of requests is calculated as follows:
Total Monthly Requests = 30 days × 24 h/day × 60 min/h = 43,200
1. Cost Calculations:
∘ Lambda Function Cost: Based on the number of monthly requests and the per-request rate, the cost for the Lambda function is calculated as:
Lambda Cost = 43,200 × 0.0000002 US$ = 0.00864 US$
∘ RDS Cost: The RDS cost consists of several components:
▪ Monthly Fixed Cost:
Monthly Fixed Cost = 20 GB × 0.115 US$/GB = 2.3 US$
▪ Hourly Variable Storage Cost:
Hourly Variable Storage Cost = 30 days × 24 h/day × 0.026 US$/h = 18.72 US$
▪ Data Transfer Cost (Writing to RDS):
Data Transfer Cost (Write) = 43,200 × (15 bytes/10243 bytes) × 0.01 US$ = 0.00000603 US$
▪ Data Transfer Cost (Reading from RDS):
Data Transfer Cost (Write) = 43,200 × (15 bytes/10243 bytes) × 0.01 US$ = 0.00000603 US$
2. Total monthly cost calculation: The total monthly cost for the stated services is computed as follows:
Total Monthly Cost = Lambda Cost + RDS Cost = 0.00864 + (2.3 + 18.72+ 0.00000603 × 2) = 21.02865207 US$
Thus, the total estimated monthly cost for the services involved in this study is approximately 21.03 US$.
4.2.2 Cost Calculation for the Conventional Method
Table 4 presents the cost analysis for DynamoDB, reflecting the expenses associated with its services. In this analysis, a consistent storage capacity of 20 GB, identical to that utilized in the RDS, has been employed. This uniformity in storage capacity facilitates a direct comparison between the costs of the two database services, ensuring that the financial implications of utilizing DynamoDB can be effectively evaluated within the context of the proposed model.

To calculate the monthly costs associated with the conventional model’s services, the following steps were performed:
1. Monthly request calculation: Same as the RDS, total monthly requests are 43,200.
2. Monthly fixed cost of DynamoDB: It is calculated based on storage capacity times the rate of monthly storage cost as follows:
Monthly fixed cost = 20 GB × 0.285 US$ per GB = 5.7 US$
3. Inbound cost (writing to DynamoDB): As illustrated in Fig. 4, the total provisioned write capacity units for the system is set at 5. This configuration is capable of facilitating the retrieval of approximately 10,000 records from a single table. This relationship between write capacity and data retrieval efficiency is crucial for optimizing performance and ensuring that the system can handle the expected load effectively. Thus, the monthly inbound cost of DynamoDB is calculated as:
Monthly fixed cost = (43,200/10,000) × 3.32 US$ = 14.3424 US$
4. Outbound cost (reading from DynamoDB): In a manner analogous to the inbound cost section, the total provisioned reading capacity units are also set at 5. However, the reading capacity is four times that of the writing capacity, enabling the retrieval of approximately 40,000 records from a single table [59]. Thus, the monthly outbound cost of DynamoDB is calculated as:
Monthly fixed cost = (43,200/40,000) × 3.32 US$ = 3.5856 US$
5. Total monthly cost calculation: The total monthly cost for the DynamoDB services is calculated as follows:
Total Monthly Cost = Monthly fixed cost + Inbound cost + Outbound cost = 5.7 + 14.3424 + 3.5856 = 23.628 US$
Fig. 10 presents the total monthly costs associated with the proposed and conventional methods. It is important to note that the calculations depicted in Fig. 10 account for missing data, as outlined in Table 2, and are based on a 26-day month for July. Specifically, this study assumes that the missing data was not transmitted from the Arduino to the AWS cloud. The average monthly costs for the proposed and conventional methods are calculated to be 20.56 US$ and 22.12 US$, respectively. Consequently, the proposed method is projected to yield a reduction in monthly AWS costs of approximately 1.56 USD for a storage capacity of 20 GB. Furthermore, as storage capacity increases, it is anticipated that the cost differential between the two methods will expand, underscoring the enhanced cost efficiency of the proposed approach.
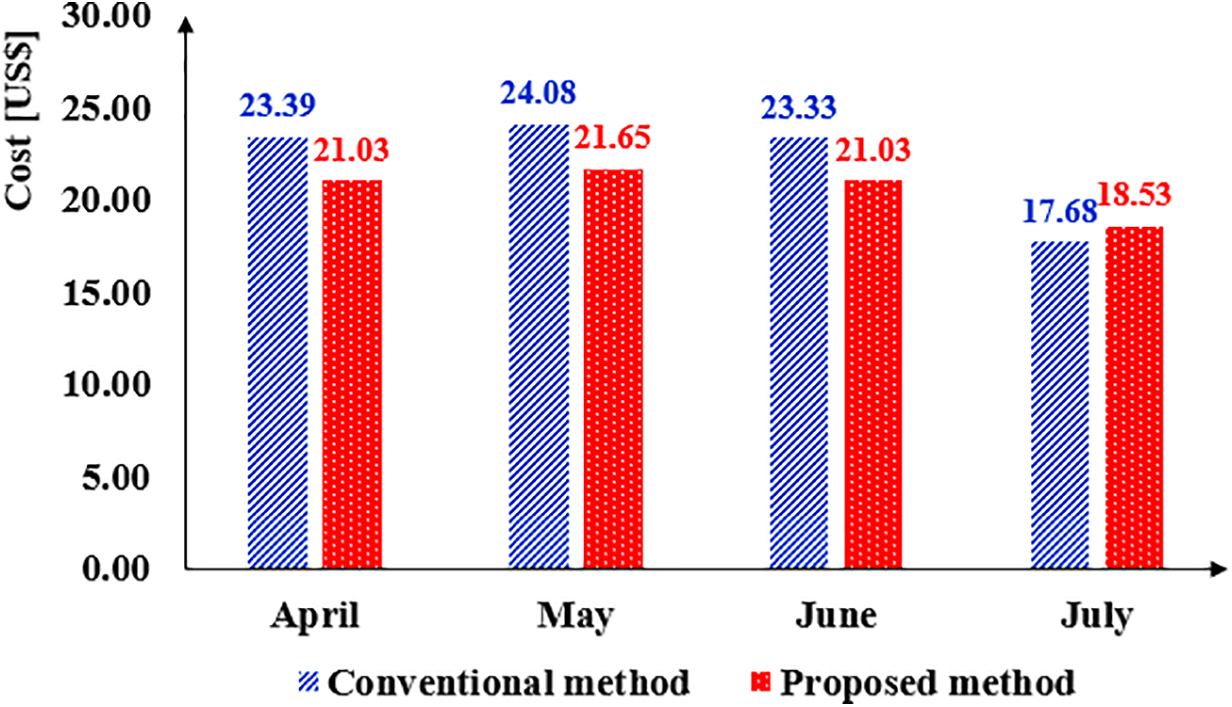
Figure 10: Monthly cost of the proposed and conventional methods
While several mainstream data storage solutions exist for IoT applications—such as time-series databases (e.g., InfluxDB or AWS Timestream)—this study focuses on the two most accessible and natively supported AWS configurations: DynamoDB and RDS. These options were selected due to their compatibility with AWS IoT Core and their prevalence in cloud-hosted IoT architectures. Moreover, this study was conducted using data collected from a single IoT device at a single geographical location. Consequently, the scalability of the proposed method in scenarios involving multiple devices, concurrent data streams, or geographically distributed deployments remains untested. Additionally, all data payloads used in this study were fixed at 15 bytes, consisting of temperature, humidity, and timestamp data. In practical IoT applications, payload sizes may vary significantly depending on sensor complexity, metadata, or multi-sensor integration. Therefore, future work should include scalability testing under varied device counts, concurrent connections, and different payload sizes to comprehensively evaluate the robustness and generalizability of the proposed data retrieval architecture.
This study presented the design and assembly of an Arduino-based Internet of Things (IoT) system aimed at conducting a comparative analysis of data retrieval efficiency (Not just on storing data), specifically focusing on time and cost metrics. The hardware configuration included an Arduino Nano, a breadboard, and a Digital Temperature and Humidity Sensor (DHT-11). The software component was developed using the Integrated Development Environment (IDE) and uploaded to the Arduino Nano. The DHT-11 sensor measured temperature and relative humidity, which, along with timestamp data, were transmitted to the IoT Core of Amazon Web Services (AWS).
Two data handling methods were compared. The conventional method, which reflects a mainstream industry practice, involves direct transmission of payload data (temperature, relative humidity, and timestamps) from IoT Core to Amazon DynamoDB. This serverless NoSQL database is widely adopted in cloud-based IoT architectures due to its scalability and integration with other AWS services. In contrast, the proposed method routes the data through an AWS Lambda function before storing it in Amazon Relational Database Service (RDS), a structured SQL-based storage option that supports advanced querying and indexing mechanisms.
The comparative analysis demonstrates that the proposed method significantly outperforms the conventional (DynamoDB-based) method in terms of both time and cost efficiency. Specifically, the conventional approach exhibited linear time complexity, leading to prolonged response times as dataset size increased—primarily due to pagination and capacity constraints in DynamoDB. The proposed method, benefiting from enhanced indexing and caching in RDS, achieved faster data retrieval, especially for large and cumulative datasets.
Cost analysis showed that the average monthly AWS costs for managing 20 gigabytes of data were $20.56 for the proposed method and $22.12 for the conventional method—resulting in a cost saving of $1.56 per month. These savings are expected to increase as storage demands grow, further enhancing the economic efficiency of the proposed solution.
In summary, the proposed method demonstrates clear superiority over a mainstream DynamoDB-based architecture, both in retrieval performance and operational costs. While this study focused on two AWS-native configurations commonly used in practice, future research could extend the analysis to include other mainstream or specialized IoT data storage solutions, such as Amazon Timestream, InfluxDB, or Redis, to further benchmark the proposed approach within a broader technological landscape.
Acknowledgement: None.
Funding Statement: The authors received no specific funding for this study.
Author Contributions: All authors have contributed equally to the conception, design, execution, and writing of this manuscript. All authors reviewed the results and approved the final version of the manuscript.
Availability of Data and Materials: The following link provides computational code used in this manuscript. https://github.com/Nadimi-Reza/Arduino-based-IoT-in-energy-systems.git (accessed on 28 August 2025).
Ethics Approval: Not applicable.
Conflicts of Interest: The authors declare no conflicts of interest to report regarding the present study.
1e.g., Message Queuing Telemetry Transport (MQTT), Hypertext Transfer Protocol (HTTP), or Constrained Application Protocol (CoAP).
2From one device to 500,000 devices.
3Arduino Uno, ESP series, Raspberry Pi, STM32 Series, TI CC3200, Microchip PIC Series, NXP LPC Series, and Nordic Semiconductor nRF52 Series.
4Pneumatic, hydraulic, thermal, and electric actuators.
5Temperature, humidity, light, current, voltage, power meters, gas, soil moisture, water flow, and vibration sensors.
6The MQTT protocol enables messaging from devices to the cloud and vice versa.
7Using “LastEvaluatedKey”, and “ExclusiveStartKey”.
References
1. Adil AM, Ko Y. Socio-technical evolution of decentralized energy systems: a critical review and implications for urban planning and policy. Renew Sustain Energy Rev. 2016;57(2):1025–37. doi:10.1016/j.rser.2015.12.079. [Google Scholar] [CrossRef]
2. Nadimi R, Takahashi M, Tokimatsu K, Goto M. The reliability and profitability of virtual power plant with short-term power market trading and non-spinning reserve diesel generator. Energies. 2024;17(9):2121. doi:10.3390/en17092121. [Google Scholar] [CrossRef]
3. Kippke MA. Technologies for data collection in power systems. In: Encyclopedia of electrical and electronic power engineering. Amsterdam, The Netherlands: Elsevier; 2023. p. 320–6. doi:10.1016/b978-0-12-821204-2.00063-5. [Google Scholar] [CrossRef]
4. Kadam SR, Mulla AM. Modern techniques of power system analysis with intelligent system. In: 2023 Third International Conference on Advances in Electrical, Computing, Communication and Sustainable Technologies (ICAECT); 2023 Jan 5–6; Bhilai, India. doi:10.1109/ICAECT57570.2023.10118257. [Google Scholar] [CrossRef]
5. Nadimi R, Goto M. A novel decision support system for enhancing long-term forecast accuracy in virtual power plants using bidirectional long short-term memory networks. Appl Energy. 2025;382(9):125273. doi:10.1016/j.apenergy.2025.125273. [Google Scholar] [CrossRef]
6. Sebastián R, Quesada J. Distributed control system for frequency control in a isolated wind system. Renew Energy. 2006;31(3):285–305. doi:10.1016/j.renene.2005.04.003. [Google Scholar] [CrossRef]
7. Upadhyay D, Sampalli S. SCADA (supervisory control and data acquisition) systems: vulnerability assessment and security recommendations. Comput Secur. 2020;89(3):101666. doi:10.1016/j.cose.2019.101666. [Google Scholar] [CrossRef]
8. Botta A, de Donato W, Persico V, Pescapé A. Integration of cloud computing and Internet of Things: a survey. Future Gener Comput Syst. 2016;56(7):684–700. doi:10.1016/j.future.2015.09.021. [Google Scholar] [CrossRef]
9. Silva JAA, López JC, Guzman CP, Arias NB, Rider MJ, da Silva LCP. An IoT-based energy management system for AC microgrids with grid and security constraints. Appl Energy. 2023;337:120904. doi:10.1016/j.apenergy.2023.120904. [Google Scholar] [CrossRef]
10. Kannayeram G, Muniraj R, Jeno Jasmine J, Edwin Raja S, Jarin T. Energy management of renewable energy connected electric vehicles charging using Internet of Things: hybrid MRA-SDRN approach. Energy. 2024;304(5):132128. doi:10.1016/j.energy.2024.132128. [Google Scholar] [CrossRef]
11. Ahmad T, Zhang D. Using the Internet of Things in smart energy systems and networks. Sustain Cities Soc. 2021;68(1):102783. doi:10.1016/j.scs.2021.102783. [Google Scholar] [CrossRef]
12. Nadimi R, Goto M. Enhanced virtual power plant generation forecasting in Japan using fuzzy decision support and bidirectional long short-term memory models. In: 2024 13th International Conference on Renewable Energy Research and Applications (ICRERA); 2024 Nov 9–13; Nagasaki, Japan. doi:10.1109/ICRERA62673.2024.10815591. [Google Scholar] [CrossRef]
13. Thota RC. Cost optimization strategies for micro services in AWS: managing resource consumption and scaling efficiently. Int J Sci Res Arch. 2023;10(2):1255–66. doi:10.30574/ijsra.2023.10.2.0921. [Google Scholar] [CrossRef]
14. Chilukoori VVR, Gangarapu S. Strategic cost management in cloud-based big data processing: an AWS case study from Amazon. Int J Res Appl Sci Eng Technol. 2024;12(9):164–71. doi:10.22214/ijraset.2024.64155. [Google Scholar] [CrossRef]
15. Fu X, Pan L, Liu S. Caching or re-computing: online cost optimization for running big data tasks in IaaS clouds. J Netw Comput Appl. 2025;235(1):104080. doi:10.1016/j.jnca.2024.104080. [Google Scholar] [CrossRef]
16. Pierleoni P, Concetti R, Belli A, Palma L. Amazon, google and microsoft solutions for IoT: architectures and a performance comparison. IEEE Access. 2019;8:5455–70. doi:10.1109/access.2019.2961511. [Google Scholar] [CrossRef]
17. Maurya S, Lakhera G, Srivastava AK, Kumar M. Cost analysis of Amazon web services—from an eye of architect and developer. Mater Today Proc. 2021;46(11):10757–60. doi:10.1016/j.matpr.2021.01.669. [Google Scholar] [CrossRef]
18. Choosing between relational (SQL) and NoSQL [Internet]. [cited 2024 Oct 18]. Available from: https://docs.aws.amazon.com/amazondynamodb/latest/developerguide/SQLtoNoSQL.WhyDynamoDB.html. [Google Scholar]
19. Best practices for querying and scanning data in DynamoDB [Internet]. [cited 2024 Oct 8]. Available from: https://docs.aws.amazon.com/amazondynamodb/latest/developerguide/bp-query-scan.html. [Google Scholar]
20. Seiger R, Kurz AF, Franceschetti M. Online detection of process activity executions from IoT sensors using generated event processing services. Future Gener Comput Syst. 2026;174(6):107987. doi:10.1016/j.future.2025.107987. [Google Scholar] [CrossRef]
21. Nithin SK, Hemanth K, Shamanth V, Shrinivas Mahale R, Sharath PC, Patil A. Importance of condition monitoring in mechanical domain. Mater Today Proc. 2022;54(4):234–9. doi:10.1016/j.matpr.2021.08.299. [Google Scholar] [CrossRef]
22. Uhlmann E, Laghmouchi A, Hohwieler E, Geisert C. Condition monitoring in the cloud. Procedia CIRP. 2015;38(8):53–7. doi:10.1016/j.procir.2015.08.075. [Google Scholar] [CrossRef]
23. Gungor VC, Sahin D, Kocak T, Ergut S, Buccella C, Cecati C, et al. Smart grid technologies: communication technologies and standards. IEEE Trans Ind Inform. 2011;7(4):529–39. doi:10.1109/TII.2011.2166794. [Google Scholar] [CrossRef]
24. Qays MO, Ahmad I, Abu-Siada A, Hossain ML, Yasmin F. Key communication technologies, applications, protocols and future guides for IoT-assisted smart grid systems: a review. Energy Rep. 2023;9:2440–52. doi:10.1016/j.egyr.2023.01.085. [Google Scholar] [CrossRef]
25. Hussain MM, Sufyan Beg MM. Fog computing for Internet of Things (IoT)-aided smart grid architectures. Big Data Cogn Comput. 2019;3(1):8. doi:10.3390/bdcc3010008. [Google Scholar] [CrossRef]
26. Ahmad SG, Iqbal T, Munir EU, Ramzan N. Cost optimization in cloud environment based on task deadline. J Cloud Comput. 2023;12(1):9. doi:10.1186/s13677-022-00370-x. [Google Scholar] [CrossRef]
27. Khalil MIK, Ahmad I, Ali Shah SA, Jan S, Khan FQ. Energy cost minimization for sustainable cloud computing using option pricing. Sustain Cities Soc. 2020;63(6):102440. doi:10.1016/j.scs.2020.102440. [Google Scholar] [CrossRef]
28. Singh A, Tiwari RK, Saroj SK. CLEMO: cost, load, energy, and makespan-based optimized scheduler for Internet of Things applications in cloud-fog environment. Comput Electr Eng. 2025;124(3):110377. doi:10.1016/j.compeleceng.2025.110377. [Google Scholar] [CrossRef]
29. Yan X, Jin S. Performance model and system optimization of an energy-saving strategy based on adaptive service rate tuning in cloud data centers with micro-burst traffic. Comput Commun. 2025;242(5):108281. doi:10.1016/j.comcom.2025.108281. [Google Scholar] [CrossRef]
30. Ghorbannia Delavar A. TPMCD: a method to optimizing cost and throughput for clustering tasks and hybrid containers in the cloud data center. J Netw Comput Appl. 2025;237(195):104132. doi:10.1016/j.jnca.2025.104132. [Google Scholar] [CrossRef]
31. Aldossary M, Alharbi HA, Ayub N. Exploring multi-task learning for forecasting energy-cost resource allocation in IoT-cloud systems. Comput Mater Contin. 2024;79(3):4603–20. doi:10.32604/cmc.2024.050862. [Google Scholar] [CrossRef]
32. Yadav AK, Yadav V, Malik H, Khargotra R, Singh T. Design of novel IoT-based solar powered PV pumping systems for agricultural applications in diverse climatic zones of India. Results Eng. 2024;23(1):102584. doi:10.1016/j.rineng.2024.102584. [Google Scholar] [CrossRef]
33. Boonnam N, Lanteng O. Energy yield database management system based on solar photovoltaic cell using Internet of Things technology. e-Prime Adv Electr Eng Electron Energy. 2024;8:100563. doi:10.1016/j.prime.2024.100563. [Google Scholar] [CrossRef]
34. Khan MS, Sharma H, Haque A. IoT enabled real-time energy monitoring for photovoltaic systems. In: 2019 International Conference on Machine Learning, Big Data, Cloud and Parallel Computing (COMITCon); 2019 Feb 14–16; Faridabad, India. doi:10.1109/comitcon.2019.8862246. [Google Scholar] [CrossRef]
35. Collado E, Calderón S, Cedeño B, De León O, Centella M, García A, et al. Open-source Internet of Things (IoT)-based air pollution monitoring system with protective case for tropical environments. HardwareX. 2024;19(7):e00560. doi:10.1016/j.ohx.2024.e00560. [Google Scholar] [PubMed] [CrossRef]
36. Png E, Srinivasan S, Bekiroglu K, Jiang C, Rong S, Poolla K. An Internet of Things upgrade for smart and scalable heating, ventilation and air-conditioning control in commercial buildings. Appl Energy. 2019;239(1):408–24. doi:10.1016/j.apenergy.2019.01.229. [Google Scholar] [CrossRef]
37. Reddy BM, Reddy MUG, Paruchuri S, Reddy VP, Sunny R. An IoT-based sustainable energy monitoring and alert system with billing integration. In: 2023 14th International Conference on Computing Communication and Networking Technologies (ICCCNT); 2023 Jul 6–8; Delhi, India. doi:10.1109/ICCCNT56998.2023.10306350. [Google Scholar] [CrossRef]
38. Hasan MK, Ahmed MM, Pandey B, Gohel H, Islam S, Khalid IF. Internet of Things-based smart electricity monitoring and control system using usage data. Wirel Commun Mob Comput. 2021;2021(1):6544649. doi:10.1155/2021/6544649. [Google Scholar] [CrossRef]
39. Tekler ZD, Low R, Yuen C, Blessing L. Plug-Mate: an IoT-based occupancy-driven plug load management system in smart buildings. Build Environ. 2022;223(12):109472. doi:10.1016/j.buildenv.2022.109472. [Google Scholar] [CrossRef]
40. Guerrero-Ulloa G, Méndez-García A, Torres-Lindao V, Zamora-Mecías V, Rodríguez-Domínguez C, Hornos MJ. Internet of Things (IoT)-based indoor plant care system. J Ambient Intell Smart Environ. 2023;15(1):47–62. doi:10.3233/ais-220483. [Google Scholar] [CrossRef]
41. Palacios-Garcia EJ, Arbab-Zavar B, Vasquez JC, Guerrero JM. Open IoT infrastructures for in-home energy management and control. In: 2019 IEEE 9th International Conference on Consumer Electronics (ICCE-Berlin); 2019 Sep 8–11; Berlin, Germany. doi:10.1109/ICCE-Berlin47944.2019.8966225. [Google Scholar] [CrossRef]
42. Ding X, Gan Q, Shaker MP. Optimal management of parking lots as a big data for electric vehicles using Internet of Things and long-short term memory. Energy. 2023;268(9):126613. doi:10.1016/j.energy.2023.126613. [Google Scholar] [CrossRef]
43. Toopshekan A, Ahmadi E, Abedian A, Vaziri Rad MA. Techno-economic analysis, optimization, and dispatch strategy development for renewable energy systems equipped with Internet of Things technology. Energy. 2024;296:131176. doi:10.1016/j.energy.2024.131176. [Google Scholar] [CrossRef]
44. Hossein Motlagh N, Mohammadrezaei M, Hunt J, Zakeri B. Internet of Things (IoT) and the energy sector. Energies. 2020;13(2):494. doi:10.3390/en13020494. [Google Scholar] [CrossRef]
45. Abu Adnan Abir SM, Anwar A, Choi J, Kayes ASM. IoT-enabled smart energy grid: applications and challenges. IEEE Access. 2021;9:50961–81. doi:10.1109/access.2021.3067331. [Google Scholar] [CrossRef]
46. Ting L. Simulation of low energy building thermal energy cycle in IoT smart city planning based on environmental sensors and deep learning. Therm Sci Eng Prog. 2024;54(5):102809. doi:10.1016/j.tsep.2024.102809. [Google Scholar] [CrossRef]
47. Arun M, Gopan G, Vembu S, Ozsahin DU, Ahmad H, Alotaibi MF. Internet of Things and deep learning-enhanced monitoring for energy efficiency in older buildings. Case Stud Therm Eng. 2024;61(6):104867. doi:10.1016/j.csite.2024.104867. [Google Scholar] [CrossRef]
48. Murugan G, Vijayarajan S. IoT based secured data monitoring system for renewable energy fed micro grid system. Sustain Energy Technol Assess. 2023;57(3):103244. doi:10.1016/j.seta.2023.103244. [Google Scholar] [CrossRef]
49. Et-taibi B, Abid MR, Boufounas EM, Morchid A, Bourhnane S, Abu Hamed T, et al. Enhancing water management in smart agriculture: a cloud and IoT-Based smart irrigation system. Results Eng. 2024;22:102283. doi:10.1016/j.rineng.2024.102283. [Google Scholar] [CrossRef]
50. Henaien A, Ben Elhadj H, Chaari Fourati L. A sustainable smart IoT-based solid waste management system. Future Gener Comput Syst. 2024;157(2):587–602. doi:10.1016/j.future.2024.03.056. [Google Scholar] [CrossRef]
51. Li Q, Shi J, Li W, Xiao S, Song K, Zhang Y, et al. An efficient tool for real-time global carbon neutrality with credibility of delicacy management: a Modelx + MRV + O system. Appl Energy. 2024;372(1):123763. doi:10.1016/j.apenergy.2024.123763. [Google Scholar] [CrossRef]
52. Lehman PL, Yao SB. Efficient locking for concurrent operations on B-trees. ACM Trans Database Syst. 1981;6(4):650–70. doi:10.1145/319628.319663. [Google Scholar] [CrossRef]
53. Fraser C. Business statistics for competitive advantage with Excel 2007: basics, model building and cases. Berlin/Heidelberg, Germany: Springer; 2008. [Google Scholar]
54. Amazon RDS Previous Generation Database Instances [Internet]. [cited 2024 Sep 28]. Available from: https://aws.amazon.com/rds/previous-generation/. [Google Scholar]
55. Understanding AWS Pricing for EC2, S3, EBS, RDS, Lambda & More [Internet]. [cited 2024 Sep 28]. Available from: https://www.finout.io/blog/understanding-aws-pricing. [Google Scholar]
56. AWS Data Transfer Pricing [Internet]. [cited 2024 Sep 28]. Available from: https://www.binadox.com/blog/aws-data-transfer-pricing/. [Google Scholar]
57. AWS Lambda Pricing [Internet]. [cited 2024 Sep 28]. Available from: https://aws.amazon.com/lambda/pricing/. [Google Scholar]
58. DynamoDB read and write operations [Internet]. [cited 2024 Sep 23]. Available from: https://docs.aws.amazon.com/amazondynamodb/latest/developerguide/read-write-operations.html. [Google Scholar]
59. Service, account, and table quotas in Amazon DynamoDB [Internet]. [cited 2024 Sep 28]. Available from: https://docs.aws.amazon.com/amazondynamodb/latest/developerguide/ServiceQuotas.html. [Google Scholar]
60. Create estimate: Configure Amazon DynamoDB [Internet]. [cited 2024 Sep 29]. Available from: https://calculator.aws/#/createCalculator/DynamoDB. [Google Scholar]
Cite This Article
 Copyright © 2025 The Author(s). Published by Tech Science Press.
This work is licensed under a Creative Commons Attribution 4.0 International License , which permits unrestricted use, distribution, and reproduction in any medium, provided the original work is properly cited.
 Downloads
 Citation Tools