
 Submit a Paper
 Propose a Special lssue
 Open Access
ARTICLE
The Failure Analysis of Carbon Fiber-Reinforced Epoxy Composites against Impact Loading with Numerical and Experimental Investigations
Department of Mechanical Engineering, University of Texas Permian Basin, Midland, TX 79707, USA
* Corresponding Author: Md Salah Uddin. Email:
(This article belongs to the Special Issue: Damage and Fracture of Polymer Composites)
Journal of Polymer Materials 2025, 42(4), 1051-1073. https://doi.org/10.32604/jpm.2025.070688
Received 21 July 2025; Accepted 12 November 2025; Issue published 26 December 2025
 View Full Text
 Download PDF
Abstract
Carbon fiber-reinforced composites (CFRCs) have a wide range of applications in the aerospace, automotive, and energy sectors. A higher specific strength-to-weight ratio is desired in high-performance applications. The failure mechanism of CFRCs involves multiscale phenomena, such as failure that can occur at the matrix, fibers, interface, layers, lamina, and laminates. When an impactor hits the CFRCs, the design involves analyzing each of these stages to prevent failure and optimize the properties of CFRCs under various loading conditions. A numerical model was employed to predict the fracture toughness of CFRCs with varying weight fractions and orientations. Finite Element Analysis (FEA) was conducted at the fiber level on a micrometer scale for the CFRCs against an impact loading. Epoxy composite samples at the coupon level were prepared using the hand layup technique with carbon fibers laid at three different angles, i.e., longitudinal, transverse, and angular orientations. Samples with five different weight percentages of carbon fibers were prepared and investigated. An Izod impact tester was used to fracture the samples and characterize the energy absorption. The fractured surfaces were observed with a scanning electron microscope (SEM). The numerical and experimental results show that crack propagation is inhibited at higher loading fractions at an angular orientation by creating obstacles for the crack to propagate and arresting the dislocation motion. The fractography analysis through a scanning electron microscope exhibits how the angular orientations of the fibers are reoriented after fracture to prevent further crack propagation.Keywords
High-performance composite materials are desired in automobiles, aerospace, buildings, bridges, and other lightweight applications. The design and analysis methods for fiber-reinforced composites at multiple stages have always been points of interest. Optimization of CFRC’s performance considering cost, manufacturing, and liability of the product poses a challenge for engineers [1]. Polymers embedded with reinforcing fibers in one or more orientations in the matrix have a vital role to play in the construction of aerospace vehicles and components [2,3]. Epoxy is widely used as a matrix over many other alternatives, such as phenolics, polyurethanes, and polyimides. Carbon fiber provides excellent performance in harsh environments compared to glass and Kevlar fibers, as they are prone to humidity. Carbon fibers not only have high strength and high elastic moduli but also possess the characteristics of lightweight and high durability. Carbon fibers have mainly been used in the aerospace and auto industries due to their high strength and lightweight. Recently, they have been used to reinforce concrete structures, piers, tunnels, and buildings. They are capable of resisting corrosion and withstanding high temperatures. A clear epoxy consisting of resin and hardener is a low-odor and solvent-free mixture that can be used to create a variety of items or even to repair damage. Anisotropic properties of CFRCs can be exploited as a benefit to obtain the required directional properties by laying up the fibers at different orientations and placing laminates in different configurations. A root-cause failure analysis can lead to the development of a mechanism to prevent the corresponding failure. Mechanical performances of composites can be investigated with a finite element analysis (FEA) [4], constitutive modeling with a cohesive damage model, a continuum damage model, stress-strain mapping, energy equivalence methods [5–8], multi-continuum mechanics [9–11], mechanism-based failure [12], fractography [13,14], and experimental observations [15–18]. Energy absorption, fracture toughness, and Von-Mises stresses can be used as measures of failures in an experimental characterization, numerical analysis, and finite element simulation. FEA is capable of investigating a crack initiation, propagation, and energy absorption with the viscoelastic and plastic behavior. In addition, it attenuates the barriers of experimental studies with a variety of loading conditions, such as quasi-static loading, vibration, shock, blast, including the combinations of mechanical, electrical, and thermal loads [5]. The number of failed elements can be compared with the total elements to report the percentage of failures in FEA. However, the robustness of the predictions depends on modeling techniques. The development of microdefects and their effects on the macroscale are modeled by a continuum damage model. Thermodynamics free energy functions concerning damage model parameters, including thermal and hygroscopic effects, can be formulated to determine the stiffness tensor. An incremental crack growth is considered as a displacement jump to model the crack propagation and delamination for the cohesive damage model. The mesh size plays a crucial role in the predicted values of damage initiation and propagation. Tension and three-point bending can be observed with a cohesive zone model. A space transformation tensor and its properties of distinct phases have been used in constitutive modeling techniques. A homogenization technique is applied to formulate a representative volume element (RVE) for multiphase materials in multiscale modeling. A Voronoi cell finite element model can be used to analyze the micromechanical response of composites and porous materials, considering elastic and elastic-plastic materials. Eulerian descriptions are used for solid and flexible materials to develop a nonlinear model. The multi-continuum approach based on constituent stress and strain decomposition is used to observe distinct stresses for fiber and laminates and design hybrid composites. A mechanism-based failure analysis sets distinctive measures for fiber, matrix, and interface failure [12]. Fractured surfaces are examined with a microscopy to decode information about a defect formation, crack initiation, propagation, and failure mechanisms. Fractography has been a useful tool for polymer composites [13,14].
Multiple experimental studies have been reported on investigating fiber tensile, compressive, shear, and delamination failures [15–18]. Numerous factors trigger the initiation of a crack and its propagation, such as manufacturing defects, impact damage, geometric discontinuities, e.g., free edges, notches, and joints that may generate interlaminar stresses [19]. The width-tapered double cantilever beam (WTDCB) and end-notched flexure (ENF) specimens have been tested to investigate interlaminar fracture of carbon/epoxy composites with tensile and flexural loading, respectively [20]. A weak interlayer bonding and interlayer porosity come into play, determining the properties of such composites [21]. The impact resistance of a composite constituent of individual fibers, interlaminar, and interfacial strength between fibers and a matrix can be determined by an Izod impact tester that measures the energy required to break a specimen by impacting it with a pendulum [22,23]. Carbon-fiber epoxy composites have been reported for energy absorptions under different loading conditions, as well as acoustic band gaps [24–27].
Epoxy nanocomposites reinforced by functionalized carbon nanotubes and graphene nanoplatelets were studied [28]. Poor dispersibility and the low interfacial strength of nanofillers negatively impact their applications, whereas the higher aspect ratio of a hexagonal nanoplatelet has a positive enhancement in its pull-out energy [28]. To achieve a better dispersion of multi-walled carbon nanotubes (MWCNTs) in the epoxy resin, acetone solvent is used as a volatile medium in the mixing process [29]. The effect of agglomeration of carbon nanotubes (CNT) on fracture toughness was studied by Zeinedini et al. [30]. Alexopoulos et al. found that the crack bridging at the interphases increases the fracture toughness in graphene-reinforced epoxy nanocomposites [31]. Fard et al. studied the strain rate effect of epoxy resin under tension and compression [32]. The effects of the size of globules, microporosity, and the appearance of local plastic deformation of samples processed by different curing techniques are observed through scanning electron microscopy [33]. A Digital Image Correlation (DIC) technique is useful to study the fracture behavior of composites [34]. This is a noncontact optical method that captures high-speed images, either with a single or multiple cameras, for two-dimensional or three-dimensional photos, respectively, during the deformation. Then, image processing techniques are applied to the collected images to track the crack propagation, deformations, and thus to predict the stress intensity factors in different modes. In addition to experimental study and finite element analysis, fracture energy for carbon nanotube-epoxy composites can be obtained from molecular dynamics simulations [35].
However, a detailed study on the orientation-dependent impact resistance of CRFCs with a numerical approach, finite element analysis, fracture experiments, and a scanning electron microscope has not yet been reported, which is studied in this report. In this study, (a) a mathematical model is applied to predict the fracture toughness of orientation-dependent carbon fiber reinforced composites at different weight percentages, (b) finite element analysis is conducted to observe the stress distribution, (c) energy absorption is characterized using an Izod impact testing machine, and (d) the fractured surfaces are observed through an SEM. Results obtained from these studies agree with each other and suggest that crack propagation can be arrested by placing the fibers at angular orientations; however, a higher weight percentage of the fibers may be required to interact with each other to place a barrier against a crack propagation.
Multiple factors play an important role in a mathematical modeling of CFRCs against impact loading. The higher the load, the severe the damage is, or the weaker the CFRC, the severe the damage is going to be. To strengthen the CFRC, we can increase the reinforcing fraction, stiffness of lamina/laminate, load transfer capability, interfacial strength, or inter-laminar strength to reduce the damage. On the other hand, a higher magnitude of force, a longer duration of impact, a heavier weight of the impactor, or a higher impact velocity will correspond to higher damage. The response of the CFRCs to an applied impact will begin with oscillations at a certain frequency. Then, as the severity of impact increases relative to the materials’ capabilities, the initial oscillations escalate to a maximum displacement, causing strain to be higher than the ultimate strain of the matrix. Therefore, the matrix initiates to failure, then the crack propagates through the matrix corresponding to a fiber failure, resulting in a fiber pullout, and finally, the interlaminar failure occurs. Fig. 1a shows the schematic of an impactor on the CFRC applying an impact force,
whereas, F is the applied force, ∆t is the time duration of impact,
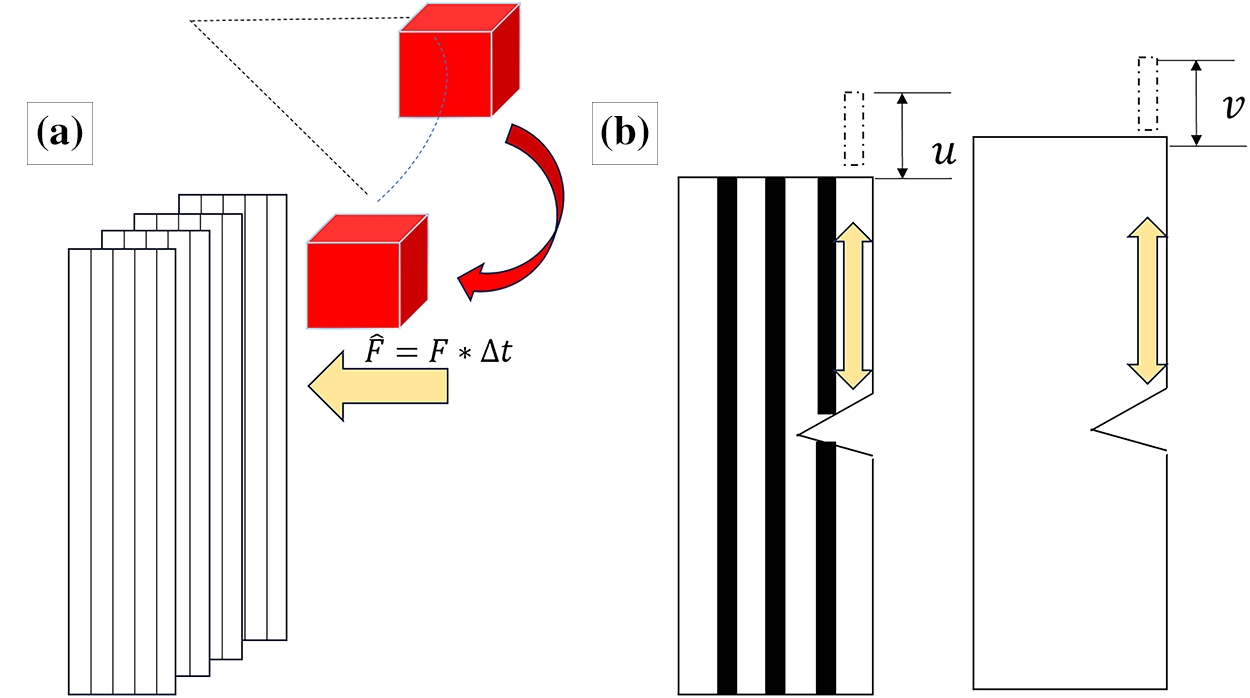
Figure 1: Numerical modeling of impact loading on fiber reinforced composites: (a) demonstration of impact loading and (b) the deformation of composites transformed into fiber and matrix displacement field
Assuming an underdamped system, the displacement response of the CFRC was predicted using the following equation:
where,
However, before using this maximum displacement for orientation-dependent constitutive modeling at different weight fractions, the natural frequency of the CFRC has to be modeled accordingly using the following equation and applying composite laminate theory:
where,
where,
where,
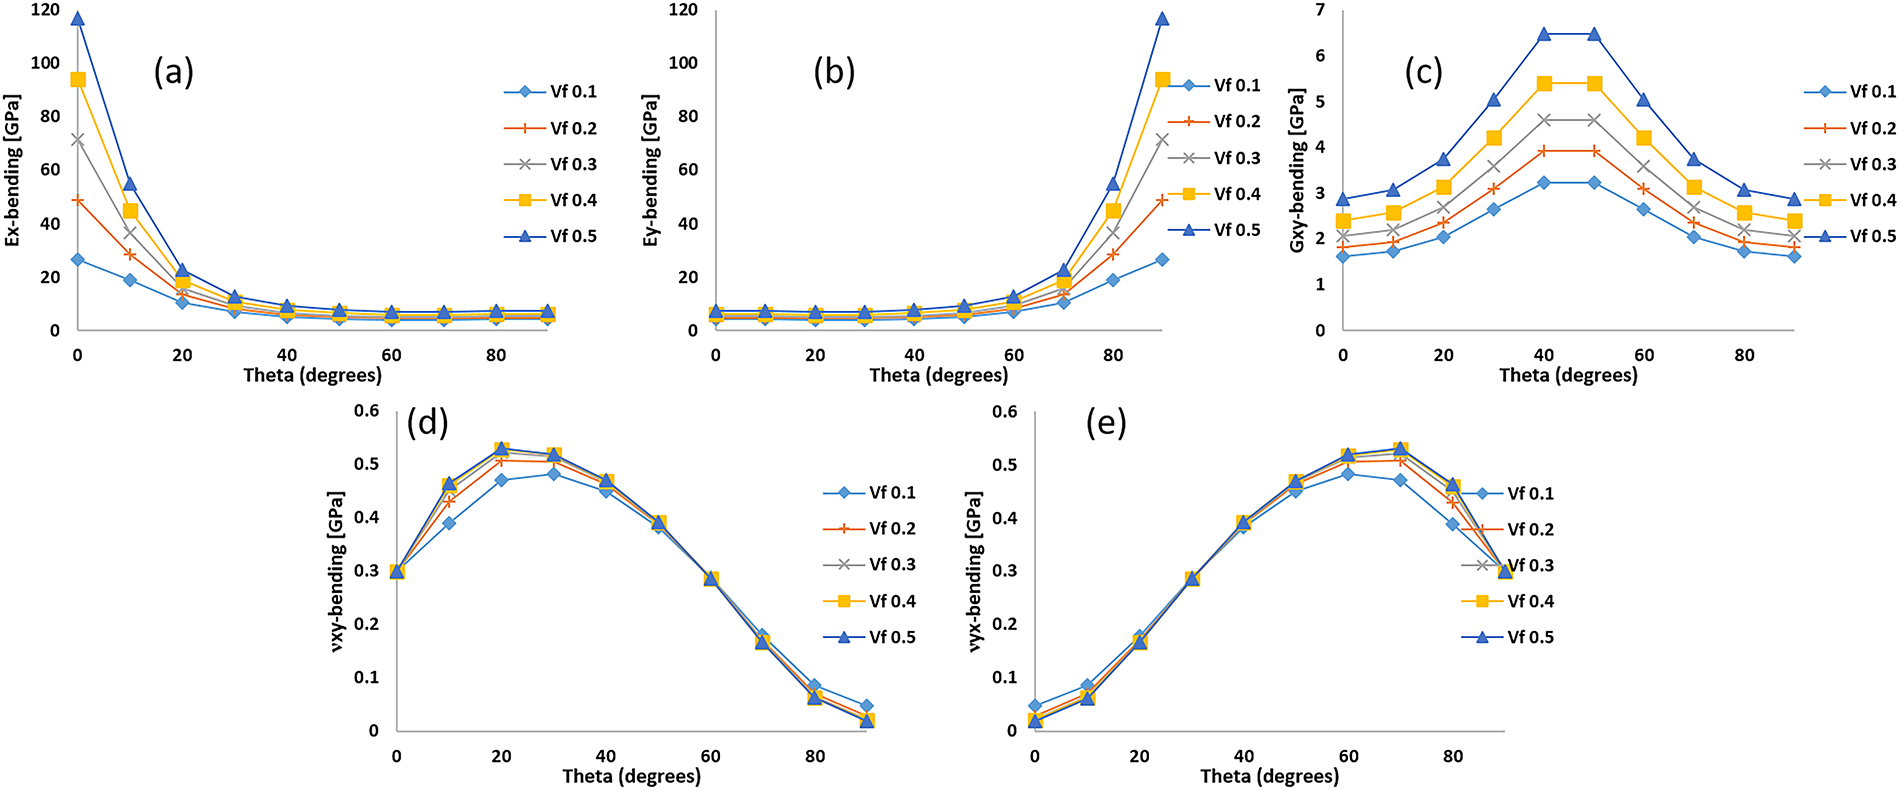
Figure 2: Prediction of elastic properties of carbon fiber-reinforced composites
Assuming the fiber failure strain is less than that of the matrix, the composite’s ultimate failure strain under shear loading was calculated as follows:
Maximum displacements, as found using Eq. (3) from these effective properties, cause ultimate stresses that are way above the ultimate strength of the composites for all orientations and weight fractions. This ensures that the composites are failing at this impact loading. Therefore, micro-mechanics is adopted to investigate the fracture properties at the fiber-level after the failure occurs, having the following assumptions [37]:
a) The fibers are extended from one end to the other.
b) Flexural stiffness of a single fiber is negligible.
c) The load is applied to the free edges/surfaces.
d) Linear, elastic, isotropic material properties are used for the constituents.
e) Fibers are uniformly distributed throughout the matrix and rigidly bonded to it.
f) The stress transfer between fibers and matrix depends on their displacements.
Fig. 3a demonstrates how the impactor is transmitting load to the fiber after breaking the first fiber using a shear mechanism. Fig. 3b was adopted to observe the stress transmission across the length of the fiber [37]. Fiber-matrix interactions primarily occur through shear stresses. The effect of a coupling agent, interfacial compatibility, and surface energies from an experimental perspective is broadly modeled as the shear stresses transmitted to the fiber. The corresponding work done from the numerical perspective is described as follows using Eqs. (16)–(33):
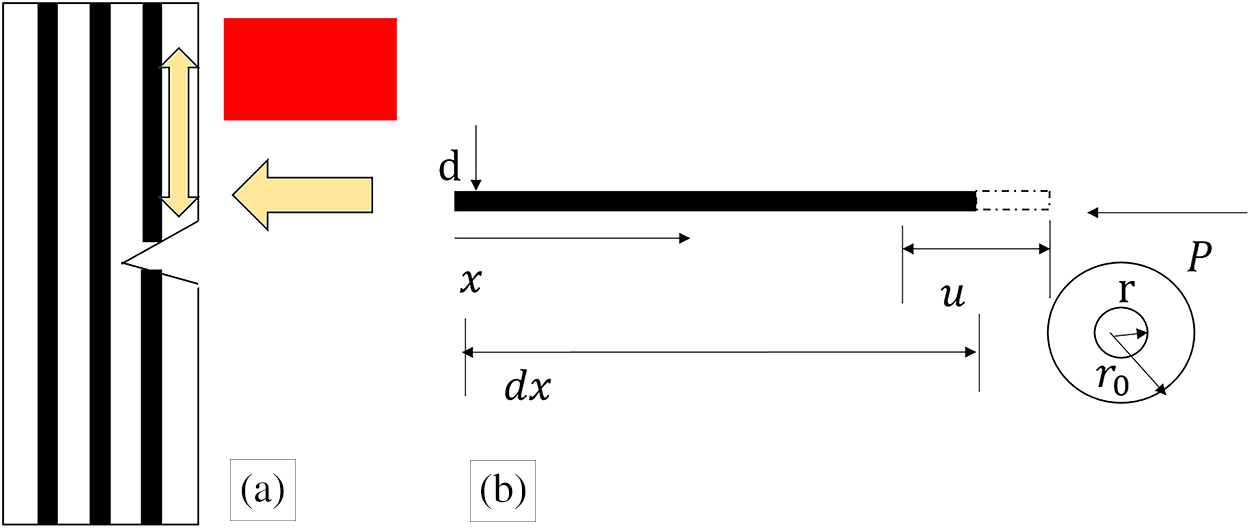
Figure 3: (a) transferring external load to the fibers and (b) longitudinal and shear stresses acting on the fiber
If
In addition, if a longitudinal force
Axial force transfer
Eq. (18) can be written as follows:
To find the distance where the fiber will fail, the boundary conditions are used as at
Therefore, the failure strain of the fiber can be calculated as:
The deformation of the fiber at failure is found as:
Total Work done
However, the shear stress transferred
In addition, using Hook’s law, P can be written as:
Assuming the matrix as a linear material, the strain developed in the matrix is:
Differentiating Eq. (24) and plugging values of (26) and (27), we obtain:
Assumed solution of
where,
whereas,
Therefore, if we return to the formulation of stress transfer
Maximus shear stress occurs at the middle of the fiber, i.e., at,
At this point, we have derived all the necessary expressions to find out the total work done in Eq. (23). Using Linear Elastic Fracture Mechanics, the fracture toughness can be expressed by the work done as follows:
where,
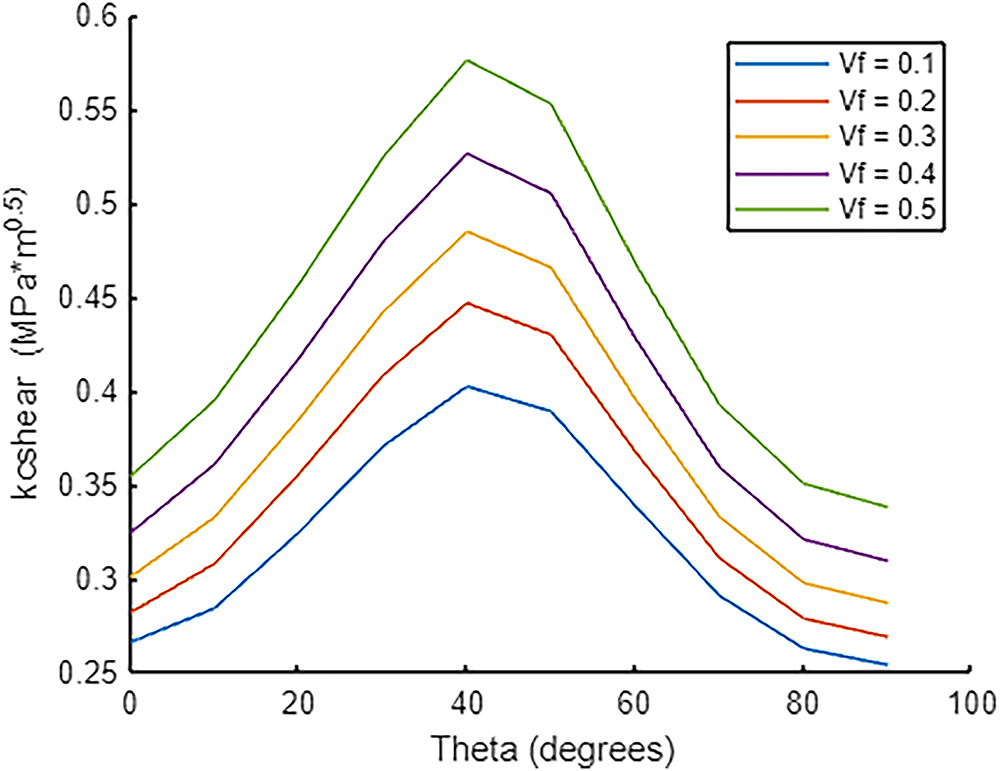
Figure 4: Prediction of fracture toughness of carbon fiber-reinforced composites
To investigate the stress distributions of fiber-reinforced composites at the micro-level, a small-scale model with
Fig. 5 shows the energy summary plot of a simulation of
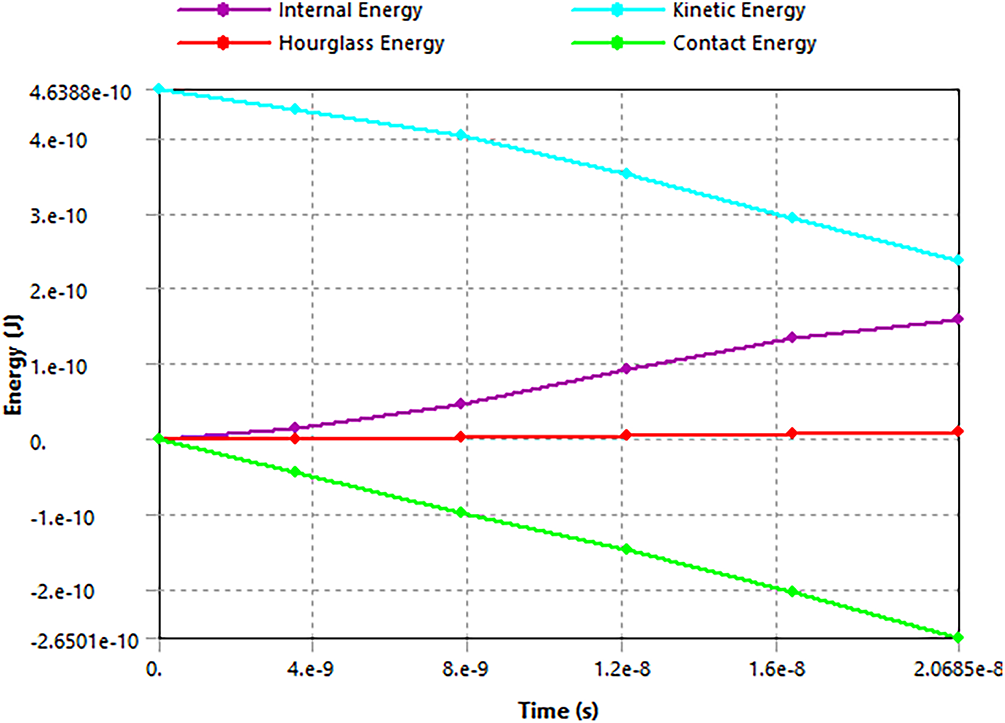
Figure 5: Energy summary of a simulation
Fig. 6a–f shows the Von-Mises stress plots for models with longitudinal one and two fibers, transverse two and four fibers, and angularly oriented two and four fibers, respectively. Stress distributions in the FEA models with longitudinal fibers show that the stress starts developing at the impacting face and propagates through the sample; however, it is interfered with by the presence of the carbon fiber. Cutout view of Fig. 6a shows the parabolic stress peak, where the peak stops at the location of the carbon fiber. However, the depth of the peak is shallower in the two-longitudinal fibers model, as shown in Fig. 6b. Because the stress transmission is interfered with at the first fiber with a shorter travel distance, whereas the second fiber experiences a much lower stress compared to the first one. Different phases of stress contours are obvious, while stress propagates in Fig. 6b. A different scenario happens while the fibers are placed in the transverse direction, as depicted in Figs. 6c,d. As the fibers do not confront stress in the perpendicular directions and stress flows parallel to the fibers, stress starts distributing conically along the length of the sample. Maximum stress occurs near the fibers on the front-impacting face, and then the conical stress distribution is observed as it travels across the depth. In this scenario, the matrix is more likely to fail even without optimizing the full reinforcement from the fibers. Fig. 6d,e shows that the stress travels at an angle for the models with fibers placed in angular directions. The hot spot for maximum stress occurs in the vicinity of the fiber in an interior location. Multiple bands of stress propagation are observed; however, single or multiple hot spots may exist depending on the amount of fibers present. Hot spots in the vicinity of the impacting zones will be intense, and they will diminish for other fibers gradually as stress propagates. Maximum Von Mises stress for a model with a longitudinal one fiber
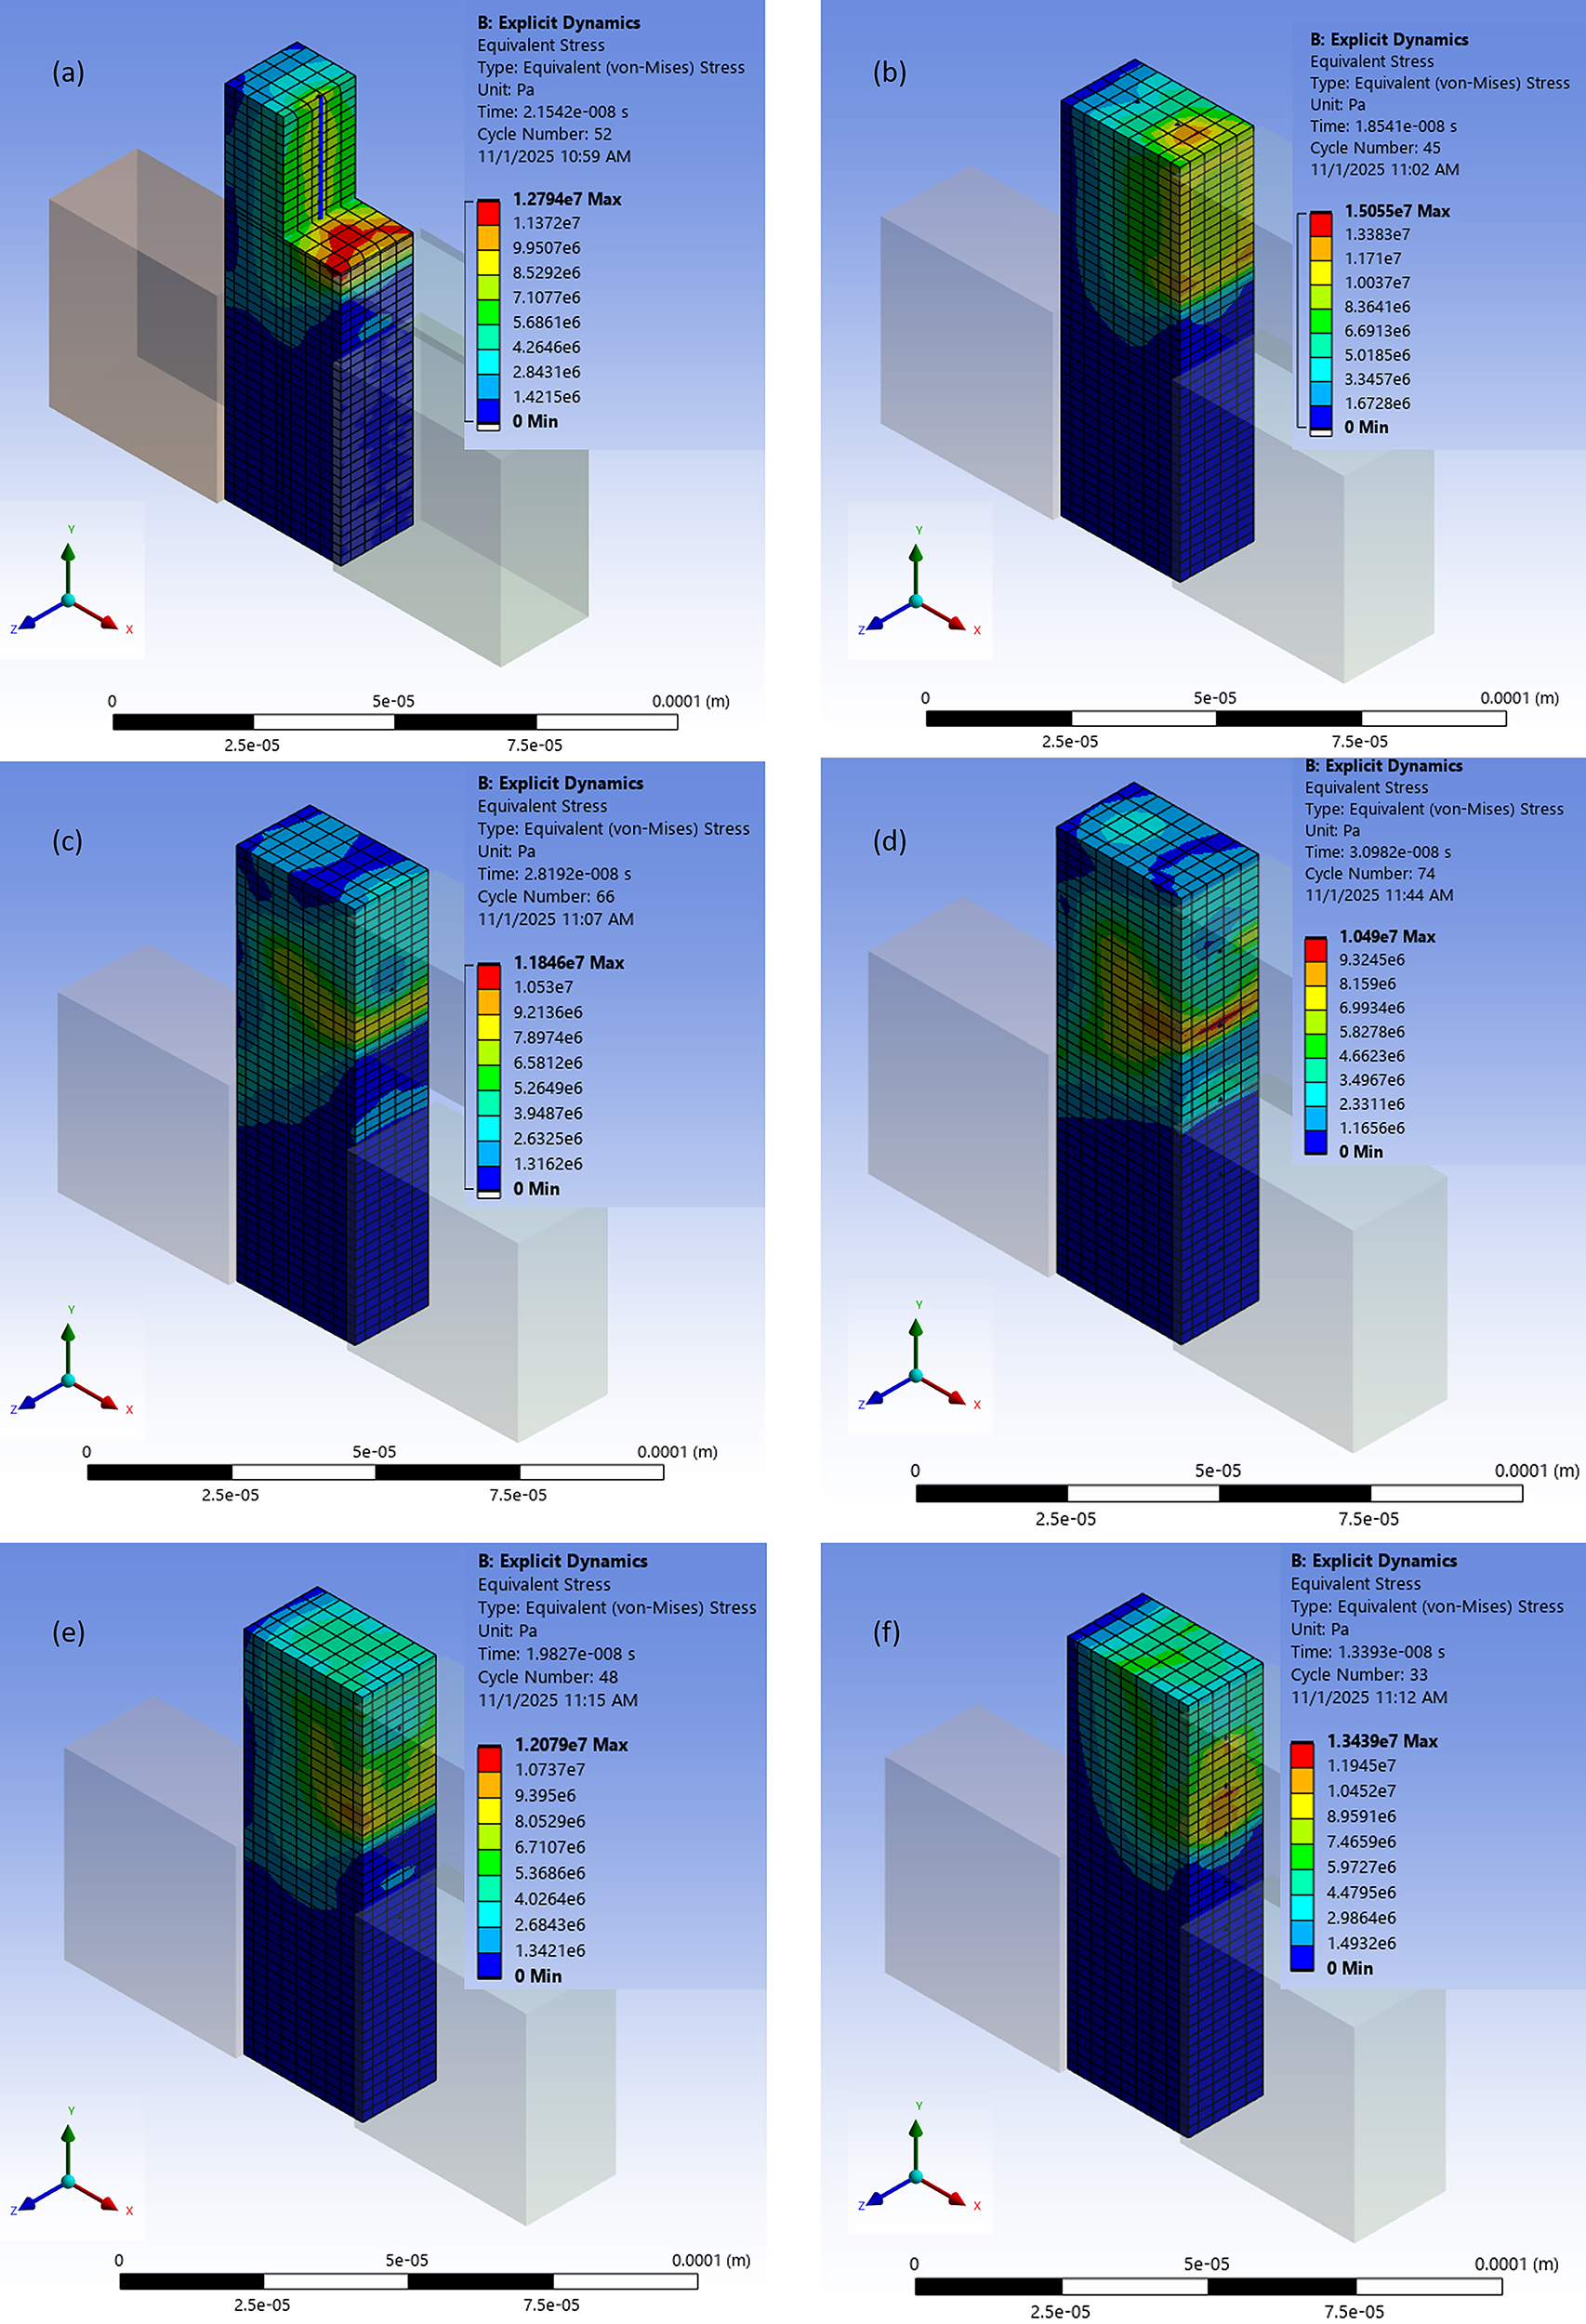
Figure 6: Von-Mises stress profiles of carbon fiber-reinforced epoxy composites against impact loading for (a) one longitudinal fiber, (b) two longitudinal fibers, (c) two transverse fibers, (d) four transverse fibers, (e) two angularly oriented fibers, and (f) four angularly oriented fibers
4 Experimental Characterizations
4.1 Composites Sample Preparation
Unidirectional carbon fibers were purchased from ACP Composites [39]. The fibers were placed in a clear epoxy at three different angular orientations, i.e.,
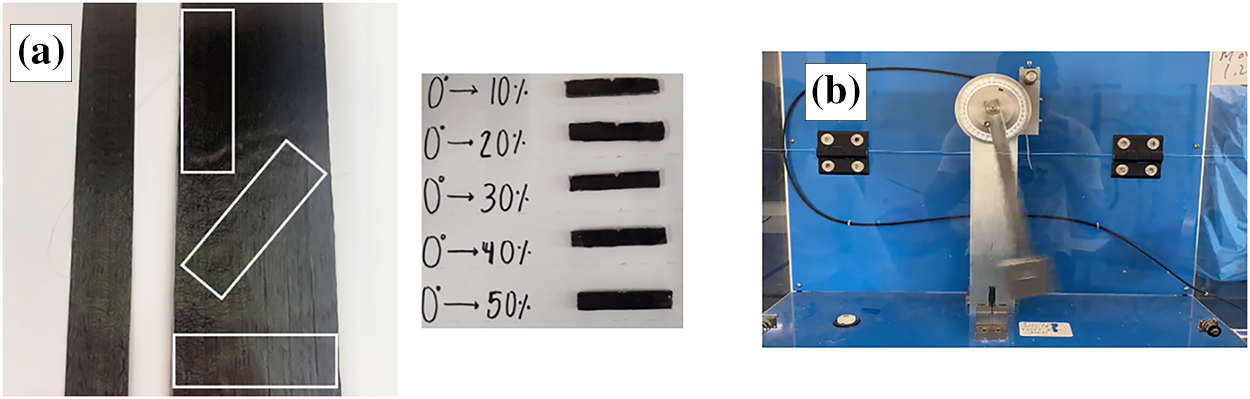
Figure 7: (a) Carbon fiber-reinforced epoxy composites sample preparations and (b) the position of the pendulum just before hitting a sample captured from a recorded video

4.2 Energy Absorption by Izod Testing
A tabletop Izod testing analog apparatus was used to determine the energy absorption of the composite specimens as depicted in Fig. 7b. A pendulum with a striking hammer reached the highest potential energy at an initial position of 150° to the vertical direction. A pendulum, an arm, and a vice were placed in a clear plastic guard for safety purposes while testing, and a hand clutch from outside was used to release the pendulum from an initial position to fracture the sample. After the fracture, the angular positions of the pendulum were read on the dial. The length of the pendulum arm was 0.33 m, and it held a mass of 1.425 kg. Specimens were fitted vertically and received an impact at a height to the middle of the specimen (22 mm in this case) for Izod testing. The specimen’s notch had to face towards the incoming direction of the impacting hammer, while the lower side of the notch was leveled with the vice. The energy absorption was calculated by subtracting the final energy after breaking the samples from the initial energy possessed, using the following equations:
where,
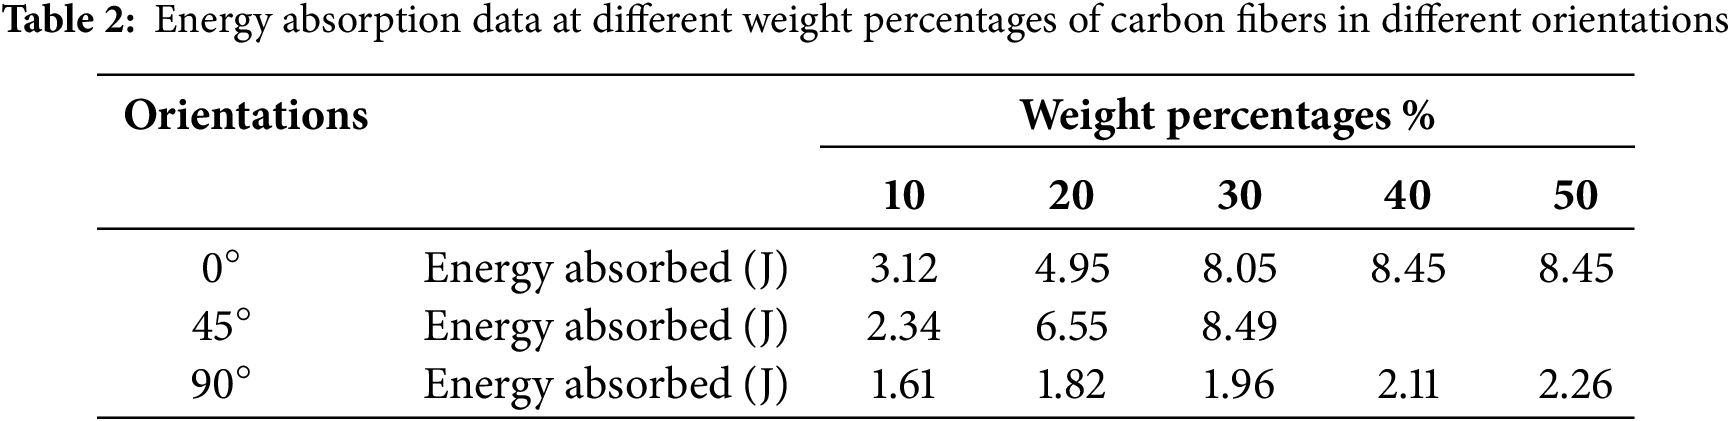
Energy loss due to friction was calculated as 0.157 J. Fig. 8 shows the comparison of the absorbed energy for different weight percentages and at different orientations. At lower weight percentages, the samples of the
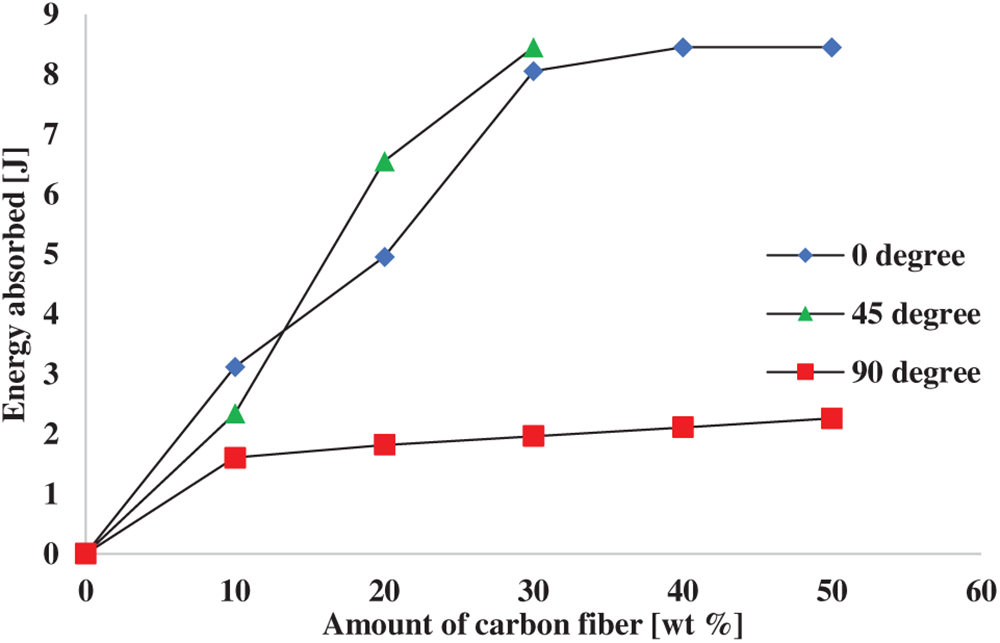
Figure 8: Comparison of energy absorption at different weight percentages of carbon fibers in different orientations
Table 2 displays the energy absorption data. It shows that the energy absorption for the samples with
The fractured samples were collected for fractography analysis to investigate the effect of carbon fiber orientations and weight percentages on fracture behavior. Fig. 9 depicts the fractured samples which were gathered to be examined with a scanning electron microscope (SEM). All SEM images were obtained using high voltage (30 kV) at 100× resolution.
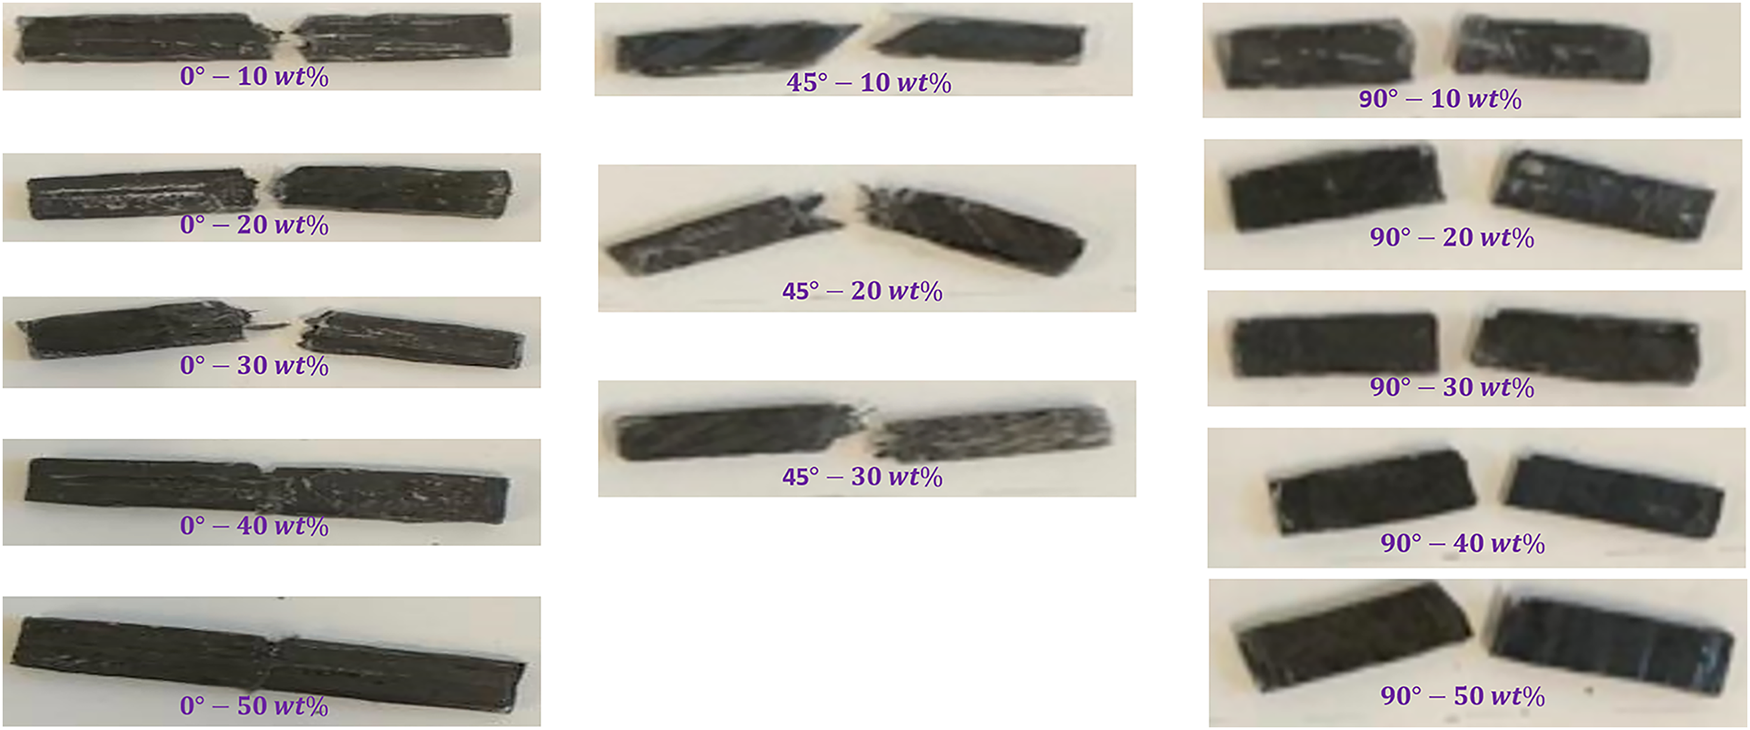
Figure 9: Fractured samples at different weight percentages of carbon fiber in different orientations
Fig. 10a–e shows the scanning electron microscope images of the fractured surfaces for 0° orientations at different weight percentages, i.e., 10%–50%, respectively. The fractured fibers were irregular at 10 wt% for a 0° orientation as the relative amount of the fibers was smaller to carry the load. The matrix mainly carried the load and transferred it to the distant fibers, exhibiting a more ductile manner of failure. However, as the weight percentages increased to higher values, the fractured surfaces became more uniform, as shown in Fig. 10b, which exhibited phenomena similar to brittle failures. Even though the samples at 0° orientations showed irregular fiber fracture, this was not capable of inhibiting the crack propagation because of their lower amount, thus there was no interference between propagations. Delamination between larger groups of fibers occurs at higher loading fractions with 0° orientation, as shown in Fig. 10e. Fiber pull-out length for a
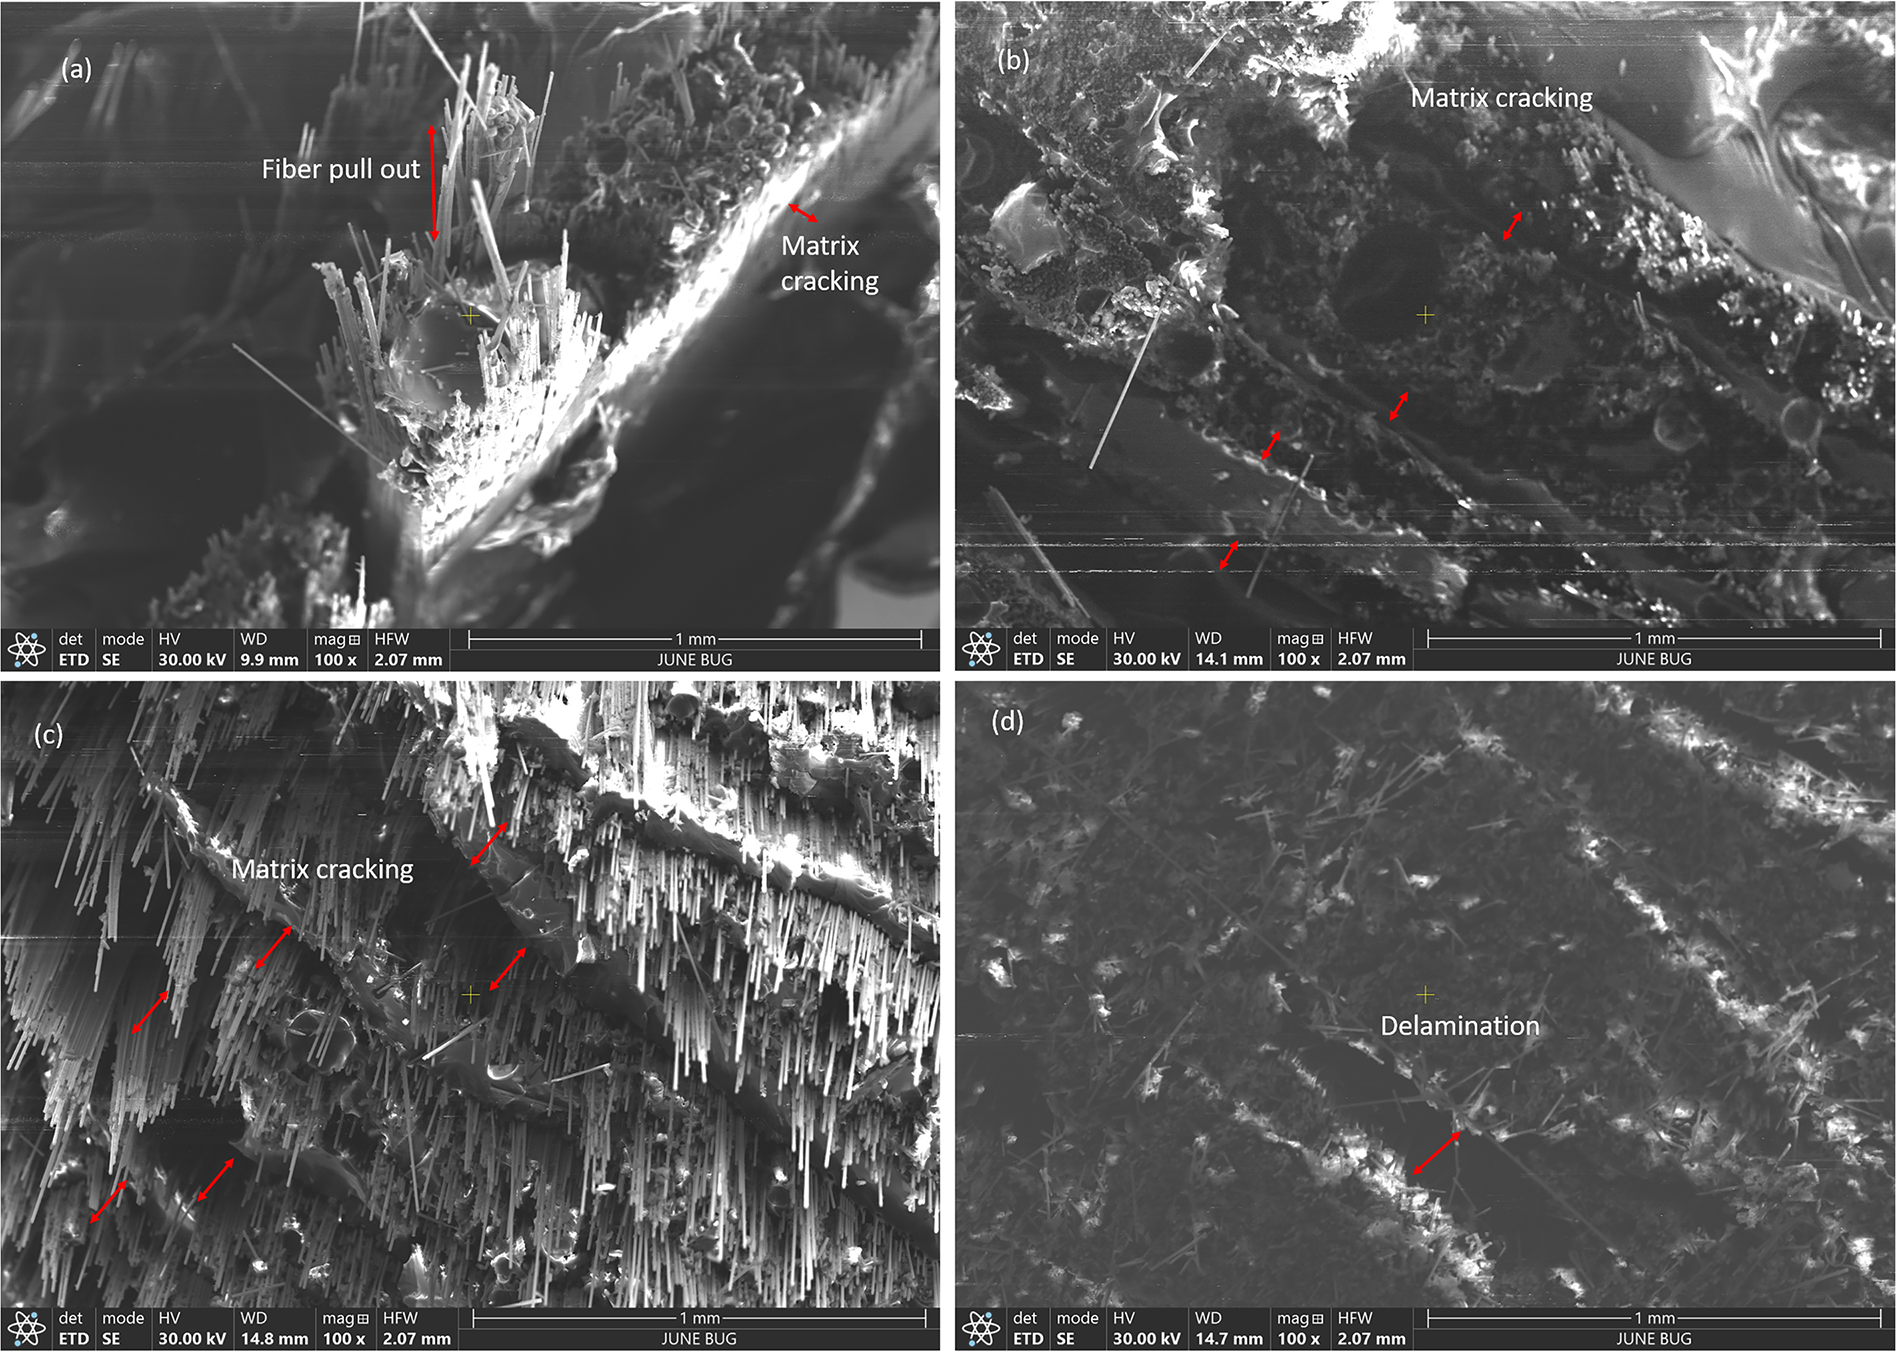
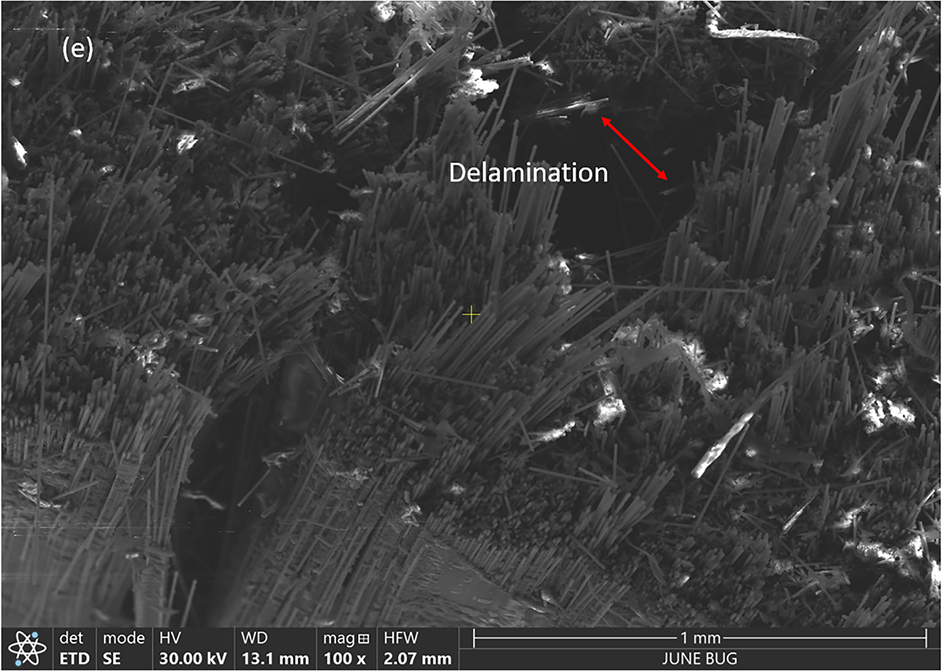
Figure 10: SEM images at 0° orientations for (a) 10 wt%, (b) 20 wt%, (c) 30 w%, (d) 40 wt%, and (e) 50 wt%
Fig. 11 depicts the fractured surfaces at 45° orientations for 10 to 30 wt%. Samples with higher weight percentages for this orientation could not be fractured due to the limitations of the machine’s capabilities. A lower amount, such as 10 wt%, did not possess enough barriers to inhibit the crack, and a group of fibers slid over another group to fail the sample easily. However, as the amount increased, a group of fractured fibers oriented in a different direction compared to other fractured groups, as depicted in Fig. 11b,c. Thus, the crack was hindered from propagating and absorbing more energy before fracture. These observations strongly agree with the experimental results of energy absorptions for angular orientations at higher weight percentages. Crack deflection angles are measured as
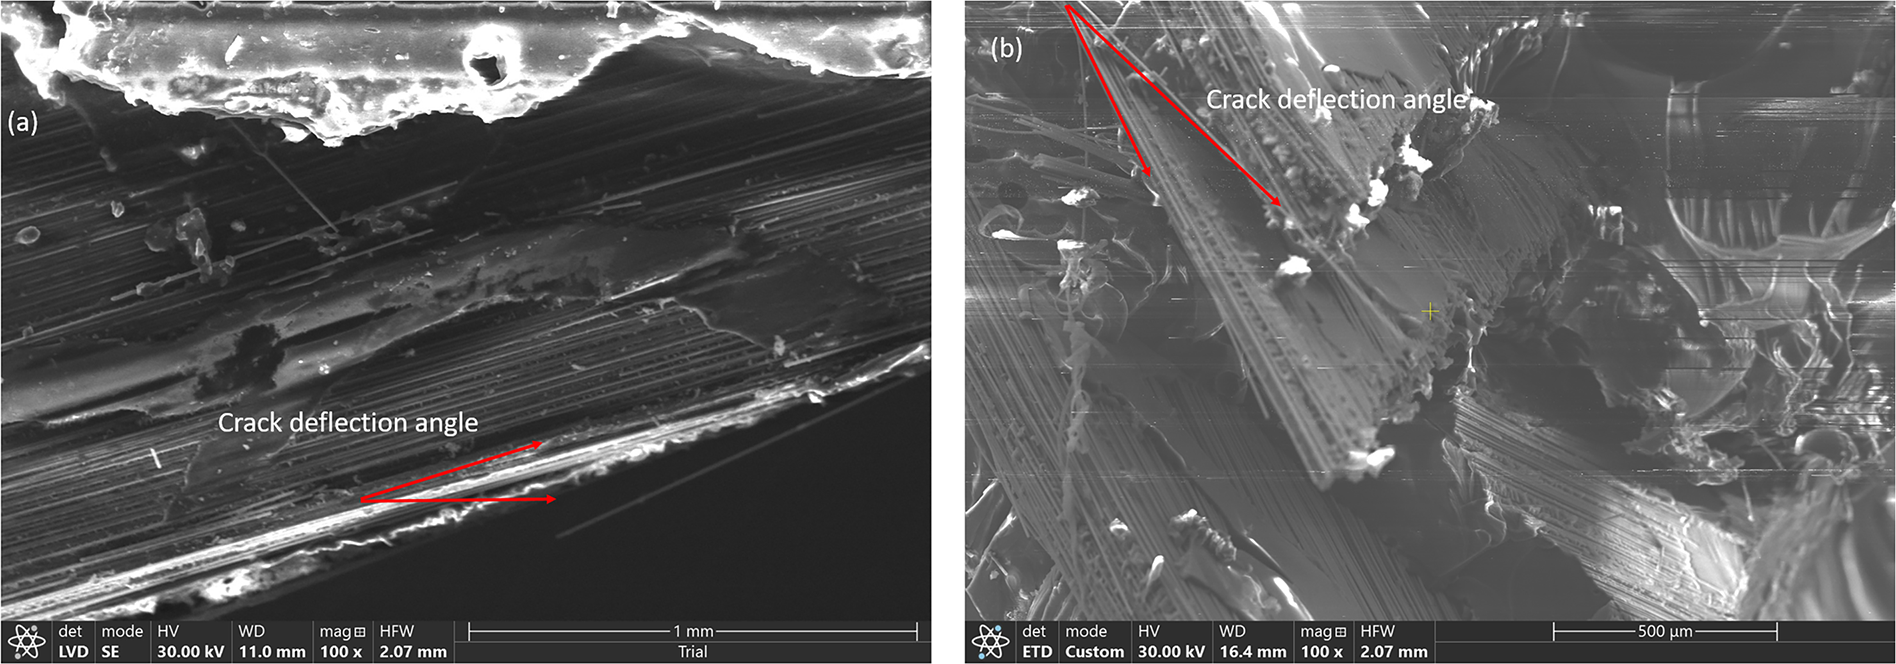
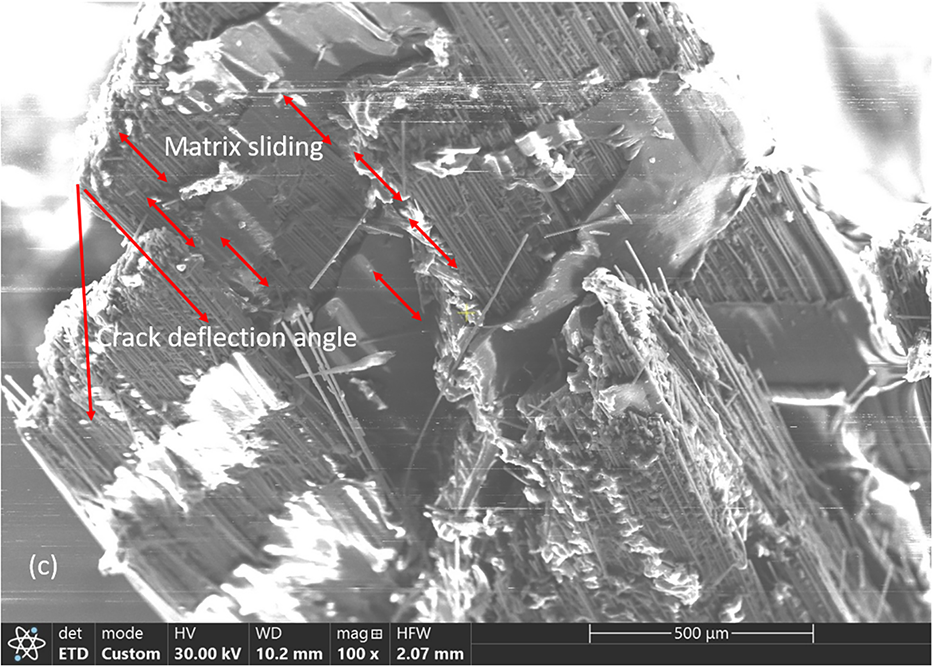
Figure 11: SEM images at 45° orientation for (a) 10 wt%, (b) 20 wt%, and (c) 30 w%
Fig. 12 demonstrates the fractured surfaces at the 90° orientation for 10 to 50 wt%. Fibers were oriented in the parallel direction of the striker to hit, and fibers slid over each other very easily, as shown in Fig. 12, demonstrating lower resistance to fracture at all different loading fractions. This configuration showed the lowest value of absorbed energy, as discussed earlier in this study, compared to other orientations. In addition, the rate of increment for different wt% for this orientation was the lowest, becoming almost flat after 10% and insignificant compared to the two other orientations.
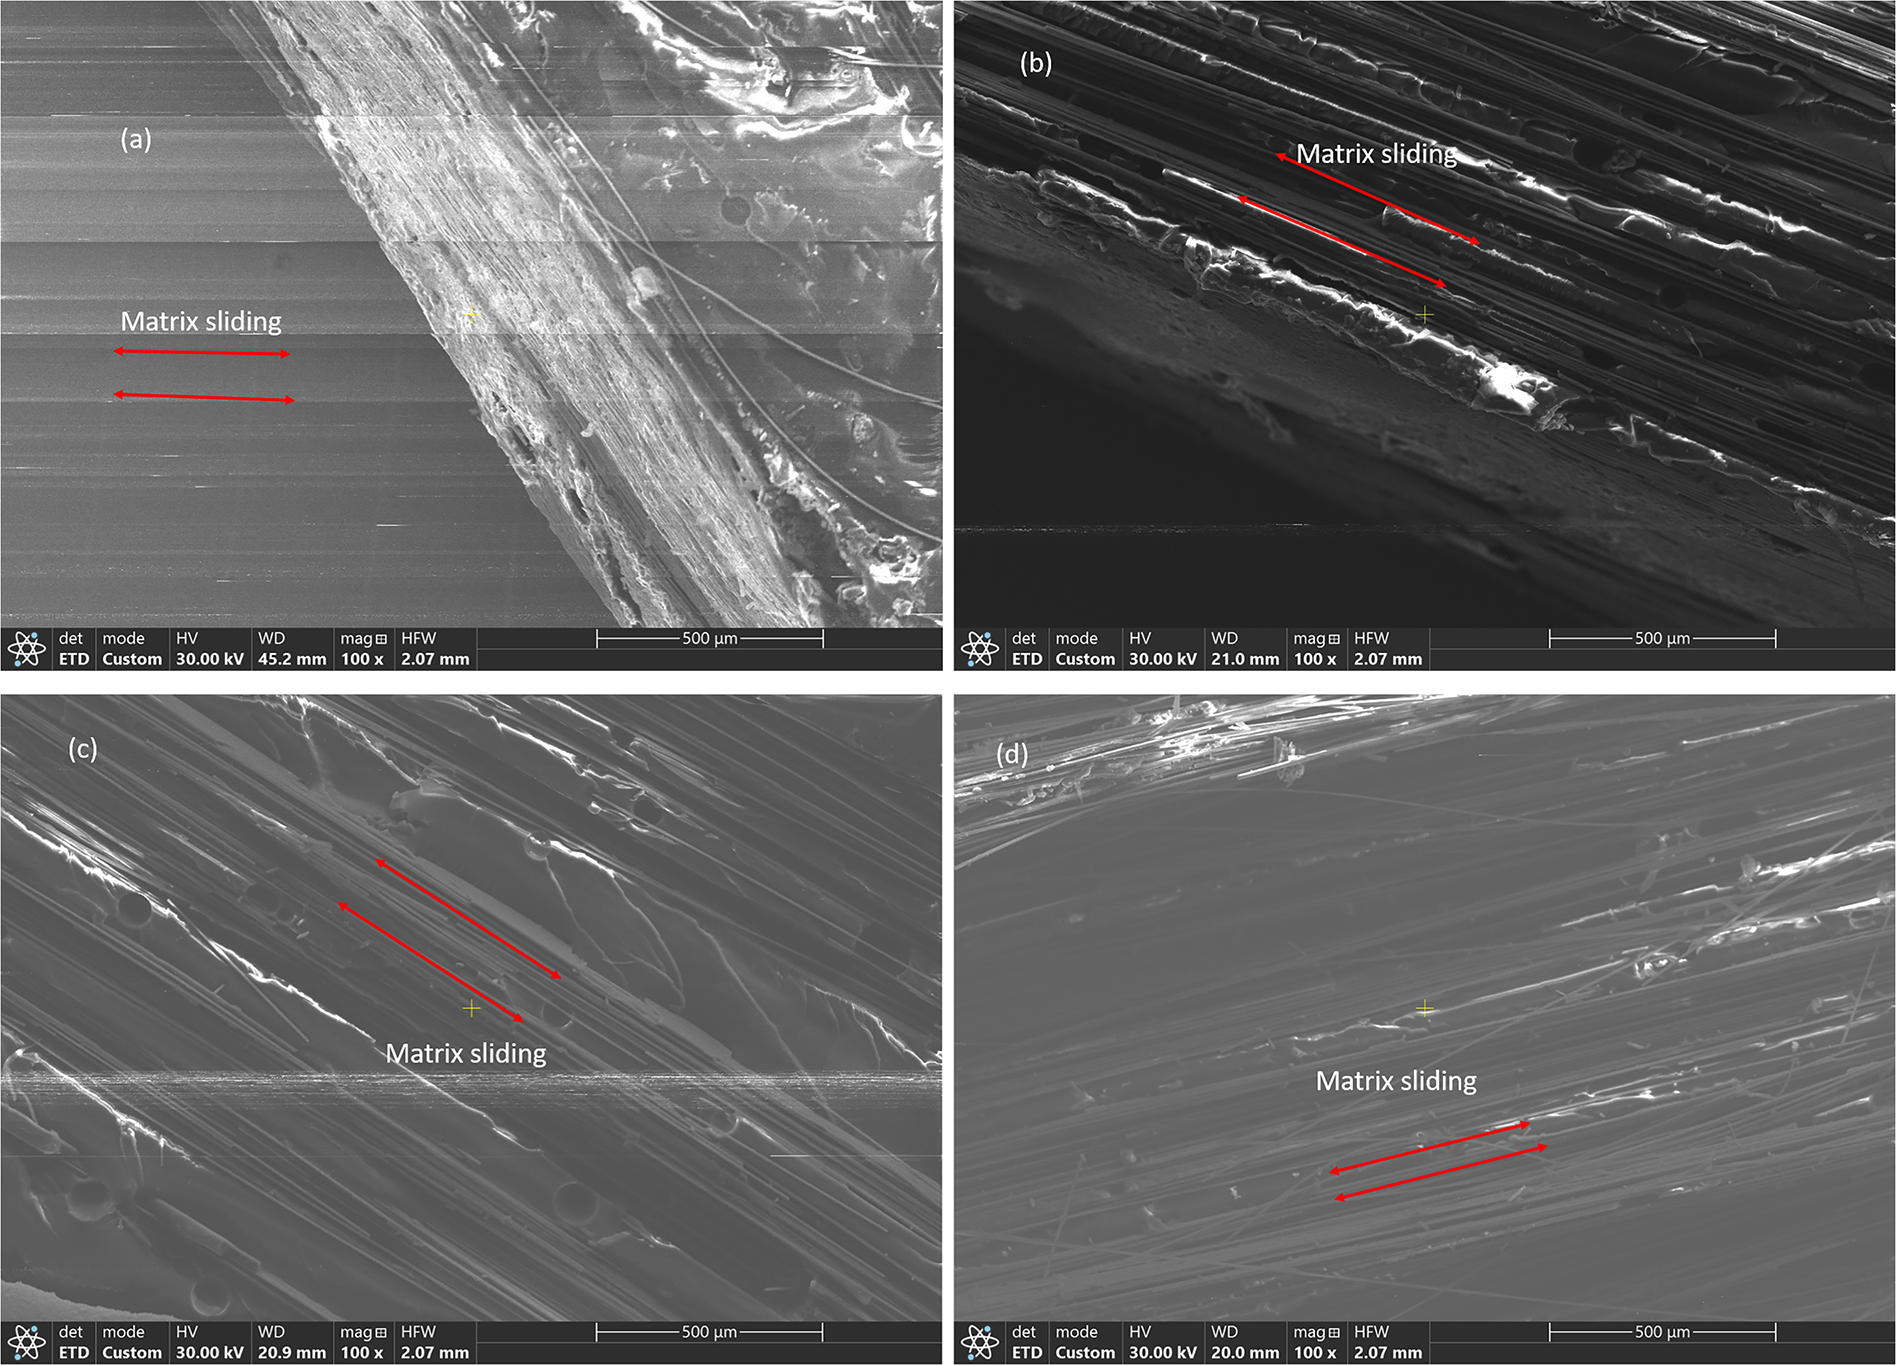
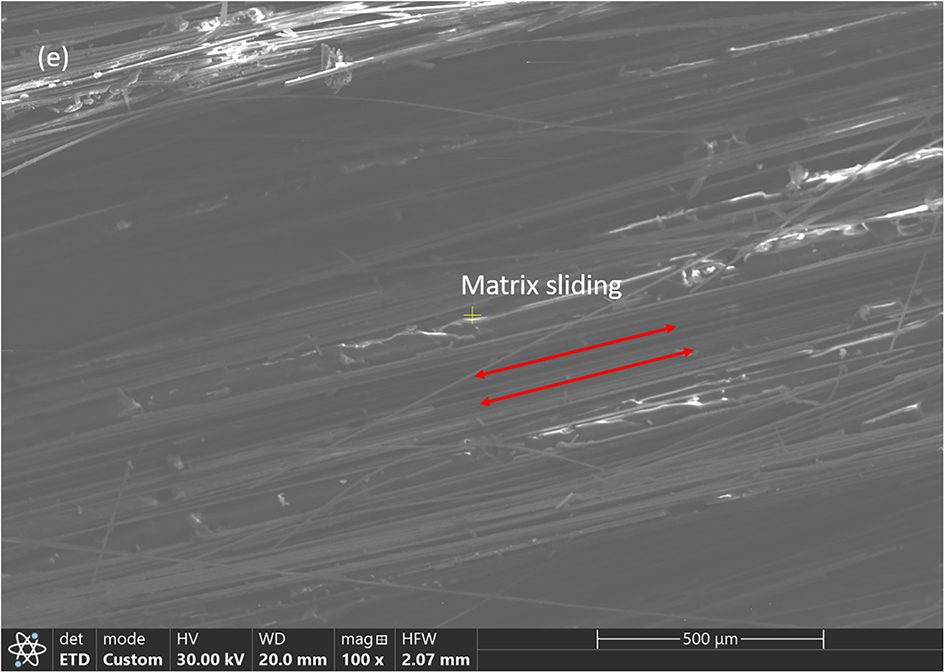
Figure 12: SEM images at 90° orientation for (a) 10 wt%, (b) 20 wt%, (c) 30 w%, (d) 40 wt%, and (e) 50 wt%
Investigations of fracture and crack propagation with a built-in V-notch carbon fiber-reinforced epoxy composite samples have been conducted in this study to guide a better design of composites against impact failure. This work would be useful in many applications, including but not limited to aerospace components, building materials, automotive parts, composite pipelines, and sports goods. Energy absorption to fracture by an impactor determines its ability to withstand impact and crack propagation. Multiple configurations with varying weight percentages have been investigated to predict their behaviors. Experimental sample preparations, fracturing with an Izod impact tester, observations under a scanning electron microscope, numerical analysis, and finite element simulations suggest consistent findings. Higher loading fractions of the fibers make the composites stronger; however, as CFRCs are anisotropic, stronger composites can be designed by tuning their orientations with lower loading fractions. A threshold loading fraction may exist to activate this phenomenon through the interactions between fibers and matrix. When the fiber’s longitudinal directions are placed perpendicular to the direction of the impact, maximum resistances are observed. When they are placed in a parallel direction, they exhibit the lowest resistance. Any angular orientations should fall between these two limits; however, angular orientations at higher concentrations may supersede the impact resistance compared to others. The fibers at the fracture surface are irregular at lower concentrations when their longitudinal directions are placed perpendicular to the impact directions; however, they fail in a brittle manner at higher concentrations. Fibers cross each other or form layers of fractured fibers for angular orientations, which provides another barrier against crack propagation. When fiber’s longitudinal directions are parallel to the impact directions, they provide less resistance, and no significant differences are found between lower and higher loading fractions. Von-Mises stresses from impact tests in finite element simulations, considering the actual dimensions of the fiber and fracture toughness from numerical analysis, agree well with the experimental observations. Temperature-dependent fracture for fiber-reinforced composites against impact loading can be explored in the future [40]. Cured epoxy resin, as well as carbon fiber, may not show significant viscoelastic/plastic response, as they are brittle in behavior. However, as those areas are wide and demand detailed investigations, those effects will be studied in the future with numerical/experimental methods as well as with molecular dynamics. This paper primarily focuses on numerical and experimental investigations of the fracture behavior of composites. Detailed study on functional modification of the reinforcing fibers, synthesis of the composites with different techniques, and structural characterizations are left for future study. The impact on composites may have different modes and require different types of investigations, depending on the mass of the impactor, the time of impact, the thickness of the laminates, and the orientations of the reinforcing agents. For example, if impact energy is below the delamination threshold, a load deflection or indentation analysis might be helpful [41]. To design based on inter-laminar failure when it is evident from the loading condition, one might need a double-cantilever beam (DCB) or end-loaded split (ELS) test [42]. Out-of-plane impact may be necessary for thinner panels; however, in-plane impact analysis helps investigate crack propagation through composite components. However, separate investigations are required for short and long fibers, which are left for future studies. As we used a tabletop impact testing machine with a lesser capacity, the stronger samples, such as 40 and 50 wt% for 45°-oriented samples, were not broken due to insufficient impact energy. Therefore, the maximum capacity of the testing equipment should be selected based on the samples prepared. However, the predictions are consistent with the numerical estimation, as shown in Fig. 4 and the Finite element simulation as depicted in Fig. 6. Numerical predictions in this study are lower compared to the similar experimental data, as the experiments did not consider the fiber orientation effect. For the fiber-reinforced composites, the angled fibers inhibit crack propagation and enhance toughness, whereas they could still be lower than the functional modification of nanofiller composites. Modified nanofillers will have a stronger bonding with the matrix itself compared to unmodified reinforcements. Fibers are assumed to be uniformly distributed and rigidly bonded in the numerical model to apply linear elastic fracture mechanics for the estimation of fracture toughness. Whereas SEM images show debonding, matrix cracking, delamination, and sliding during fracture, an internal cohesion model or interface friction model may be incorporated in both numerical and finite element analysis to observe the crack propagation behavior in the future.
Carbon fiber-reinforced epoxy composites are prepared using a hand layup method. An Izod impact tester has been used to fracture the samples. Energy absorptions for breaking are calculated and plotted for various loading fractions and orientations to compare and analyze. Fractured surfaces are observed with a scanning electron microscope. Finite element simulations are also conducted, considering the actual diameter of the fiber. All of these studies conclude that orientation and loading fractions of carbon fibers open design space to optimize composite properties for light-weight applications, with the following key points:
• Resistance against impact failure increases as the carbon percentage increases.
• The rate of increment of fracture resistance to weight percentages is the highest in an angular orientation and lowest in the transverse direction, i.e., 90° orientation.
• Fracture resistance may not increase after a certain weight percentage of reinforcing elements. Stress is transferred from the matrix to the reinforcing agent through interfacial bonding. There is a threshold for the reinforcement, beyond which a lesser amount of matrix material offers inadequate bonding. In this situation, reinforcing agents become a burden instead of carrying the load for the composites.
• Non-uniform rupture occurs with 0° samples, i.e., fibers placed in longitudinal directions and with the impact directions perpendicular to them.
• Uniform rupture with 90° samples showing lower resistance and no significant changes, even with higher loading fractions.
• Samples with angular orientations produce a crisscrossed layered pattern of the fractured fiber under impact loading that exhibits the mechanism of creation of an additional barrier against crack propagation. The absorbed energy for
Acknowledgement: The author would like to thank Esteban Garcia1, Rodolfo Garcia, and Alejandro Sosa for preparing composite samples by hand-layup method and conducting the Izod testing, and appreciates Tazrian Ismail for running a MATLAB code for a few of the composite effective properties. The author appreciates Dr. Mesut Yurukcu’s help with the scanning electron microscope and Jim McPherson’s help in slicing the fractured surface for SEM imaging. The author would like to acknowledge the Texas Water and Energy Institute (TWEI) for the use of a scanning electron microscope (SEM).
Funding Statement: This study has been partially supported by the University of Texas (UT) system STARs grant, Semester Undergraduate Research Experience (SURE) program at the College of Engineering at the University of Texas Permian Basin (UTPB), and EM-STEP (Engineering Minority Student Engagement Project) at UTPB College of Engineering, funded by Department of Education.
Availability of Data and Materials: The authors confirm that the data supporting the findings of this study are available within the article.
Ethics Approval: Not applicable.
Conflicts of Interest: The author declares no conflicts of interest to report regarding the present study.
References
1. Egbo MK. A fundamental review on composite materials and some of their applications in biomedical engineering. J King Saud Univ-Eng Sci. 2021;33(8):557–68. doi:10.1016/j.jksues.2020.07.007. [Google Scholar] [CrossRef]
2. Sabet M. Revolutionizing structures: the rise of high-performance composite and nanocomposite polymers. Polym Bull. 2025;82(10):4257–306. doi:10.1007/s00289-025-05720-8. [Google Scholar] [CrossRef]
3. Chung DD. Composite materials: science and applications. Berlin/Heidelberg, Germany: Springer; 2010. doi:10.1007/978-1-84882-831-5. [Google Scholar] [CrossRef]
4. Emayavaramban E, Raj ELP. Finite element analysis of different composite materials using multi continuum method. IOSR J Mech Civ Eng. 2014;11(5):94–9. doi:10.9790/1684-11559499. [Google Scholar] [CrossRef]
5. Guo Q, Yao W, Li W, Gupta N. Constitutive models for the structural analysis of composite materials for the finite element analysis: a review of recent practices. Compos Struct. 2021;260:113267. doi:10.1016/j.compstruct.2020.113267. [Google Scholar] [CrossRef]
6. Latorre M, Montáns FJ. Stress and strain mapping tensors and general work-conjugacy in large strain continuum mechanics. Appl Math Model. 2016;40(5–6):3938–50. doi:10.1016/j.apm.2015.10.045. [Google Scholar] [CrossRef]
7. Zhang L, Jasa J, Gazonas G, Jérusalem A, Negahban M. Extracting continuum-like deformation and stress from molecular dynamics simulations. Comput Meth Appl Mech Eng. 2015;283:1010–31. doi:10.1016/j.cma.2014.10.018. [Google Scholar] [CrossRef]
8. Egner H, Ryś M. Total energy equivalence in constitutive modeling of multidissipative materials. Int J Damage Mech. 2017;26(3):417–46. doi:10.1177/1056789516679496. [Google Scholar] [CrossRef]
9. Nelson E, Gies J, Hansen A, Fertig R. The virtues of multicontinuum mechanics for composites analysis. In: 50th AIAA/ASME/ASCE/AHS/ASC Structures, Structural Dynamics, and Materials Conference; 2009 May 4–7; Palm Springs, CA, USA. doi:10.2514/6.2009-2477. [Google Scholar] [CrossRef]
10. Key CT, Schumacher SC, Hansen AC. Progressive failure modeling of woven fabric composite materials using multicontinuum theory. Compos Part B Eng. 2007;38(2):247–57. doi:10.1016/j.compositesb.2006.03.006. [Google Scholar] [CrossRef]
11. Mayes JS, Hansen A. Multicontinuum failure analysis of composite structural laminates. Mech Adv Mat Struct. 2001;8(4):249–62. doi:10.1080/107594101753172502. [Google Scholar] [CrossRef]
12. Dutra TA, Ferreira RTL, Resende HB, Blinzler BJ, Asp LE. Mechanism based failure of 3D-printed continuous carbon fiber reinforced thermoplastic composites. Compos Sci Technol. 2021;213:108962. doi:10.1016/j.compscitech.2021.108962. [Google Scholar] [CrossRef]
13. Ojha S, Bisaria H, Mohanty S, Kanny K. Fractographic analysis of fiber-reinforced polymer laminate composites for marine applications: a comprehensive review. Polym Compos. 2024;45(8):6771–87. doi:10.1002/pc.28271. [Google Scholar] [CrossRef]
14. Hernandez DA, Soufen CA, Orlandi MO. Carbon fiber reinforced polymer and epoxy adhesive tensile test failure analysis using scanning electron microscopy. Mat Res. 2017;20(4):951–61. doi:10.1590/1980-5373-mr-2017-0229. [Google Scholar] [CrossRef]
15. Sun Q, Guo H, Zhou G, Meng Z, Chen Z, Kang H, et al. Experimental and computational analysis of failure mechanisms in unidirectional carbon fiber reinforced polymer laminates under longitudinal compression loading. Compos Struct. 2018;203:335–48. doi:10.1016/j.compstruct.2018.06.028. [Google Scholar] [CrossRef]
16. Ren M, Weng F, Sun J, Zhang Z, Ma Z, Li T. Numerical and experimental failure analysis of carbon fiber-reinforced polymer-based pyrotechnic separation device. Int J Aerosp Eng. 2020;2020:2180927. doi:10.1155/2020/2180927. [Google Scholar] [CrossRef]
17. Mortazavian S, Fatemi A. Effects of fiber orientation and anisotropy on tensile strength and elastic modulus of short fiber reinforced polymer composites. Compos Part B Eng. 2015;72:116–29. doi:10.1016/j.compositesb.2014.11.041. [Google Scholar] [CrossRef]
18. Monteiro SN, Lopes FPD, Nascimento DCO, da Silva Ferreira A, Satyanarayana KG. Processing and properties of continuous and aligned curaua fibers incorporated polyester composites. J Mater Res Technol. 2013;2(1):2–9. doi:10.1016/j.jmrt.2013.03.006. [Google Scholar] [CrossRef]
19. Cahill LMA, Natarajan S, Bordas SPA, O’Higgins RM, McCarthy CT. An experimental/numerical investigation into the main driving force for crack propagation in uni-directional fibre-reinforced composite laminae. Compos Struct. 2014;107:119–30. doi:10.1016/j.compstruct.2013.05.039. [Google Scholar] [CrossRef]
20. Hwang JH, Lee CS, Hwang W. Effect of crack propagation directions on the interlaminar fracture toughness of carbon/epoxy composite materials. Appl Compos Mater. 2001;8(6):411–33. doi:10.1023/A:1012663722334. [Google Scholar] [CrossRef]
21. Es-Said OS, Foyos J, Noorani R, Mendelson M, Marloth R, Pregger BA. Effect of layer orientation on mechanical properties of rapid prototyped samples. Mater Manuf Process. 2000;15(1):107–22. doi:10.1080/10426910008912976. [Google Scholar] [CrossRef]
22. Roberson DA, Torrado Perez AR, Shemelya CM, Rivera A, MacDonald E, Wicker RB. Comparison of stress concentrator fabrication for 3D printed polymeric izod impact test specimens. Addit Manuf. 2015;7:1–11. doi:10.1016/j.addma.2015.05.002. [Google Scholar] [CrossRef]
23. Carvelli V, Betti A, Fujii T. Fatigue and Izod impact performance of carbon plain weave textile reinforced epoxy modified with cellulose microfibrils and rubber nanoparticles. Compos Part A Appl Sci Manuf. 2016;84:26–35. doi:10.1016/j.compositesa.2016.01.005. [Google Scholar] [CrossRef]
24. Ataabadi PB, Karagiozova D, Alves M. Crushing and energy absorption mechanisms of carbon fiber-epoxy tubes under axial impact. Int J Impact Eng. 2019;131:174–89. doi:10.1016/j.ijimpeng.2019.03.006. [Google Scholar] [CrossRef]
25. Feraboli P, Cleveland T, Ciccu M, Stickler P, DeOto L. Defect and damage analysis of advanced discontinuous carbon/epoxy composite materials. Compos Part A Appl Sci Manuf. 2010;41(7):888–901. doi:10.1016/j.compositesa.2010.03.002. [Google Scholar] [CrossRef]
26. Ryzińska G, David M, Prusty G, Tarasiuk J, Wroński S. Effect of fibre architecture on the specific energy absorption in carbon epoxy composite tubes under progressive crushing. Compos Struct. 2019;227:111292. doi:10.1016/j.compstruct.2019.111292. [Google Scholar] [CrossRef]
27. Li CL, Jiang DZ, Zeng JC, Ju S. The use of cutting carbon fiber fabric/epoxy composites as band-pass frequency selective surfaces. J Compos Mater. 2014;48(18):2281–8. doi:10.1177/0021998313497495. [Google Scholar] [CrossRef]
28. Cha J, Kim J, Ryu S, Hong SH. Comparison to mechanical properties of epoxy nanocomposites reinforced by functionalized carbon nanotubes and graphene nanoplatelets. Compos Part B Eng. 2019;162:283–8. doi:10.1016/j.compositesb.2018.11.011. [Google Scholar] [CrossRef]
29. Rajsekhar V, Gattu M. Fracture and energetic strength scaling of epoxy-resins toughened with multi-walled carbon nanotubes. Eng Fract Mech. 2022;268:108495. doi:10.1016/j.engfracmech.2022.108495. [Google Scholar] [CrossRef]
30. Zeinedini A, Shokrieh MM, Ebrahimi A. The effect of agglomeration on the fracture toughness of CNTs-reinforced nanocomposites. Theor Appl Fract Mech. 2018;94:84–94. doi:10.1016/j.tafmec.2018.01.009. [Google Scholar] [CrossRef]
31. Alexopoulos ND, Paragkamian Z, Poulin P, Kourkoulis SK. Fracture related mechanical properties of low and high graphene reinforcement of epoxy nanocomposites. Compos Sci Technol. 2017;150:194–204. doi:10.1016/j.compscitech.2017.07.030. [Google Scholar] [CrossRef]
32. Fard MY, Liu Y, Chattopadhyay A. Characterization of epoxy resin including strain rate effects using digital image correlation system. J Aerosp Eng. 2012;25(2):308–19. doi:10.1061/(asce)as.1943-5525.0000127. [Google Scholar] [CrossRef]
33. Matveev EV, Mamontov AV, Gajdar AI, Lapshinov BA, Vinogradov AN. Measurement of the strength and microstructural characteristics of epoxy polymers cured by thermal and microwave methods. Meas Tech. 2021;63(12):986–92. doi:10.1007/s11018-021-01882-9. [Google Scholar] [CrossRef]
34. Lee D, Tippur H, Kirugulige M, Bogert P. Experimental study of dynamic crack growth in unidirectional graphite/epoxy composites using digital image correlation method and high-speed photography. J Compos Mater. 2009;43(19):2081–108. doi:10.1177/0021998309342139. [Google Scholar] [CrossRef]
35. Kim JH, Lee J, Wang H, Shin H. Theoretical understanding of fracture toughness improvement in carbon nanotube-coated fiber/epoxy composites: a multiscale study. Eng Fract Mech. 2025;325:111276. doi:10.1016/j.engfracmech.2025.111276. [Google Scholar] [CrossRef]
36. Kaw AK. Mechanics of composite materials. Boca Raton, FL, USA: CRC Press; 1979. [Google Scholar]
37. Cox HL. The elasticity and strength of paper and other fibrous materials. Br J Appl Phys. 1952;3(3):72–9. doi:10.1088/0508-3443/3/3/302. [Google Scholar] [CrossRef]
38. ASTM D. ASTM D 256-10 standard test methods for determining the Izod pendulum impact resistance of plastics. West Conshohocken, PA, USA: American Society for Testing and Materials; 2010. doi:10.1520/D0256-24. [Google Scholar] [CrossRef]
39. ACP Composites, Inc. [cited 2025 Nov 1]. Available from: https://acpcomposites.com/. [Google Scholar]
40. Hastie JC, Guz IA, Kashtalyan M. Response of carbon/PEEK automotive driveshafts with/without an inner isotropic layer at high temperature considering temperature-dependent material properties. Proc Inst Mech Eng Part L J Mater Des Appl. 2023;237(6):1406–15. doi:10.1177/14644207221143342. [Google Scholar] [CrossRef]
41. Davies GAO, Olsson R. Impact on composite structures. Aeronaut J. 2004;108(1089):541–63. doi:10.1017/s0001924000000385. [Google Scholar] [CrossRef]
42. Cintra GG, Vieira JD, Cardoso DCT, Keller T. Mode I and Mode II fracture behavior in pultruded glass fiber-polymer—experimental and numerical investigation. Compos Part B Eng. 2023;266:110988. doi:10.1016/j.compositesb.2023.110988. [Google Scholar] [CrossRef]
Cite This Article
 Copyright © 2025 The Author(s). Published by Tech Science Press.
This work is licensed under a Creative Commons Attribution 4.0 International License , which permits unrestricted use, distribution, and reproduction in any medium, provided the original work is properly cited.
 Downloads
 Citation Tools