
 Submit a Paper
 Propose a Special lssue
 Open Access
ARTICLE
Engineering Amorphous Solid Dispersions of Abiraterone Acetate via HPMC HME: A Polymer-Centric Hot-Melt Extrusion Strategy for Formulation-Driven Bioavailability Improvement
1 Department of Pharmacy, Birla Institute of Technology and Science, Pilani Campus, Pilani, 333031, Rajasthan, India
2 Colorcon Asia Pvt. Ltd. Verna Industrial Estate, Verna, 403722, Goa, India
3 Biophore Group of Companies, Hyderabad, 500033, Telangana, India
4 R&D Healthcare Division Emami Ltd., Kolkata, 700056, West Bengal, India
* Corresponding Author: Gautam Singhvi. Email:
(This article belongs to the Special Issue: Polymer Materials in Controlled Drug Delivery)
Journal of Polymer Materials 2025, 42(4), 1199-1229. https://doi.org/10.32604/jpm.2025.072987
Received 08 September 2025; Accepted 11 December 2025; Issue published 26 December 2025
 View Full Text
 Download PDF
Abstract
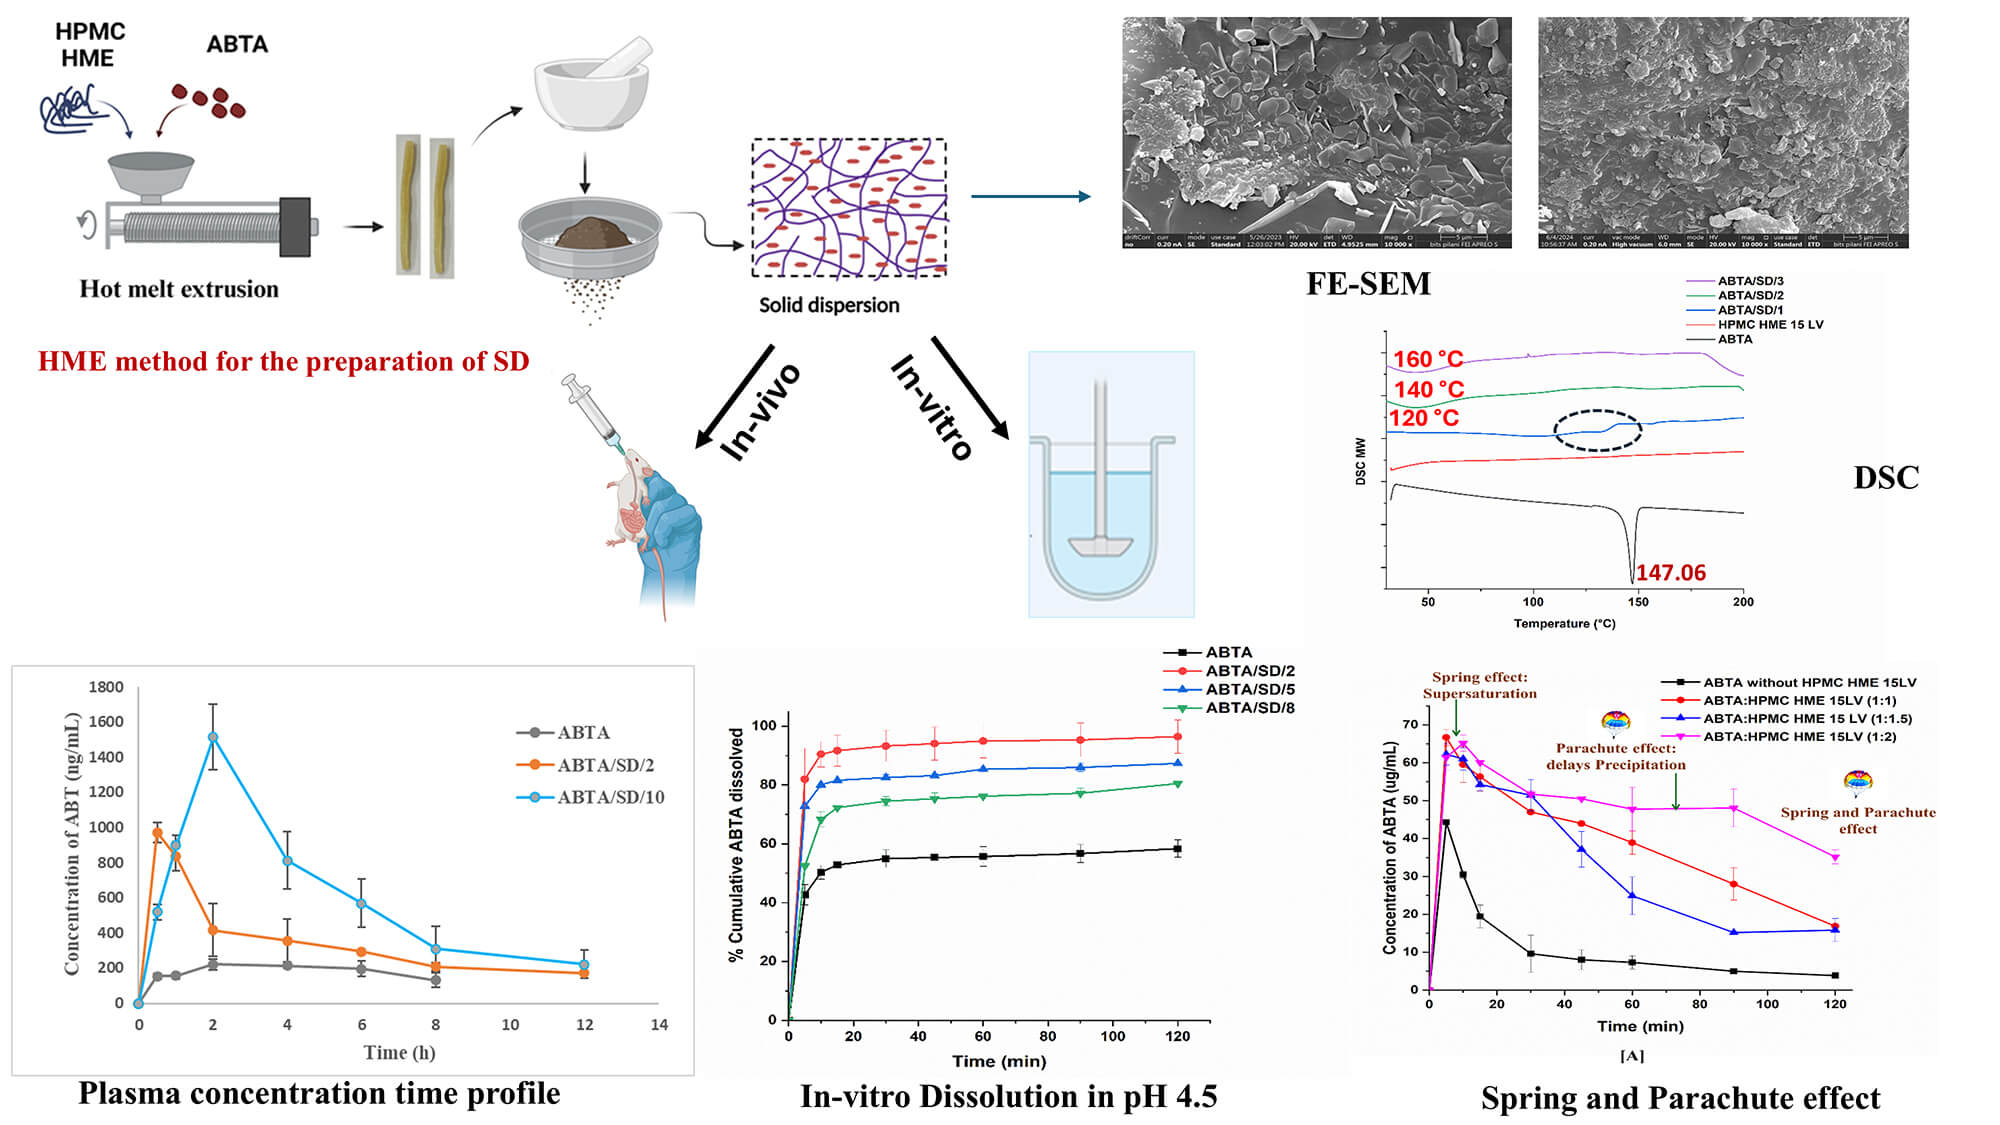
Abiraterone acetate (ABTA) was approved by the USFDA in 2011 for treating metastatic castration-resistant prostate cancer (mCRPC). ABTA exhibits poor aqueous solubility, inadequate dissolution, low oral bioavailability (<10%), and significant positive food effects. To overcome these limitations, in the present work, ABTA solid dispersions (SDs) were developed by using hot melt extrusion technology (HME) with various grades of hydroxypropyl methylcellulose HME (HPMC HME 15LV and 100LV) at different extrusion temperatures. HPMC HME demonstrated the ability to prevent drug precipitation for up to 120 min compared to the free drug (10 min), sustaining the supersaturation state of the drug in the solution phase and demonstrating the spring and parachute effect. The physical interactions of the ABTA SD’s were evaluated by Fourier transform infrared spectroscopy, powder X-ray diffraction, and differential scanning calorimetry confirming the conversion of ABTA into the amorphous state and the molecular interaction between HPMC and ABTA. The bio-relevant dissolution study of ABTA SD showed 2–5 times higher dissolution in fasted (FaSSIF) and fed (FeSSIF) conditions compared to free ABTA. Pharmacokinetic studies in Wistar rats revealed a 6.22 and 4.94-fold increase in Cmax and AUC0–t for the optimized ABTA SD formulation compared to free ABTA. Accelerated stability testing (40 ± 2°C/75 ± 5% RH, 90 days) confirmed retained amorphous state, unchanged drug content and dissolution performance for the optimized formulations. The dissolution and bioavailability studies reflected that the prepared SD of ABTA may improve the therapeutic efficacy of ABTA in prostate cancer. The manufacturing technology is scalable and easy to commercialize, revealing the hope of a better treatment strategy for prostate cancer.Graphic Abstract
Keywords
Supplementary Material
Supplementary Material FileProstate cancer is a leading cancer in men worldwide, causing about 0.3 million deaths annually. Androgen deprivation therapy controls it by suppressing testosterone, but the disease often advances to metastatic castration-resistant prostate cancer (mCRPC) despite continued testosterone inhibition. Abiraterone acetate (ABTA) was approved by the USFDA in 2011 for treating mCRPC. When ABTA is administered orally, it is converted into its active metabolite, abiraterone (ABT), through hydrolysis in the intestinal lumen [1]. ABT inhibits the enzymes C-17,20 lyase and 17 α-hydroxylase (CYP 17), reducing androgen synthesis in tissues related to the adrenal glands [2,3]. ABTA is an off-white, non-hygroscopic powder that has delivered significant clinical benefit in prostate cancer, but its oral delivery remains challenging due to its BCS Class IV profile [4]. With a high lipophilicity (log P 5.12) and a pKa of 5.19, ABTA exhibits pronounced pH-dependent solubility, greater in acidic media, such that its aqueous solubility is only ~0.5 μg/mL and is markedly reduced in biorelevant intestinal media (FaSSIF ≈ 0.005 μg/mL; FeSSIF ≈ 0.12 μg/mL). Consequently, ABTA tends to precipitate on transit from gastric to intestinal pH, which, together with its low permeability, leads to limited dissolution and uptake and an estimated oral bioavailability of <10% in the fasted state. Consequently, a substantial daily dose of 1000 mg (four 250 mg tablets taken once daily or 500 mg twice a day) is necessary to achieve therapeutic blood levels [5–7]. Moreover, ABTA shows significant inter-individual pharmacokinetic variability and strong food effects, with a 7- and 5-fold increase in Cmax and AUC0–∞ for low-fat meals and 17- and 10-fold for high-fat meals [8]. Therefore, the conventional tablet must be taken on a fasting stomach at least two hours before and one hour after a meal to avoid overexposure [5].
Yonsa®, a SoluMatrix ABTA formulation FDA-approved in May 2018 for mCRPC treatment, leverages SoluMatrix technology by iCeutica Inc., which enhances ABTA’s dissolution, bioavailability, and minimizes food effects due to reduced particle size with surfactants [9]. Several strategies have been reported in the literature to overcome the aforementioned limitations of ABTA. These strategies tried to contribute to improving the therapeutic efficacy of ABTA. However, these approaches have inherent limitations, such as the need for detailed solubility and dissolution data in different media or the designed ABT hydrochloride salt [10]. Moreover, nano-amorphous ABTA formulation requires reconstitution with water before oral intake, resulting in a ‘powder in a bottle’ dosage form. This self-reconstitution process can lead to dosing variability and inaccuracies in clinical practice [4]. The reported strategies are complex, require sophisticated technology, and have limited industry feasibility. Therefore, it is essential to prepare new formulations that enhance solubility through improved dissolution, thereby further contributing to the enhanced bioavailability of ABTA and leading to improved therapeutic efficacy. Hence, changing to suitable commercial feasible formulation approach to improve delivery may overcome the challenges associated with ABTA therapeutic efficacy for the treatment of prostate cancer.
Among all the available methods, amorphous solid dispersion (SD) with polymeric carriers, where the API is dispersed in the polymeric matrix in an amorphous state, is a particularly effective approach for significantly increasing the solubility and bioavailability of ABTA. In recent years, solvent evaporation, spray drying, and KinetiSol have been utilized to prepare ABTA SD [11]. Consequently, the hot-melt extrusion (HME) method was used to manufacture the SD of ABTA for the first time, exploring the use of polymeric carriers. HME is a suitable technique for large-scale industrial production. It has recently gained considerable attention in the pharmaceutical industry due to its versatility, continuous operation, cost-effectiveness, and solvent-free process technology [12,13].
The prevalence of low-soluble APIs in development pipelines and commercial products drives formulators to select HME to prepare SDs. HME involves vigorous mixing of the molten API with polymeric carriers under the optimized temperature, yielding a uniformly dispersed product with anticipated characteristics [14]. Critical considerations in HME include the glass transition temperature (Tg) of polymeric carriers and the melting temperature of the API. The interaction between the API and polymeric carriers is vital not only to prevent API recrystallization, but also to prevent phase separation during processing or after cooling. HME enables the transformation of an API into an amorphous form or the dispersal of it into highly fine particles. Successful development of SD’s through HME requires careful selection of polymeric carriers and thorough assessment of the SD’s physicochemical properties, stability, and performance [15].
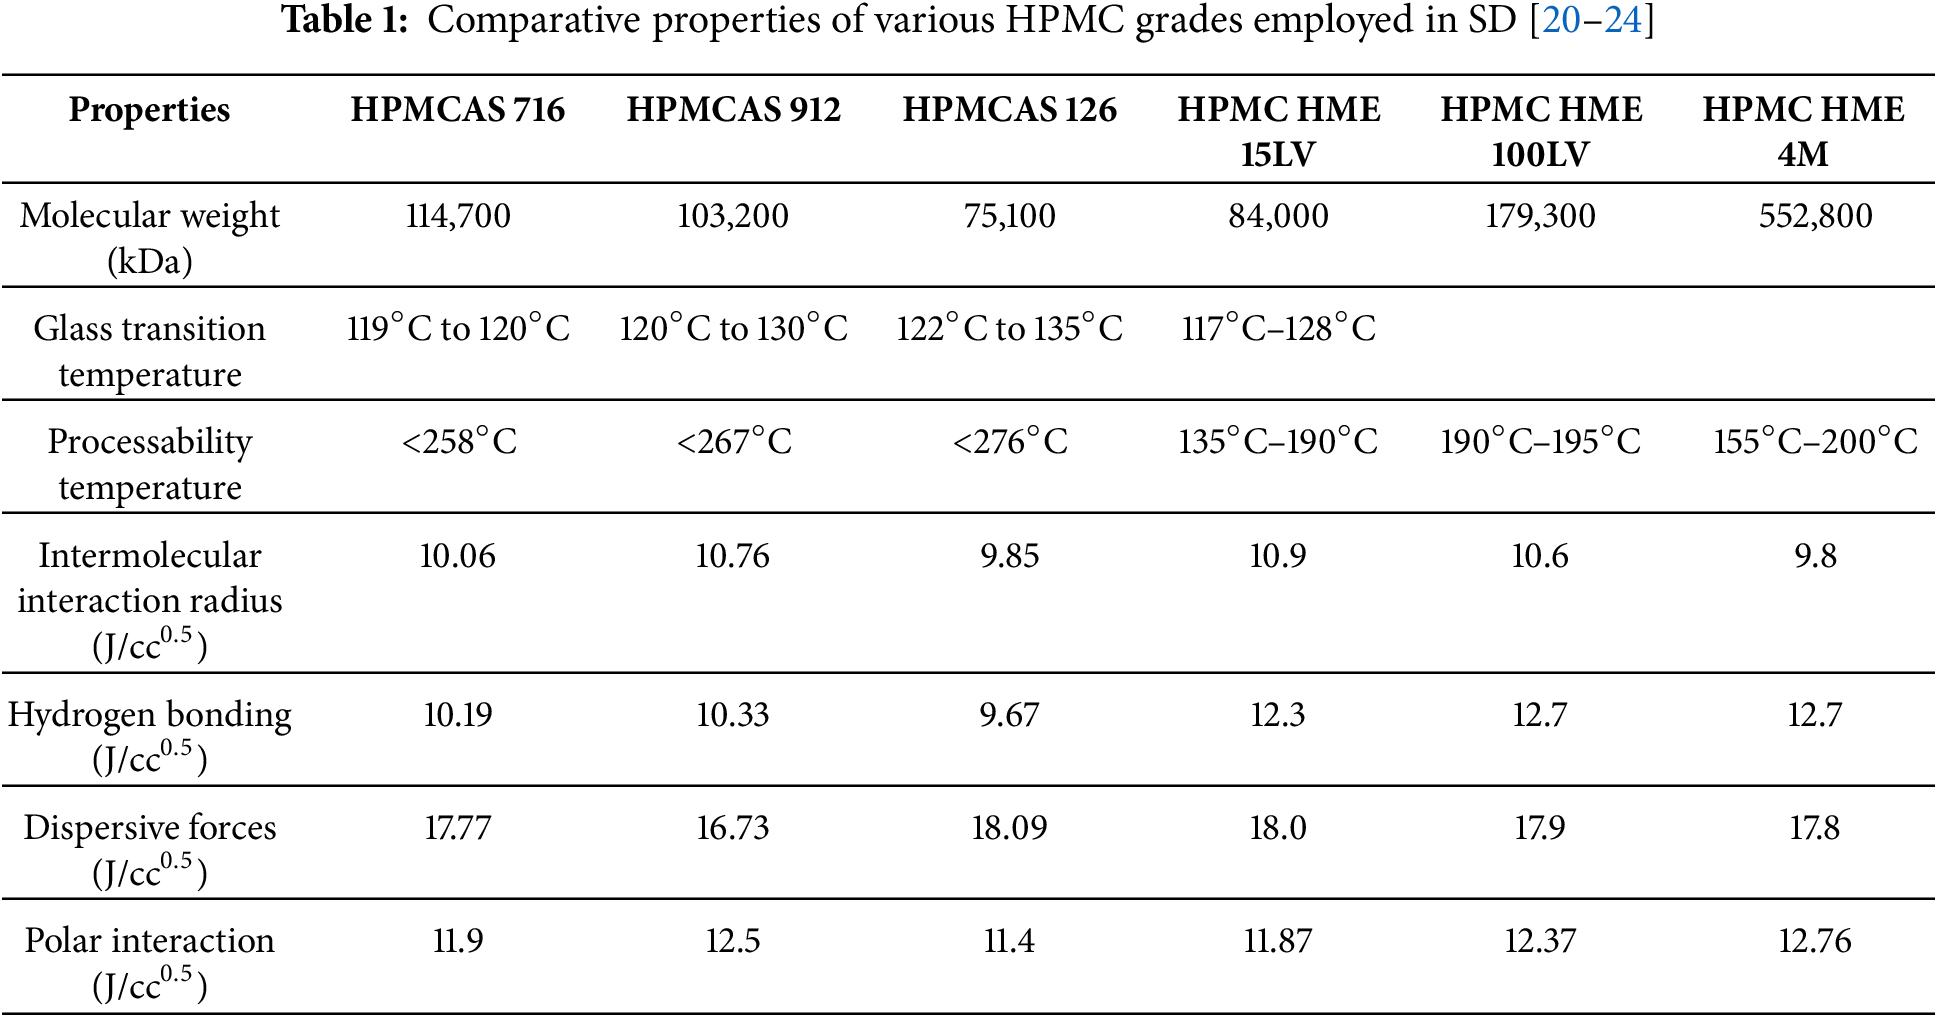
Cellulosic polymers, HPMC widely utilized in SD development through solvent evaporation and spray drying techniques, offer benefits such as stabilization of amorphous APIs, enhancing drug release, inhibiting crystalline nucleation, and enhancing bioavailability [16]. It has been marked that conventional HPMC was not suitable for HME due to high Tg (160°C–210°C) and high melt viscosity, which produce substantial torque within the extruder during processing and significant color changes at elevated temperatures, which requires a unique formulation to overcome the processing difficulties [17]. Current methods to enhance the processability of HPMC often necessitate high amounts of plasticizers and other processing aids. However, certain amorphous systems, including SD, can lead to drug crystallization during storage, reducing dissolution and absorption, thereby decreasing bioavailability. To improve this condition, a new grade of HPMC, i.e., AFFINISOL™ HPMC HME, has a relatively low glass transition temperature combined with reduced melt viscosity and excellent thermal resilience (stable well above 250°C), which expands its HME processing window and permits extrusion without the need of plasticizers. These attributes simplify formulation and support solid-state stability of amorphous SDs for poorly soluble drugs. To minimize color change and molecular-weight degradation, extrusion is recommended below 200°C; suggested temperature limits are summarized in Table 1 [17–19].
This work represents the first systematic application of HME to prepare solid dispersions SDs of the poorly water-soluble compound ABTA, offering a solvent-free continuous route that enhances scalability. It utilizes cellulosic excipients AFFINISOL™ HPMC HME 15LV and 100LV engineered with lower glass transition temperatures to enable milder processing while providing precipitation inhibition. Mechanistic investigations, including in-silico Hansen solubility and Flory-Huggins modelling, phase-solubility and precipitation-inhibition assays, dynamic light scattering nanoparticle tracking, and viscosity-pH profiling, rationalize polymer selection and explain sustained supersaturation during gastrointestinal transitions, thereby supporting improved aqueous solubility and dissolution rate. Formulations processed at varied extrusion temperatures were characterized by DSC, PXRD, ATR-FTIR, TGA, and FE-SEM to confirm amorphization and drug–polymer interactions. Moreover, in-vivo pharmacokinetic studies in Wistar rats compared the ABTA SD with free ABTA, indicating the formulation’s potential for a surfactant-free, industrially translatable oral delivery strategy.
ABTA (99% purity) was sourced from Biophore India Pharmaceuticals Pvt. Ltd. Hyderabad, India. AFFINISOL™ HPMC HME (15LV and 100LV) from Colorcon Asia Pvt. Ltd. Goa, India, and sodium taurocholate and soya lecithin from SRL Pvt. Ltd. Mumbai, India. While analytical-grade HPLC solvents (dichloromethane, methanol, acetone, and acetonitrile) were sourced from Merck Life Science Pvt. Ltd. Mumbai, India.
2.1 Drug-Polymer Miscibility Predictions: Hansen Solubility Parameter and Flory-Huggins’ Drug-Polymer Interaction Approach
The Hansen solubility parameter δ for ABTA was determined from its molecular structure using the van Krevelen–Hoftyzer group contribution approach (Fig. 1) [25]. The Hansen solubility parameters for ABTA were decomposed into three component contributions: dispersion forces (δd), polar or dipolar interactions (δp), and hydrogen-bonding energy (δh) [26–29]. The Hansen solubility parameters for HPMC HME (15LV and 100LV) (Fig. 1) were obtained from Dupont Pharma’s solution brochure for HPMC HME.
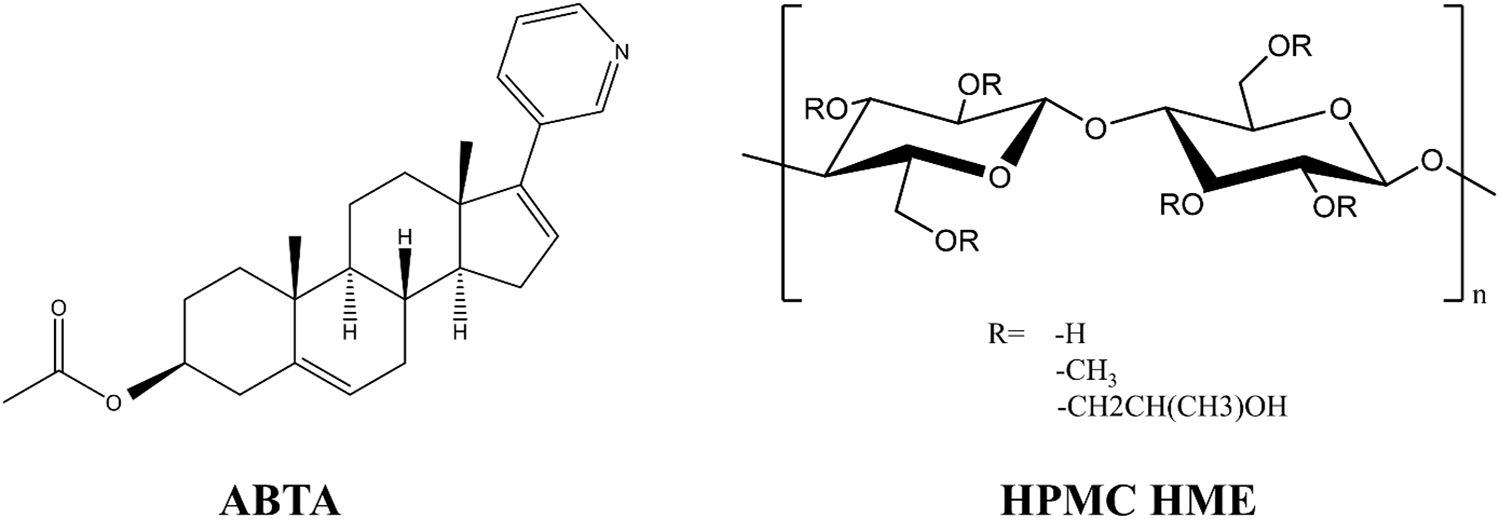
Figure 1: Chemical structure of ABTA and HPMC HME
The total solubility parameter (δt) is primarily expressed in MPa0.5, calculated by grouping all three Hansen parameters shown in Eq. (1).
The Flory-Huggins drug-polymer interaction parameter, χ, which quantifies compatibility between the drug and polymer, was computed from the difference between their solubility parameters following Eq. (2).
In the equation, Vsite denotes the hypothetical lattice volume, T is the absolute temperature, R is the universal gas constant, and δpolymer and δdrug correspond to the Hansen solubility parameters of the polymer and the drug, respectively [30,31].
2.2 Precipitation Inhibition Studies
A precipitation inhibition assay was conducted to assess the ability of HPMC-based HME formulations to suppress precipitation and sustain supersaturation of ABTA. Supersaturation was created by introducing 2 mL of an ABTA stock solution (6 mg·mL−1 in methanol) into 100 mL of FaSSIF medium (pH 6.5), which served as the precipitation medium. All experiments were conducted at 37 ± 0.5°C for 120 min at 200 rpm. To evaluate the capacity of HPMC-based HME to inhibit ABTA precipitation, HPMC HME (grades 15LV and 100LV) was dissolved into the FaSSIF precipitation medium prior to supersaturation induction. A polymer-free FaSSIF sample served as the control. Binary mixtures of ABTA and HPMC HME were prepared at weight ratios of 1:1, 1:1.5, and 1:2 (ABTA: HPMC HME). After generating supersaturation, ABTA concentrations were measured at predefined time points both in the presence and absence of polymer and quantified using reversed-phase HPLC. Dynamic light scattering (DLS) with a Malvern Zeta Sizer (Malvern ZS nano 3600, Malvern, UK) was used to determine the particle size of the precipitate. Samples were collected at 5, 10, 30, 45, 60, and 120 min [24,25,32].
2.3 Preparation of ABTA-SD via HME Method
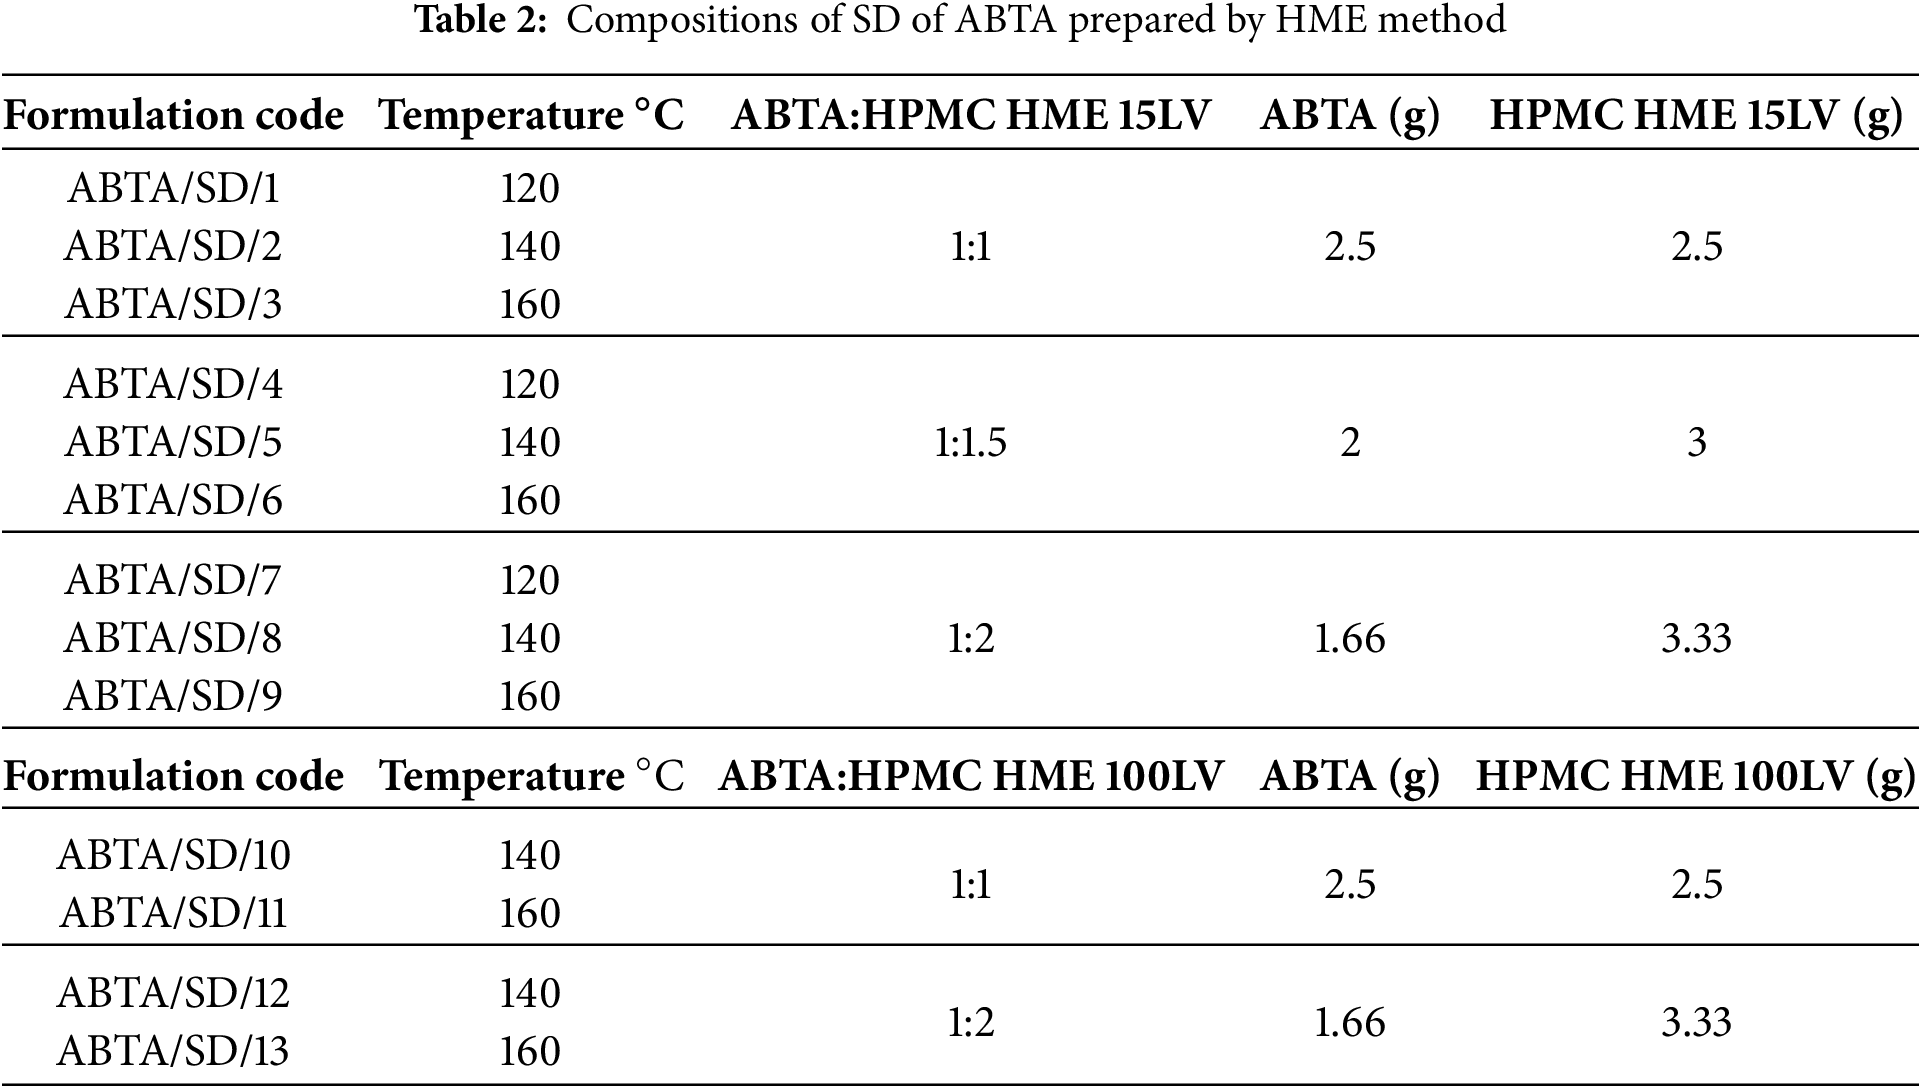
The HME formulations, comprising ABTA and HPMC HME, were processed using a HAAKE MiniCTW (Thermo Scientific) equipped with twin co-rotating screws, operating at a feed rate of 5 g/min. Various ratios of ABTA and HPMC HME binary blends were prepared. The drug-polymer physical mixture was processed by hot-melt extrusion at barrel temperatures of 120°C, 140°C, and 160°C using a screw speed of 50 rpm; the extrudate was passed through a 1 mm diameter die. The resulting extrudates were then cooled at room temperature. Table 2 displays the compositions of ABTA SD prepared by the HME method. Finally, these extrudates were ground into a powdered material, passed through a #40 ASTM sieve, and then stored for subsequent physicochemical characterization.
2.4 Characterization of the Developed SD
Various characterization techniques were employed to analyze the free ABTA and ABTA formulations. Previously, we have characterized pure ABTA, which was compared with ABTA formulations in this work [25]. The TGA was employed to asses thermal stability and moisture content by heating samples (8–10 mg) upto 250°C at a rate of 10°C/min in a nitrogen atmosphere [33,34]. The DSC was used to assess crystallinity, miscibility of drug-polymer, melting temperature, and Tg by heating samples (3–5 mg) at 10°C/min from 30°C to 200°C under a nitrogen atmosphere [35,36]. PXRD evaluated crystallinity using a Rigaku MiniFlex II diffractometer with Cu Kα radiation over a 2θ range of 10°–60° at 2°/min [37]. ATR-FTIR analyzed potential API-polymer interactions, recording spectra from 400–4000 cm−1 with a 1 cm−1 resolution [33]. Surface morphology was examined with a field emission scanning electron microscope (FE-SEM). Samples were affixed to aluminum stubs, sputter-coated with a thin layer of gold using a Leica EM UC7 sputter coater, and imaged under the microscope for high-resolution morphological characterization [25].
2.5 Solubility Determination of ABTA SD
Excess amounts of free ABTA and each solid dispersion formulation produced via HME were added separately to vials containing distilled water, pH 1.2 buffer, pH 6.8 buffer, FaSSIF, and FeSSIF to assess apparent solubility. The vials were kept on an orbital shaker at 37 ± 0.5°C for 6 h. Samples were then extracted, filtered, and analyzed by RP-HPLC in triplicate [36,38].
2.6 Effect on Viscosity with Change in pH and HPMC HME Polymer Concentration
The effect on viscosity with changing pH and varying HPMC HME polymer concentrations (15LV and 100LV) was evaluated at 1.33% (w/v) and 2.66% (w/v) in different pH environments, specifically pH 1.2, pH 4.5, pH 6.8, water, FaSSIF (pH 6.5), and FeSSIF (pH 5.0). The HPMC HME dispersion in different pH levels was evaluated using a Rheometer MCR 91 (Anton Paar). The study utilized a parallel plate configuration, with sample analysis conducted using a sample gap of 0.2 mm under a constant shear rate of 50 s−1. The sample temperature was controlled at 25 ± 2°C.
2.7.1 In-Vitro and Biorelevant Dissolution Studies
In-vitro dissolution studies of ABTA were conducted to evaluate the dissolution performance of the free drug [25] and its SD in various media, including pH 1.2, pH 4.5, FaSSIF (pH 6.5), and FeSSIF (pH 5.0), to understand its behavior under both fasting and fed conditions. For a pH of 4.5, 0.25% sodium lauryl sulfate (SLS) was included in the dissolution medium, as specified in the ABTA monograph. Dissolution experiments were carried out using a USP II (paddle) apparatus. For pH 1.2 and pH 4.5 media, 300 mL of dissolution medium was used; FaSSIF and FeSSIF tests were conducted with 250 mL. The media were thermostatted at 37°C and agitated at 150 rpm. For each run, an amount of sample equivalent to 10 mg ABTA (either as the free drug or as the solid dispersion) was introduced into the vessel. Aliquots were withdrawn at 5, 10, 15, 30, 45, 60, and 120 min, with each withdrawal immediately replaced by an equal volume of fresh medium. Drug concentrations in the collected samples were quantified by reversed-phase HPLC. Samples were first passed through a 0.45 μm syringe filter, and then 50 μL aliquots were injected onto a Hypersil Gold C18 column (50 × 4.6 mm, 5 μm). Chromatographic separation was achieved isocratically using a mobile phase of acetonitrile and 10 mM potassium phosphate buffer (34:66, v/v), with the buffer pH adjusted to 3.0 with orthophosphoric acid. The flow rate was maintained at 1.0 mL/min, the column oven was held at 30°C, and analyte detection was carried out at 254 nm. This approach provided a comprehensive dissolution profile under both gastric and intestinal conditions, accounting for the food effect exhibited by ABTA [25].
2.7.2 Mathematical Analysis of In-Vitro and Bio-Relevant Dissolution Data
Dissolution behavior of the free drug and the optimized ABTA solid dispersion was assessed using the following metrics: dissolution efficiency (DE), mean dissolution time (MDT), and the release timepoints required to reach 50% and 80% drug release (T50 and T80). DD Solver software analyzed the data using various mathematical models, with the best fit determined by correlation coefficient (R2), Akaike information criterion (AIC), and model selection criteria (MSC).
Optimized ABTA SD formulations were stored in amber glass containers under accelerated stability conditions (40 ± 2°C, RH of 75 ± 5%) for 90 days. Samples were examined at baseline and after the 90-day interval for changes in physical appearance, assay of drug content, in-vitro dissolution behavior, and thermal and solid-state characteristics using DSC and PXRD [39–41].
2.9 In-Vivo Pharmacokinetic Study
All animal experiments were conducted using Wistar rats (6–8 weeks old, 200–250 g) in accordance with the protocol IAEC/RES/32/01 approved by the Institutional Animal Ethics Committee (IAEC), Birla Institute of Technology and Science, Pilani Campus, Rajasthan, India. The rats were procured from Central Animal Facility (CAF), Birla Institute of Technology and Science, Pilani, Pilani Campus, Rajasthan, India and then subjected to 12 h of light and darkness at 25°C and 60% RH for one week prior to study. The animals were provided with free access to water and fasted for 12 h before the commencement of the experiments. The Wistar rats were administered with the suspension of free ABTA, optimized ABTA SD formulation at a single dose of 200 mg/kg via gavage. Following administration, blood samples were obtained from the retro-orbital venous plexus at specific time points (0.5, 1, 2, 4, 6, 8, and 12 h). Plasma samples were isolated through centrifugation at 8000 rpm for 5 min and analyzed using the established RP-HPLC technique. Pharmacokinetic parameters and oral bioavailability of the administered formulations were assessed. Parameters, including drug plasma concentration and area under the curve, were determined using Phoenix WinNolin CerteraTM (Pharsight, USA; version: 8.0) software [25].
3.1 Drug-Solubility Parameter Approach
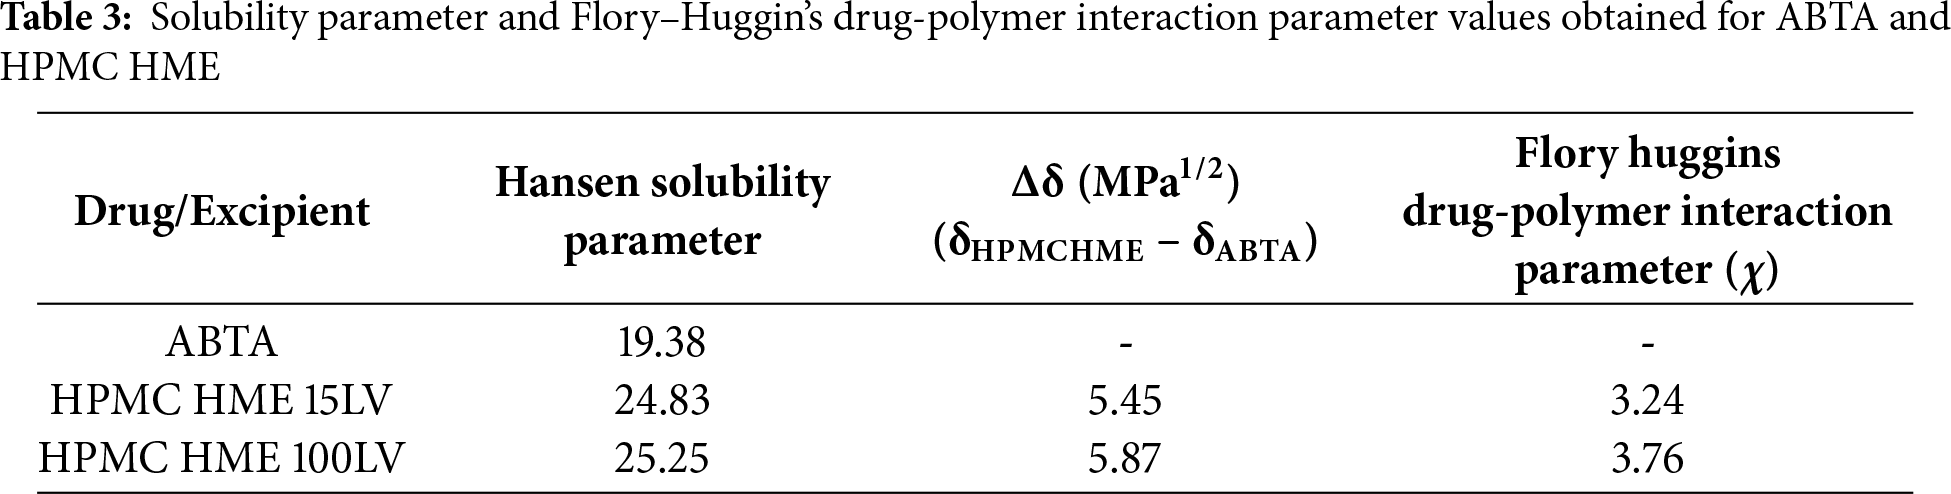
Hansen solubility parameters, using the van Krevelen and Hoftyzer group contribution method, were employed to assess the miscibility of ABTA with HPMC HME (15LV and 100LV). This widely used method considers a system miscible if the solubility parameter (Δδ) difference is less than 7 MPa1/2 or immiscible if more than 10 MPa1/2 [26]. Solubility parameters for ABTA and the polymers were calculated, as shown in Tables S1 and S2. Good miscibility between ABTA and HPMC HME (15LV and 100LV) is indicated by the Δδ values below 7 MPa1/2, as shown in Table 3. The F–H interaction parameter (χ), derived from the solubility parameters, was near zero, indicating a negligible enthalpic penalty for mixing, a negative Gibbs free energy of mixing, and therefore favorable drug–polymer interactions.
3.2 Precipitation Inhibition Effect
The effectiveness of the HPMC HME was evaluated by maintaining the supersaturated state of ABTA. As shown in Fig. 2A,B, the concentration of free ABTA first decreased and continued to decline over time [25]. The presence of pre-dissolved HPMC HME significantly inhibited recrystallization, maintaining a high ABTA concentration in the media throughout the 120-min period. In the absence of polymer, the supersaturation of ABTA led to rapid and complete precipitation within the first 10 min, ascribed to the “spring” effect. When introduced into the medium before supersaturation, pre-dissolved HPMC HME sustained the metastable, elevated drug concentration by functioning as a “parachute,” thereby inhibiting both nucleation and subsequent crystal growth. The presence of pre-dissolved HPMC HME with ABTA demonstrated a “spring and parachute effect” [42].
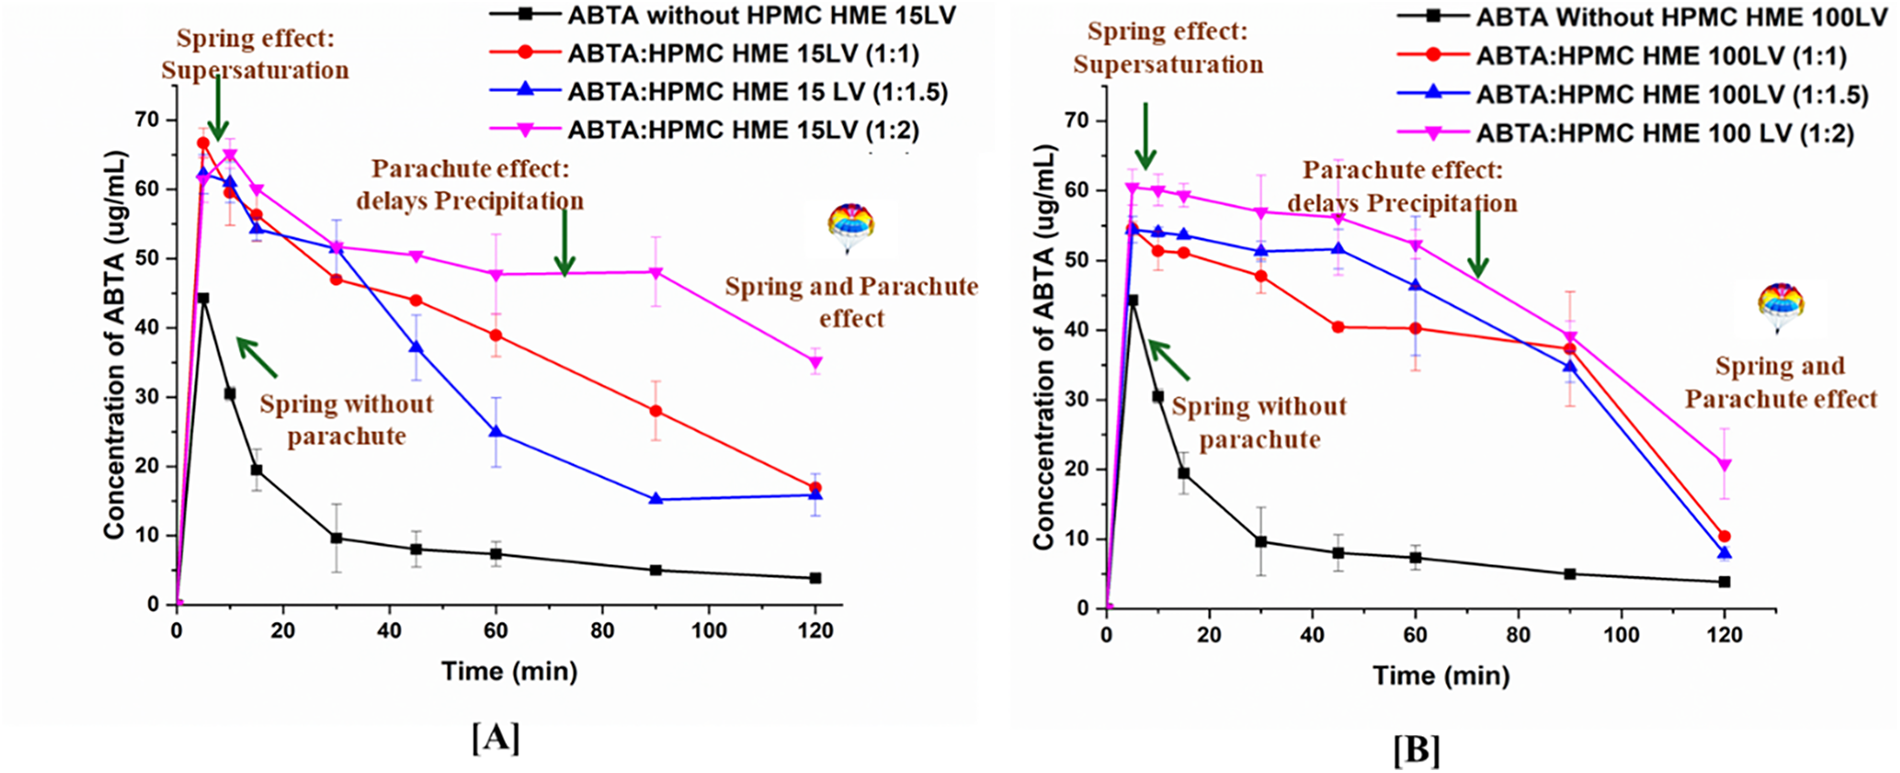
Figure 2: Precipitation inhibition assay of supersaturated ABTA in FaSSIF in the presence of the pre-dissolved (A) HPMC HME 15LV and (B) HPMC HME 100LV (mean ± SD, n = 3)
The ABTA to HPMC HME ratios of 1:2 for both 15LV and 100LV demonstrated a significantly higher recrystallization inhibition effect compared to the 1:1 and 1:1.5 ratios, respectively. As shown in Fig. 2A,B, increasing the concentration of HPMC HME enhances the recrystallization inhibition effect. This occurs because the higher viscosity of HPMC HME reduces the mobility of drug molecules in the media. The ABTA: HPMC HME 15LV (1:1) showed better precipitation inhibition than 1:1.5, although no significant differences were observed. The ABTA concentration at 120 min endpoints appears lower for the 100LV grade than corresponding data for 15 LV grade due to the higher concentrations of 100 LV that can form a more viscous medium, which might trap the drug and reduce its diffusion. This could lead to reduced drug concentration at the endpoint because the drug release is hindered by the highly viscous matrix.
The particle size monitoring of ABTA pre-dissolved HPMC HME (15LV and 100LV) confirmed the above conclusion. Precipitate size during induced precipitation was measured using DLS. As shown in Fig. 3A,B, without pre-dissolved polymer, ABTA recrystallized within 10 min, increasing particle size to ~3000 nm. With pre-dissolved HPMC HME (15LV and 100LV), particle size remained stable at 150–400 nm over 120 min.
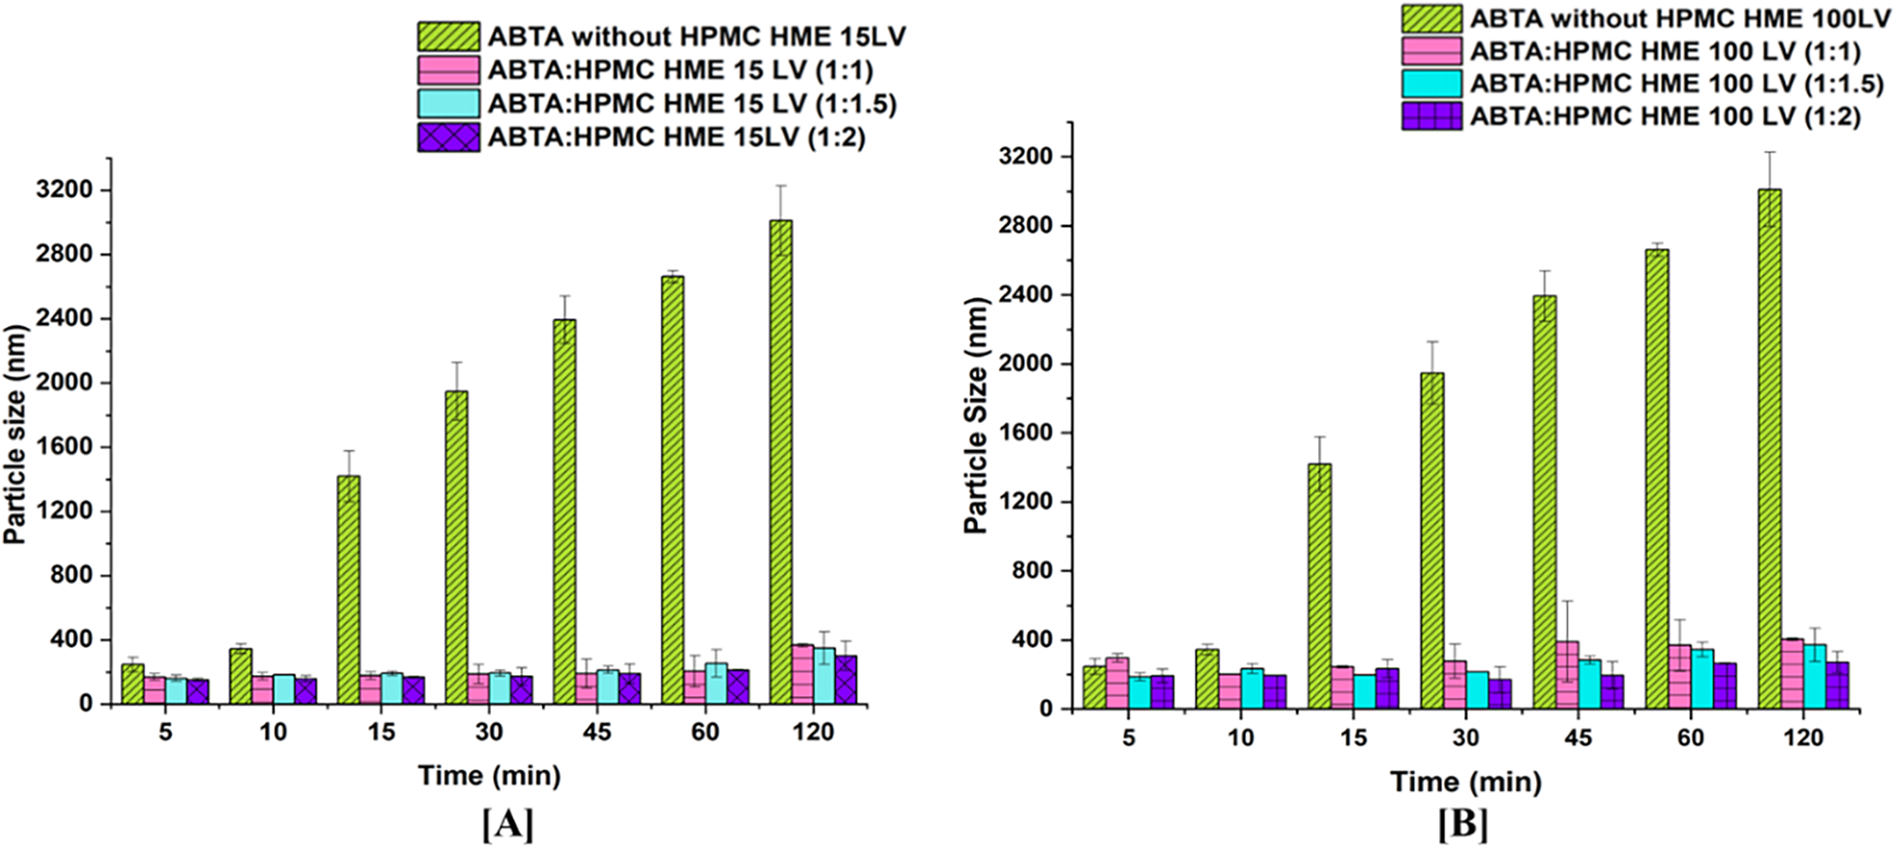
Figure 3: Particle size graph of supersaturated ABTA in FaSSIF in the presence of pre-dissolved (A) HPMC HME 15LV and, (B) HPMC HME 100LV at different concentrations (mean ± SD, n = 3)
3.3 Preparation of ABTA-SD via the Hot-Melt Extrusion Method
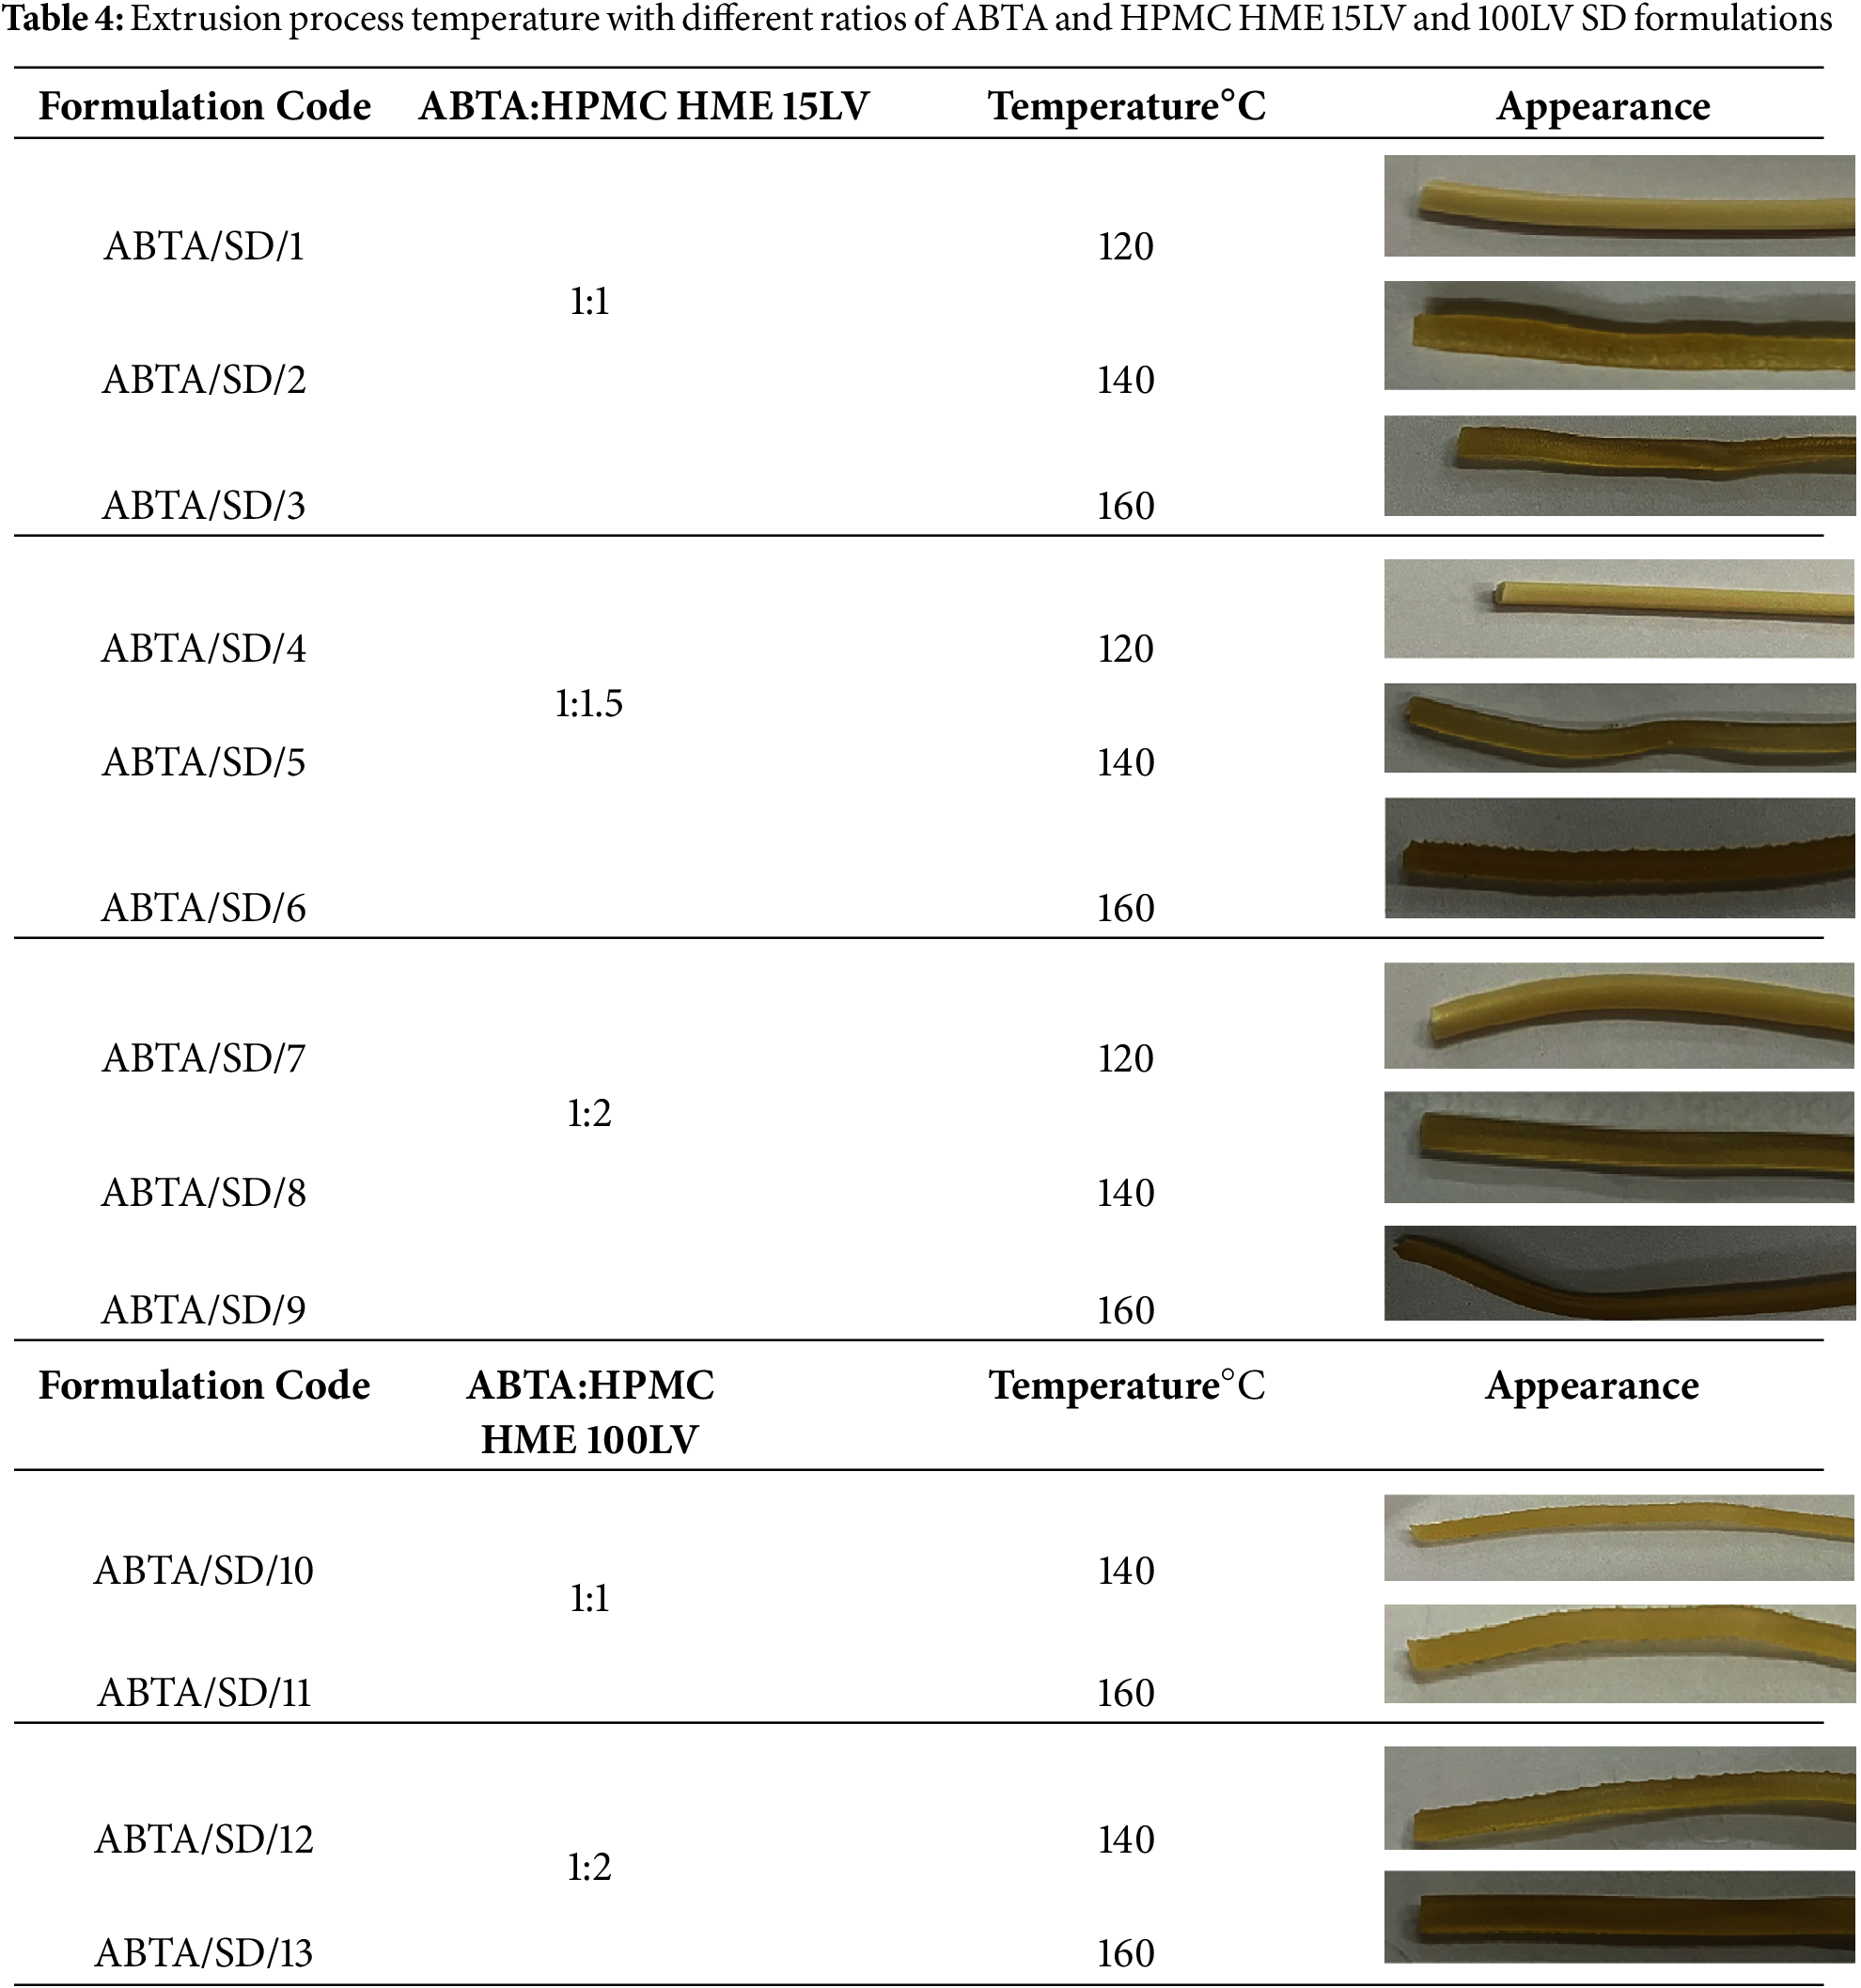
ABTA SD with HPMC HME 15LV at weight ratios (1:1, 1:1.5, and 1:2) were prepared by HME. In HME, the extrusion temperature should always be equal to or 15°C greater than the melting point of the drug, which is 147.46°C for ABTA. Based on the literature and the melting point of the ABTA, three different extrusion temperatures, 120°C, 140°C, and 160°C, were selected to prepare ABTA SD with HPMC HME 15 LV, respectively. Additionally, for ABTA SD with HPMC HME 100LV, the extrusion temperatures were set at 140°C and 160°C, respectively. Table 4 represents the extrusion process temperature with different ratios of ABTA and HPMC HME 15LV and 100LV SD formulations.
3.4 Characterization of the Developed Formulation
3.4.1 Thermogravimetric Analysis (TGA)
TGA profiles of ABTA, HPMC HME 15 LV, HPMC HME 100LV, and ABTA-SD are illustrated in Fig. 4. The melting point of ABTA is 147.16°C. As shown in Fig. 4, ABTA does not exhibit any significant weight loss below 300°C, indicating that it does not undergo substantial decomposition at temperatures below this threshold [25]. The studies revealed that ABTA, HPMC HME 15LV, HPMC HME 100 LV, and ABTA-SD are thermally stable up to 300°C, indicating that ABTA does not degrade and is compatible with the excipients. Consequently, the extrusion process temperatures of 120°C, 140°C, and 160°C were used to prepare SD, which should not cause any degradation of ABTA.
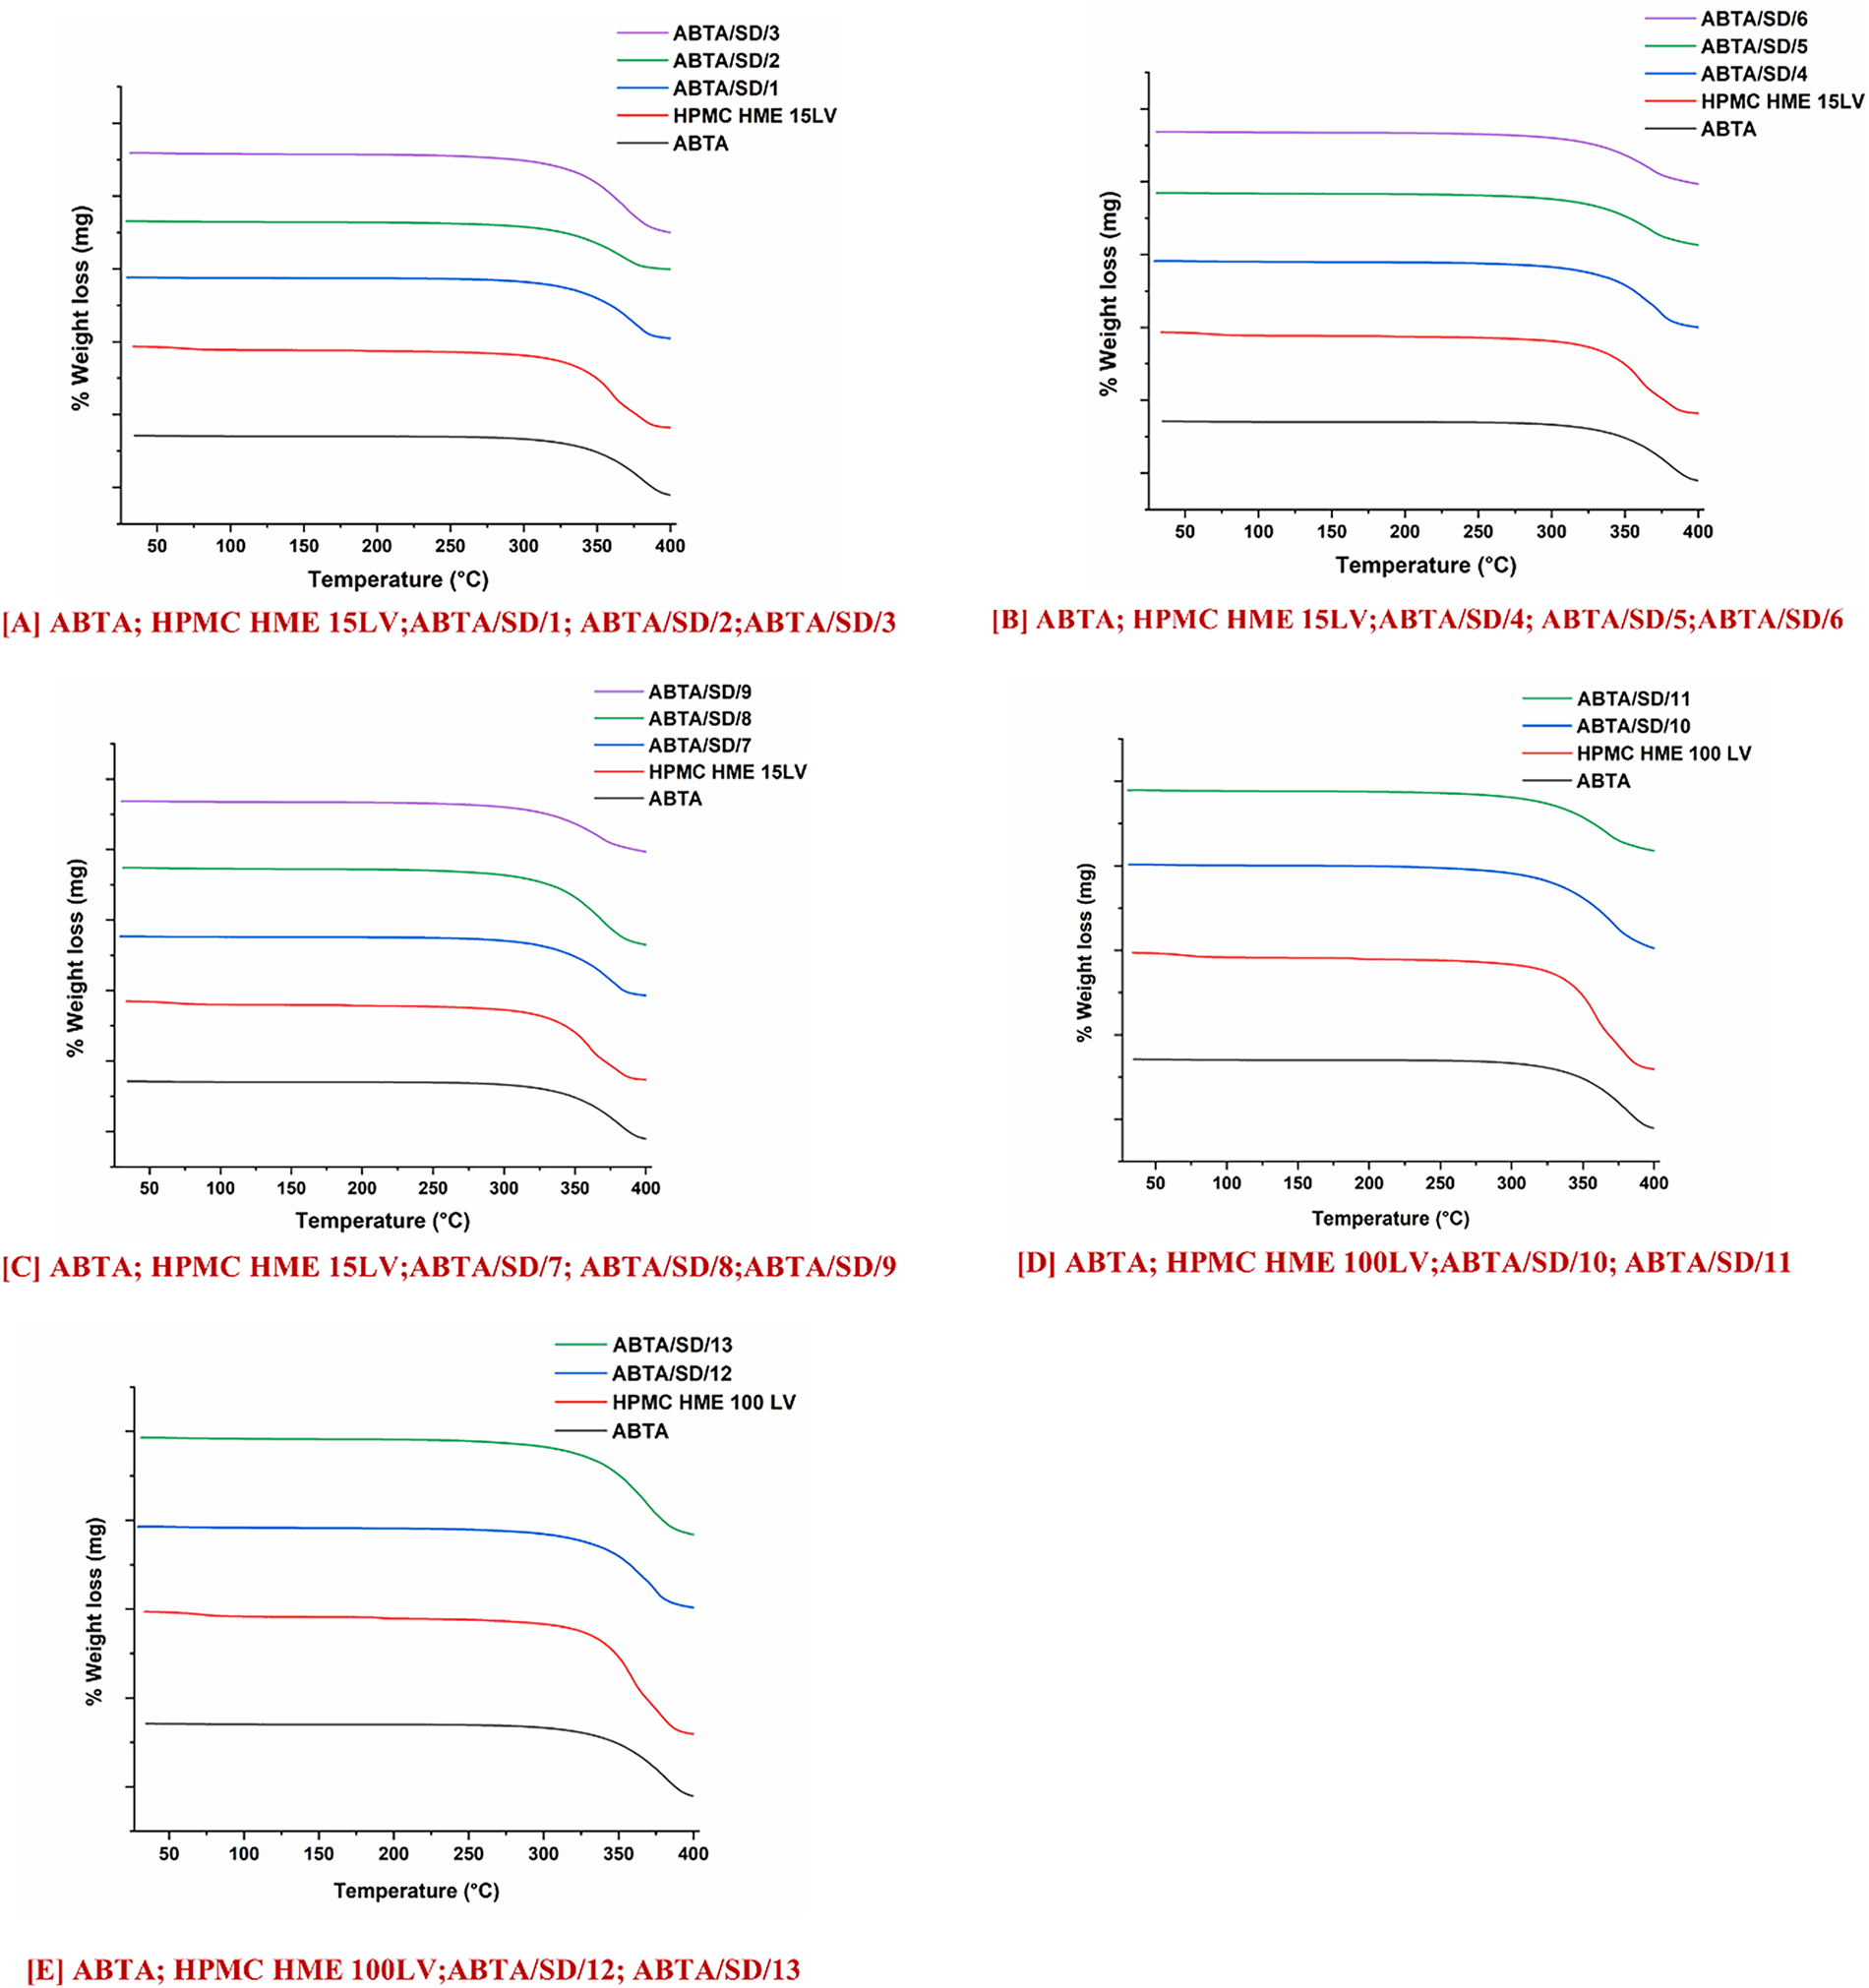
Figure 4: TGA of ABTA SD formulations with HPMC HME (15LV and 100LV)
3.4.2 Differential Scanning Calorimetry
The thermogram of the free ABTA, HPMC HME (15LV and 100LV), and ABTA SD formulations are represented in Fig. 5. The thermogram of free ABTA, shown in Fig. 5A–E, displayed an endothermic peak at 147.16°C, indicating its crystalline nature [25]. ABTA SD formulation extruded at a temperature of 120°C demonstrated the endothermic peak of the ABTA shown in Fig. 5A–C. This indicates that ABTA did not convert from a crystalline to an amorphous form, likely due to inadequate mixing of the drug and polymer during the HME process. ABTA SD at 140°C and 160°C extrusion temperatures did not generate the endothermic peak of the ABTA illustrated in Fig. 5A–E, confirming that the ABTA was entirely transformed from the crystalline state to the amorphous state in the HME. This is due to the intimate mixing between the drug and polymer, promoting their strong interaction. Reducing a drug’s crystallinity typically improves its dissolution and solubility, as less energy is needed to break down the crystal lattice [43].
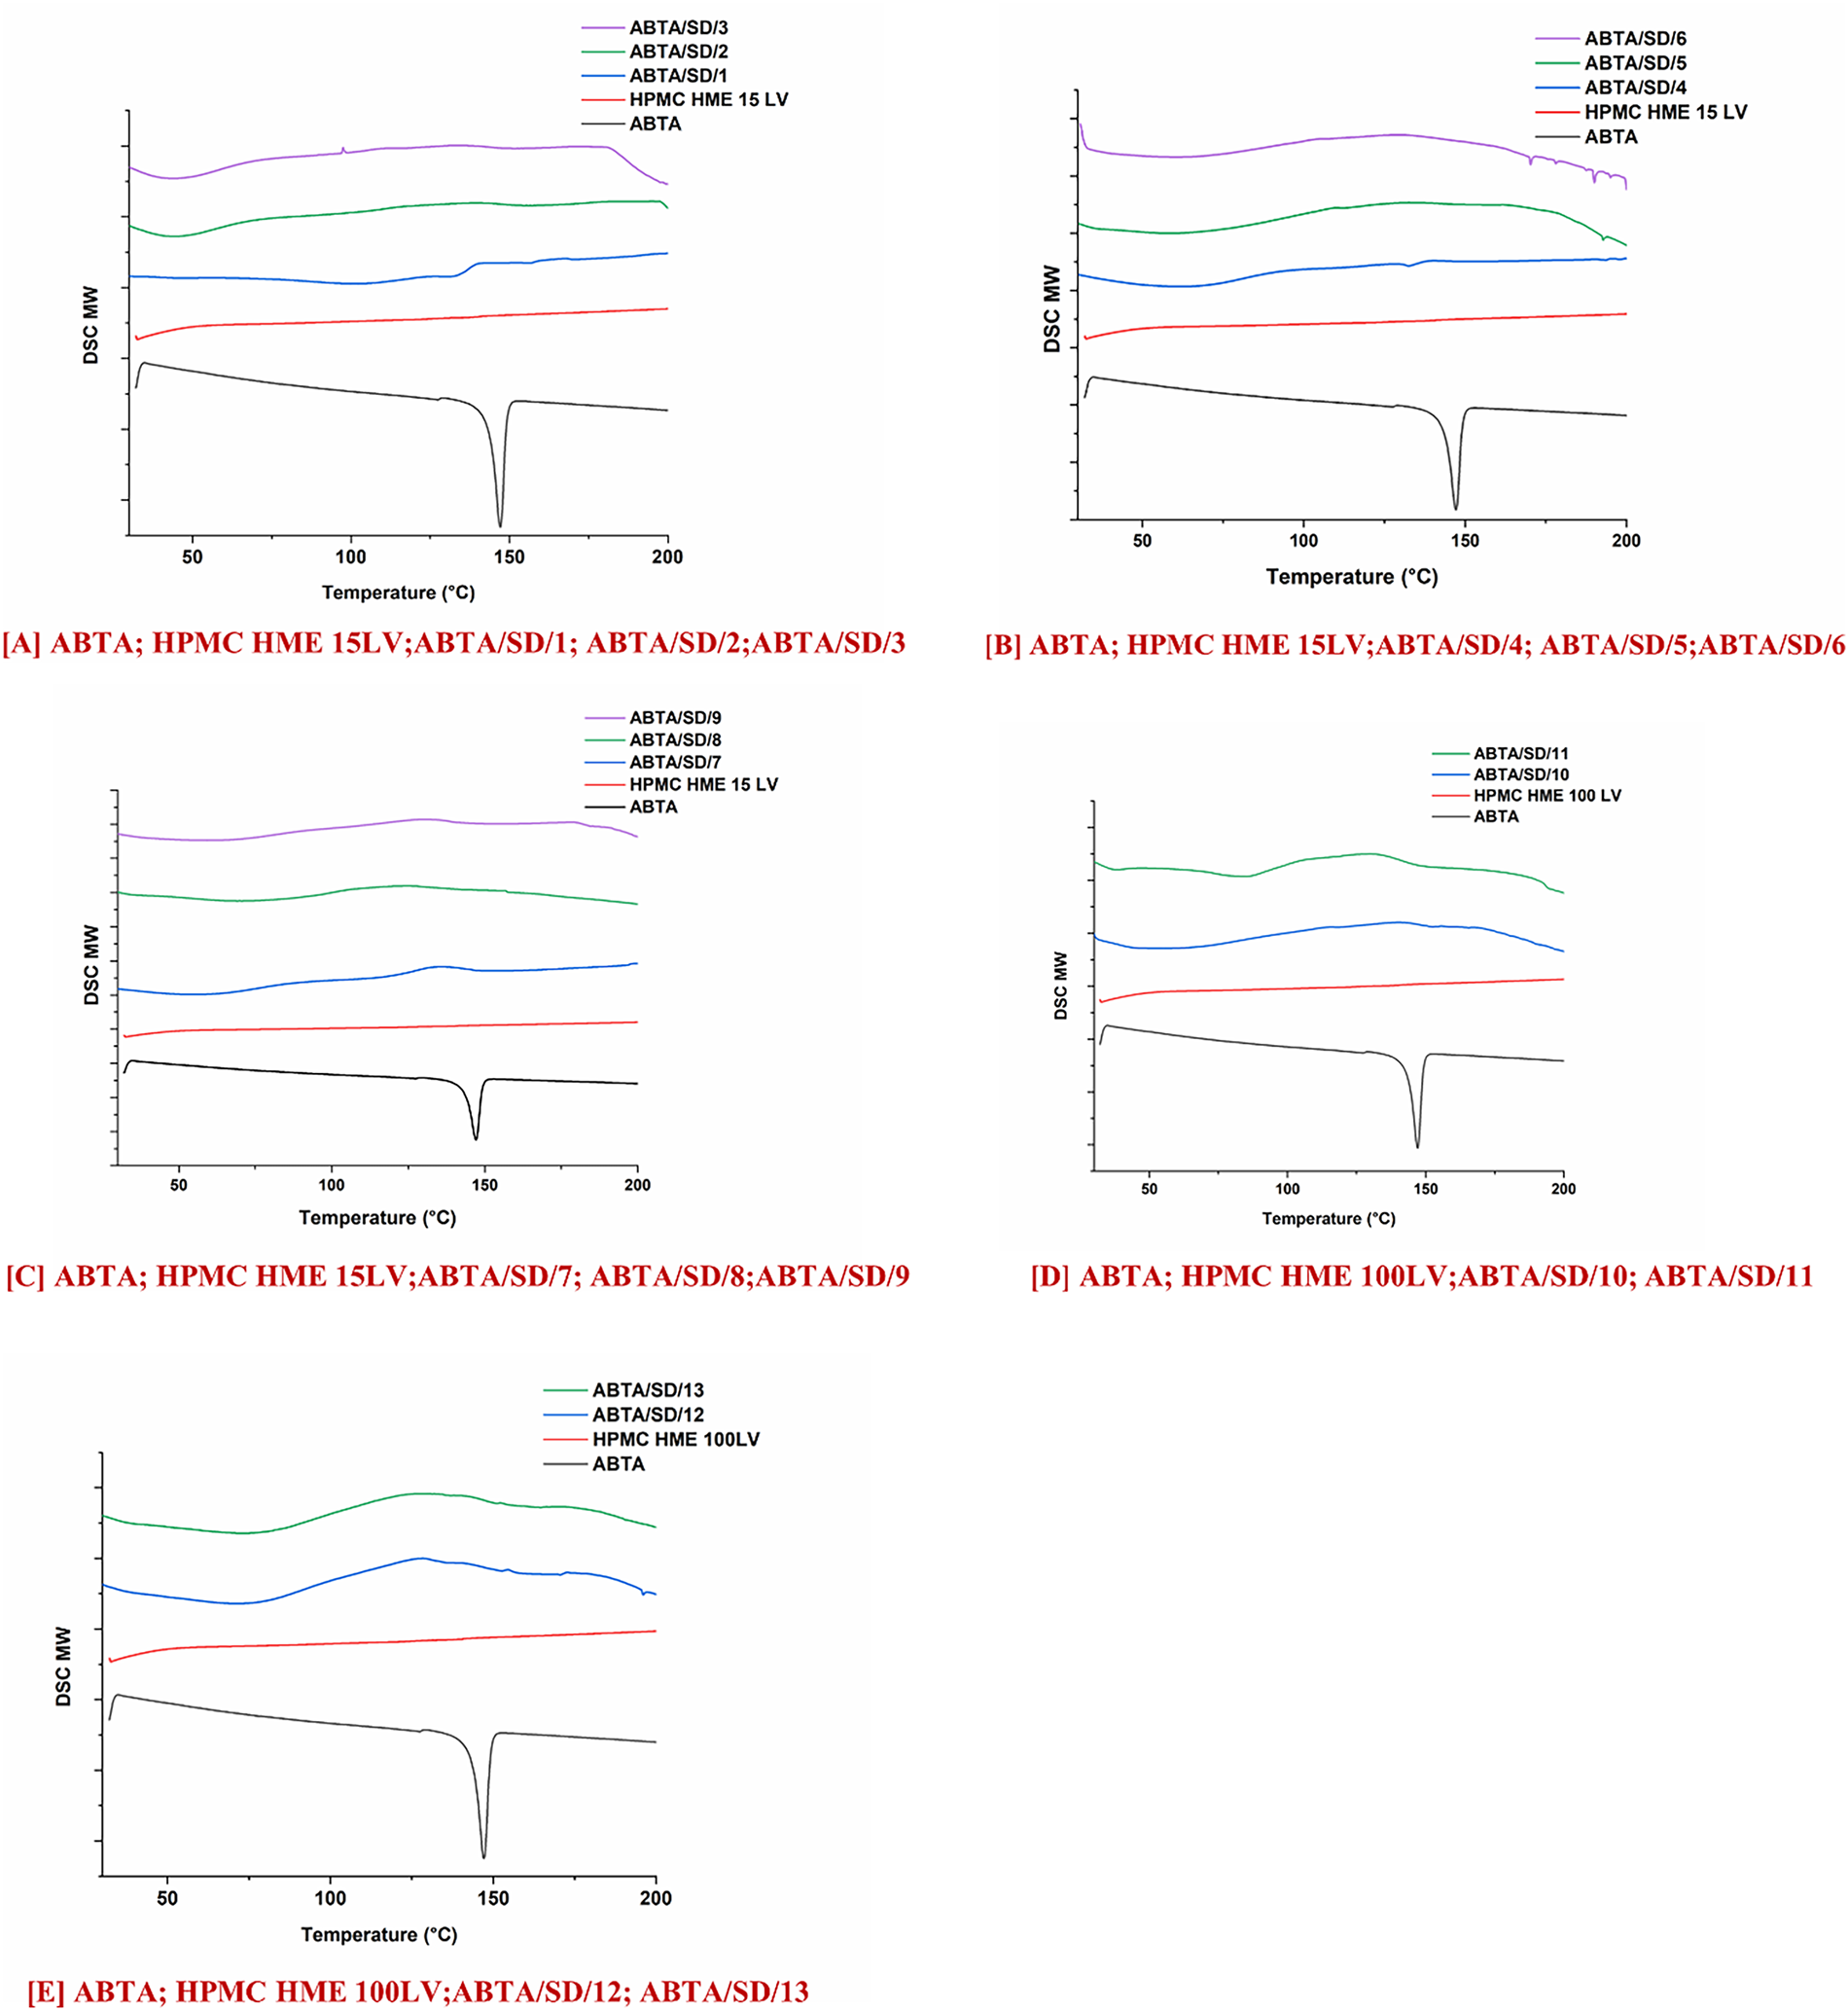
Figure 5: DSC thermograms of ABTA SD formulations with HPMC HME (15LV and 100LV)
3.4.3 Powder X-Ray Diffraction
The PXRD patterns of free ABTA, HPMC HME 15LV, HPMC HME 100LV, and ABTA SD formulation are shown in Fig. 6A–E. ABTA powder showed distinct peaks at 12.1°, 14.9°, 15.2°, 16.05°, 18.4°, 19.07°, and 21.8°, indicating its crystallinity [25]. Furthermore, HPMC HME 15LV and HPMC HME 100 LV exhibited amorphous PXRD patterns. In the ABTA SD formulation, i.e., ABTA/SD/1, ABTA/SD/4, and ABTA/SD/7, prepared with the HME method at the extrusion temperature of 120°C, the characteristics of the diffraction peak of the free ABTA exhibited the crystallinity shown in Fig. 6A–C due to the inadequate mixing of the ABTA and HPMC HME 15LV and 100LV. However, at the extrusion temperature of 140°C and 160°C in ABTA SD formulations, the characteristic diffraction peak of ABTA in all the formulations disappeared, and the broad amorphous halo patterns, as shown in Fig. 6A–E, which relates to the DSC results were observed. The DSC and PXRD analyses confirmed that ABTA in the ABTA SD formulations were not merely physically mixed but also exhibited amorphous dispersion. These changes suggest a strong interaction between the drug and the polymer.
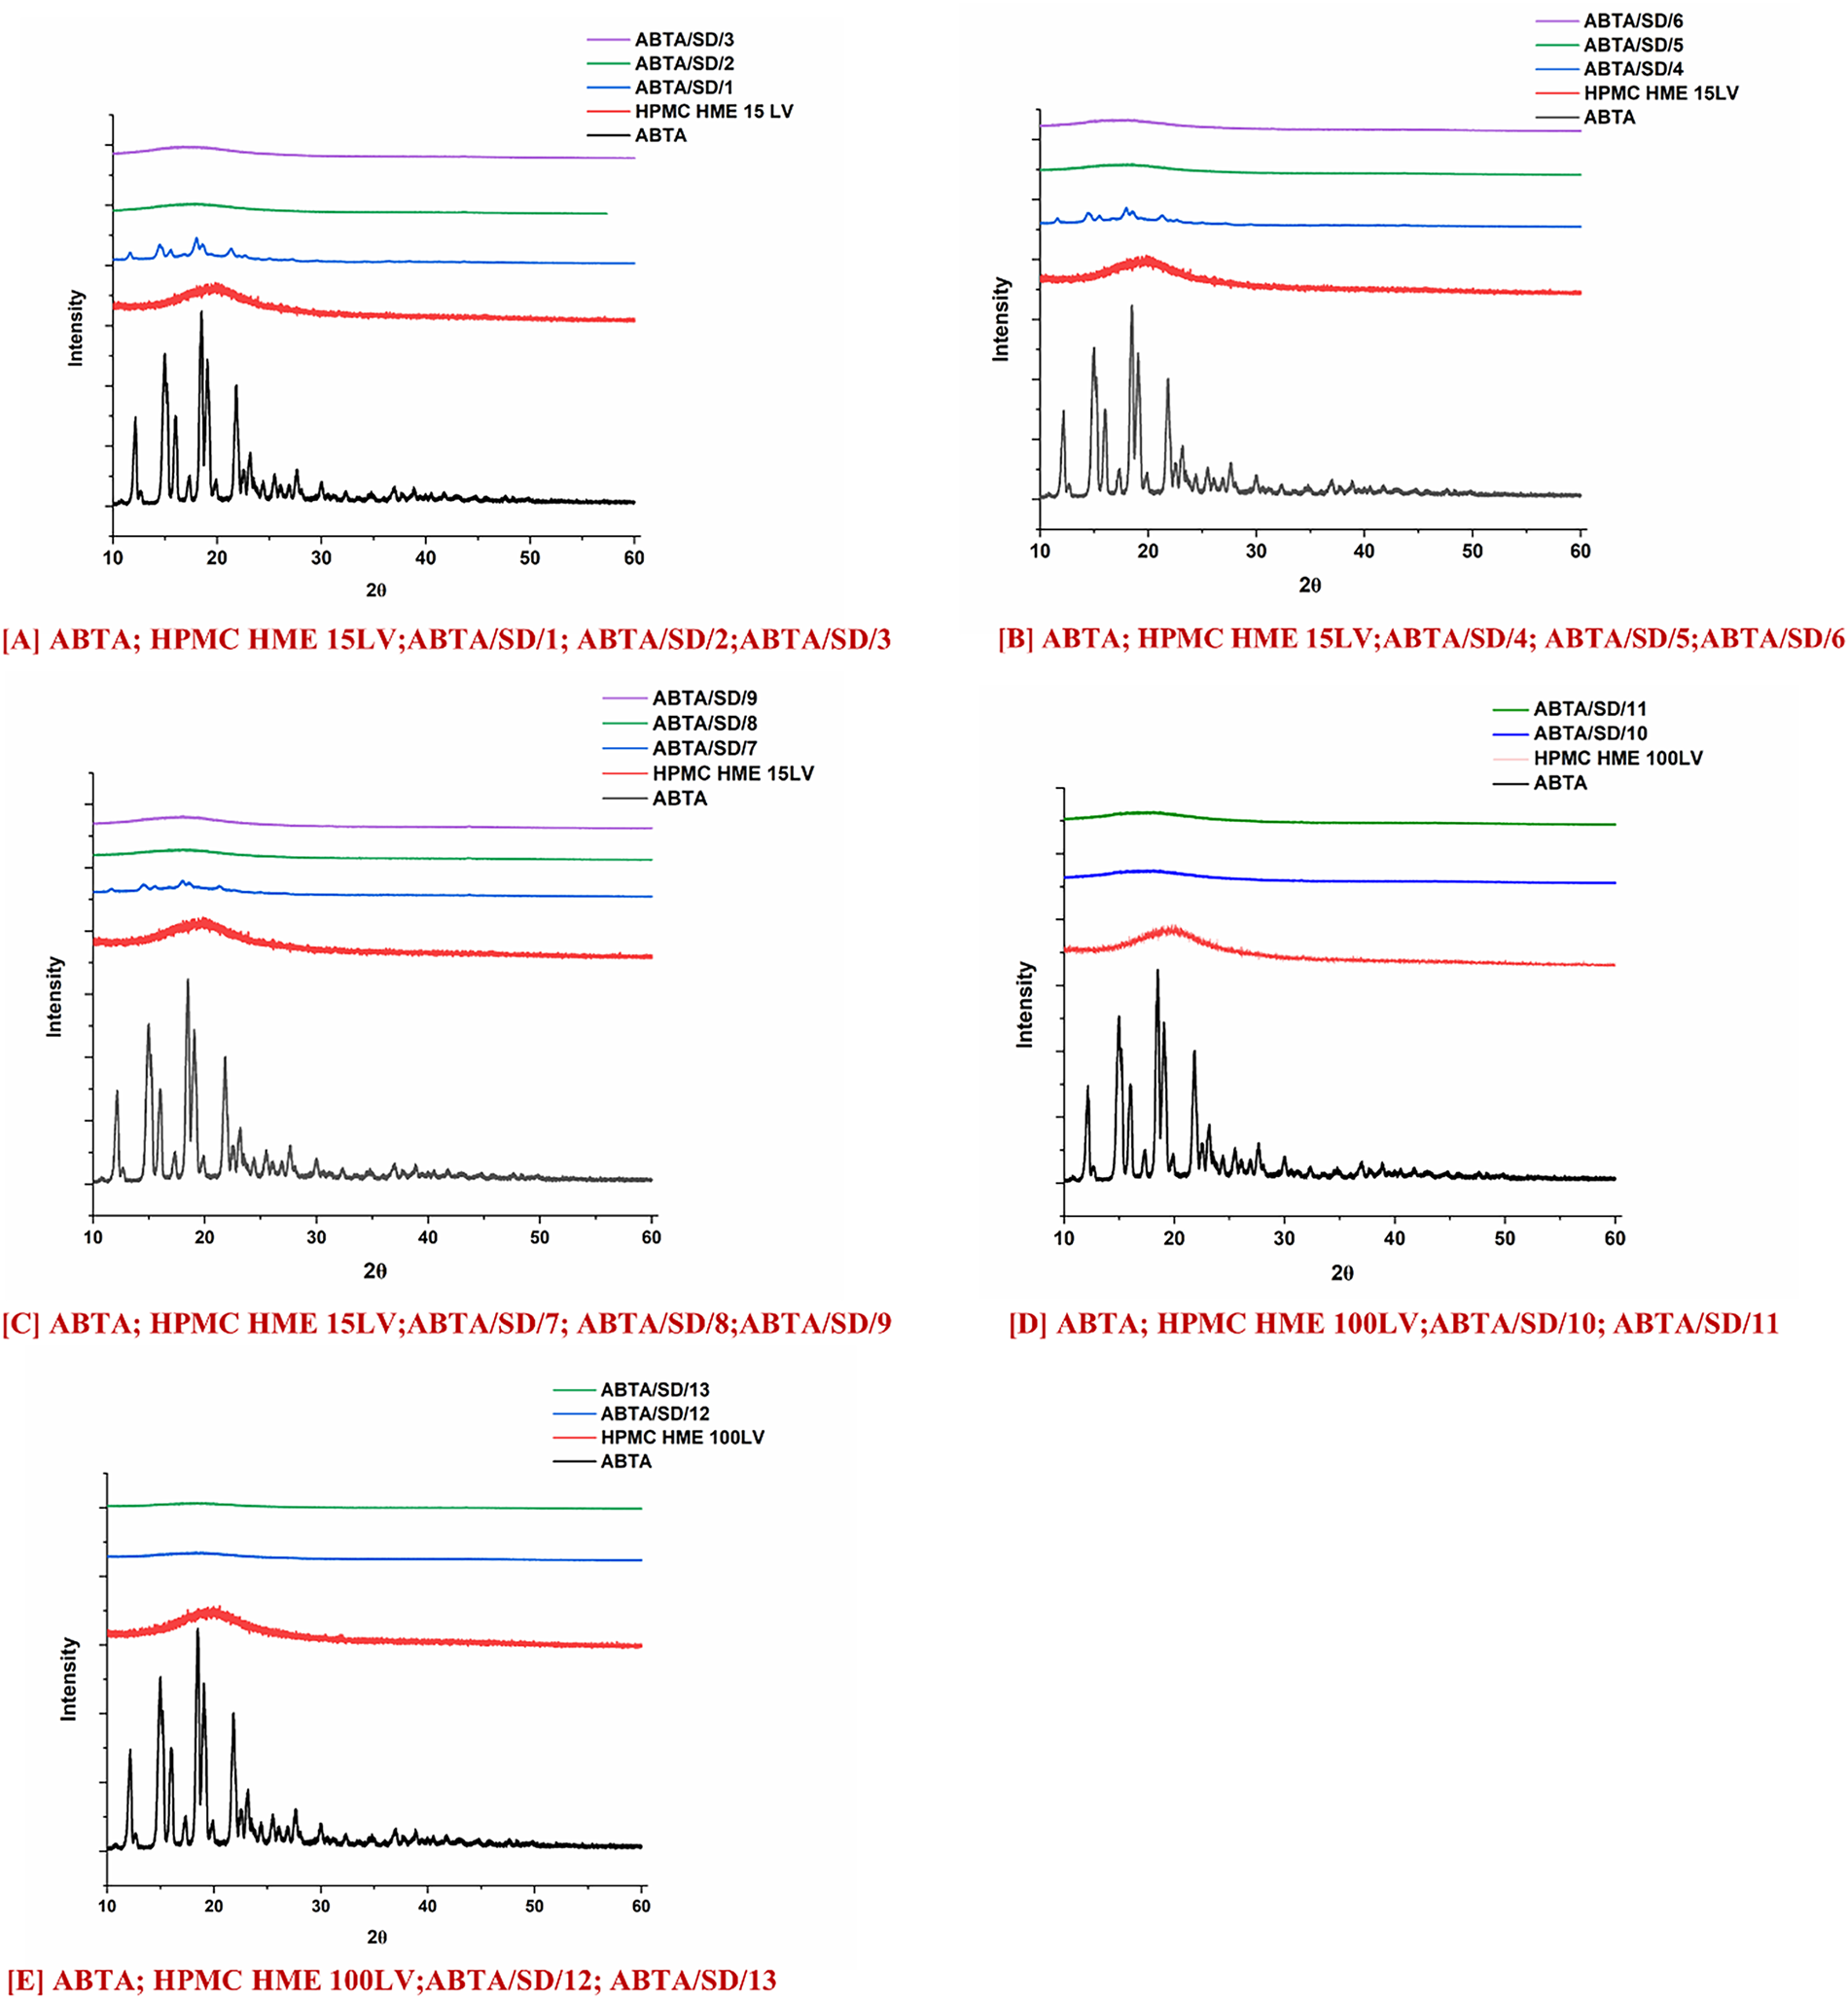
Figure 6: PXRD pattern of ABTA SD formulations with HPMC HME (15LV and 100LV)
3.4.4 Attenuated Total Reflectance Fourier Transform Infrared Spectroscopy (ATR-FTIR)
The ATR-FTIR spectra of free ABTA, HPMC HME (15LV and 100LV), and ABTA SD, shown in Fig. 7A–E. The spectrum of ABTA shows characteristic absorption bands at 1240 cm−1 (C–O stretching), 1533 cm−1 (C=N stretching), 1731 cm−1 (C=O stretching), and 2935.68 cm−1 (C–H stretching) [25]. The ATR-FTIR spectra of HPMC HME 15LV and 100LV displayed characteristic peaks at 1049 and 1373 cm−1 of C–O stretching and C–O–H bending, respectively, shown in Fig. 7A–E. However, the ABTA SD formulation prepared with the HME at different extrusion temperatures showed that the intensity decreases and the disappearance of ABTA suggest the molecular interactions with the polymers, most likely through hydrogen bonding and van der Waals forces, indicating intimate drug-polymer mixing and reduced long-range crystalline order. Specifically, shifts in the stretching vibrations of functional groups capable of hydrogen bonding, such as the nitrogen in amine or carbonyl groups. Additionally, subtle changes in CH and non-polar stretching frequencies may reflect van der Waals interactions.
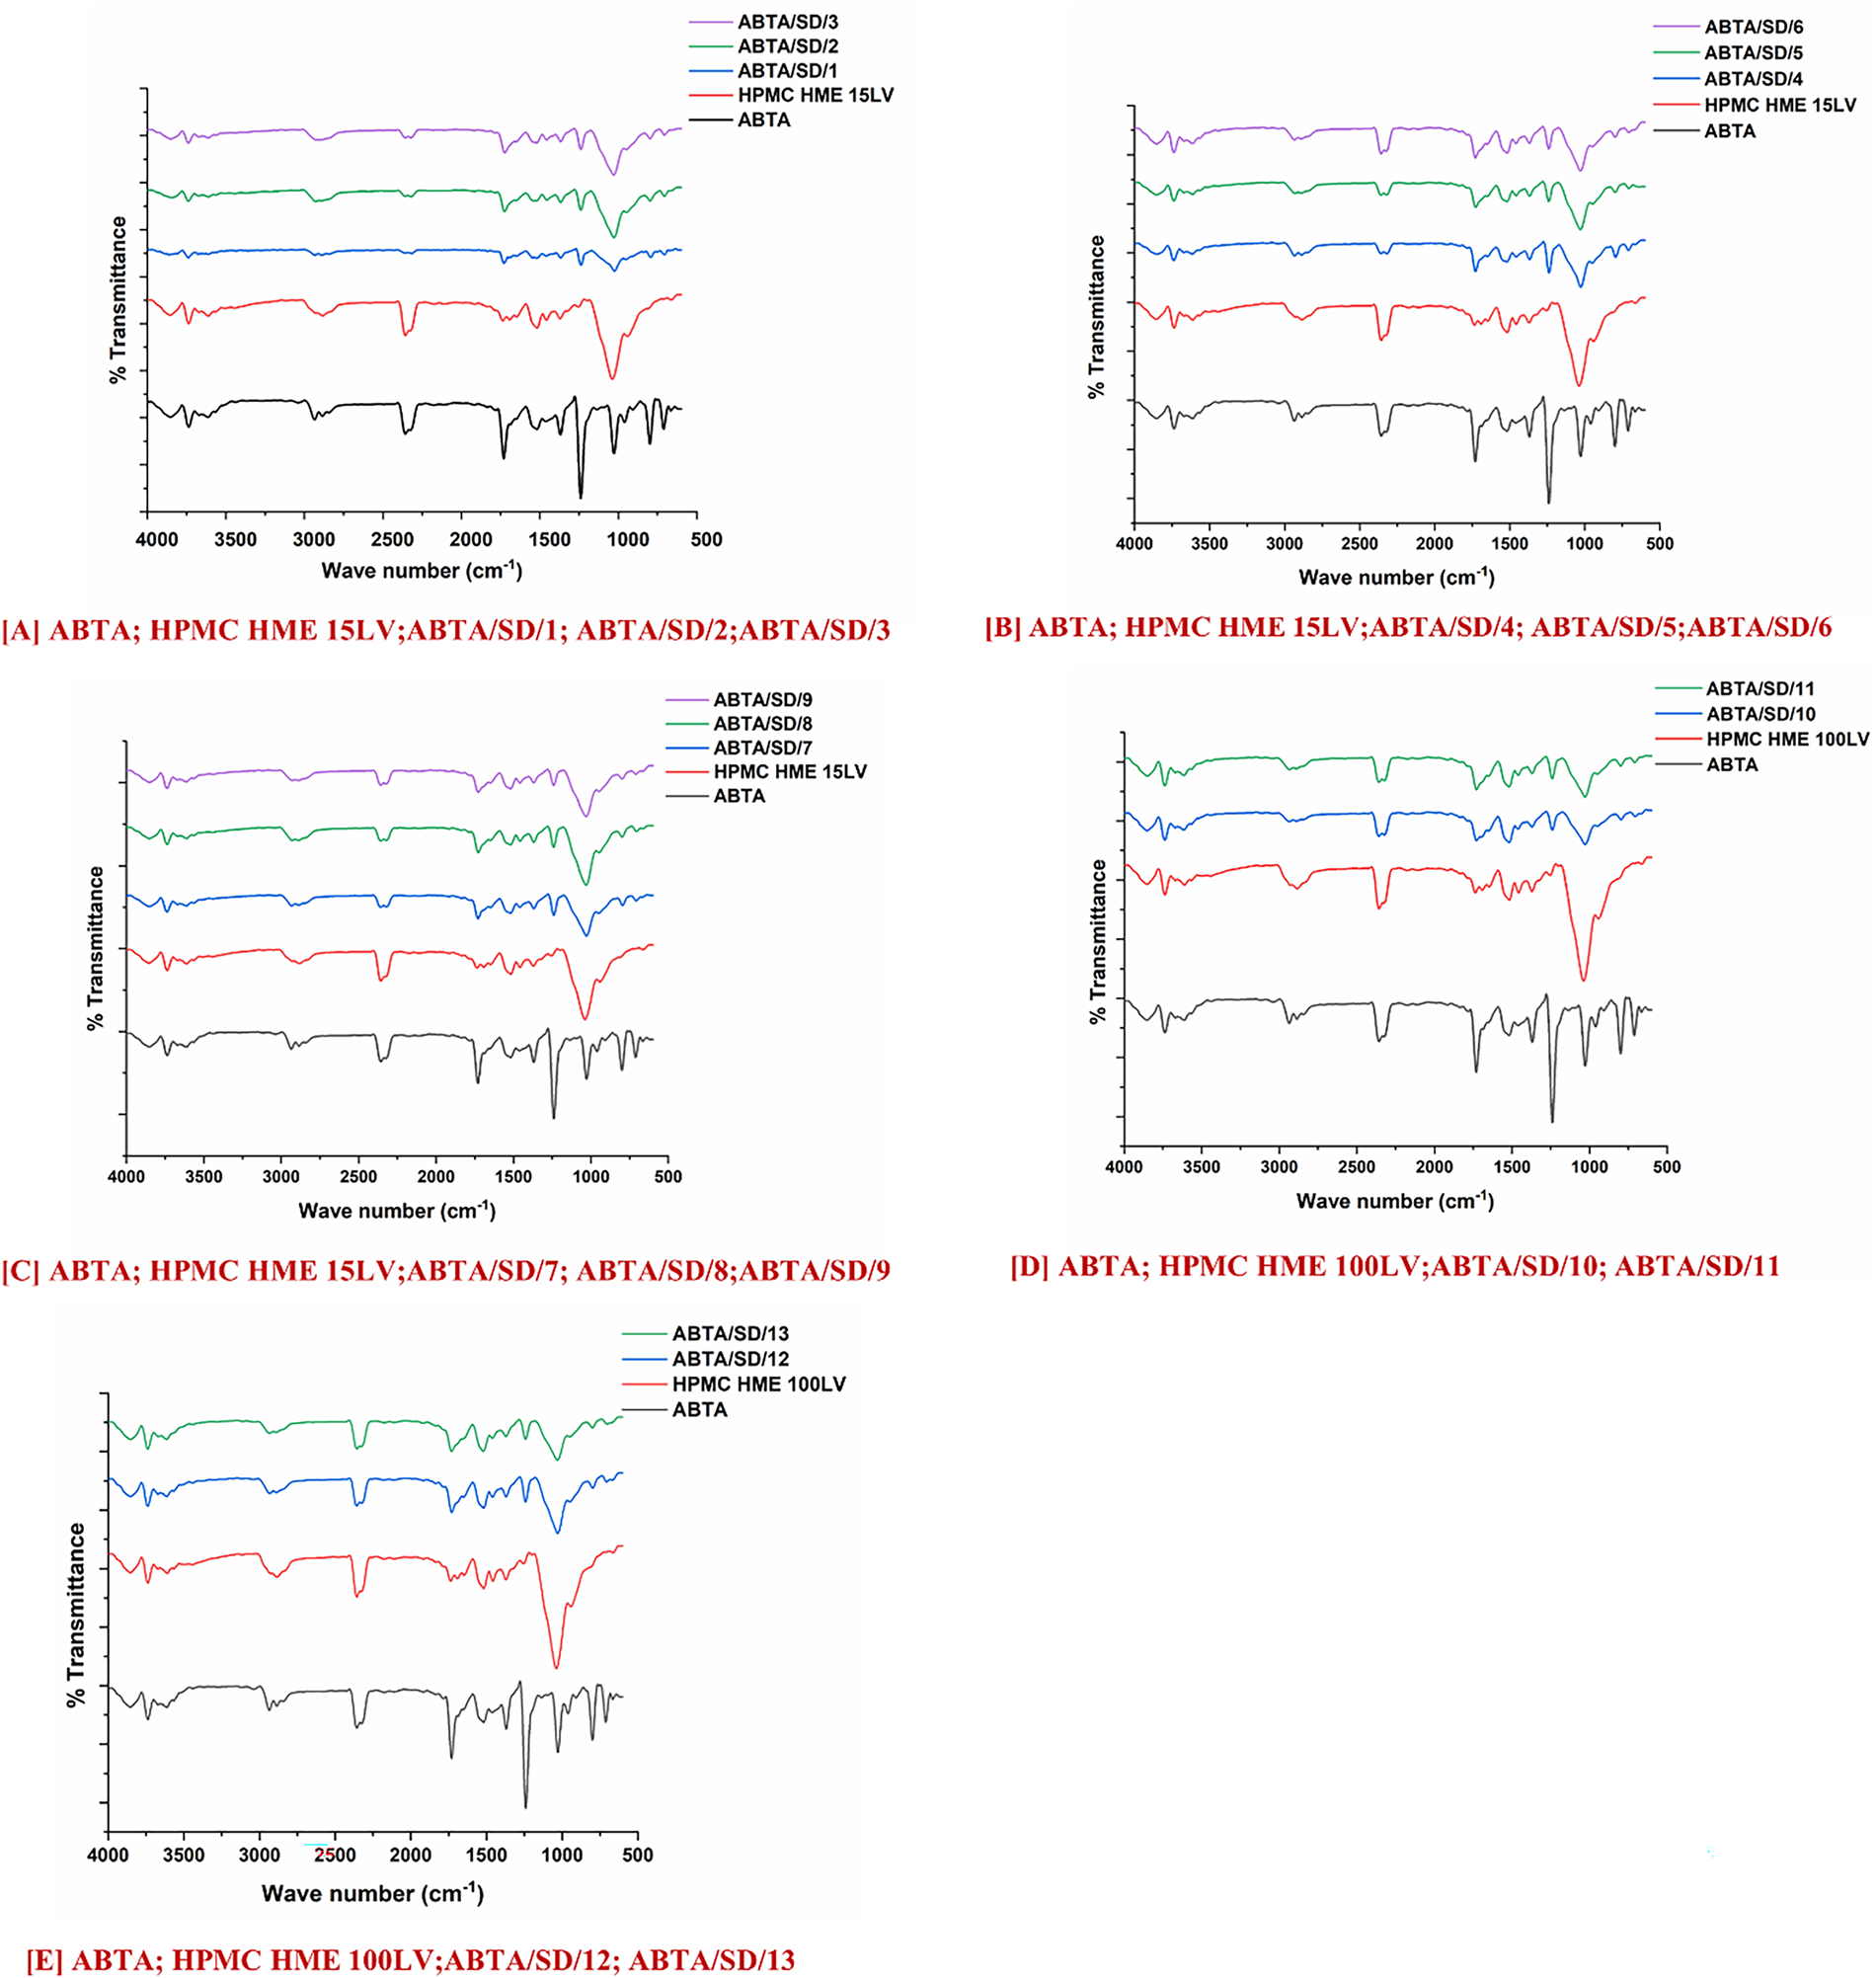
Figure 7: FTIR of ABTA SD formulations with HPMC HME (15LV and 100LV)
3.4.5 Feld Emission Scanning Electron Microscopy (FE-SEM)
FE-SEM analysis of ABTA and ABTA SD, shown in Fig. 8, revealed that ABTA existed as irregularly shaped crystals, confirming its crystalline form (Fig. 8n) [25]. In the case of all ABTA SD formulations displaying the disappearance of the crystals of ABTA fragments shown in Fig. 8a–m, which signifies the transformation of the crystalline drug form into the amorphous state during the formation of ABTA SD with HPMC HME.
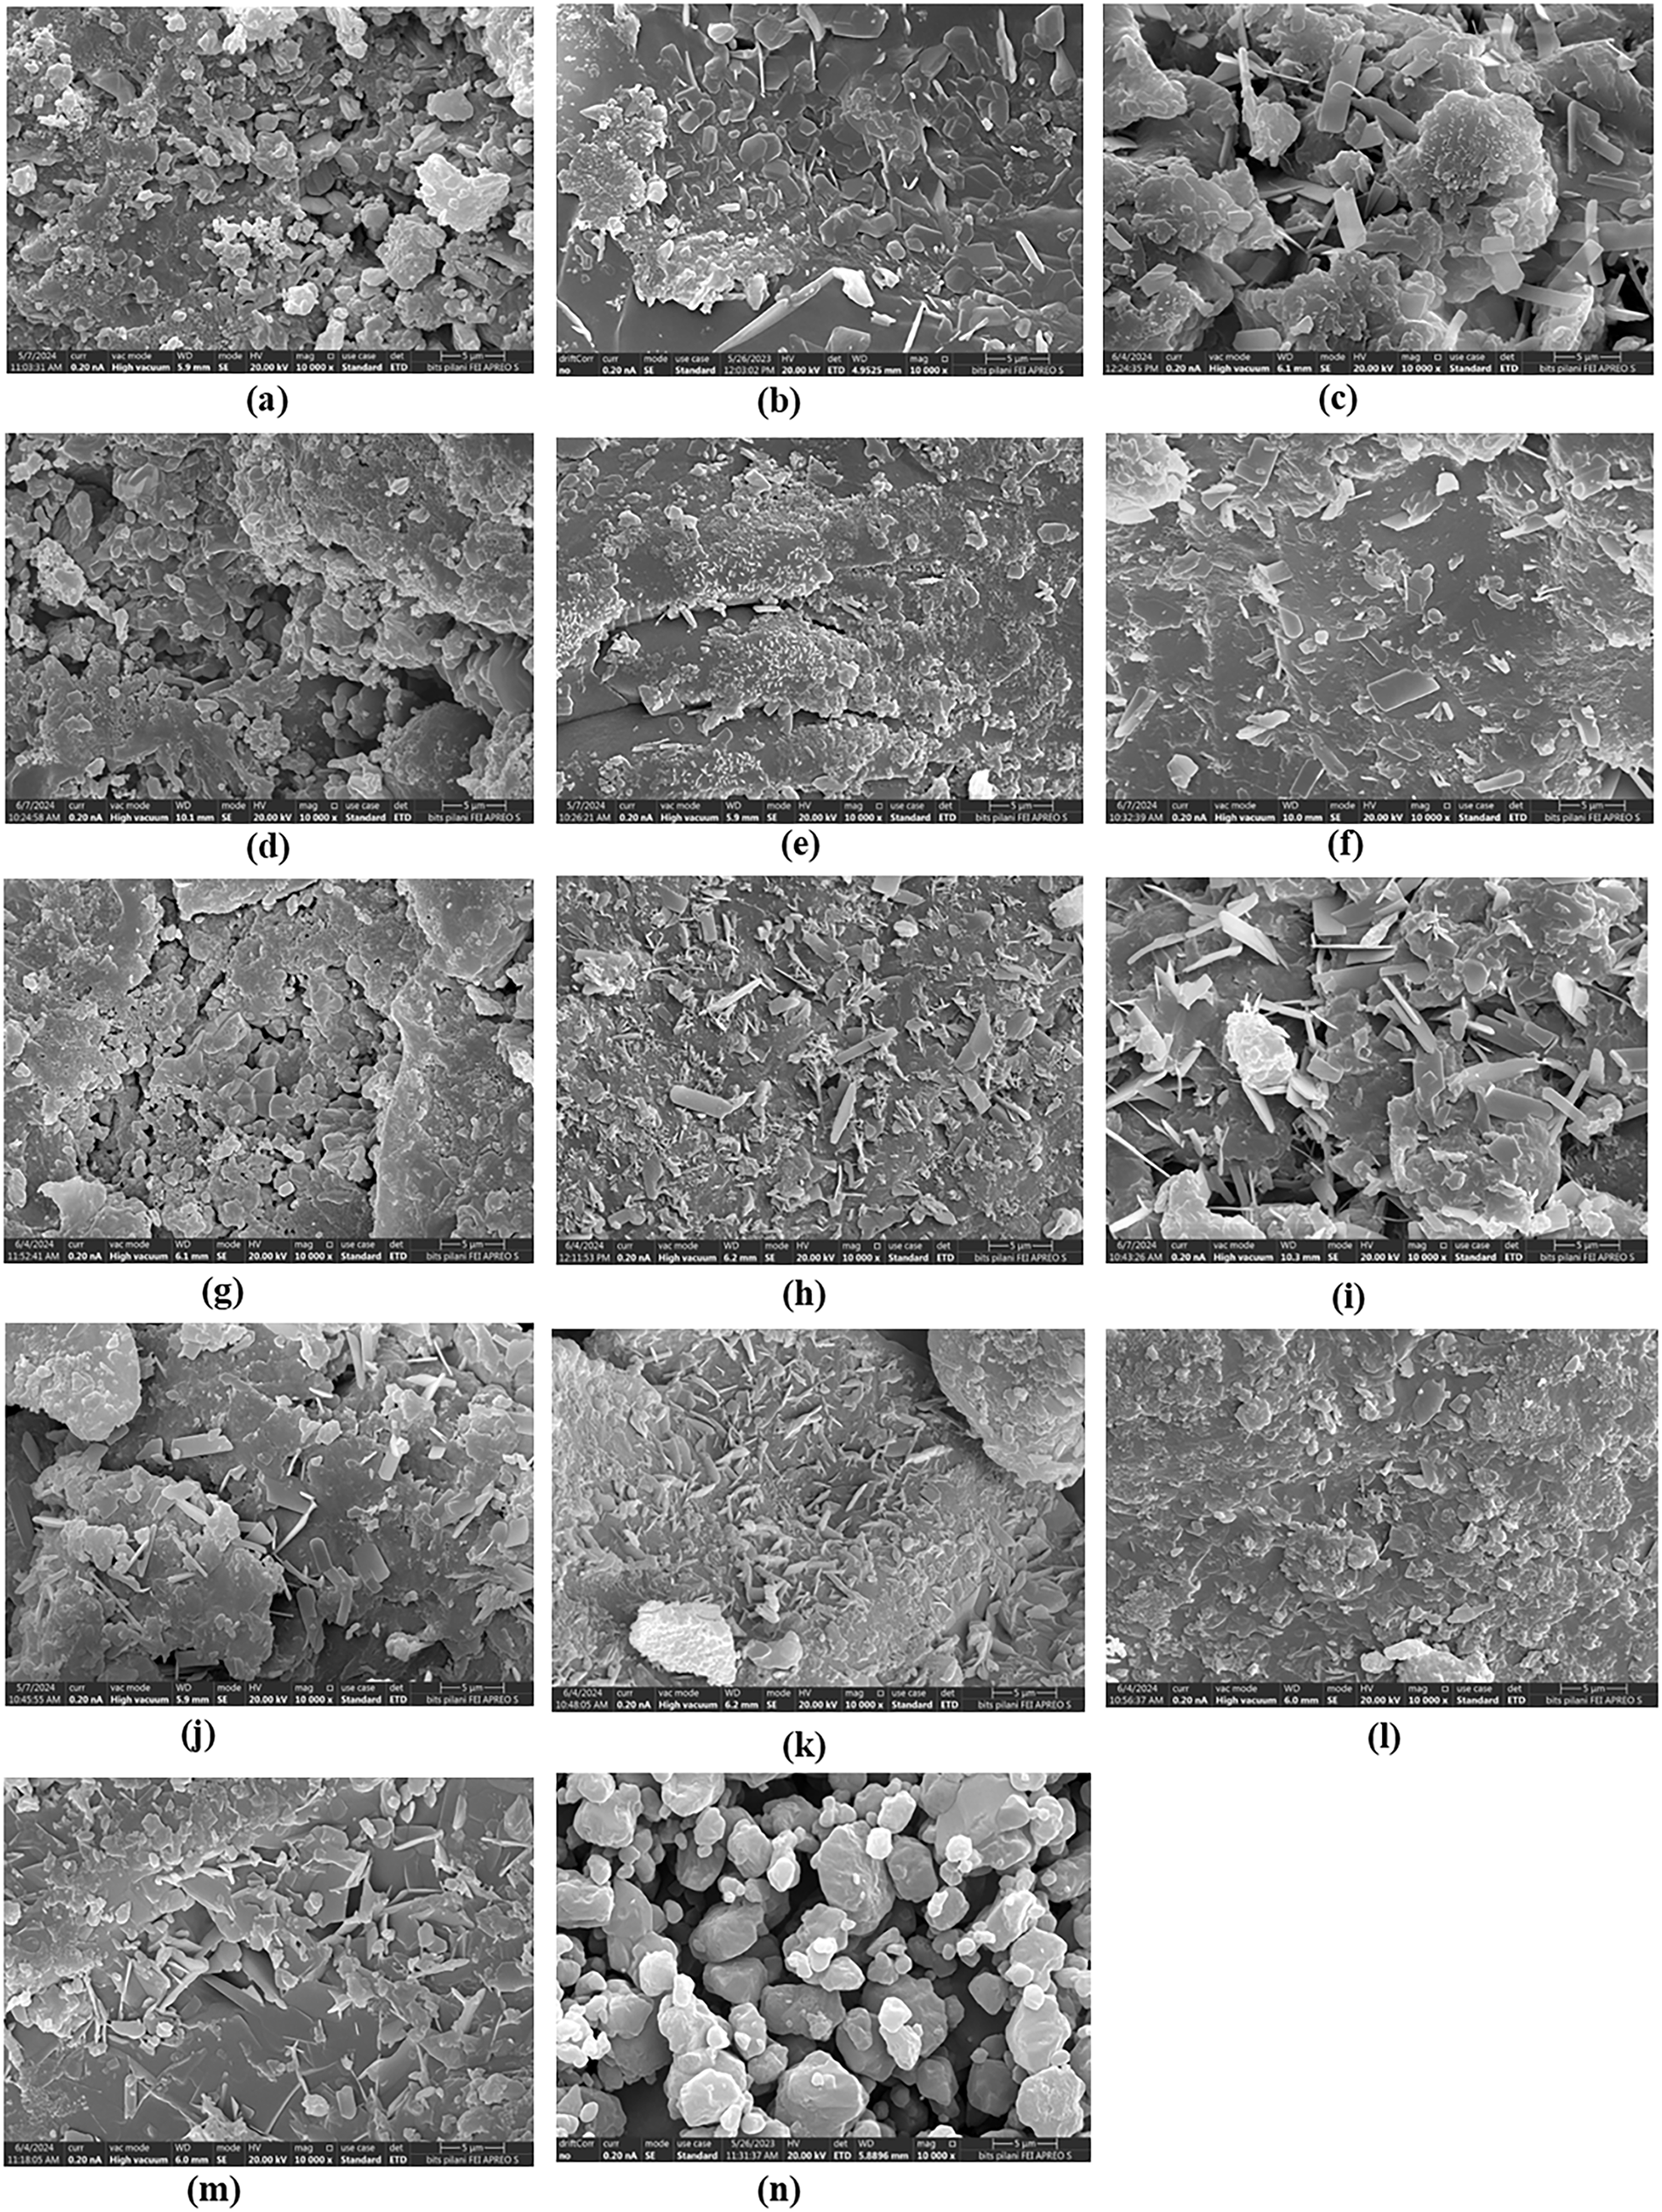
Figure 8: FE-SEM images of (a) ABTA/SD/1; (b) ABTA/SD/2; (c) ABTA/SD/3; (d) ABTA/SD/4; (e) ABTA/SD/5; (f) ABTA/SD/6; (g) ABTA/SD/7; (h) ABTA/SD/8; (i) ABTA/SD/9; (j) ABTA/SD/10; (k) ABTA/SD/11; (l) ABTA/SD/12; (m) ABTA/SD/13; (n) ABTA
3.5 Apparent Solubility Studies
The apparent solubility of free ABTA in water at room temperature was found to be approximately 1.012 μg/mL [25]. ABTA solubility varies with pH, with a solubility of 136.70 μg/mL in 0.1 N HCl. At pH 6.8, the solubility of free ABTA was 0.510 μg/mL. In FaSSIF and FeSSIF, the solubility of free ABTA was around 5.07 and 82.20 μg/mL, respectively [25]. These formulations notably enhanced ABTA solubility across all media, including water (3.01–10.96 μg/mL), 0.1 N HCl (480.25–574.22 μg/mL), pH 6.8 (3.0–6.52 μg/mL), FaSSIF (8.91–21.68 μg/mL), and FeSSIF (82.45–128.51 μg/mL) compared to free ABTA (see Fig. 9A,B). The solubility of ABTA in all formulations showed improvement compared to free ABTA, as illustrated in Table 5, represented as fold changes compared to free ABTA. Increasing the HPMC content beyond certain ratios (ABTA: HPMC HME from 1:1.5 to 1:2) led to a decrease in apparent ABTA solubility and produced a noticeably more viscous solution, which slows water diffusion into the drug–polymer matrix and thereby retards drug dissolution. At higher polymer loadings, the medium can also approach a saturation or solubilization limit, reducing the capacity to solubilize additional ABTA and further constraining apparent solubility. Based on these observations, all ABTA solid dispersion formulations were subjected to comprehensive in-vitro dissolution testing to quantify the net effect of polymer ratio on release rate and extent.
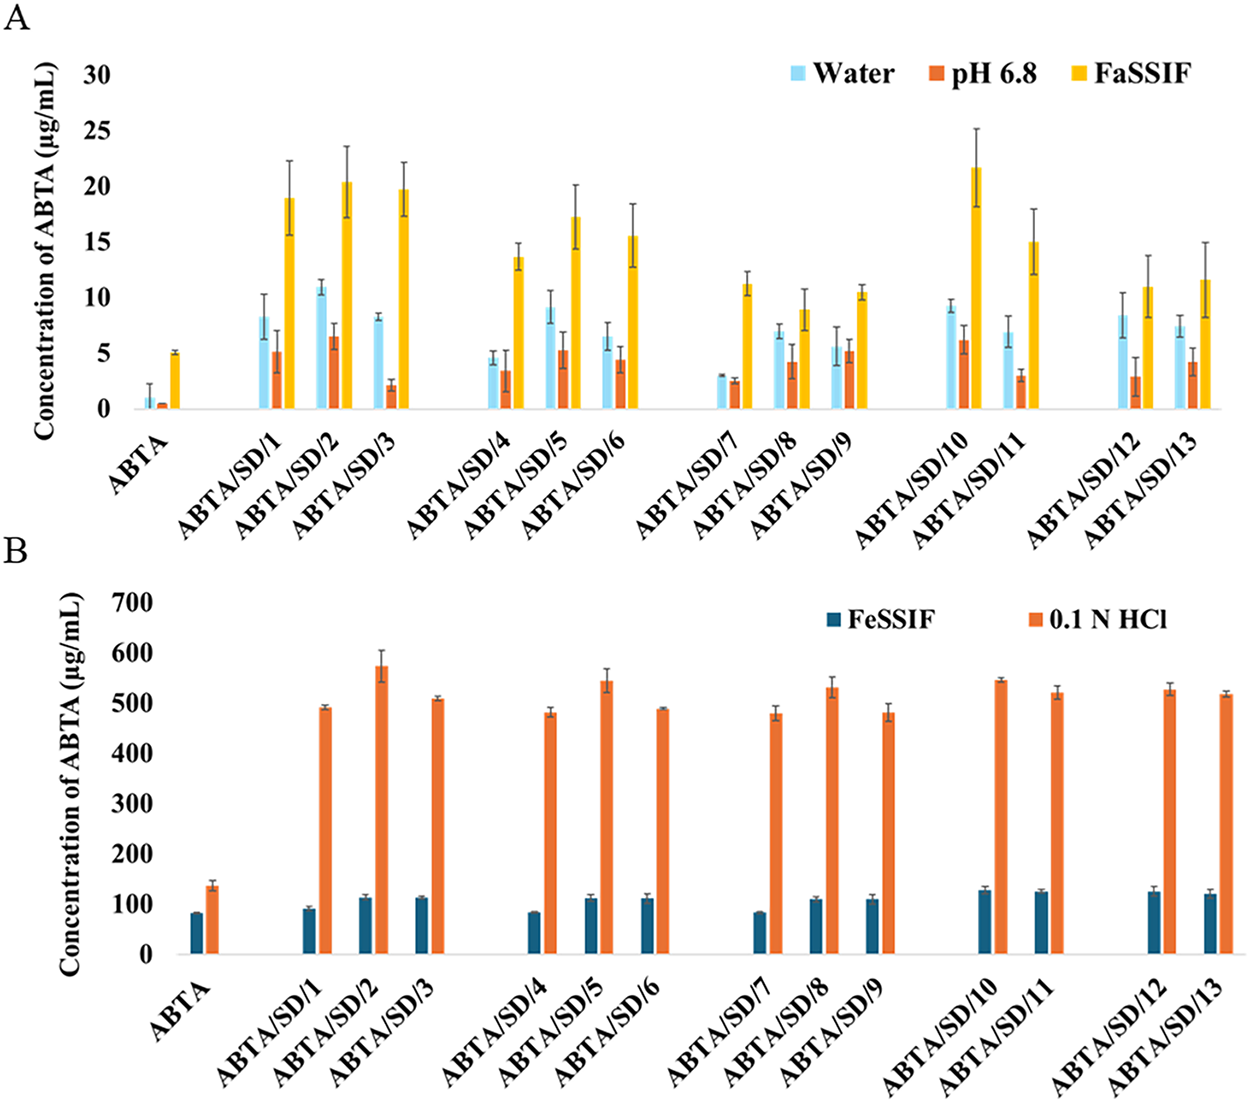
Figure 9: Solubility studies of free ABTA and ABTA SD formulation at different extrusion temperatures in different media (A) water, pH 6.8 and FaSSIF; (B) FeSSIF, and 0.1 N HCl (pH 1.2)

Moreover, the increase in solubility achieved through HME can be attributed to several key mechanisms. Firstly, the process reduces particle size, resulting in a larger surface area available for solubility. Secondly, forming an amorphous state of the API enhances solubility by disrupting the ordered crystalline structure. Thirdly, the intimate mixing of the API and polymer promotes strong interactions, such as the formation of hydrogen bonds between the API and polymer and improves wetting properties. Finally, the prevention of API recrystallization maintains enhanced solubility over time.
3.6 Effect on Viscosity with Change in pH and HPMC HME Polymer Concentration
Polymeric solution properties are influenced by conformational changes and environmental factors like concentration, temperature, and pH. Conformational changes occur in molecules when the pH is shifted to either acidic or basic levels. The effect of pH on the dispersion of HPMC HME (15LV and 100LV) is carried out at different concentrations (1.33% and 2.66%) in the pH range 1.2–6.8 and in the Biorelevant media, i.e., FaSSIF (pH 6.5) and FeSSIF (pH 5.0). It was observed that at lower pH, viscosity was decreased because the HPMC coils more tightly as the ionic strength increases. HPMC macromolecules are more prevalent at the lowest pH, and polymer-polymer interactions are less pronounced. In a basic pH environment, HPMC molecules are more extended, allowing them to interact with each other even at lower concentrations, resulting in increased polymer-polymer interactions [44]. Thus, an increase in viscosity is observed at a higher pH range, as shown in Fig. 10. In the case of FeSSIF media at pH 5.0, the viscosity of HPMC is higher compared to pH 6.8. This increase in viscosity is due to the higher amounts of bile salts and lecithin in FeSSIF, which contribute to its more viscous nature.
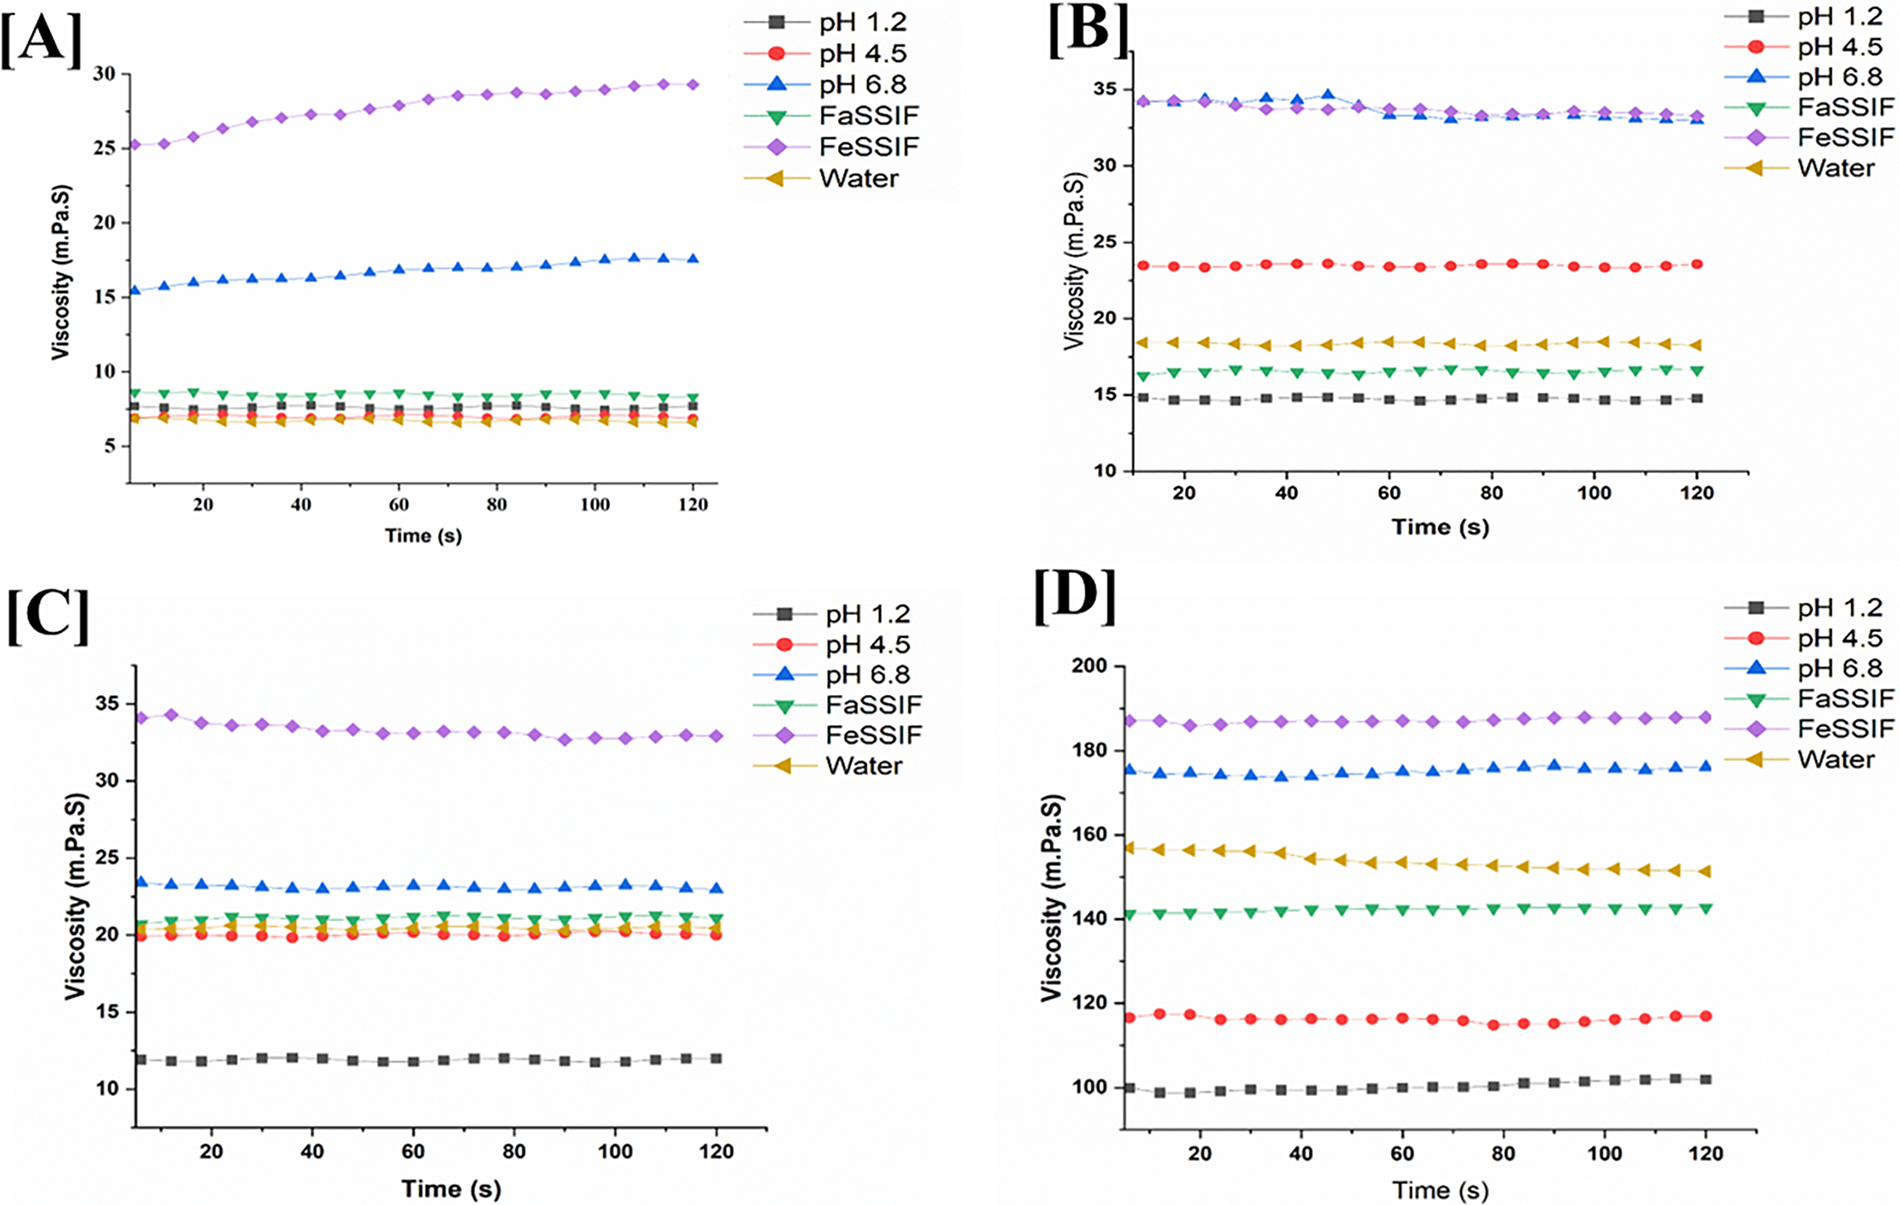
Figure 10: Viscosity of (A,B) HPMC HME 15LV and (C,D) 100LV in different pH media with different concentrations (1.33% and 2.66%)
Moreover, the concentration of the HPMC HME (15LV and 100LV) affects the viscosity. This study observed that increasing the concentration (2.66%) of HPMC HME 15LV and 100LV increases viscosity but causes slower drug dissolution. The lower concentration (1.33%) of the HPMC HME 15LV and 100LV tended to decrease viscosity, but the drug dissolution was faster [45]. Fig. 10 shows the viscosity of the HPMC HME 15LV and 100LV at different concentrations in the pH range of 1.2–6.8. It was found that the viscosity of HPMC HME 15LV and 100LV is directly related to the polymer’s concentration and the pH.
3.7.1 In-Vitro Dissolution Study
The in-vitro dissolution study of free ABTA and ABTA SD formulations was performed in dissolution media at pH 1.2 and pH 4.5. The free ABTA dissolved approximately 56.41% at pH 1.2 and 58.39% at pH 4.5 after 120 min [25]. However, the SD formulations exhibited superior dissolution profiles, both in terms of rate and extent, compared to the free ABTA. For SD formulations, dissolution was increased and varied from 59.61% to 100.67% depending on the nature and concentration of the polymer and process and temperature used. The dissolution rate was also found to be enhanced (Fig. 11), as indicated by the profiles. This difference is likely due to the amorphous nature of ABTA in the SD, which was also observed in the different characterization methods, resulting in enhanced solubility and dissolution rates. Moreover, it was observed that during the HME process, the extrusion temperature (120°C, 140°C, and 160°C) and the concentration of HPMC HME polymer significantly impacted the dissolution behavior of the ABTA.
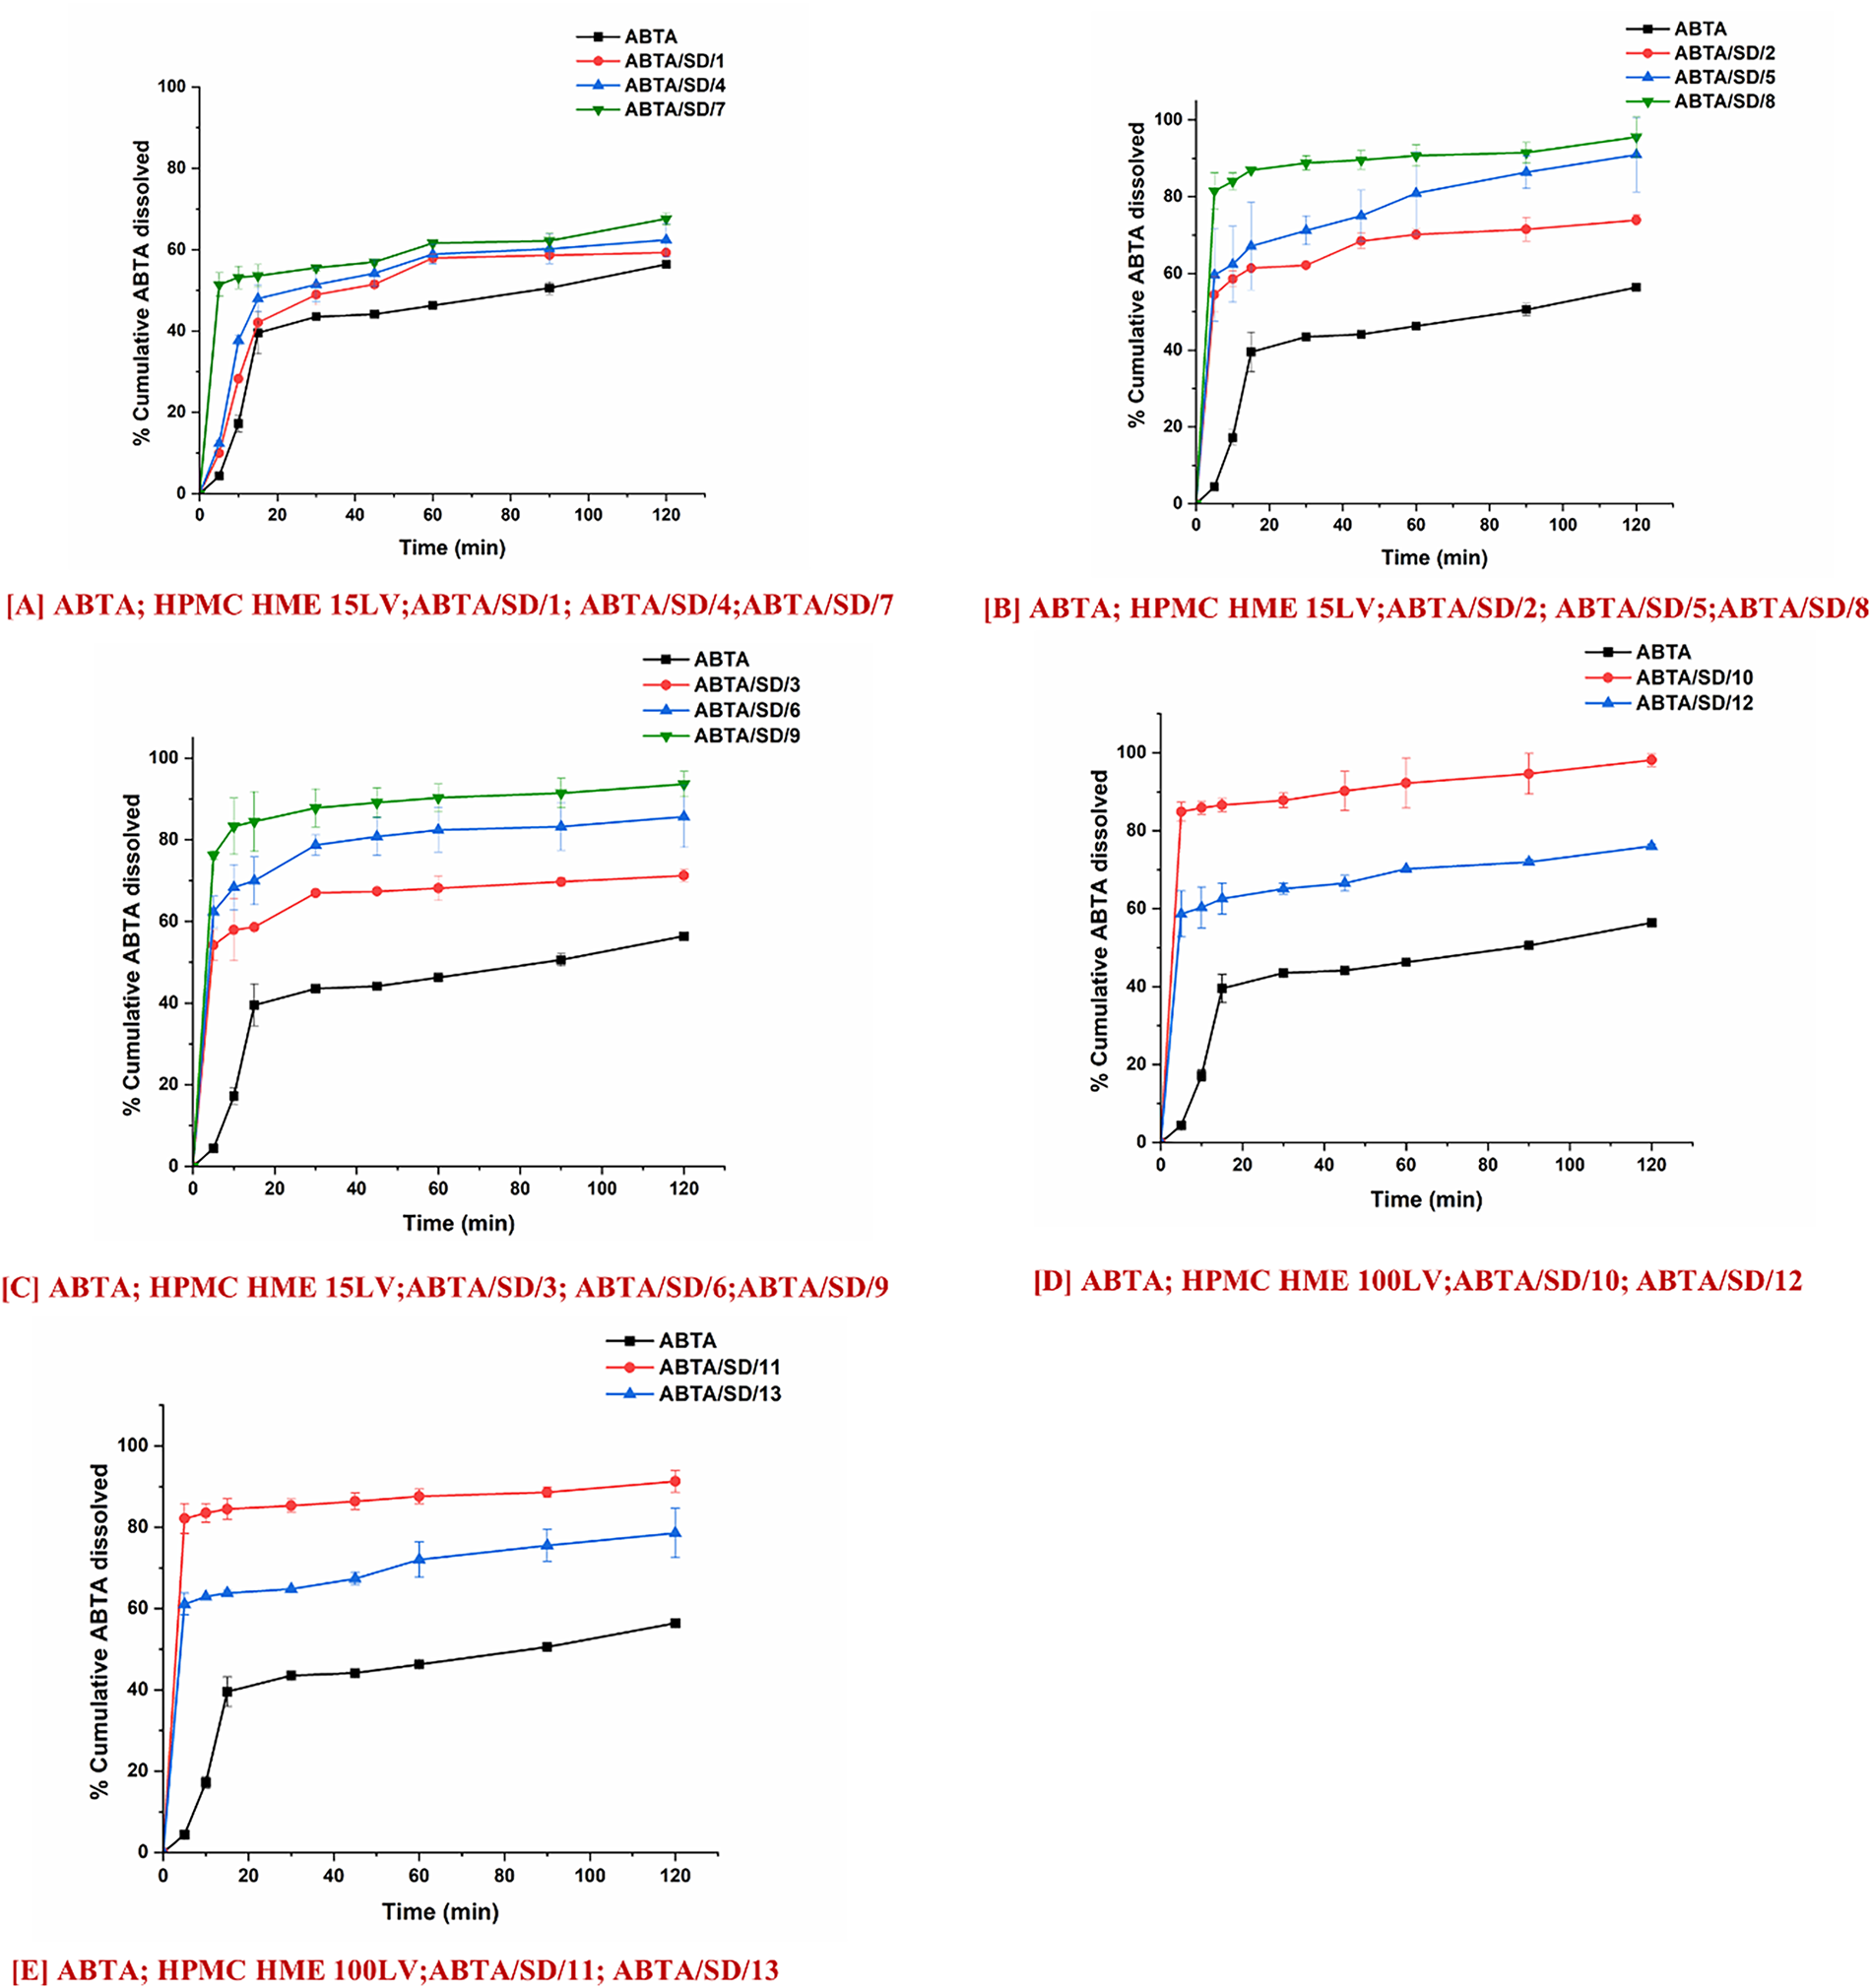
Figure 11: In-vitro dissolution profile of ABTA SD formulations extruded at different extrusion temperatures, 120°C, 140°C and 160°C and different concentrations of HPMC HME 15LV and 100LV in pH 1.2 dissolution media
Fig. 11A–C shows the in-vitro dissolution profile of ABTA/SD/1 to ABT/SD/9 in pH 1.2 dissolution media. The ABTA/SD/7, ABTA/SD/8, and ABTA/SD/9 showed an improved dissolution rate compared to other ABTA SD formulations due to the higher concentration of HPMC HME 15LV at different extrusion temperatures (120°C, 140°C, and 160°C). The rate of dissolution of ABTA/SD/7, ABTA/SD/8, and ABTA/SD/9 was 67.59%, 95.54%, and 93.63% in 120 min at different extrusion temperatures, suggesting that dissolution was increased by 1.14-, 1.74-, and 1.66-fold compared to the ABTA. It was observed that among the various extrusion temperatures used, 140°C showed the highest dissolution of ABTA compared to 120°C and 160°C. The SD prepared at 120°C exhibited crystalline peaks in the PXRD analysis and an endothermic peak in the thermal analysis, indicating that it did not convert to the amorphous state and suggesting potential issues with mixing. In contrast, the ABTA SDs prepared at 140°C and 160°C achieved complete amorphization, with the formulation at 140°C demonstrating superior dissolution performance. This improvement in dissolution at 140°C can be attributed to the optimal temperature effect and proper mixing, which enhances the ABTA dissolution. Overall, temperature and mixing conditions play a crucial role in the preparation of effective SD.
Furthermore, the dissolution rate of ABTA increased with increasing concentrations of HPMC HME 15LV. Specifically, ABTA/SD/2, ABTA/SD/5, and ABTA/SD/8, prepared at 140°C extrusion temperature, showed dissolution rates of 73.93%, 90.92%, and 95.54% in 120 min, respectively, representing an increase by 1.31-fold for ABTA/SD/2, 1.61-fold for ABTA/SD/5, and 1.66-fold for ABTA/SD/8 compared to free ABTA.
Fig. 11D,E presents the in-vitro dissolution profiles of ABTA/SD/10 to ABTA/SD/13 in pH 1.2 dissolution media. The ABTA/SD/10 and ABTA/SD/12 showed an increase in the rate and extent of the dissolution process compared to the ABTA/SD/11 and ABTA/SD/13 when the HPMC HME 100LV concentration was decreased. However, HPMC HME 100LV polymer has a high molecular weight, swells faster, and forms a thicker viscous layer, which can delay or hinder drug dissolution. Increasing the HPMC HME 100LV concentration can increase the formulation’s viscosity; which forms a barrier that slows the diffusion of the drug molecules, allowing more time to dissolve in the media [16]. The rates of dissolution of ABTA/SD/10 and ABTA/SD/12 were 98.12% and 91.28% in 120 min, suggesting the dissolution was enhanced by 1.74-fold and 1.66-fold compared to the free ABTA. The extrusion temperature and concentration of HPMC HME 15LV and HPMC HME 100LV significantly influenced the dissolution behavior in all ABTA SD formulations in pH 1.2 dissolution media.
At the 140°C and 160°C extrusion temperatures, there is no significant difference in the dissolution behavior. During the dissolution of ABTA/SD/8 and ABTA/SD/9, the drug rapidly dissolved from the SD formulation, reaching a plateau within 5 min, with maximum dissolution of 81.53% and 76.23%, respectively, as shown in Fig. 11A–C. Similarly, ABTA/SD/10 and ABTA/SD/12 achieved rapid dissolution, reaching a plateau within 5 min, with maximum dissolution of 84.91% and 82.14%, respectively, compared to crystalline ABTA shown in Fig. 11D,E.
Furthermore, the dissolution behavior of ABTA SD was also studied in pH 4.5 dissolution media. Fig. 12A–C shows the in-vitro dissolution profile of ABTA/SD/1 to ABTA/SD/9 in pH 4.5 dissolution media. The ABTA/SD/1, ABTA/SD/2, and ABTA/SD/3 showed an improved dissolution rate compared to other ABTA SD when the HPMC HME 15LV concentration was lower at different extrusion temperatures (120°C, 140°C and 160°C). However, the rates of dissolution of ABTA/SD/1, ABTA/SD/2, and ABTA/SD/3 were 72.25%, 96.44%, and 90.41% in 120 min, suggesting that dissolution was increased by 1.24, 1.65, and 1.55-fold compared to the free ABTA. At an extrusion temperature of 140°C, the dissolution rate in pH 4.5 decreased with increases in the HPMC HME 15LV concentration. Here, ABTA/SD/2, ABTA/SD/5, and ABTA/SD/8 showed dissolution rates of 96.44%, 87.34%, and 80.45%, respectively, representing an increase by 1.65-, 1.50-, and 1.38-fold compared to the free ABTA. Fig. 12D,E illustrates the in vitro dissolution behavior of formulations ABTA/SD/10 through ABTA/SD/13 in phosphate buffer at pH 4.5. Among these, ABTA/SD/10 and ABTA/SD/12 exhibited markedly higher dissolution rates compared to ABTA/SD/11 and ABTA/SD/13, indicating that a reduction in the concentration of HPMC HME 100LV positively influenced drug release performance. The rates of dissolution of ABTA/SD/10 and ABTA/SD/12 were 100% and 96.20% in 120 min, indicating that the dissolution was increased by 1.72 and 1.65-fold compared to the free ABTA.
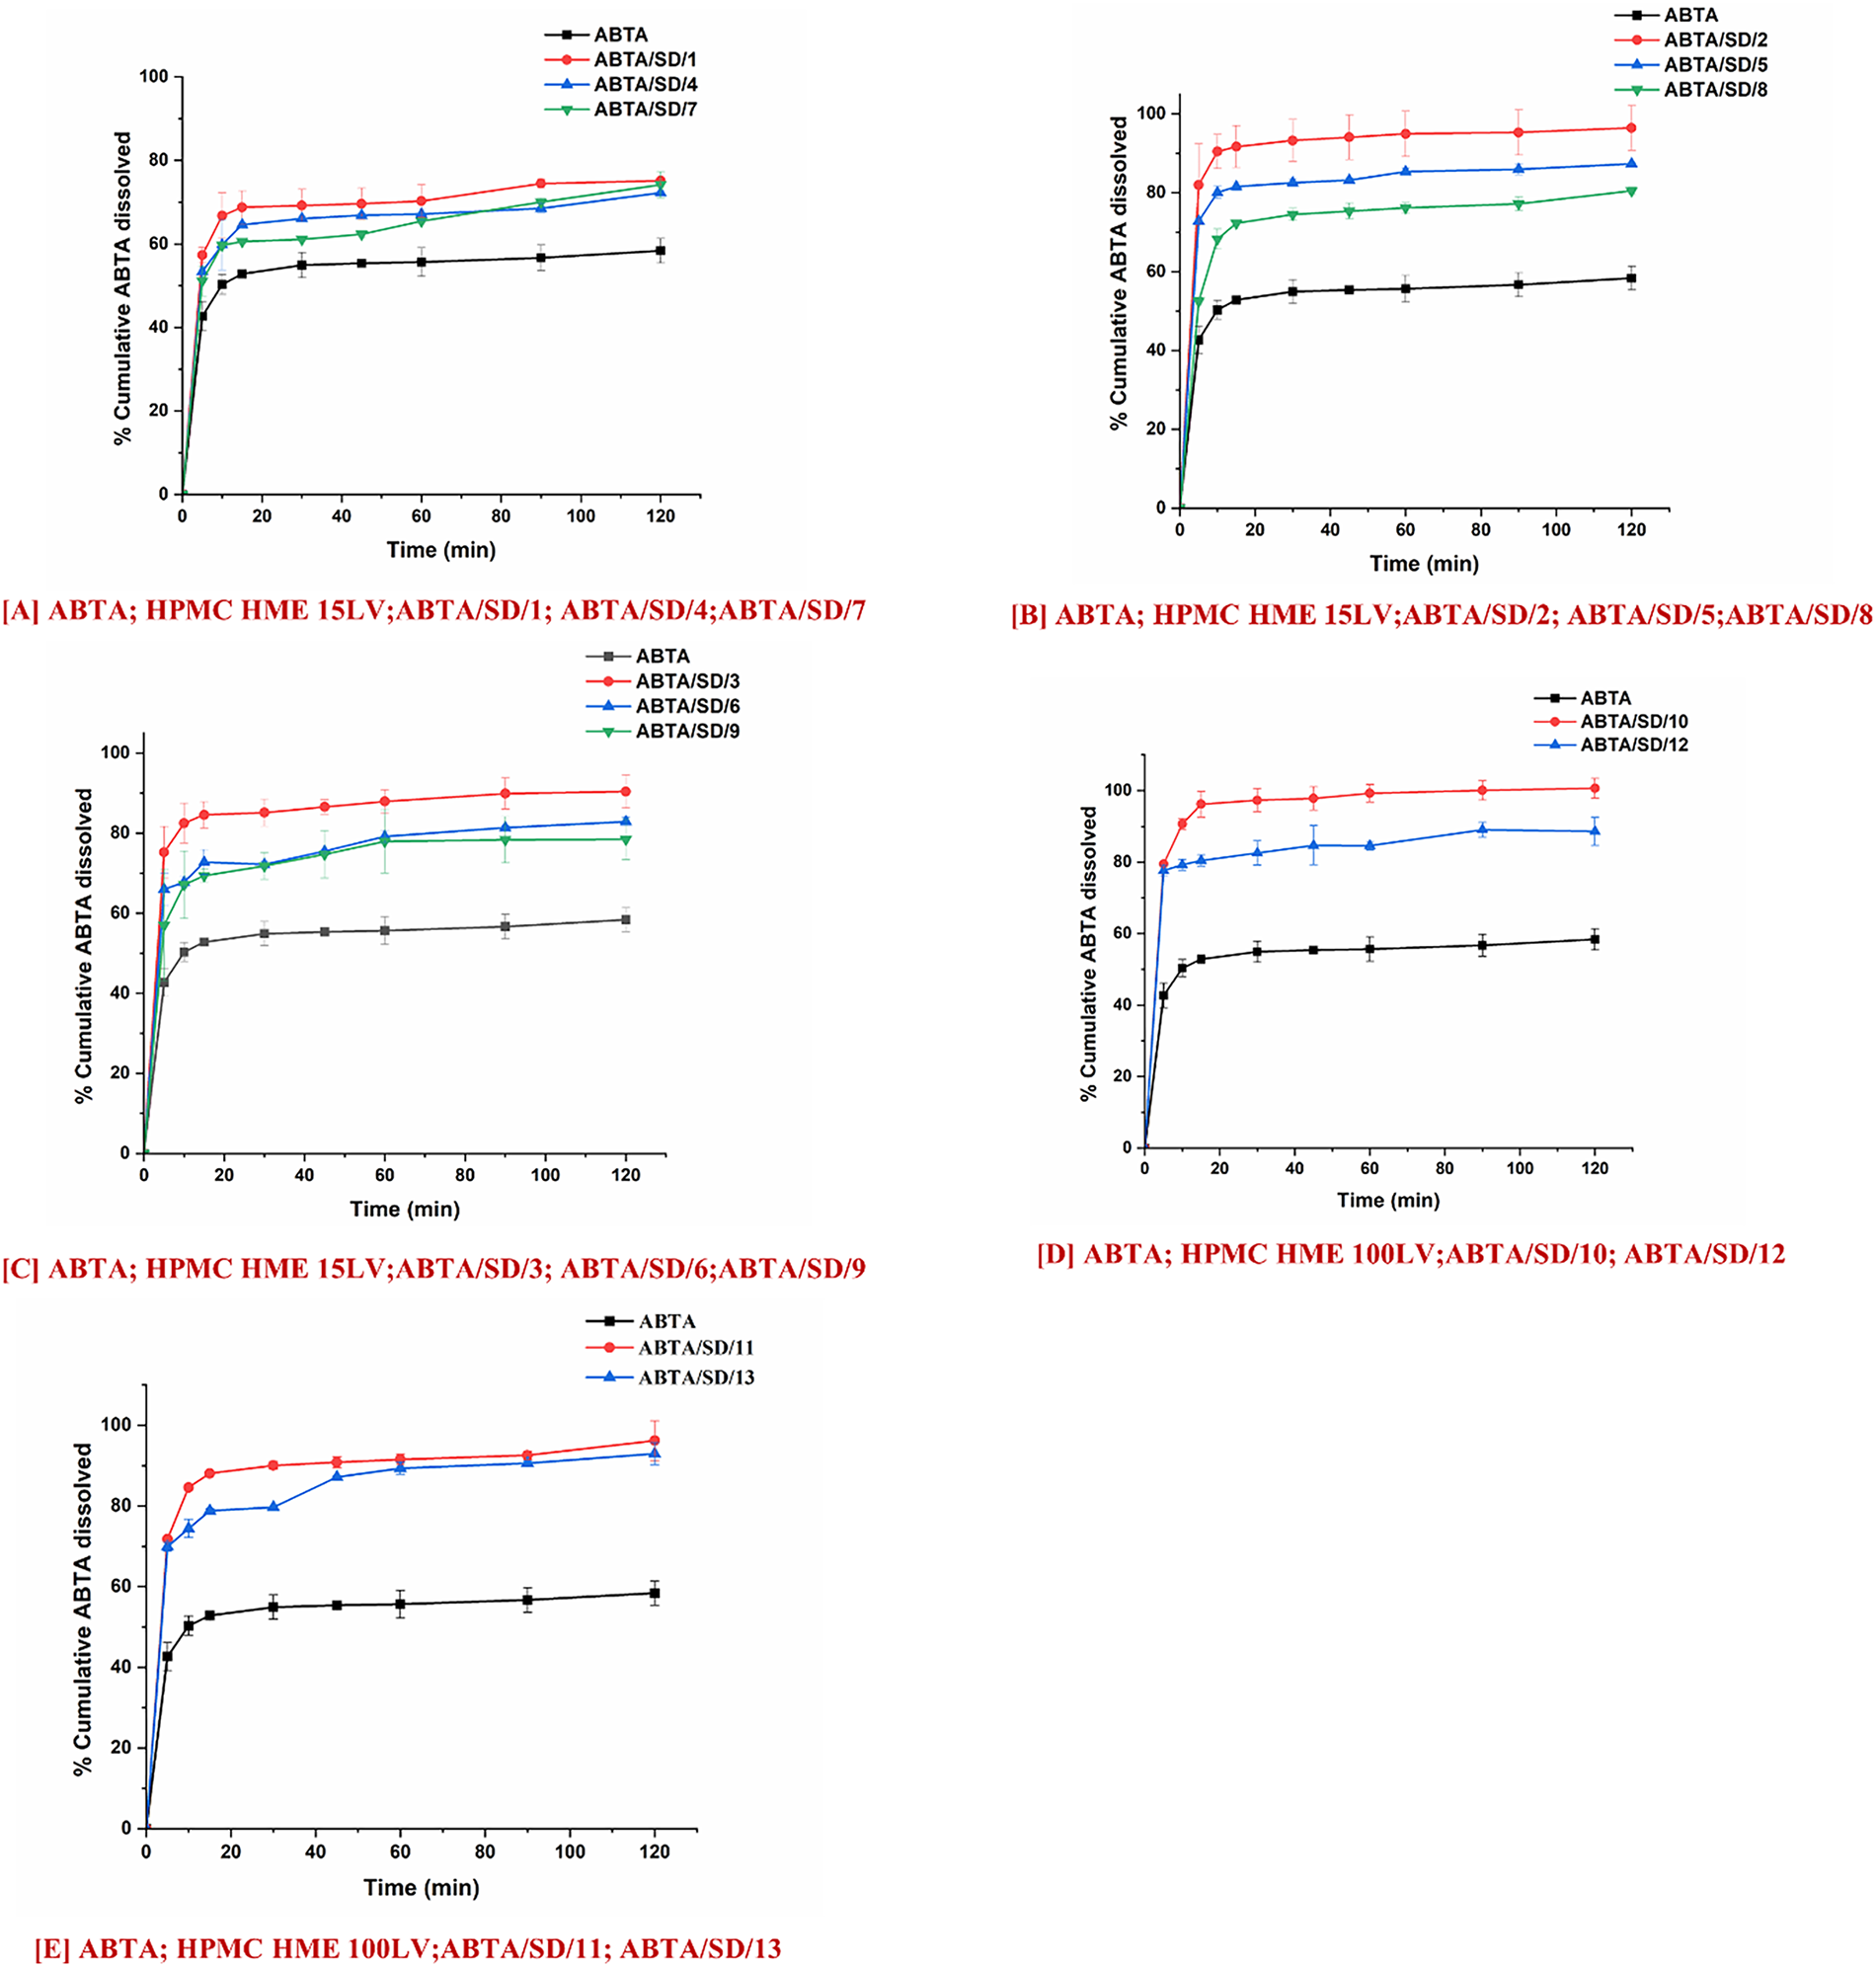
Figure 12: In-vitro dissolution profile of ABTA SD formulations extruded at different extrusion temperatures 120°C, 140°C and 160°C and different concentrations of HPMC HME 15LV and 100LV in pH 4.5 dissolution media
The concentration of HPMC HME and pH of the dissolution media play an essential role in the dissolution behavior of ABTA SD. When the concentration of HPMC HME 15LV is increased, there is a notable enhancement in the dissolution rate of ABTA at pH 1.2, whereas at pH 4.5, there is a decrease in the dissolution rate of ABTA. This disparity can be attributed to the distinct behavior of HPMC HME 15LV in these environments. In the case of pH 1.2, HPMC HME 15LV demonstrates a reduced propensity for forming a viscous layer. Consequently, its higher concentration facilitates enhanced dissolution of ABTA, likely by promoting the dissolution of the drug. Conversely, at pH 4.5, HPMC HME 15LV exhibits the ability to hydrate and form a gel-like structure, forming a viscous solution or layer. As a result, the increased concentration of HPMC HME 15LV impedes the dissolution rate of ABTA, possibly by creating a barrier that hinders the dissolution of the drug from the formulation. However, the concentration of the HPMC HME and pH directly affect the viscosity of the ABTA SD. Apart from that, the concentration of HPMC HME, pH, and solubility of ABTA play an essential role in enhancing the dissolution behavior of ABTA SD in 1.2 compared to pH 4.5. Specifically, ABTA demonstrated higher solubility at pH 1.2 compared to pH 4.5, which contributed to improved dissolution at pH 1.2.
Owing to this, in the case of HPMC HME 100LV, the dissolution behavior was the same in both the dissolution media at pH 1.2 and pH 4.5; this is due to the higher molecular weight of HPMC HME 100LV, which rapidly swelled and formed a thicker viscous layer which can delay or hinder the drug dissolution. Increasing the HPMC HME 100LV concentration can increase the formulation’s viscosity; which forms a barrier that slows the diffusion of the drug molecules, allowing more time to dissolve in the media.
3.7.2 Biorelevant Dissolution Studies
Biorelevant dissolution studies become particularly crucial when examining drugs susceptible to food effects, which pertain to alterations in a drug’s absorption and pharmacokinetics following oral intake alongside food. Given ABTA susceptibility to food effects, it’s essential to explore its dissolution under various food conditions. In this context, crystalline ABTA and ABTA SD formulations were subjected to biorelevant dissolution profiling in both FaSSIF (pH 6.5) and FeSSIF (pH 5.0), as illustrated in Fig. 13A,B. Notably, only 8.84% and 32.20% of the free ABTA dissolved after 120 min in FaSSIF and FeSSIF, respectively [25]. In-vitro dissolution results indicated that ABTA/SD/2, ABTA/SD/5, ABTA/SD/8, and ABTA/SD/10, extruded at 140°C exhibited higher dissolution rates compared to other ABTA SD formulations in pH 1.2 and pH 4.5. However, biorelevant dissolution studies in FaSSIF (pH 6.5) and FeSSIF (pH 5.0) were conducted for only the above-mentioned ABTA SD formulations.
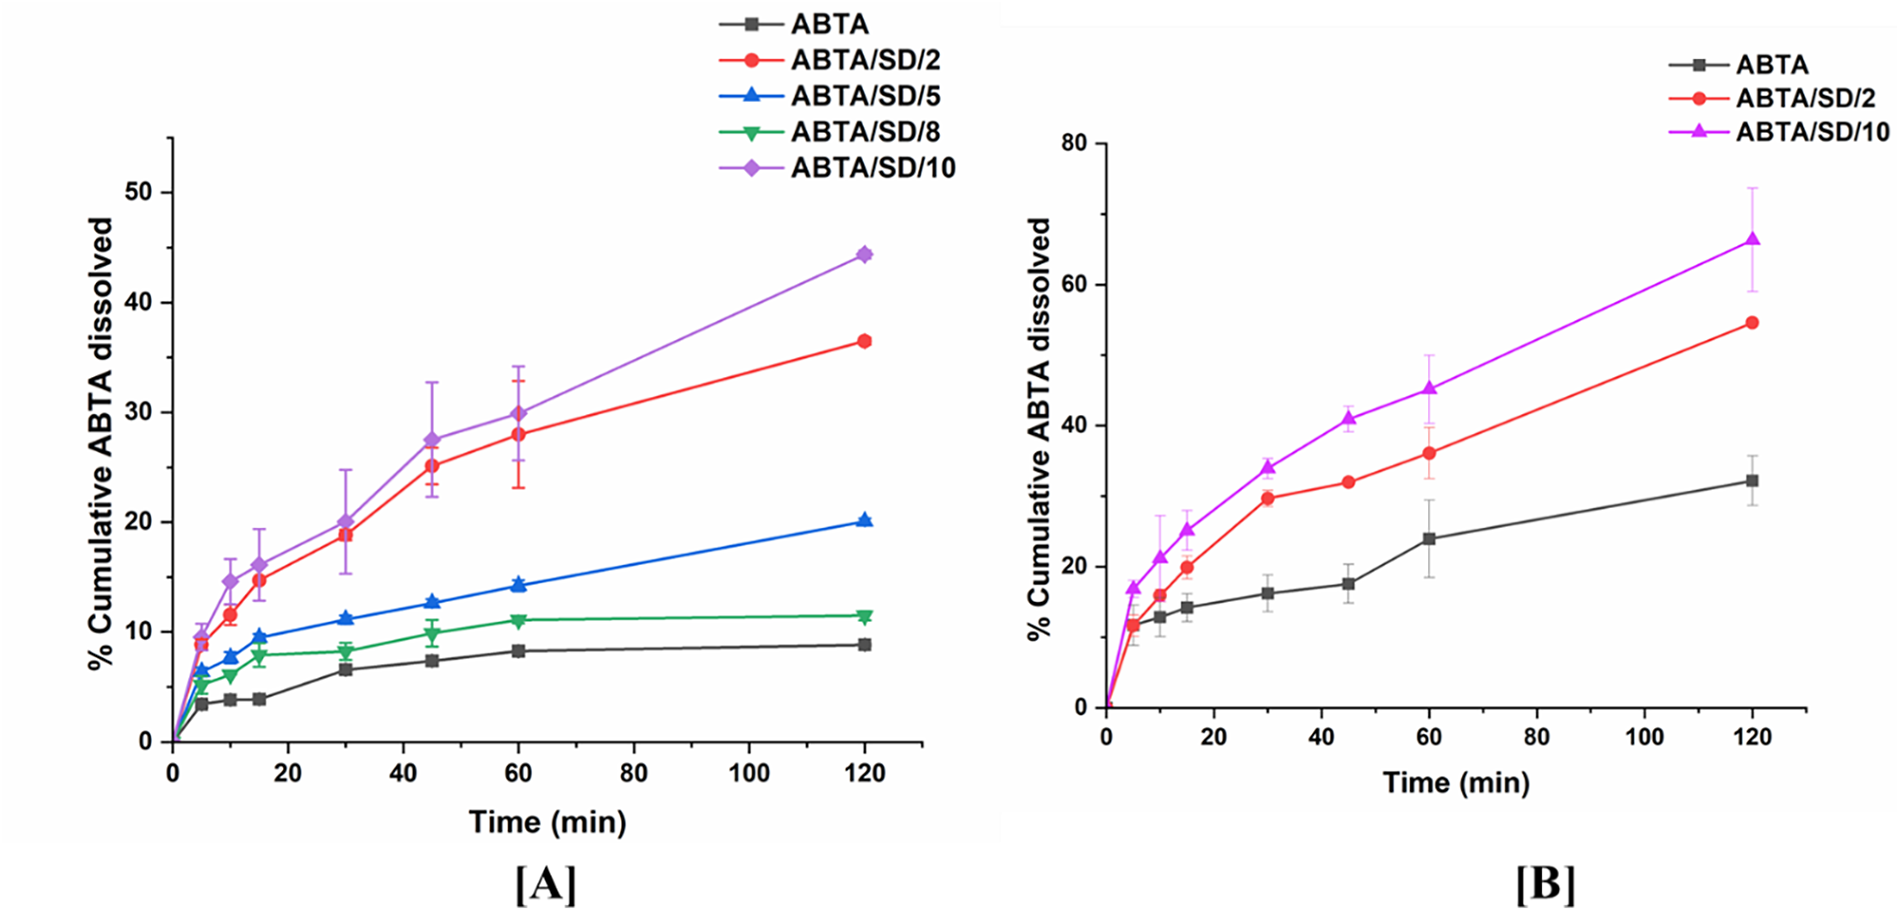
Figure 13: Biorelevant dissolution of ABTA SD in (A) FaSSIF (pH 6.5); (B) FeSSIF (pH 5.0)
Among SDs extruded at 140°C, ABTA/SD/2, ABTA/SD/5, ABTA/SD/8 and ABTA/SD/10 were profiled in FaSSIF to select candidates for further fed-state testing. At 120 min the dissolved drug in FaSSIF was 36.49% for ABTA/SD/2, 16.05% for ABTA/SD/5, 11.50% for ABTA/SD/8, and 44.38% for ABTA/SD/10; these values correspond to 4.14-, 1.85-, 1.30-, and 5.02-fold increases over free ABTA in FaSSIF, respectively (Fig. 13A). Based on superior fasted-state performance, ABTA/SD/2 and ABTA/SD/10 were advanced to FeSSIF testing, where they reached 54.60% and 66.34% dissolution at 120 min, corresponding to 1.70- and 2.06-fold increases relative to free ABTA in FeSSIF (Fig. 13B). These paired FaSSIF/FeSSIF data demonstrate that ABTA benefits from fed-state solubilization provided by bile salts and phospholipids, and the magnitude of the fed/fasted difference is formulation dependent [46].
The observed formulation-dependent behaviour can be explained by competing mechanisms of polymer-drug interactions and media-mediated solubilization. Lower HPMC HME 15LV loadings (ABTA/SD/2) produced higher dissolution than the higher polymer loadings represented by ABTA/SD/5 and ABTA/SD/8 in FaSSIF, consistent with increased viscous/gel layer formation at higher HPMC concentrations that can retard drug mass transfer and dissolution [47,48]. Conversely, ABTA/SD/10 (formulated with HPMC HME 100LV) delivered the highest dissolution in both FaSSIF and FeSSIF, indicating that in bile-salt containing media, the solubilization and wettability advantages conferred by this HPMC grade outweigh viscosity-related retardation. The greater hydration and wettability characteristics of HPMC 100LV vs. 15LV are therefore consistent with enhanced drug desorption into bile-salt micelles and improved dissolution in biorelevant media. In the case of pH 1.2 and pH 4.5, HPMC HME 100LV (at 1:1 ratios) exhibited higher dissolution compared to HPMC HME 15LV (1:1 ratios), although no significant differences were observed. Overall, the differences in dissolution behavior can be attributed to the unique properties of the two HPMC grades and their interactions with ABTA across varying pH environments.
Overall, ABTA/SD/2 shows higher dissolution than ABTA/SD/5 and ABTA/SD/8, likely because increased HPMC HME 15LV raises viscosity and slows drug release; however, ABTA/SD/10 yields the greatest dissolution, as bile-salt/phospholipid-containing FaSSIF/FeSSIF enhances solubilization and offsets viscosity-related retardation.
3.7.3 Mathematical Analysis of In-Vitro and Bio-Relevant Dissolution Data
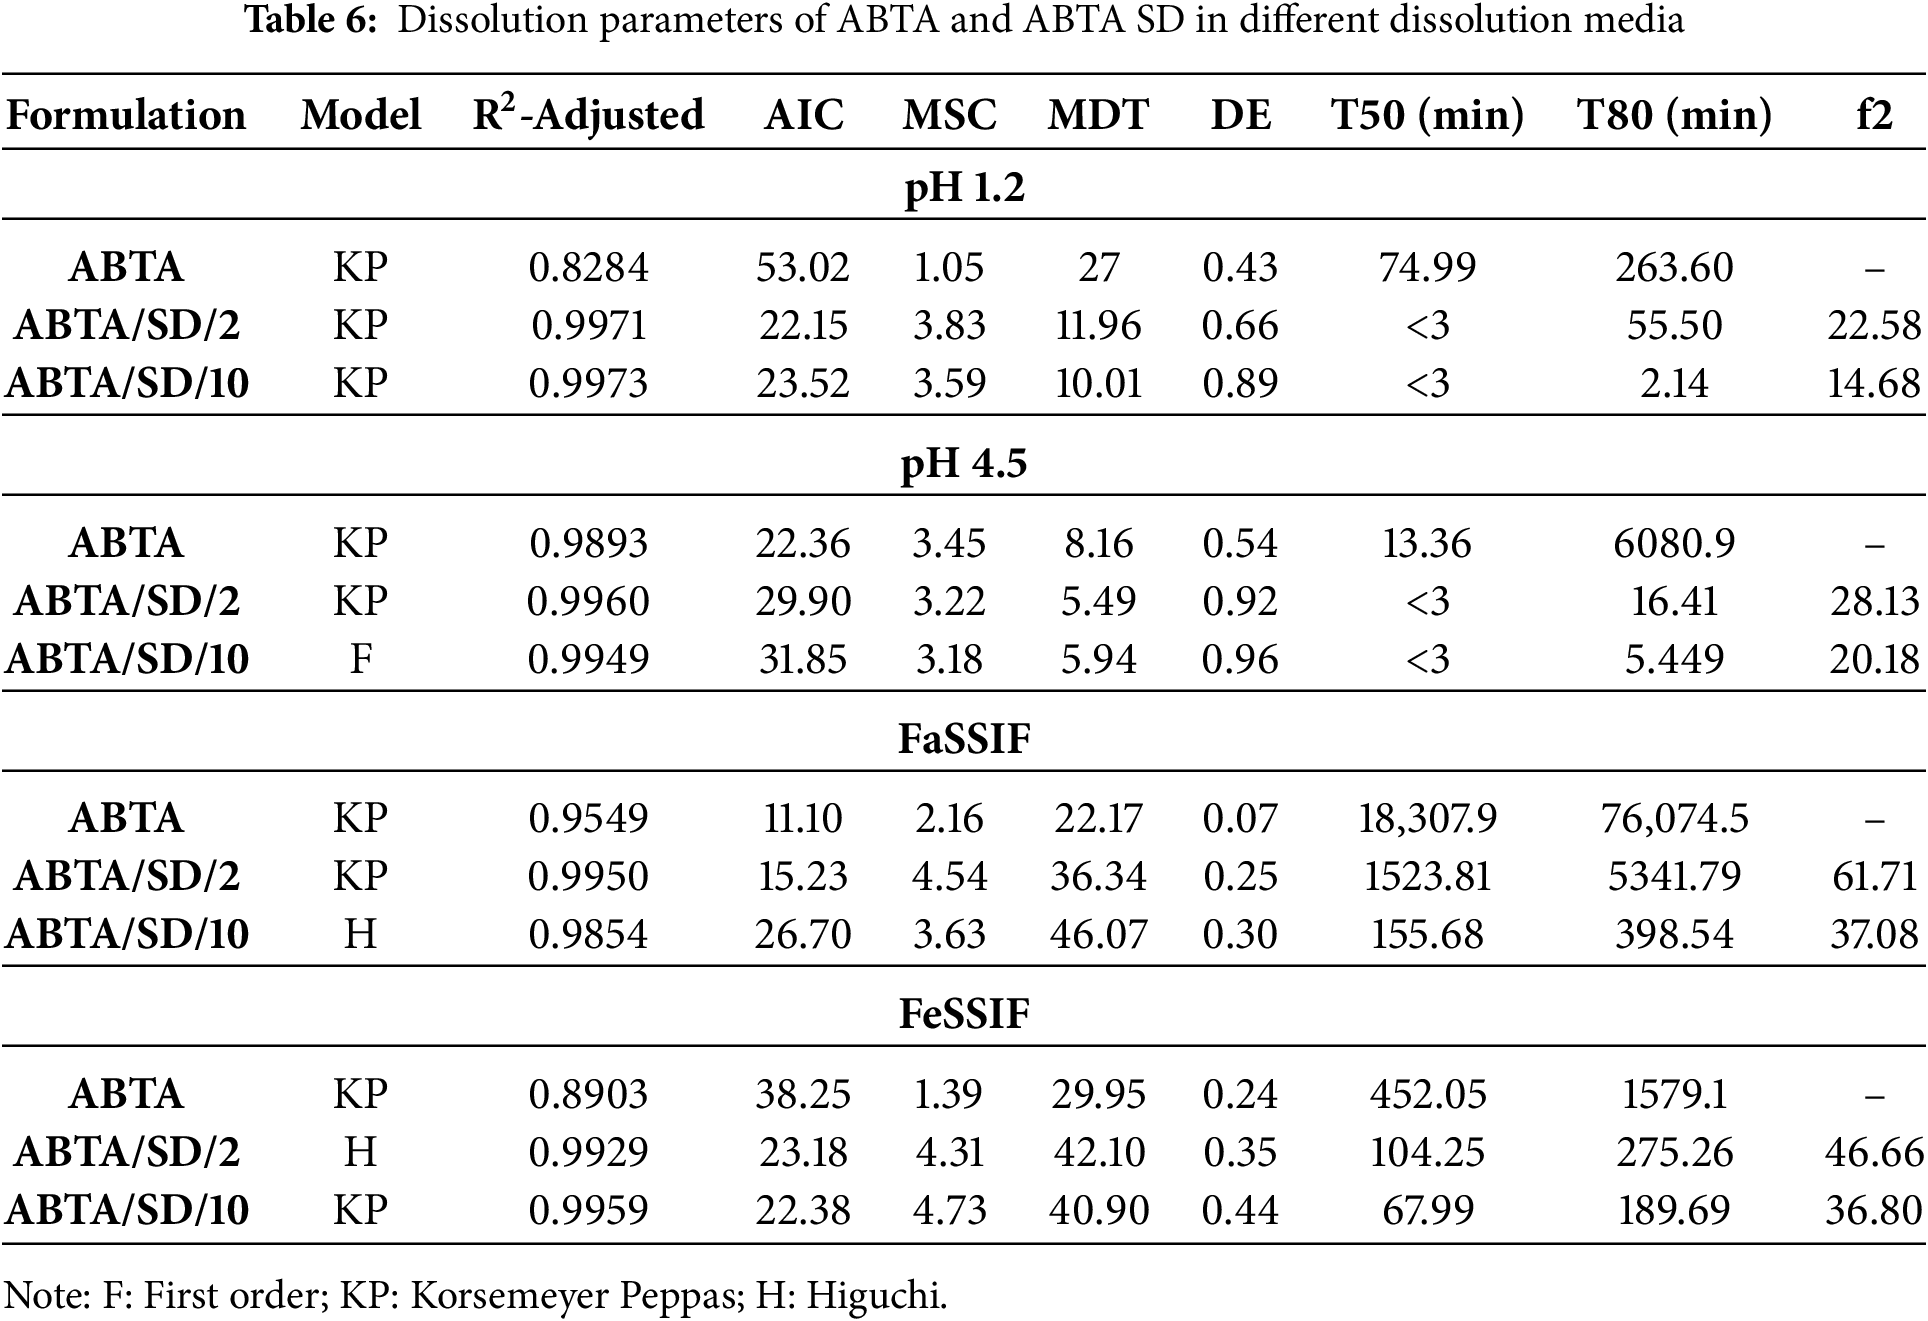
The dissolution parameters (R2-adjusted, MDT, DE, MSC, and AIC) for ABTA, ABTA/SD/2, and ABTA/SD/10 at 140°C extrusion were calculated using DD-solver across various media, summarized in Table 6. The Korsemeyer-Peppas and Higuchi models showed the best fit in pH 1.2, FaSSIF, and FeSSIF, respectively, as presenated in Table 6. In the pH 4.5 dissolution media case, the Korsemeyer Peppas and first order model were observed in ABTA/SD/2 and ABTA/SD/10 at 140°C, respectively. Furthermore, under these dissolution conditions, the dissolution efficiency (DE) of the optimized formulations ABTA/SD/2 and ABTA/SD/10 prepared at 140°C was notably greater than that of the pure ABTA, whereas the MDT for the optimized formulation at 140°C had a faster rate of dissolution than the free ABTA [25], as illustrated in Table 6. Moreover, the ABTA/SD/10 at 140°C formulation showed good dissolution kinetics compared to the ABTA/SD/2 at 140°C.
The optimized formulations (ABTA/SD/2 and ABTA/SD/10) showed consistent in-vitro dissolution, drug content, DSC, and PXRD results over 90 days, with no color changes compared to the initial results. An in-vitro dissolution study in pH 4.5 dissolution media was conducted to assess the stability of the optimized formulation. The T50 and T80 values showed no significant difference between the initial results and those after 90 days. The PXRD pattern and DSC thermogram of ABTA/SD/2 and ABTA/SD/10 at 0 days and 90 days are shown in Fig. 14. In the stability study, the PXRD pattern and DSC thermogram confirmed that the drug was not recrystallized, and ABTA/SD/2 and ABTA/SD/10 formulation was maintained in amorphous form for 90 days at accelerated temperature (40 ± 2°C/75 ± 5% Relative humidity), illustrated in Fig. 14.

Figure 14: PXRD patterns (A) of (a) ABTA; (b) ABTA/SD/2 (0 days); (c) ABTA/SD/2 (90 days); (B) (a) ABTA; (b) ABTA/SD/10 (0 days); (c) ABTA/SD/10 (90 days); DSC patterns (C) of (a) ABTA; (b) ABTA/SD/2 (0 days); (c) ABTA/SD/2 (90 days); (D) (a) ABTA; (b) ABTA/SD/10 (0 days); (c) ABTA/SD/10 (90 days)
3.9 In-Vivo Pharmacokinetic Study
The plasma concentration-time profile of ABT after a single dose of oral administration of free ABTA and optimized ABTA SD formulations (ABTA/SD/2 and ABTA/SD/10) are illustrated in Fig. 15. A comparison was made between the free ABTA and the optimized ABTA SD formulations (ABTA/SD/2, and ABTA/SD/10). The free ABTA concentration fell below measurable levels within 4 h, whereas the formulation remained detectable for a more extended period of about 8 to 12 h or more. The free ABTA showed a Cmax of 243.27 ± 24.40 ng/mL with a Tmax of 3.33 h [25]. Comparatively, the Cmax of ABTA SD in the ABTA/SD/2 and ABTA/SD/10 batches were 1014.9 ± 12.97 and 1514.6 ± 185.5 ng/mL, respectively, increased by 4.17- and 6.22-fold when compared to the free ABTA. The pharmacokinetic parameters of the free ABTA and all SD formulations are presented in Table 7. The AUC0–4h of free ABTA was 1494.08 ± 191.40 ng/mL, whereas the AUC0–8h of ABTA/SD/2 and AUC0–12h of ABTA/SD/10 batch were 3243.1 ± 517.7 ng/mL·min and 7342.7 ± 1147 ng/mL. min, which showed an increase by 2.17- and 4.94-fold as compared to the free ABTA. The Tmax of the ABTA/SD/2 and ABTA/SD/10 formulations were found to be lower than that of free ABTA, indicating faster absorption. The pharmacokinetic profile of the ABTA/SD/2 formulation based on HPMC HME 15LV exhibited a Tmax of 0.66 h, whereas the ABTA/SD/10-based HPMC HME 100LV showed a Tmax of 2 h.

Figure 15: Plasma concentration-time profile of free ABTA and ABTA SD after oral administration (Values represent mean + SEM)

This difference in Tmax can be attributed to the variation in molecular weight of the HPMC HME. Briefly, the lower molecular weight HPMC HME 15LV facilitated quicker dissolution and absorption of the drug, resulting in a reduced Tmax. Conversely, the higher molecular weight HPMC HME 100LV led to faster swelling and the formation of a thicker viscous layer, acting as a barrier that slows the diffusion of drug molecules, thereby delaying absorption and prolonging the Tmax.
The pharmacokinetic profile of the ABTA/SD/10 formulation, processed at 140°C, demonstrated a higher Cmax compared to the ABTA/SD/2 formulation. This can be attributed to the higher concentration and molecular weight of HPMC HME 100LV polymer in the formulation. Overall, the study clearly indicates that ABTA SD formulations, particularly ABTA/SD/10 processed at 140°C, exhibit superior ABTA absorption compared to free ABTA. Moreover, ABTA/SD/10 processed at 140°C demonstrated the highest bioavailability, primarily influenced by the hydrophilic properties and molecular weight of HPMC HME as well as the preparation method of this formulation.
The SD formulations showed a higher MRT compared to free ABTA, reflecting improved drug absorption and prolonged retention in the body. This increase in residence time could enhance therapeutic outcomes, patient compliance, and lower dosing frequency. The bioavailability of the developed formulation of ABTA/SD/2 and ABA/SD/10 were 2.17-fold and 4.94-fold enhanced compared to free ABTA. The free ABTA exhibits lower Cmax, AUC, and bioavailability due to its larger crystalline particles, leading to slow dissolution and limited absorption. The SD formulations show improved pharmacokinetics due to micronized ABTA, its crystalline-to-amorphous transformation, and HPMC HME’s ability to prevent precipitation and maintain ABTA’s supersaturation. These enhanced revelations observed the beneficial effect of reducing the particle size of ABTA; the formation of an amorphous state of the ABTA enhances solubility by disrupting the ordered crystalline structure; the intimate mixing of the drug and polymer promotes strong interactions, and the prevention of drug recrystallization maintains enhanced solubility over time.
This investigation developed a novel ABTA SD formulation by choosing the appropriate polymer HPMC HME 15LV and 100LV via the HME technique. The theoretical Hansen solubility parameter indicated that the solubility parameter (Δδ) between ABTA and HPMC HME 15LV and 100LV was below 7 MPa1/2, suggesting excellent miscibility. Apparent solubility studies revealed that all ABTA SD formulations displayed higher solubility than free ABTA across all media. HPMC HME can prevent precipitation in intestinal fluids, which is the key factor for the enhanced performance of the novel ABTA formulation when taken on an empty stomach. Notably, two ABTA SD formulations containing HPMC HME 15LV (ABTA/SD/2) and HPMC HME 100LV (ABTA/SD/10) demonstrated enhanced dissolution profiles compared to free ABTA. Among the various extrusion temperatures tested, 140°C proved to be the most suitable for preparing ABTA SD compared to 120°C and 160°C. Analysis via DSC and PXRD suggested that ABTA underwent conversion to the amorphous state within the formulations. ATR-FTIR results indicated decreased functional group intensity, suggesting potential interactions between ABTA and HPMC HME 15LV/HPMC HME 100LV. Stability assessments revealed that ABTA SD formulations remained amorphous without crystallization, likely due to the exceptional recrystallization inhibition properties of HPMC HME. The oral bioavailability of ABTA/SD/2 and ABTA/SD/10 increased by 2.17- and 4.94-fold, respectively, demonstrating that SD can significantly enhance the oral absorption of poorly soluble drugs. This suggests that ABTA SD is a promising, industry-feasible, and scalable technique, offering a novel strategy for prostate cancer treatment.
Acknowledgement: The author sincerely acknowledges the invaluable support from Colorcon Asia Pvt. Ltd., Goa, India, for funding the fellowship. Authors are thankful to Central Analytical Facility (CAF), BITS Pilani, Pilani Campus, Rajasthan for granting access to DSC, powder XRD, and ATR-FTIR equipments and to the Sophisticated Instrumentation Facility (SIF) for the use of FE-SEM. The authors acknowledge the support of the Central Animal Facility, BITS Pilani, Pilani campus, for granting permission for animal studies.
Funding Statement: The fellowship was funded by Coloron Asia Pvt. Ltd., Goa, India.
Author Contributions: Manisha Choudhari: material preparation, data collection, and analysis, writing—original draft; Shantanu Damle: writing—review & editing; Rajat Vashist: writing—review & editing; Ranendra Narayan Saha; Sunil Kumar Dubey: conceptualization, project administration; Gautam Singhvi: conceptualization, resources, supervision. All authors reviewed the results and approved the final version of the manuscript.
Availability of Data and Materials: Data available on request from the authors.
Ethics Approval: All experimental protocols were approved by the Institutional Animal Ethics Committee (IAEC) before the start of the work (Protocol No. IAEC/RES/32/01).
Conflicts of Interest: The authors declare no conflicts of interest to report regarding the present study.
Abbreviations
| ABTA | Abirtaerone acetate |
| SD | Solid dispersion |
| HPMC HME | Hydroxy propyl methyl cellulose hot melt extrusion |
| mCRPC | Metastatic castration resistance prostate cancer |
| ABT | Abiraterone |
| USFDA | United States food drug and administration |
| HME | Hot melt extrusion |
| DSC | Differential scanning calorimetry |
| PXRD | Powder X-ray diffraction |
| TGA | Thermal gravimetric analysis |
| FE-SEM | Fourier emission-scanning electron microscopy |
| ATR-FTIR | Attenuated total reflectance-fourier transforms infrared |
| PM | Physical mixture |
| MDT | Mean dissolution time |
| DE | Dissolution efficiency |
| AIC | Akaike information criterion |
| MSC | Model selection criteria |
| DLS | Dynamic light scattering |
| FaSSIF | Fasted state simulated intestinal fluid |
| FeSSIF | Fed state simulated intestinal fluid |
| Cmax | Maximum plasma concentration |
| AUC | Area under curve |
Supplementary Materials: The supplementary material is available online at https://www.techscience.com/doi/10.32604/jpm.2025.072987/s1.
References
1. Stappaerts J, Geboers S, Snoeys J, Brouwers J, Tack J, Annaert P, et al. Rapid conversion of the ester prodrug abiraterone acetate results in intestinal supersaturation and enhanced absorption of abiraterone: in vitro, rat in situ and human in vivo studies. Eur J Pharm Biopharm. 2015;90(2):1–7. doi:10.1016/j.ejpb.2015.01.001. [Google Scholar] [PubMed] [CrossRef]
2. Acharya M, Bernard A, Gonzalez M, Jiao J, De Vries R, Tran N. Open-label, phase I, pharmacokinetic studies of abiraterone acetate in healthy men. Cancer Chemother Pharmacol. 2012;69(6):1583–90. doi:10.1007/s00280-012-1865-3. [Google Scholar] [PubMed] [CrossRef]
3. Attard G, Reid AHM, Auchus RJ, Hughes BA, Cassidy AM, Thompson E, et al. Clinical and biochemical consequences of CYP17A1 inhibition with abiraterone given with and without exogenous glucocorticoids in castrate men with advanced prostate cancer. J Clin Endocrinol Metab. 2012;97(2):507–16. doi:10.1210/jc.2011-2189. [Google Scholar] [PubMed] [CrossRef]
4. Schultz HB, Meola TR, Thomas N, Prestidge CA. Oral formulation strategies to improve the bioavailability and mitigate the food effect of abiraterone acetate. Int J Pharm. 2020;577:119069. doi:10.1016/j.ijpharm.2020.119069. [Google Scholar] [PubMed] [CrossRef]
5. Solymosi T, Ötvös Z, Angi R, Ordasi B, Jordán T, Semsey S, et al. Development of an abiraterone acetate formulation with improved oral bioavailability guided by absorption modeling based on in vitro dissolution and permeability measurements. Int J Pharm. 2017;532(1):427–34. doi:10.1016/j.ijpharm.2017.09.031. [Google Scholar] [PubMed] [CrossRef]
6. Taheri A, Almasri R, Wignall A, Schultz HB, Elz AS, Ariaee A, et al. Enhancing the pharmacokinetics of abiraterone acetate through lipid-based formulations: addressing solubility and food effect challenges. Drug Deliv Transl Res. 2025;15(11):3770–82. doi:10.1007/s13346-024-01755-y. [Google Scholar] [PubMed] [CrossRef]
7. Lemasson O, Briançon S, Bourgeaux V, Guichard M, Valour JP, Moret GA, et al. Are nanostructured lipid carriers (NLC) better than solid lipid nanoparticles (SLN) for delivering abiraterone acetate through the gastrointestinal tract? Int J Pharm. 2024;667(Pt B):124869. doi:10.1016/j.ijpharm.2024.124869. [Google Scholar] [PubMed] [CrossRef]
8. Chi KN, Spratlin J, Kollmannsberger C, North S, Pankras C, Gonzalez M, et al. Food effects on abiraterone pharmacokinetics in healthy subjects and patients with metastatic castration-resistant prostate cancer. J Clin Pharmacol. 2015;55(12):1406–14. doi:10.1002/jcph.564. [Google Scholar] [PubMed] [CrossRef]
9. Goldwater R, Hussaini A, Bosch B, Nemeth P. Comparison of a novel formulation of abiraterone acetate vs. the originator formulation in healthy male subjects: two randomized, open-label, crossover studies. Clin Pharmacokinet. 2017;56(7):803–13. doi:10.1007/s40262-017-0536-2. [Google Scholar] [PubMed] [CrossRef]
10. Silveira RG, Cunha BN, Tenório JC, Alves de Aguiar DV, da Cruz Souza P, Vaz BG, et al. A simple alternative to prodrug: the hydrochloride salt monohydrate of the prostate anticancer drug abiraterone. J Mol Struct. 2019;1190:165–70. doi:10.1016/j.molstruc.2019.04.068. [Google Scholar] [CrossRef]
11. Gala U, Miller D, Williams RO. Improved dissolution and pharmacokinetics of abiraterone through KinetiSol® enabled amorphous solid dispersions. Pharmaceutics. 2020;12(4):357. doi:10.3390/pharmaceutics12040357. [Google Scholar] [PubMed] [CrossRef]
12. Schönfeld BV, Westedt U, Wagner KG. Compression of amorphous solid dispersions prepared by hot-melt extrusion, spray drying and vacuum drum drying. Int J Pharm X. 2021;3(1):100102. doi:10.1016/j.ijpx.2021.100102. [Google Scholar] [PubMed] [CrossRef]
13. Zhang Q, Zhao Y, Zhao Y, Ding Z, Fan Z, Zhang H, et al. Effect of HPMCAS on recrystallization inhibition of nimodipine solid dispersions prepared by hot-melt extrusion and dissolution enhancement of nimodipine tablets. Colloids Surf B Biointerfaces. 2018;172:118–26. doi:10.1016/j.colsurfb.2018.08.030. [Google Scholar] [PubMed] [CrossRef]
14. Agrawal AM, Dudhedia MS, Zimny E. Hot melt extrusion: development of an amorphous solid dispersion for an insoluble drug from mini-scale to clinical scale. AAPS PharmSciTech. 2016;17(1):133–47. doi:10.1208/s12249-015-0425-7. [Google Scholar] [PubMed] [CrossRef]
15. Zhao Y, Xie X, Zhao Y, Gao Y, Cai C, Zhang Q, et al. Effect of plasticizers on manufacturing ritonavir/copovidone solid dispersions via hot-melt extrusion: preformulation, physicochemical characterization, and pharmacokinetics in rats. Eur J Pharm Sci. 2019;127:60–70. doi:10.1016/j.ejps.2018.10.020. [Google Scholar] [PubMed] [CrossRef]
16. Zarmpi P, Flanagan T, Meehan E, Mann J, Fotaki N. Biopharmaceutical understanding of excipient variability on drug apparent solubility based on drug physicochemical properties. Case study: superdisintegrants. AAPS J. 2020;22(2):46. doi:10.1208/s12248-019-0406-y. [Google Scholar] [PubMed] [CrossRef]
17. Gupta SS, Solanki N, Serajuddin ATM. Investigation of thermal and viscoelastic properties of polymers relevant to hot melt extrusion, IV: affinisolTM HPMC HME polymers. AAPS PharmSciTech. 2016;17(1):148–57. doi:10.1208/s12249-015-0426-6. [Google Scholar] [PubMed] [CrossRef]
18. Wu H, Liu Y, Ci T, Ke X. Application of HPMC HME polymer as hot melt extrusion carrier in carbamazepine solid dispersion. Drug Dev Ind Pharm. 2020;46(12):1911–8. doi:10.1080/03639045.2020.1821045. [Google Scholar] [PubMed] [CrossRef]
19. Svoboda R, Nevyhoštěná M, Macháčková J, Vaculík J, Knotková K, Chromčíková M, et al. Thermal degradation of affinisol HPMC: optimum processing temperatures for hot melt extrusion and 3D printing. Pharm Res. 2023;40(9):2253–68. doi:10.1007/s11095-023-03592-z. [Google Scholar] [PubMed] [CrossRef]
20. Khatri P, Katikaneni P, Desai D, Minko T. Evaluation of Affinisol® HPMC polymers for direct compression process applications. J Drug Deliv Sci Technol. 2018;47:461–7. doi:10.1016/j.jddst.2018.08.018. [Google Scholar] [CrossRef]
21. Brady J, Dürig T, Lee PI, Li JX. Polymer properties and characterization. In: Qiu Y, Chen Y, Zhang GGZ, Yu L, Mantri RV, editors. Developing solid oral dosage forms. 2nd ed. Boston, MA, USA: Academic Press; 2017. p. 181–223. doi:10.1016/B978-0-12-802447-8.00007-8. [Google Scholar] [CrossRef]
22. O’Donnell KP, Hunter Woodward WH. Dielectric spectroscopy for the determination of the glass transition temperature of pharmaceutical solid dispersions. Drug Dev Ind Pharm. 2015;41(6):959–68. doi:10.3109/03639045.2014.919314. [Google Scholar] [PubMed] [CrossRef]
23. Lakshman JP, Cao Y, Kowalski J, Serajuddin ATM. Application of melt extrusion in the development of a physically and chemically stable high-energy amorphous solid dispersion of a poorly water-soluble drug. Mol Pharm. 2008;5(6):994–1002. doi:10.1021/mp8001073. [Google Scholar] [PubMed] [CrossRef]
24. Butreddy A, Sarabu S, Almutairi M, Ajjarapu S, Kolimi P, Bandari S, et al. Hot-melt extruded hydroxypropyl methylcellulose acetate succinate based amorphous solid dispersions: impact of polymeric combinations on supersaturation kinetics and dissolution performance. Int J Pharm. 2022;615:121471. doi:10.1016/j.ijpharm.2022.121471. [Google Scholar] [PubMed] [CrossRef]
25. Choudhari M, Damle S, Saha RN, Dubey SK, Singhvi G. Formulating abiraterone acetate-HPMCAS-based amorphous solid dispersions: insights into in vitro and biorelevant dissolution assessments and pharmacokinetic evaluations. RSC Adv. 2024;14(52):38492–505. doi:10.1039/d4ra08163c. [Google Scholar] [PubMed] [CrossRef]
26. Simões MF, Pereira A, Cardoso S, Cadonau S, Werner K, Pinto RMA, et al. Five-stage approach for a systematic screening and development of etravirine amorphous solid dispersions by hot-melt extrusion. Mol Pharm. 2020;17(2):554–68. doi:10.1021/acs.molpharmaceut.9b00996. [Google Scholar] [PubMed] [CrossRef]
27. Mukesh S, Joshi P, Bansal AK, Kashyap MC, Mandal SK, Sathe V, et al. Amorphous salts solid dispersions of celecoxib: enhanced biopharmaceutical performance and physical stability. Mol Pharm. 2021;18(6):2334–48. doi:10.1021/acs.molpharmaceut.1c00144. [Google Scholar] [PubMed] [CrossRef]
28. Moreira GG, Taveira SF, Martins FT, Wagner KG, Marreto RN. Multivariate analysis of solubility parameters for drug-polymer miscibility assessment in preparing raloxifene hydrochloride amorphous solid dispersions. AAPS PharmSciTech. 2024;25(5):127. doi:10.1208/s12249-024-02844-4. [Google Scholar] [PubMed] [CrossRef]
29. Ehsan I, Shahid M, Natesan S, Faruk A, Sood AK, Khan T. Hansen solubility parameters, computational, and thermodynamic models for tofacitinib citrate solubility in neat mono solvents, and GastroPlus based predicted in vivo performance of subcutaneous solution in humans. AAPS PharmSciTech. 2025;26(3):64. doi:10.1208/s12249-025-03048-0. [Google Scholar] [PubMed] [CrossRef]
30. Nistane J, Chen L, Lee Y, Lively R, Ramprasad R. Estimation of the Flory-Huggins interaction parameter of polymer-solvent mixtures using machine learning. MRS Commun. 2022;12(6):1096–102. doi:10.1557/s43579-022-00237-x. [Google Scholar] [CrossRef]
31. Zhao Y, Inbar P, Chokshi HP, Malick AW, Choi DS. Prediction of the thermal phase diagram of amorphous solid dispersions by Flory–Huggins theory. J Pharm Sci. 2011;100(8):3196–207. doi:10.1002/jps.22541. [Google Scholar] [PubMed] [CrossRef]
32. Wang L, Wu H, Wang Z, Ding Z, Zhao Y, Li S, et al. Effects of hypromellose acetate succinate on recrystallization inhibition, miscibility, and dissolution enhancement of baloxavir marboxil solid dispersions. Int J Biol Macromol. 2024;269(Pt 1):132050. doi:10.1016/j.ijbiomac.2024.132050. [Google Scholar] [PubMed] [CrossRef]
33. Ruchika, Thakur N, Tirpude NV, Saneja A. Development and characterization of α-Lipoic acid amorphous solid dispersion for improved oral bioavailability and modulation of allergic airway inflammation. Colloids Surf B Biointerfaces. 2025;254:114836. doi:10.1016/j.colsurfb.2025.114836. [Google Scholar] [PubMed] [CrossRef]
34. Liu S, Chen H, Zhou F, Tiwari S, Zhuang K, Shan Y, et al. Preparation, characterization and evaluation of nintedanib amorphous solid dispersions with enhanced oral bioavailability. AAPS PharmSciTech. 2024;25(6):183. doi:10.1208/s12249-024-02902-x. [Google Scholar] [PubMed] [CrossRef]
35. Vyas MU, Harte FM. Formation of casein-based triglyceride amorphous solid dispersions. Food Hydrocoll. 2025;163:111066. doi:10.1016/j.foodhyd.2025.111066. [Google Scholar] [CrossRef]
36. Safna Hussan KP, Govindaraj G, Correia NT, Shinyashiki N, Thayyil MS, Babu TD. Molecular dynamics and interactions in amorphous solid dispersion of Erlotinib HCl for improved cancer therapy. J Mol Struct. 2025;1336:142014. doi:10.1016/j.molstruc.2025.142014. [Google Scholar] [CrossRef]
37. Keßler L, Mishra R, Hietala S, Lammens M, Peltonen L, Rades T, et al. Amorphous solid dispersions of amphiphilic polymer excipients and indomethacin prepared by hot melt extrusion. Eur J Pharm Sci. 2025;204:106960. doi:10.1016/j.ejps.2024.106960. [Google Scholar] [PubMed] [CrossRef]
38. Koch N, Bourcy Q, Jennotte O, Chiap P, Lechanteur A, Cardot JM, et al. Selection of in vivo relevant dissolution test parameters for the development of cannabidiol formulations with enhanced oral bioavailability. Pharmaceutics. 2025;17(1):79. doi:10.3390/pharmaceutics17010079. [Google Scholar] [PubMed] [CrossRef]
39. Desai P, Chatterjee B. Comparison of two grafted copolymers, soluplus and kollicoat IR, as solid dispersion carriers of arteether for oral delivery prepared by different solvent-based methods. ACS Omega. 2023;8(48):45337–47. doi:10.1021/acsomega.3c04110. [Google Scholar] [PubMed] [CrossRef]
40. Leon AS, Waterman KC, Wang G, Wang L, Cai T, Zhang X. Accelerated stability modeling of recrystallization from amorphous solid dispersions: a Griseofulvin/HPMC-AS case study. Int J Pharm. 2024;657:124189. doi:10.1016/j.ijpharm.2024.124189. [Google Scholar] [PubMed] [CrossRef]
41. Saha SK, Joshi A, Singh R, Jana S, Dubey K. An investigation into solubility and dissolution improvement of alectinib hydrochloride as a third-generation amorphous solid dispersion. J Drug Deliv Sci Technol. 2023;81:104259. doi:10.1016/j.jddst.2023.104259. [Google Scholar] [CrossRef]
42. Zhang Y, Zhang H, Yu H, Ma Y, Hao C, Lin X, et al. Hot-melt extrusion promotes dissolution, extends spring-parachute process and inhibits crystallization in supersaturating microparticle systems. Particuology. 2023;78:35–48. doi:10.1016/j.partic.2022.09.007. [Google Scholar] [CrossRef]
43. Tekade AR, Yadav JN. A review on solid dispersion and carriers used therein for solubility enhancement of poorly water soluble drugs. Adv Pharm Bull. 2020;10(3):359–69. doi:10.34172/apb.2020.044. [Google Scholar] [PubMed] [CrossRef]
44. Punitha S, Uvarani R, Panneerselvam A. Effect of pH in aqueous (Hydroxy Propyl Methyl Cellulose) polymer solution. Results Mater. 2020;7:100120. doi:10.1016/j.rinma.2020.100120. [Google Scholar] [CrossRef]
45. Singhvi G, Shah A, Yadav N, Saha RN. Study the effect of formulation variables on drug release from hydrophilic matrix tablets of milnacipran and prediction of in-vivo plasma profile. Pharm Dev Technol. 2014;19(6):708–16. doi:10.3109/10837450.2013.823993. [Google Scholar] [PubMed] [CrossRef]
46. Riethorst D, Mols R, Duchateau G, Tack J, Brouwers J, Augustijns P. Characterization of human duodenal fluids in fasted and fed state conditions. J Pharm Sci. 2016;105(2):673–81. doi:10.1002/jps.24603. [Google Scholar] [PubMed] [CrossRef]
47. Mason LM, Campiñez MD, Pygall SR, Burley JC, Gupta P, Storey DE, et al. The influence of polymer content on early gel-layer formation in HPMC matrices: the use of CLSM visualisation to identify the percolation threshold. Eur J Pharm Biopharm. 2015;94:485–92. doi:10.1016/j.ejpb.2015.06.019. [Google Scholar] [PubMed] [CrossRef]
48. Perez-Robles S, Carotenuto C, Minale M. HPMC hydrogel formation mechanisms unveiled by the evaluation of the activation energy. Polymers. 2022;14(3):635. doi:10.3390/polym14030635. [Google Scholar] [PubMed] [CrossRef]
Cite This Article
 Copyright © 2025 The Author(s). Published by Tech Science Press.
This work is licensed under a Creative Commons Attribution 4.0 International License , which permits unrestricted use, distribution, and reproduction in any medium, provided the original work is properly cited.
 Downloads
 Citation Tools