
 Submit a Paper
 Propose a Special lssue
 Open Access
ARTICLE
Reversible Data Hiding with Contrast Enhancement Using Bi-histogram Shifting and Image Adjustment for Color Images
1 Engineering Research Center of Digital Forensics, Ministry of Education, Nanjing University of Information Science & Technology, Nanjing, 210044, China
2 School of Computer and Software, Nanjing University of Information Science & Technology, Nanjing, 210044, China
* Corresponding Author: Lord Amoah. Email:
Journal of Quantum Computing 2022, 4(3), 183-197. https://doi.org/10.32604/jqc.2022.039913
Received 24 February 2023; Accepted 07 April 2023; Issue published 03 July 2023
 View Full Text
 Download PDF
Abstract
Prior versions of reversible data hiding with contrast enhancement (RDHCE) algorithms strongly focused on enhancing the contrast of grayscale images. However, RDHCE has recently witnessed a rise in contrast enhancement algorithms concentrating on color images. This paper implies a method for color images that uses the RGB (red, green, and blue) color model and is based on bi-histogram shifting and image adjustment. Bi-histogram shifting is used to embed data and image adjustment to achieve contrast enhancement by adjusting the images resulting from each channel of the color images before combining them to generate the final enhanced image. Images are first divided into three channels—R, G, and B—and the Max, Med, and Min channels are then determined from these. Before histogram shifting, some calculations are done to determine how many iterations there will be for each channel. The images are adjusted to improve visual quality in the enhanced images after data has been embedded in each channel. The experimental results show that the enhanced images produced by the proposed method are qualitatively and aesthetically superior to those produced by some earlier methods, and their quality was assessed using PSNR, SSIM, RCE, RMBE, and CIEDE2000. The embedding rate obtained by the suggested method is acceptable.Keywords
With the current advancement in multimedia, conventional artwork and printed works are converted into digital images. Images are frequently distorted as a result of the acquisition, processing, transmission, and storage processes, which lowers the overall clarity and quality of the images. In recent years, several contrast enhancement (CE) methods have been proposed in [1–4] to improve the visual quality of images. Data hiding methods have also been introduced to perform CE while embedding data into images. Reference [5–13] propose data-hiding methods that aim to improve image quality while ensuring data exclusivity and integrity. However, data embedding methods embed data permanently without allowing recovery of the original images. Reversible data hiding (RDH) methods with CE were proposed to enhance image contrast simultaneously and perform data embedding while recovering original images losslessly. Lossless compression [14,15], difference expansion (DE) [12,13], histogram shifting (HS) [16,17], and prediction error expansion (PEE) [18,19] are the four main types of frequently used methods for which RDH is best known. RDH with image contrast enhancement, in contrast to traditional image processing techniques, achieves histogram equalization (HE) during the data embedding process while still allowing for the recovery of hidden data after embedding. Enhancing an image’s contrast has been made easier with the help of histogram equalization (HE) [20]. It allows an adjustment of the image intensity to enhance contrast by allocating the intensity values of pixels in the input image so that the output image contains a uniform distribution of intensities while improving contrast. Global histogram equalization, local histogram equalization, or fast quadratic dynamic histogram equalization are used to equalize histograms based on the execution time [21]. Traditional CE with RDH methods primarily focus on grayscale images. For color images, RDH with CE algorithms is comparatively uncommon. Taking a standard RGB image as an example, it has three color dimensions R, G and B. It contains more information than grayscale images, making modifying it more troublesome. The traditional RDH algorithm can be applied in each dimension of the RGB image. Due to the large correlation between the three-dimensional matrices of the color image, making completely irrelevant modifications to the three dimensions will distort the color of the image, resulting in a decrease in image quality. In this study, we propose a new RDH with contrast enhancement for color images ensuring the image’s visual quality with high embedding capacity.
Every reversible data-hiding algorithm aims to satisfy two key requirements: an increase in embedding capacity and preserving all image details. Many RDH with contrast enhancement techniques have been adopted to meet the requirements, including improving the enhancement effect, observing it, and finding the enhancement and its use as a development of medical imaging. Wu et al. [22] were the first to propose an RDH with contrast enhancement. Histogram equalization is accomplished by repeatedly shifting the histogram. However, as the number of repeats rises, more bins are combined, increasing repetitions, resulting in an artefact known as an intensity mismatch. This artefact is typically only noticeable with a significant amount of histogram shifting, but it can be seen with just a few repetitions for some particular images. In conclusion, the approach necessitates a pre-processing step that yields intensity mismatched artefacts, and the ideal number of histogram shifting repeats cannot be established. In 2017, A high-capacity RDH algorithm for contrast enhancement of medical images based on regions of interest (ROI) was proposed by Yang et al. [23]. This algorithm first used an “adaptive threshold detector” (ATD) segmentation algorithm to automatically separate the ROI from the “region of non-interest” (NROI), then enhanced the contrast of the ROI by stretching the grayscale, and finally embedded the data into the bins of the stretched histogram. Finally, the remaining substantial amount of data will be incorporated into the NROI, quality or not. The first reversible data hiding with automatic contrast enhancement was proposed by Kim et al. [24] for Automatic Image Enhancement (AIE). The method shows that a contrast enhancement based on reversible data hiding offers file-saving functionality for automatic image enhancement because the original image can be restored right away from the enhanced image. While simultaneously creating a location map, it employs unidirectional histogram shifting repeatedly. In contrast to Wu et al. [25], Kim et al. [24] stretched the distortion across the entire pixel range, which localized the distortion by combining the bins near the boundary bins. To maximize the effect of histogram equalization per the image’s content, the number of repetitions is not manually specified; instead, it is adaptively chosen. This yield results comparable to global histogram equalization techniques, which are useful for enhancing low-contrast images but are not always appropriate for everyday usage since they may overly increase contrast. Gao et al. [26] proposed a controlled contrast enhancement approach for enhanced visual quality.
Data hiding in the spatial domain and the integer wavelet transform (IWT) domain are two separate stages that make up the data hiding technique. To prevent excessive contrast enhancement, the Relative Contrast Error (RCE) is used to restrict the number of embedding rounds. An appropriate RCE threshold is given to obtain a satisfactory contrast stretch upper boundary. The original contrast is slightly increased throughout the data-concealing process. Chen et al. [27] proposed an RDH using a contrast enhancement approach called PAB. There are two steps to the data embedding process: the histogram shifting stage and the pixel value ordering (PVO) stage. The histogram is automatically shifted as a result of the histogram distribution, which is adaptive so that the designated gravity center is close to the middle of the intensities after embedding. Then, by limiting the range of pixel change, bidirectional histogram pre-shifting is used to reduce visual distortion. Utilizing the Pixel Value Ordering (PVO) approach at the initial step of contrast enhancement increases the embedding capability even further. Gao et al. [28] proposed an automatic contrast enhancement method utilizing bi-histogram shifting. Exploiting the brightness preservation (BP) method, the proposed scheme adaptively selects two peak bins and two lower bins based on four conditions based on the image brightness. The lower bins are combined, while the two peak bins are used for splitting and embedding. The proposed method’s results reveal high embedding capacity and sufficient contrast enhancement.
Although several lossless CE methods have been proposed for grayscale images, only a few apply to color images. Nowadays, color images are popularly used and transmitted because a color image is a powerful visual descriptor and contains more information than a grayscale image [22]. Kim et al. [29] proposed Uniform contrast enhancement (UCE) of RGB channels. The proposed method consistently applies CE methods to each RGB channel. Then it combines them to generate the marked color image instead of directly applying CE methods to the color images. The proposed method selects the smallest maximum number of iterations among the three channels to be the number of repetitions applied to all the channels. The RGB channels are subject to an equal number of iterations. When additional histogram bins are modified, this approach produces visual distortions in images while preventing over-enhancement in one or two channels. A new RDH-based contrast enhancement employing the HSV (hue, saturation, and value) color model was proposed by Wu et al. [22]. The proposed method converts the RGB channels to Max, Median, and Min channels based on numerical values of red, green, and blue colors. Using a lossless contrast enhancement technique described in [30], the Max channel is improved while the Median and Min channels are changed to maintain their ratios.
The proposed strategy preserves the hue and saturation (hue and saturation preserving, HSP) components while retrieving the original image, preventing color distortions. Although the image quality is enhanced, this method limits embedding capacity. Amoah et al. [31] proposed a new UCE for color images. The proposed method consistently uses bi-histogram shifting, explained in [28], to improve the contrast in each channel of the RGB image before combining them to build the marked color image. The bi-histogram shifting procedure is repeated using the smallest possible repeats among the three channels. Although compared with the first UCE, the resulting image appears better enhanced, the visual quality of the resulting image remains poor. A new RDH with contrast enhancement for color images is proposed in this study to increase the size of embedding capacity while achieving the best contrast enhancement.
2.1 Uniform Contrast Enhancement (UCE)
Uniform contrast enhancement (UCE) is a method proposed by Kim et al. [29]. First, the proposed method separates a color image into three channels, red, green, and blue (RGB), and assigns an equivalent number of histogram shifting iterations on each channel. The potential maximum number of repetitions of all the channels is first calculated, and the minimum between the number of repetitions of all channels is used for histogram shifting, data embedding, and contrast enhancement.
where
Before each histogram shifting, a vector
Different from other RDH algorithms, this algorithm requires that the difference between the brightness of the enhanced image and the brightness of the original image is not greater than 1, and the brightness of the defined image is the mean value of all pixels in the image. When the brightness of the original image is greater than the brightness of the enhanced image, RHS is applied, In addition to apply LHS.
2.2 Hue Saturation Preservation (HSP)
Wu et al. [22] proposed an HSP technique based on finding the maximum, median, and minimum values among the RGB image’s three channels. Then, the histograms of the three are combined. The original image is next converted to HSV. How the conversion is done is demonstrated in the following equations.
where
HSP applies pre-processing to avoid histogram overflow during data embedding. First, move all empty histogram bins of the
During embedding, two bins
where
An automatic contrast enhancement (ACE) approach for color images using the RGB (red, green, and blue) color model is proposed in this study. In contrast to methods employed in [31] which applied an equalized number of repetitions on all channels of the RGB image to enhance the image and embed data, a non-equalized number of repetitions is applied, and each channel is adjusted after embedding secret bits to provide good image quality. Maximum (Max), Median (Med), and Minimum (Min) channels are the categories used to categorize the channels of the image to achieve different numbers of repetitions. Every dimension of a color image, a three-dimensional matrix, is a channel, either R, G, or B, which might be Max, Med or Min based on image structure. Hence, we focus on determining which channel is Max, Med or Min by summing each channel’s pixel values and comparing each summation result. Afterwards, we find the potential number of iterations for each channel.
Three cases are defined with sub-cases by exploiting the Max Channel to determine the number of repetitions applied for each channel while embedding secret bits.
Case 1: If R is max, we maintain all possible repetition numbers for R and Min channels to embed data. Then a comparison is made between the other two channels to find the Med and Min. The ratio between the Max and Med Channels is first calculated, then the number of iterations for the Med channel. Eqs. (7) and (8) demonstrate how to calculate the ratio, and the number of repetitions in case G is the Med channel, and B is the Min channel:
where
where
Case 2: The same steps are exploited as in Case 1 if G is Max. As a result, the G channel and B channel will maintain the potential number of iterations if the B channel is Min, and only the one of R will change by using the Eqs. (11) and (12)
where
Case 3: If B is Max, the same process is applied as in case 1. Hence, if R is the Med channel and G is the Min channel, the B channel and G channel will keep the previously obtained number of repetitions, and only one of R will change by applying the Eqs. (15) and (16)
where
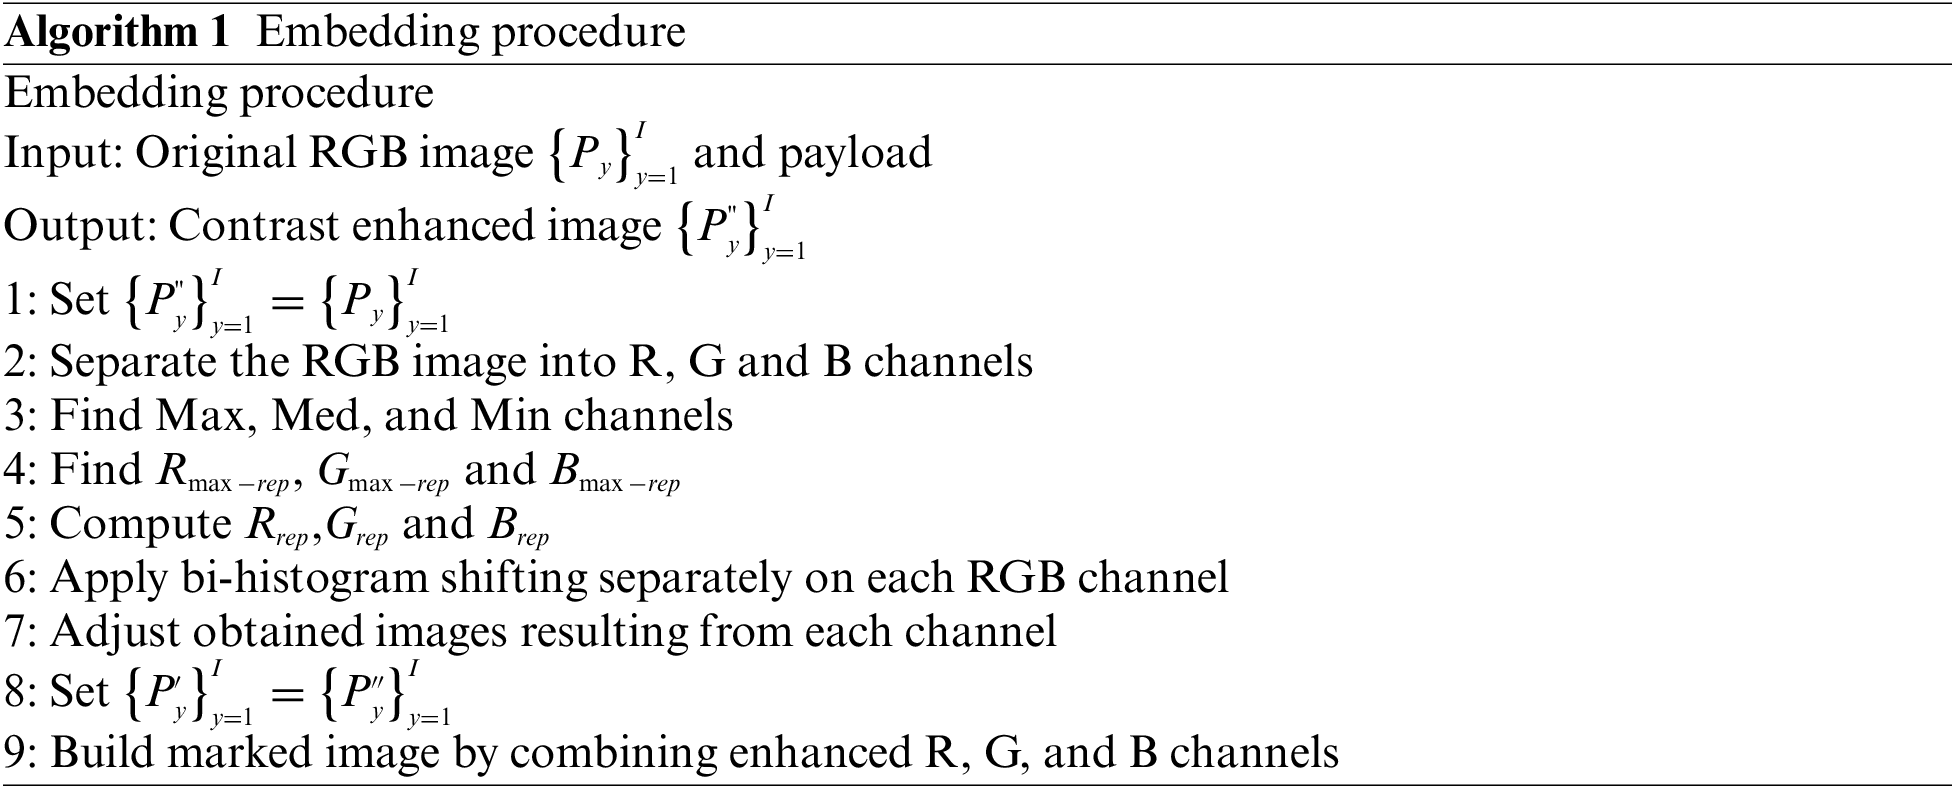
With the exception of utilizing a different number of repetitions for the Median Channel, we apply the strategy in [31] employed to embed secret bits. The following algorithm reveals the description of the embedding process.
When hidden data is processed, bits are embedded in all channels, and most pixel values appear to be either extremely low or extremely high, which causes distortions in the image. The proposed method gives out a solution by adjusting the image with no loss of data embedded. The first step to adjusting an image consists of extracting channels of the original image. Secondly, each pixel of the original channel is added to the corresponding pixel of the enhanced channel, then we round the result divided by 2 to have a coefficient used to obtain the adjusted pixel. Let’s consider
where
where
3.4 Data Extraction and Image Recovery
The proposed method, as aforementioned, carries out data embedding, contrast enhancement, and the opposite process, which entails data extraction and image recovery. The original image is an additional tool in the proposed method’s data extraction and image recovery processes. The adjusted enhanced image is first divided into three channels. To acquire the coefficient taken from the LSB of the adjusted pixels, each channel’s composing pixel is compared to the original channel pixel. The improved pixel with embedded data is then obtained. The original image is restored following data extraction using the methods described in [31]. To illustrate the data extraction and image recovery workflow, an illustration is proposed. Let’s consider
4 Experimental Results and Analysis
Random images of sizes 512 × 512 and 768 × 512 issued from the USC image set, Kodak Lossless True Color Image Suite image set, and other image sets, respectively, are used to assess the efficiency of the proposed method. In this experiment, a fair comparison with the method proposed in [29,31] and [32] is established by utilizing the same amount of data to be embedded.
The effectiveness of the proposed method will be assessed and compared using metrics classified in subsections as follow:
1. The first subsection establishes a comparative analysis of the contrast enhancement between the proposed method and prior methods using the relative contrast error (RCE) as a comparison metric.
2. The second subsection reveals the image quality of the proposed method and methods in [29,31], and [32] by using metrics such as peak signal-to-noise ratio (PSNR), Structural similarity index (SSIM), relative mean brightness error (RMBE) of the different methods.
3. The third subsection analyses the color difference.
In the last subsection, the embedding capacity of the various methods are compared.
The relative contrast error (RCE) computed between the original and enhanced image is used to assess the CE effect. RCE = 0.5 means the image contrast is unchanged, whereas RCE > 0.5000 denotes improved image contrast. In Table 1, the RCE resulting from all the methods applied in the Kodak Lossless True Color Image Suite Image set is greater than 0.5000. This means that the proposed method can perform contrast enhancement. In Table 2, the RCE of the images from USC image set are less than 0.5000 when applying methods using HSP based algorithm. However, the proposed method in all images of the USC image set outperformed in contrast enhancement. As a result, Table 4 displaying the average result of RCE and other metrics of performance reveals that the proposed method keeps the RCE greater than 0.5000 showing how it performs better contrast enhancement than some existing methods.
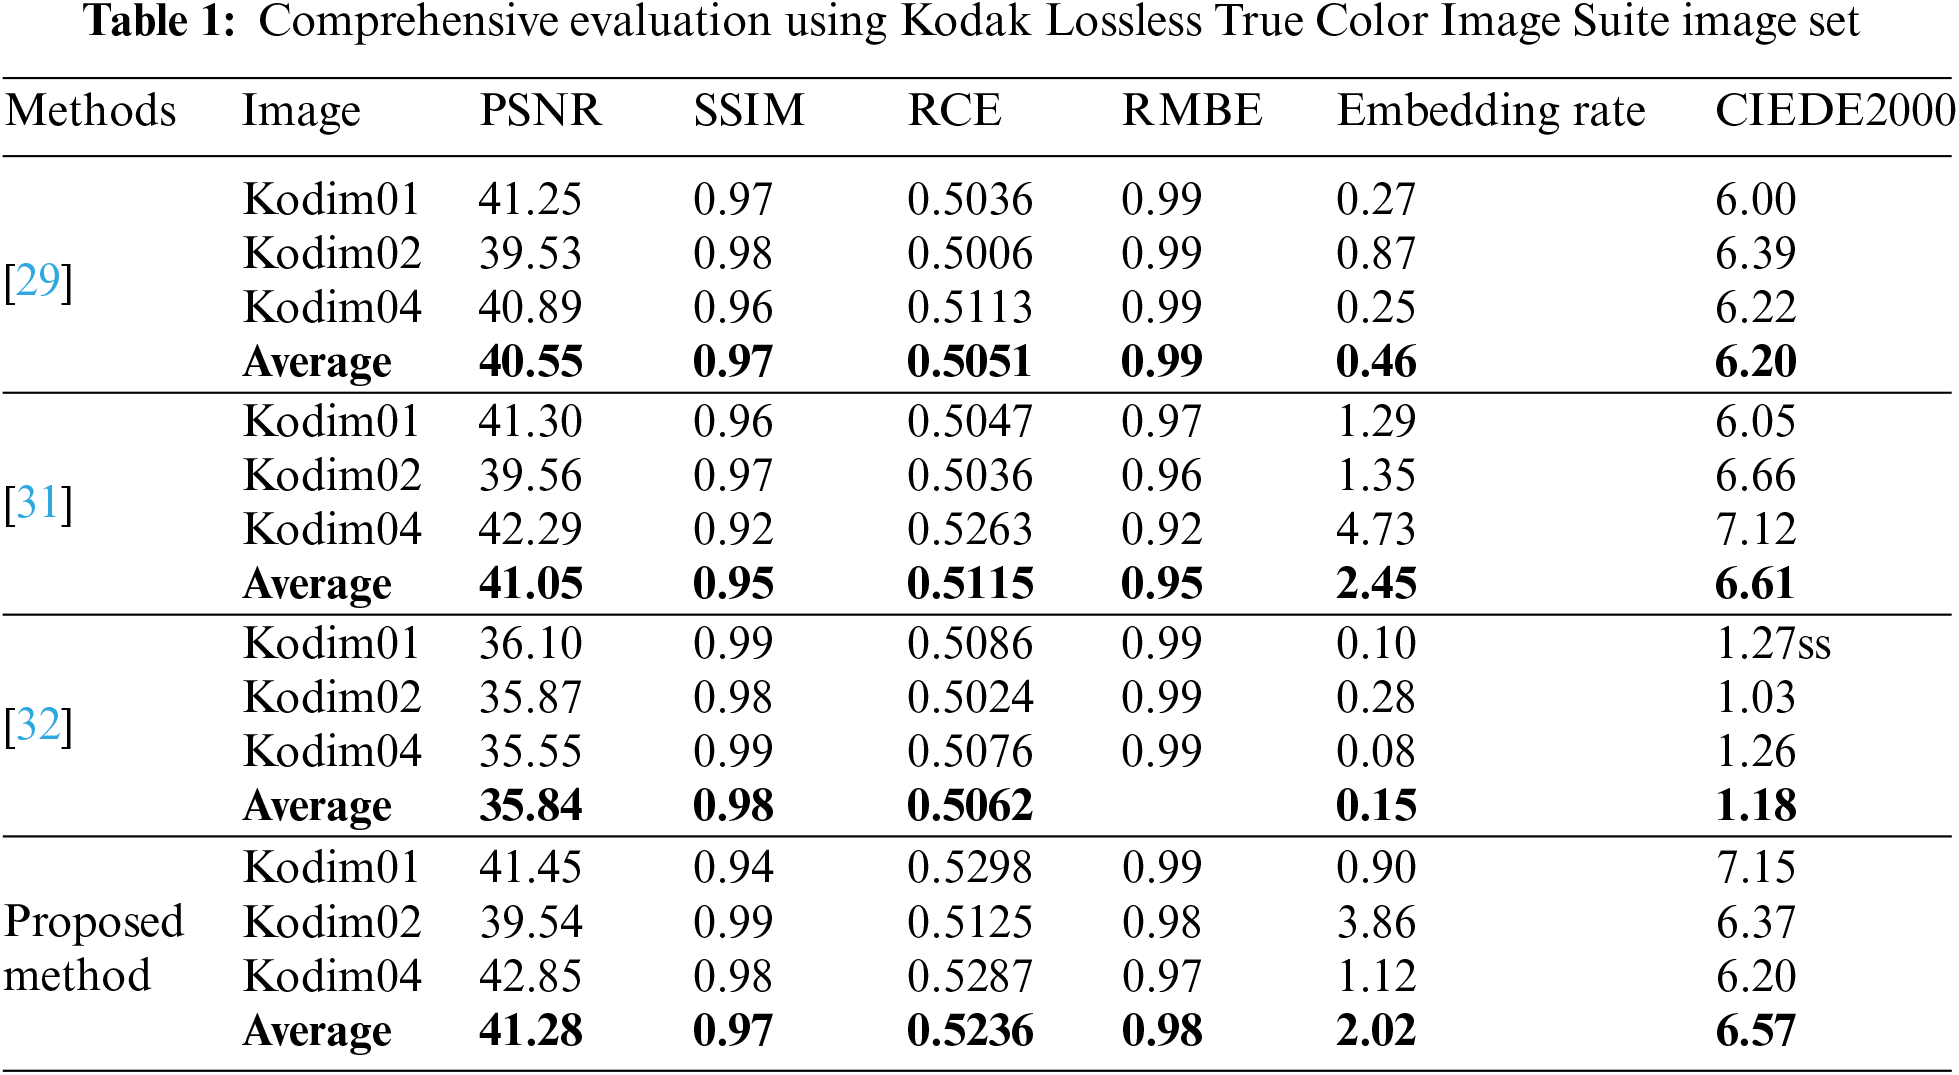
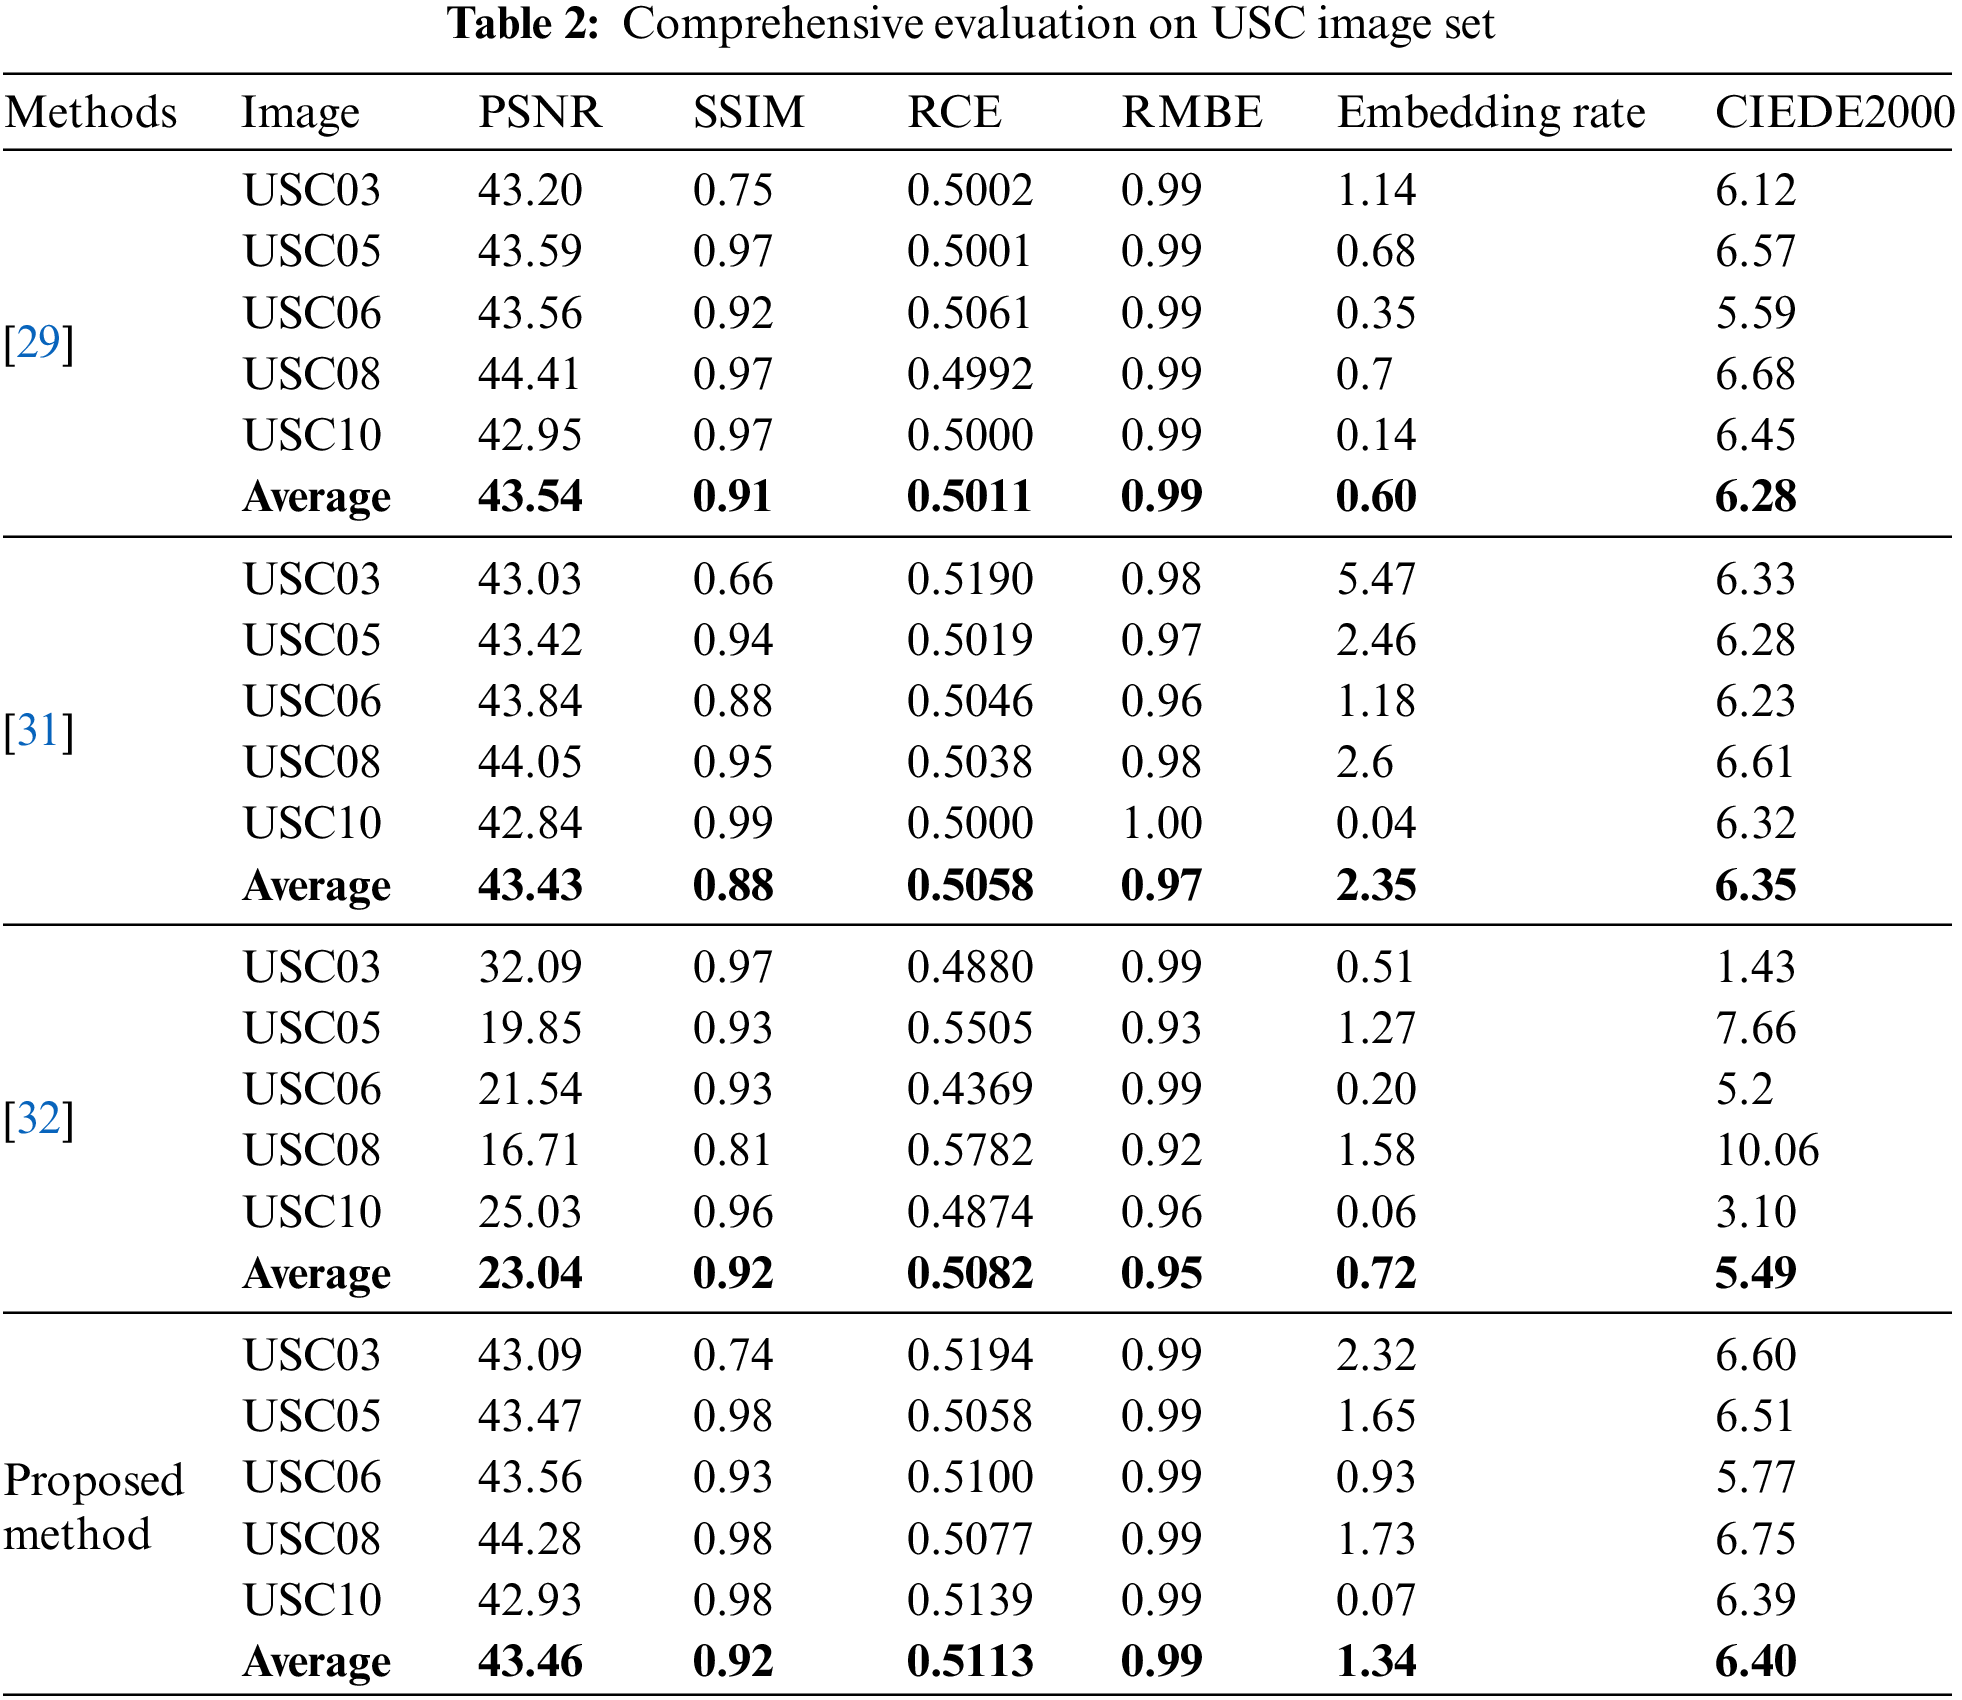
The effectiveness of the image quality is assessed by employing metrics such as Peaked Signal-to-Noise Ratio (PSNR), Structural Similarity index (SSIM) and Relative Mean Brightness Error (RMBE). The PSNR ratio measures the strength of a signal in relation to its noise power. In addition, a higher PSNR indicates less noise added to the original image. SSIM calculates the similarities between the original and enhanced images and gives values from 0 to 1, with 1 indicating that the images are identical. RMBE calculates the difference in average brightness between the original and improved images. Tables 1, 2 and 3 show the numerical results of PSNR, SSIM and RMBE. The proposed method achieves a higher average PSNR and SSIM values in all the images than other methods. Figs. 1 and 2 display the enhanced images using different methods.
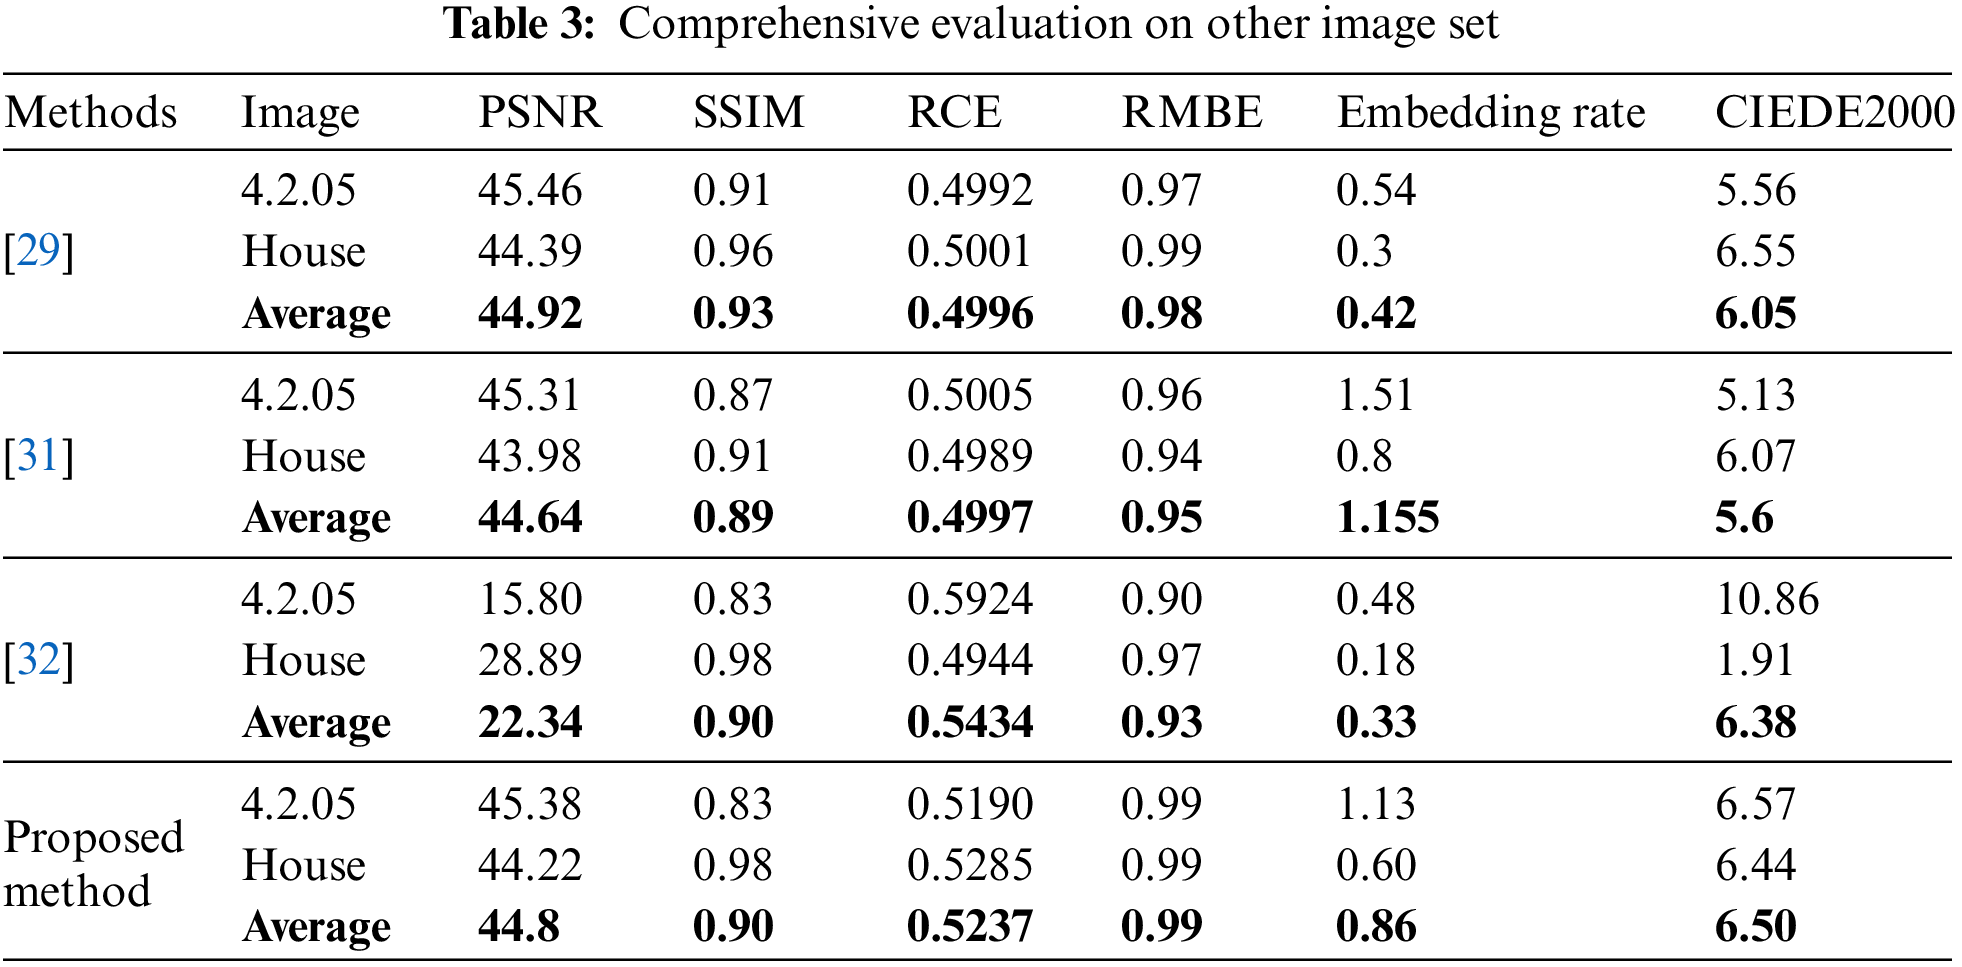
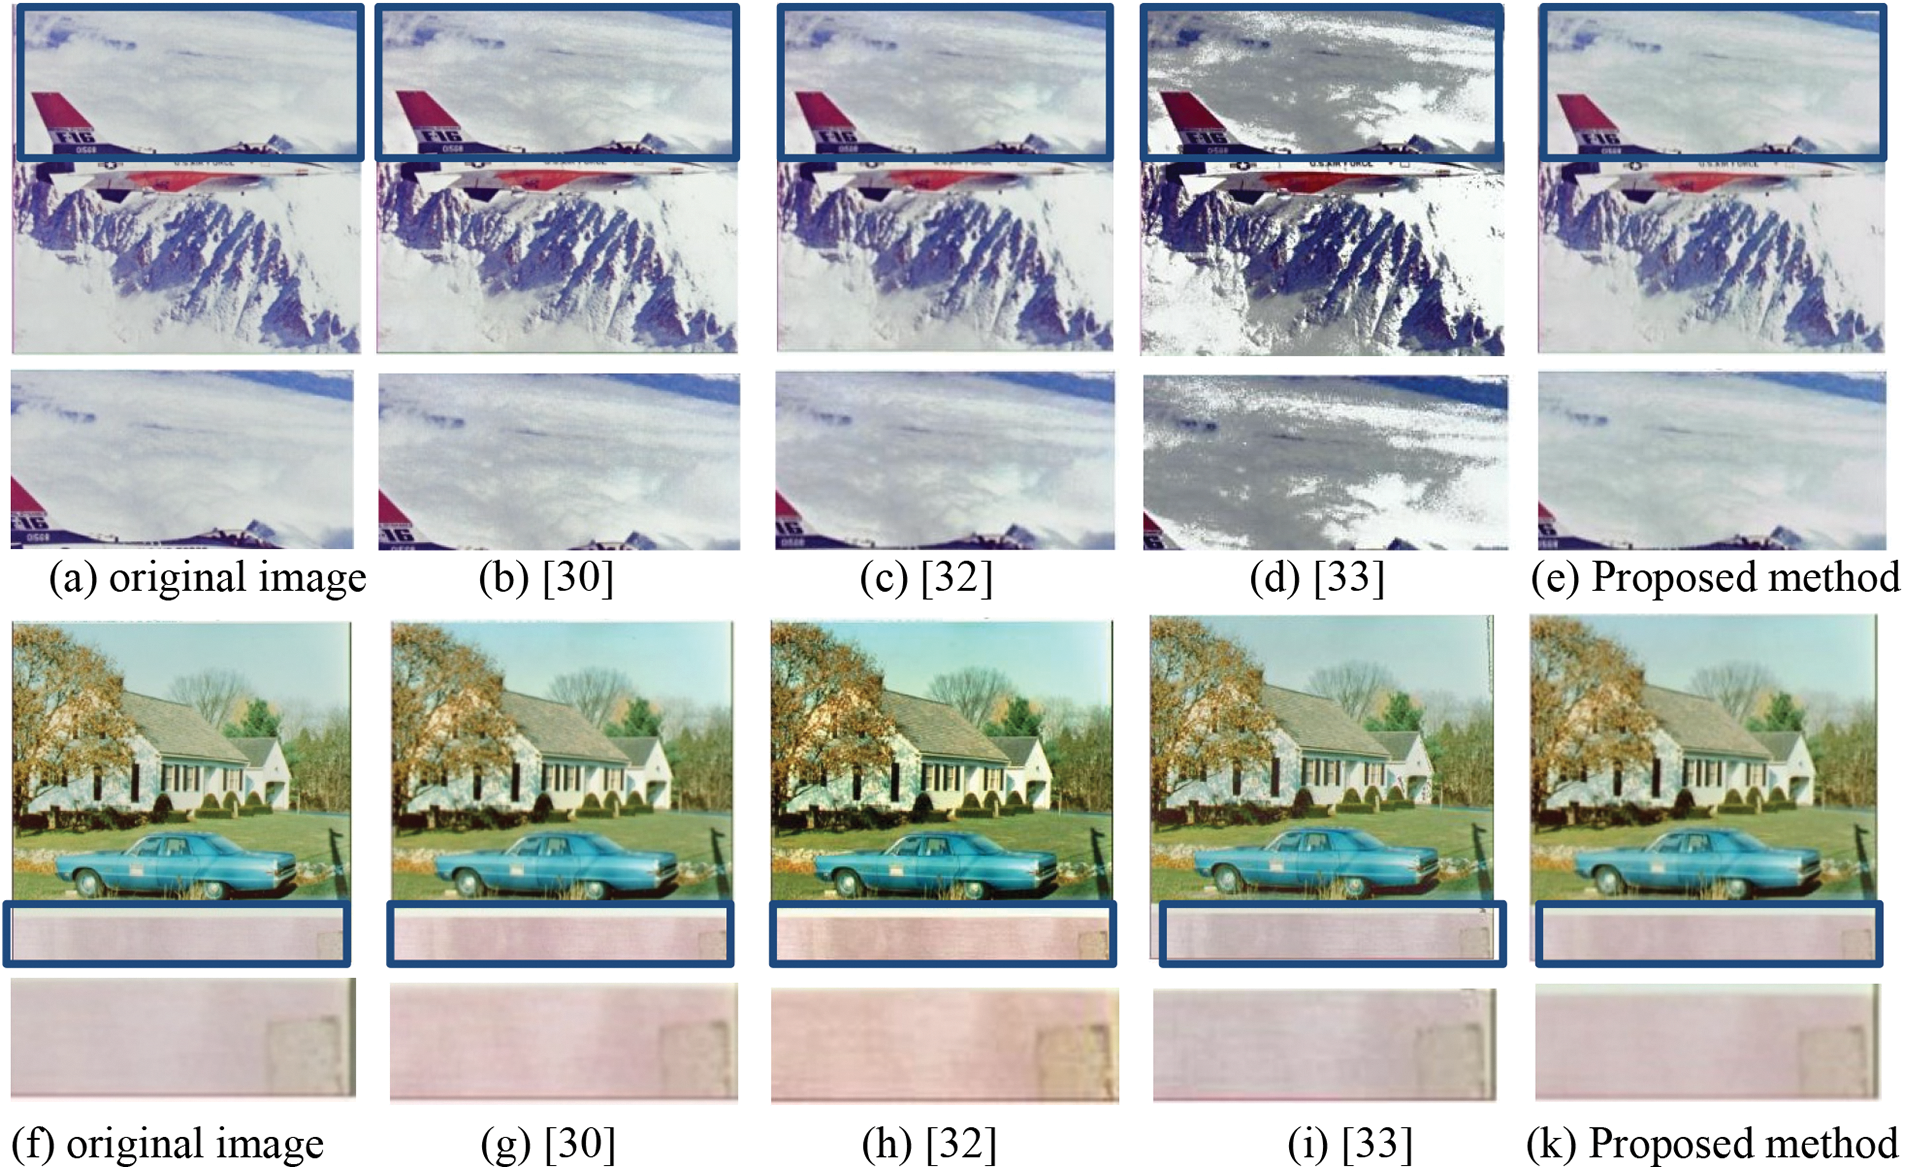
Figure 1: Images 4.2.05 and house enhanced by the proposed method and different prior methods
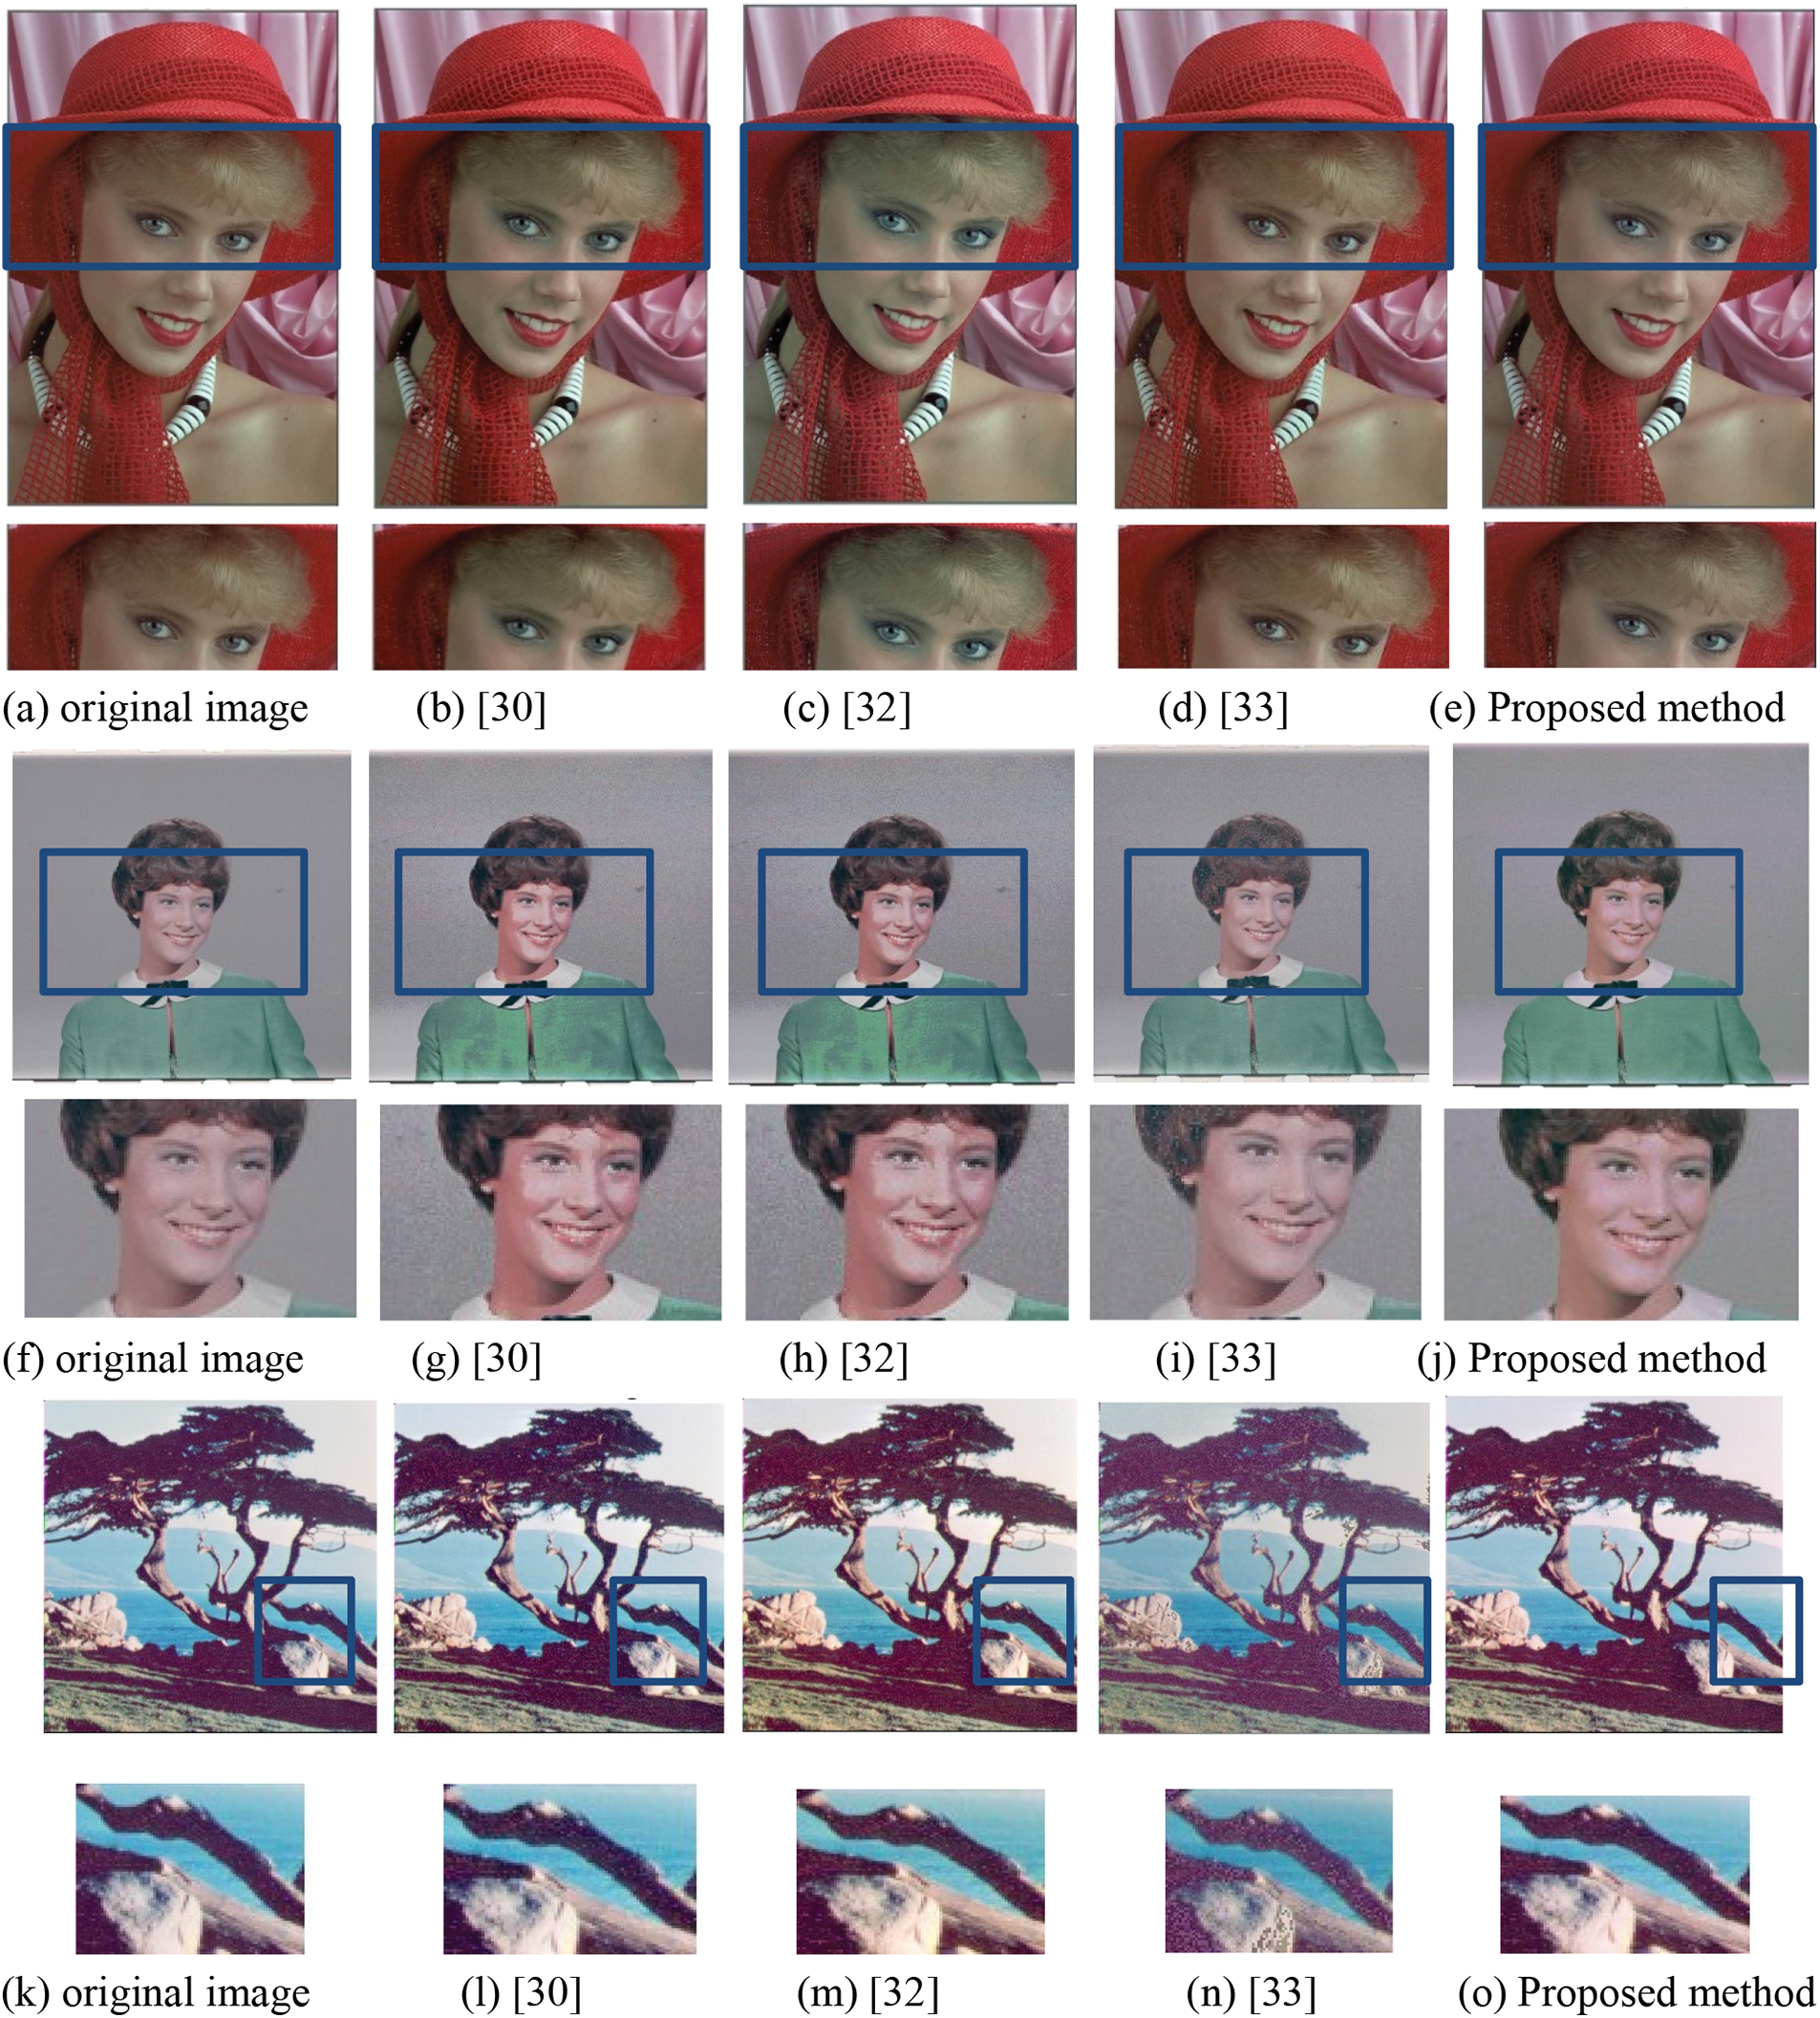
Figure 2: kodim04, USC03 and USC06 from Kodak Suit and USC image sets enhanced by the proposed method and different prior methods
The selected area in blue on Figs. 1, and 2 are displayed separately from the enhanced images. This shows the physical difference between the proposed and earlier methods acquired visual quality. In comparison to the clouds from the image enhanced by previous methods, the clouds in the selected area obtained by the enhancement of 4.2.05 by the proposed method are whiter and brighter. Meanwhile, some methods change the color of clouds to a deep gray. The wall on the image of the house, which was enhanced by UCE and bi-histogram shifting, has a somewhat incorrect yellow tint, while the propose method enhances the white on the wall. The black circle around the eyes is darker and looks greener on Kodim04, enhanced in Figs. 1b–1d. While using [32] and the proposed method, there is no visible greener appearance, however, kodim04 is greatly enhanced. When enhancing USC03, more extra distortions are added to the image, giving it a 3D appearance.
The enhanced USC03 in Fig. 2i resembles the original image, demonstrating that no contrast enhancement was performed. The color of the background in the last displayed image was altered during data embedding, but the proposed method makes the tree appear much more realistic. The proposed method successfully produces contrast enhancement for color images of all the image sets. Table 4 summarizes the average result of metrics of performance used to assess the proposed method image quality.
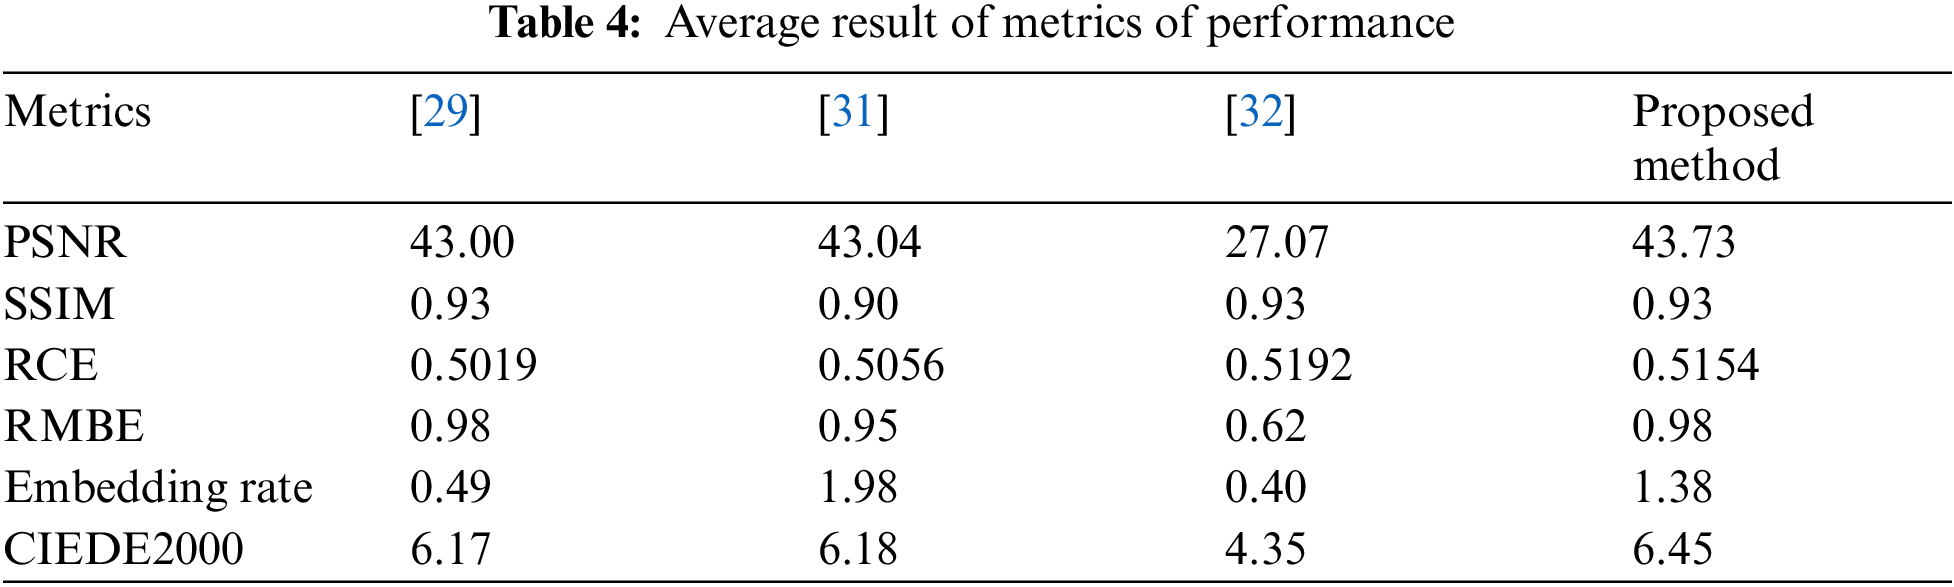
The CIEDE2000 is frequently used to access color preservation and color distortion. The value is anticipated to be as low as possible to prevent color distortion. However, if the CIEDE2000 value is 0, the original image and the enhanced are the same. Table 4 shows the overall CIEDE2000 outcome. The proposed approach fails in maintaining color. But compared to other methods, Tables 1, 2 and 3 reveal that colors of some images have been successfully maintained by the proposed method after enhancement.
UCE as well as the method in [31] used to make a comparative analysis with the proposed method embeds data by repeating the histogram shifting. All the methods are given the same number of repetitions of 40, and then the proposed method applies changes based on its algorithm. To make fair the comparison with the method in [32], the same amount of data is given to all the images to embed and complete the analysis of the embedding rate. The column title embedding rate in different tables reveals the proposed method’s embedding performance and prior ones. The overall results reveal that the method in [31] embeds more data than the other methods. However, the proposed method does not rank last in the embedding rate. Hence the embedding rate of the proposed method can be considered reasonable.
In this study, a novel reversible data hiding strategy for color images was presented. This scheme applies the bi-histogram shifting to embed data and adjusts the image to improve contrast. The original image is initially split into three channels using the RGB color model to identify the Max, Med, and Min channels. Before applying bi-histogram shifting, the Max channel conditions the number of iterations. After data are embedded in channels, the resulting images are adjusted to produce the marked image with better visual quality and high embedding capacity. When evaluated using PSNR, SSIM, RCE, RMBE, and CIEDE2000, the experimental results demonstrate that the enhanced images produced by the proposed method are qualitatively and aesthetically superior to those produced by several prior methods. The embedding rate attained using the advised method is suitable.
Acknowledgement: The editors and anonymous reviewers are both acknowledged by the writers for their valuable comments.
Funding Statement: This work was supported in part by the National Natural Science Foundation of China under Grant No. 61662039, in part by the Jiangxi Key Natural Science Foundation under No. 20192ACBL20031, in part by the Startup Foundation for Introducing Talent of Nanjing University of Information Science and Technology (NUIST) under Grant No. 2019r070, and in part by the Priority Academic Program Development of Jiangsu Higher Education Institutions (PAPD) Fund.
Conflicts of Interest: The authors declare that they have no conflicts of interest to report regarding the present study.
References
1. J. A. Stark, “Adaptive image contrast enhancement using generalizations of histogram equalization,” IEEE Transactions on Image Processing, vol. 9, no. 5, pp. 889–896, 2000. [Google Scholar] [PubMed]
2. Z. Ying, G. Li, Y. Ren, R. Wang and W. Wang, “A new image contrast enhancement algorithm using exposure fusion framework,” in Int. Conf. on Computer Analysis of Images and Patterns, Ystad, Sweden, pp. 36–46, 2017. [Google Scholar]
3. M. Kanmani and V. Narsimhan, “An image contrast enhancement algorithm for grayscale images using particle swarm optimization,” Multimedia Tools and Applications, vol. 77, no. 18, pp. 23371–23387, 2018. [Google Scholar]
4. S. -C. Huang, F. -C. Cheng and Y. -S. Chiu, “Efficient contrast enhancement using adaptive gamma correction with weighting distribution,” IEEE Transactions on Image Processing, vol. 22, no. 3, pp. 1032–1041, 2012. [Google Scholar] [PubMed]
5. L. Luo, Z. Chen, M. Chen, X. Zeng and Z. Xiong, “Reversible image watermarking using interpolation technique,” IEEE Transactions on Information Forensics and Security, vol. 5, no. 1, pp. 187–193, 2009. [Google Scholar]
6. C. Qin and Y. -C. Hu, “Reversible data hiding in VQ index table with lossless coding and adaptive switching mechanism,” Signal Processing, vol. 129, no. 2, pp. 48–55, 2016. [Google Scholar]
7. W. Zhang, X. Hu, X. Li and N. Yu, “Recursive histogram modification: Establishing equivalency between reversible data hiding and lossless data compression,” IEEE Transactions on Image Processing, vol. 22, no. 7, pp. 2775–2785, 2013. [Google Scholar] [PubMed]
8. C. Qin, C. -C. Chang and T. -J. Hsu, “Reversible data hiding scheme based on exploiting modification direction with two steganographic images,” Multimedia Tools and Applications, vol. 74, no. 15, pp. 5861–5872, 2015. [Google Scholar]
9. Y. Hu, H. -K. Lee and J. Li, “DE-based reversible data hiding with improved overflow location map,” IEEE Transactions on Circuits and Systems for Video Technology, vol. 19, no. 2, pp. 250–260, 2008. [Google Scholar]
10. X. Li, B. Yang and T. Zeng, “Efficient reversible watermarking based on adaptive prediction-error expansion and pixel selection,” IEEE Transactions on Image Processing, vol. 20, no. 12, pp. 3524–3533, 2011. [Google Scholar] [PubMed]
11. D. M. Thodi and J. J. Rodriguez, “Prediction-error based reversible watermarking,” 2004 International Conference on Image Processing, 2004. ICIP’04, vol. 3, pp. 1549–1552, 2004. [Google Scholar]
12. D. M. Thodi and J. J. Rodríguez, “Expansion embedding techniques for reversible watermarking,” IEEE Transactions on Image Processing, vol. 16, no. 3, pp. 721–730, 2007. [Google Scholar] [PubMed]
13. C. -C. Chang and T. -C. Lu, “A difference expansion oriented data hiding scheme for restoring the original host images,” Journal of Systems and Software, vol. 79, no. 12, pp. 1754–1766, 2006. [Google Scholar]
14. J. Fridrich, M. Goljan and R. Du, “Lossless data embedding—new paradigm in digital watermarking,” EURASIP J. Adv. Signal Process, vol. 2022, no. 2, pp. 1–12, 2002. [Google Scholar]
15. M. U. Celik, G. Sharma, A. M. Tekalp and E. Saber, “Lossless generalized-LSB data embedding,” IEEE Transactions on Image Processing, vol. 14, no. 2, pp. 253–266, 2005. [Google Scholar] [PubMed]
16. L. -C. Huang, L. -Y. Tseng and M. -S. Hwang, “A reversible data hiding method by histogram shifting in high quality medical images,” Journal of Systems and Software, vol. 86, no. 3, pp. 716–727, 2013. [Google Scholar]
17. X. Li, B. Li, B. Yang and T. Zeng, “General framework to histogram-shifting-based reversible data hiding,” IEEE Transactions on Image Processing, vol. 22, no. 6, pp. 2181–2191, 2013. [Google Scholar] [PubMed]
18. J. Li, X. Li and B. Yang, “Reversible data hiding scheme for color image based on prediction-error expansion and cross-channel correlation,” Signal Processing, vol. 93, no. 9, pp. 2748–2758, 2013. [Google Scholar]
19. W. He, K. Zhou, J. Cai, L. Wang and G. Xiong, “Reversible data hiding using multi-pass pixel value ordering and prediction-error expansion,” J. Vis. Commun Image Represent, vol. 49, no. 6, pp. 351–360, 2017. [Google Scholar]
20. S. -D. Chen and A. R. Ramli, “Preserving brightness in histogram equalization based contrast enhancement techniques,” Digital Signal Processing, vol. 14, no. 5, pp. 413–428, 2004. [Google Scholar]
21. S. Patel and M. Goswami, “Comparative analysis of histogram equalization techniques,” in 2014 Int. Conf. on Contemporary Computing and Informatics (IC3I), Mysore, India, pp. 167–168, 2014. [Google Scholar]
22. H. -T. Wu, Y. Wu, Z. Guan and Y. Cheung, “Lossless contrast enhancement of color images with reversible data hiding,” Entropy, vol. 21, no. 9, pp. 910, 2019. [Google Scholar]
23. Y. Yang, W. Zhang, D. Liang and N. Yu, “A ROI-based high capacity reversible data hiding scheme with contrast enhancement for medical images,” Multimedia Tools and Applications, vol. 77, no. 14, pp. 18043–18065, 2018. [Google Scholar]
24. S. Kim, R. Lussi, X. Qu and H. J. Kim, “Automatic contrast enhancement using reversible data hiding,” in 2015 IEEE Int. Workshop on Information Forensics and Security (WIFS), Rome, Italy, pp. 1–5, 2015. [Google Scholar]
25. H. -T. Wu, J. -L. Dugelay and Y. -Q. Shi, “Reversible image data hiding with contrast enhancement,” IEEE Signal Process Lett., vol. 22, no. 1, pp. 81–85, 2014. [Google Scholar]
26. G. Gao, S. Tong, Z. Xia, B. Wu, L. Xu et al., “Reversible data hiding with automatic contrast enhancement for medical images,” Signal Processing, vol. 178, pp. 107817, 2021. [Google Scholar]
27. H. Chen, J. Ni, W. Hong and T. -S. Chen, “Reversible data hiding with contrast enhancement using adaptive histogram shifting and pixel value ordering,” Signal Process Image Commun., vol. 46, no. 1, pp. 1–16, 2016. [Google Scholar]
28. G. Gao and L. Amoah, “Automatic contrast enhancement with reversible data hiding using bi-histogram shifting,” Journal of Information Security and Applications, vol. 68, pp. 103223, 2022. [Google Scholar]
29. S. Kim, R. Lussi, X. Qu, F. Huang and H. J. Kim, “Reversible data hiding with automatic brightness preserving contrast enhancement,” IEEE Transactions on Circuits and Systems for Video Technology, vol. 29, no. 8, pp. 2271–2284, 2018. [Google Scholar]
30. H. -T. Wu, W. Mai, S. Meng, Y. -M. Cheung and S. Tang, “Reversible data hiding with image contrast enhancement based on two-dimensional histogram modification,” IEEE Access, vol. 7, pp. 83332–83342, 2019. [Google Scholar]
31. L. Amoah and T. K. Ampofo, “A bi-histogram shifting contrast enhancement for color images,” Journal of Quantum Computing, vol. 3, no. 2, pp. 65, 2021. [Google Scholar]
32. G. Guangyong and Z. Zhengyuan, “High performance color image contrast enhancement algorithm using reversible data hiding,” Journal of Computer-Aided Design & Computer Graphics, 2023. https://doi.org/10.3724/SP.J.1089.2023.19546 [Google Scholar] [CrossRef]
Cite This Article
 Copyright © 2022 The Author(s). Published by Tech Science Press.
This work is licensed under a Creative Commons Attribution 4.0 International License , which permits unrestricted use, distribution, and reproduction in any medium, provided the original work is properly cited.
 Downloads
 Citation Tools