
 Submit a Paper
 Propose a Special lssue
 Open Access
ARTICLE

Life Cycle Assessment Introduced by Using Nanorefrigerant of Organic Rankine Cycle System for Waste Heat Recovery
1 Faculty of Metallurgical and Energy Engineering, Kunming University of Science and Technology, Kunming, 650093, China
2 State Key Laboratory of Complex Nonferrous Metal Resources Cleaning Utilization in Yunnan Province, Kunming University of Science and Technology, Kunming, 650093, China
* Corresponding Author: Lin Ma. Email:
(This article belongs to the Special Issue: New Insights on Nanomaterials for Energy, Environmental and Agricultural Applications)
Journal of Renewable Materials 2023, 11(3), 1153-1179. https://doi.org/10.32604/jrm.2022.022719
Received 23 March 2022; Accepted 30 May 2022; Issue published 31 October 2022
 View Full Text
 Download PDF
Abstract
The use of nanorefrigerants in Organic Rankine Cycle (ORC) units is believed to affect the cycle environment performance, but backed with very few relevant studies. For this purpose, a life cycle assessment (LCA) has been performed for the ORC system using nanorefrigerant, the material and energy input, characteristic indicators and comprehensive index of environmental impact, total energy consumption and energy payback time (BPBT) of the whole life cycle of ORC system using Al2O3/R141b nanorefrigerant were calculated. Total environmental comprehensive indexes reveal that ECER-135 index decrease by 1.5% after adding 0.2% Al2O3 nanoparticles to R141b. Based on the contribution analysis and sensitivity analysis, it can be found out ORC system manufacturing is of the most critical stage, where, the ECER-135 index of ORC component production is the greatest, followed by the preparation process of R141b, transportation phase, and that of Al2O3 nanoparticles preparation is small. The retirement phase which has good environmental benefits affects the result significantly by recycling important materials. Meanwhile, the main cause and relevant suggestion for improvement were traced respectively. Finally, the environmental impacts of various power generations were compared, and results show that the power route is of obvious advantage. Among the renewable energy, ORC system using Al2O3/R141b nanorefrigerant with minimal environmental impact is only 0.67% of coal-fired power generation. The environmental impact of current work is about 14.34% of other nations’ PV results.Keywords
Energy is an important guarantee for the development of human society and economy [1]. The global energy demand is constantly increasing and recent projections show that this trend is going to continue with an average increase of 1.2% up to 2040 [2]. The global energy problems are becoming more and more acute, especially in the metallurgical, chemical, electrical, and mechanical sectors. On the other hand, there are concerns about fossil fuel consumption and rising greenhouse gas emissions which could pose some problems to the environment [3,4]. Thus, from the perspective of energy conservation and emission reduction, it is vital to recover and reuse waste heat especially the low-grade waste heat from renewable energy sources such as industrial waste heat (new forms of energy utilization resulting from technological reform of traditional energy sources are also included), solar energy, biomass, and geothermal energy when the high temperature waste heat recovery technology is mature. An Organic Rankine Cycle (ORC) is a low-grade waste heat recovery technology, which converts low-grade waste heat into high-grade energy. It is similar to a conventional steam cycle energy conversion system, but uses organic fluid such as refrigerants and hydrocarbons instead of water as the working medium. Due to its low pressure requirement, simple mechanism, convenience of maintenance, better economy, and high recovery efficiency, the ORC has become one of the most popular topics in the field of low-temperature waste heat recovery [5].
The working medium, which runs through the whole thermal process of the cycle, is a key factor that affects the performance of the ORC system. Hence, the selection of the working mediums is very important and significant to the research and application of the ORC. One of the most well-known researches was made by Chen et al. [6], who investigated 35 kinds of different working mediums for the two cycles and analysed the influence of fluid properties on cycle performance. Results indicated that the thermodynamic and physical properties, stability, environmental impacts, safety and compatibility, and cost should be all taken into account when selecting a working medium. The latest research is mostly represented by Uusitalo et al. [7], who thoroughly examined different types of working mediums in subcritical ORC by means of thermodynamic analysis. As a result of the study, guidelines and recommendations were generated that can be used in the preliminary evaluation of potential fluid candidates and cycle configurations. Generally, the working mediums of the ORC system can be classified into four main categories: ammonia, CO2, refrigerants, and hydrocarbons. Because of the low boiling point and low latent heat properties, refrigerants have received increasing attention. One achievement was found by He et al. [8], who calculated the optimal evaporation temperature of the ORC that the larger net power output would be produced when the critical temperature of the working medium approached the temperature of the waste heat source. In the study, the optimal evaporation temperature of 22 working mediums including wet, isentropic and dry fluids were determined under the given conditions. From their results, R114, R245fa, R123, R601a, n-pentane, R141b and R113 were suited as working mediums for subcritical ORC under the given conditions.
Recently, it has been shown that the dispersion of solid nanoparticles in the refrigerants can increase the heat transfer coefficient of the system. Thus, using nanorefrigerants as working mediums can be an effective technique to improve the efficiency of the ORC system without altering the system design. Molana et al. [9] conducted a comprehensive review on the numerical study of nanorefrigerant heat transfer enhancement, and they demonstrated that nanorefrigerants had some promising aspects like enhanced pool boiling and convective heat transfer coefficients, leading to produce smaller and more affordable refrigeration equipment. Sun et al. [10] published a comparative study on the flow boiling heat transfer characteristics of four nanorefrigerants (Cu-R141b, Al-R141b, Al2O3-R141b, and CuO-R141b) in an internal thread copper tube. They concluded that the maximum heat transfer coefficient of the four kinds of nanorefrigerants increased by 17%–25%. Yang et al. [11], experimentally studied the heat transfer and flow characteristics of MWCNT-R141b nanorefrigerant with different mass fractions through experiments. The results suggested that the 0.3 wt% MWCNT-R141b nanorefrigerants had optimal heat transfer enhancement effects compared with pure refrigerants. Sun et al. [12] performed a numerical and experimental study to evaluate the flow boiling heat transfer characteristics of two functionalized multi-walled carbon nanotube nanorefrigerants (MWCNT-COOH/R141b and MWCNT-OH/R141b). The results show that both functionalized MWCNT/R141b nanorefrigerants can enhance the flow boiling heat transfer coefficient of a refrigerant in a tube, and the enhancement was increased with an increase in volume fraction.
Solid nanoparticles suspended into refrigerants belong to a kind of two-phase nanofluids. Due to the increase of thermal conductivity, the heat transfer characteristics of nanorefrigerants are enhanced. Hence, some other researchers have done theoretical and experimental research works about preparation and thermophysical properties of nanorefrigerants. Most of studies are related to thermal conductivity, viscosity, density, heat capacity, surface tension, electrical conductivity, freezing characteristics, etc. of nanorefrigerants. One achievement from Alawi et al. [13], revealed that the viscosity of TiO2/R123 nanorefrigerant increased accordingly with the increase of nanoparticle volume concentrations, while decreased with the increment of temperature. Alawi et al. [14] also reported a study on the thermal conductivity and specific heat of CuO/R-134a nanorefrigerant, they observed that the thermal conductivity and specific heat increased with the augmentation of particle concentrations and temperatures. In addition, the results of viscosity and density of the nanorefrigerant show a significant increase with the increase of volume fractions. And Mahbubul et al. [15] made a further development about the thermophysical properties of nanorefrigerants by experiment, these experiments indicate that the thermal conductivity of Al2O3/R134a nanorefrigerant increased with the augmentation of particle concentration and temperature, however, decreased with particle size intensification. In addition, the results of viscosity, pressure drop, and heat transfer coefficients of the nanorefrigerant show a significant increment with the increase of volume fractions. Therefore, they pointed out the optimal particle volume fraction was important to be considered in producing nanorefrigerants that can enhance the performance of ORCs.
Some researches about dispersion stability [16], aggregation [17], pressure drop [18], heat transfer characteristic [19], condensation [20–22], and rheological behavior also reported in quantity [23]. In addition, a great number of studies focused on the examination of the application of nanoparticles in ORCs. Boyaghchi et al. [24] performed the thermodynamic, economic and environmental analyses of the CCHP cycle integrated with flat plat collectors containing copper oxide/water nanofluid as the absorbing medium, and R134a, R423A, R1234ze and R134yf were selected as the working mediums. From their results, the best refrigerant was selected from different aspects. Huang et al. [25] analyzed two different Dualloop organic Rankine cycles. R123, R245fa, ethanol, R141b, and water were the candidate working mediums for the HT loop, and R143a was the working medium of the LT loop, graphene nanoparticles and carbon nanotubes were added to coolant water to enhance its heat transfer. Results show that when the coolant water contains 0.5 wt% carbon nanotubes, system reaches the max net output power increment of 3.84 kW. Boyaghchi et al. [26] presented a study to evaluate the performance of CCHP system integrated with flat plate collectors based on an ORC. In this study, CuO nanoparticles were suspended in pure water as the heat transfer medium inside the collector, and four kinds of refrigerants were selected as the working mediums. In the end, the best refrigerant was selected from the energy, exergy and exergoeconomic viewpoints. Sardarabadi et al. [27] experimentally studied the exergy and efficiency of a PV/T system based silica/water nanofluid. They found the increase of 24.3% and 7.9% in overall exergy and efficiency respectively, when the volume fraction of nanofluid was 3 vol% which was the maximum value studied in this paper.
The literatures mentioned above highlight the following aspects: the selection of refrigerants used in the ORCs; preparation, thermophysical properties and heat transfer performance of nanorefrigerants; application of nano/water nanofluid in the collectors or coolants of ORCs while refrigerants selected as the working mediums from energy and exergy viewpoints. Nonetheless, to the authors’ best knowledge, none research about LCA analysis was reported by using nanorefrigerants as working fluids in the whole ORCs, which is an important research field of nanorefrigerant applied to the ORCs. Although LCA, as a useful tool for comparing the impacts of various solutions [28], has been employed to evaluate the environmental impact of an ORC system using refrigerants as working fluids. For example, Ding et al. [29] made comparison of environmental impacts of ORC systems with different working mediums (R134a, R227ea, R152a, R245fa) and suggested that the ORC system with R245fa has a minimal exergoenvironmental impact. Fergani et al. [30] reviewed a cogeneration system including an ORC system based on an exergoenvironmental analysis, and found that the heat exchangers are the most relevant components from an exergoenvironmental point of view. Wang et al. [31] analyzed the environmental impacts of the working mediums (hexane, isohexane, R601, R123 and R245fa) and components and revealed that the ORCs had good economic performance and reduce the gas emissions, the ORC system with R601 as the fluid had the best economic performance and signifificant gas emission reductions. Although the above reports evaluated the exergoenvironmental impact of an ORC system, the exergoenvironmental evaluation method based on exergy analysis only includes refrigerants.
For an ORC system, the working medium is a very important part. The life cycle inventory for an ORC system is incomplete without considering the working medium especially nanorefrigerants. According to the related study [32–34], for an ORC system using nanorefrigerants as the heat transfer working medium for the whole system, the heat transfer coefficient of the system increases with the increase of the volume fraction of nanoparticles, which is a parameter greatly affecting the heat exchanger sizing (for both the evaporator and condenser), which both affect the environmental impact of the ORC. The life cycle inventory for an ORC system should be studied in depth, and no researcher has addressed the LCA analysis of the nanorefrigerants in an ORC. Therefore, aiming to identify the environment performance improvement introduced by the use of the nanoparticles, the LCA analysis of the nanorefrigerants in an ORC is also investigated in the present paper. The environmental impact of the nanorefrigerants in the construction phase as well as the operation phase is considered. Al2O3/R141b with different volume fractions are selected as the nanorefrigerants. The LCA analysis of components in ORC is also analyzed. The purpose of the present study is to investigate the sustainability of an ORC system whose working fluid is nanorefrigerant for waste heat power generation through LCA analysis so as to point out the main directions and ways of reducing environmental load and clarify the environmental advantages.
2 Life Cycle Assessment of Organic Rankine Cycle System
Since China has a different degree of industrialization and environmental restrictions compared to Europe [35], we employ the Chinese Life Cycle Database (CLCD) v0.8, which is available in the software eBalance v4.7. CLCD is a national background life cycle database consisting of more than 600 LCI datasets for key materials and chemicals, energy, transportation, and waste treatment, which is based on a consistent core life cycle model and represents the Chinese market average technology. Domestic production is further broken down by process technology and factory scale to collect data and set up models. Finally by weighted average market share in China, the market average technology data are calculated in CLCD. eBalance, independently developed by Chengdu IKE Environmental Technology Co., Ltd., China, which is a full-featured LCA software and shipped with Chinese and global high quality databases. The eBalance package is a professional tool for LCA studies of all kinds of products, and the best choice for LCAs of products manufactured in China, which has been applied by more than 1000 users around the world. It has continuous updates with innovative features, such as supporting quantitative quality evaluation and control, reproducible data collection by full-length documentation, Chinese environmental policy target oriented LCA analysis (Energy conservation and emission reduction, ECER).
As shown in Fig. 1a, the ORC system components are comprised of an evaporator, an turbine with electricity generator, a condenser and a pump. Throughout the whole cycle, the vapour refrigerant with high pressure and high temperature from evaporator enters the expander to generate electrical power by the electricity generator. After expansion, the refrigerant with low-pressure from the outlet of the expander flows into the condenser, where the steam is cooled and condensed into liquid state. Then, the refrigerant is drawn into the pump to increase pressure. At last, it runs into the evaporator to absorb the heat from flue gas, in which the liquid refrigerant is converted into vapour and then it flows back to the expander to perform the next cycle. The T-S diagram for the ORCs based refrigerant is witnessed from Fig. 1b, (4–1) belongs to isobaric heating, (1–2) belongs to isentropic expansion, (2–3) belongs to isobaric cooling, and (3–4) belongs to isentropic compression. It is noteworthy that the heat transfer processes are not strictly isentropic in practical ORC operation.
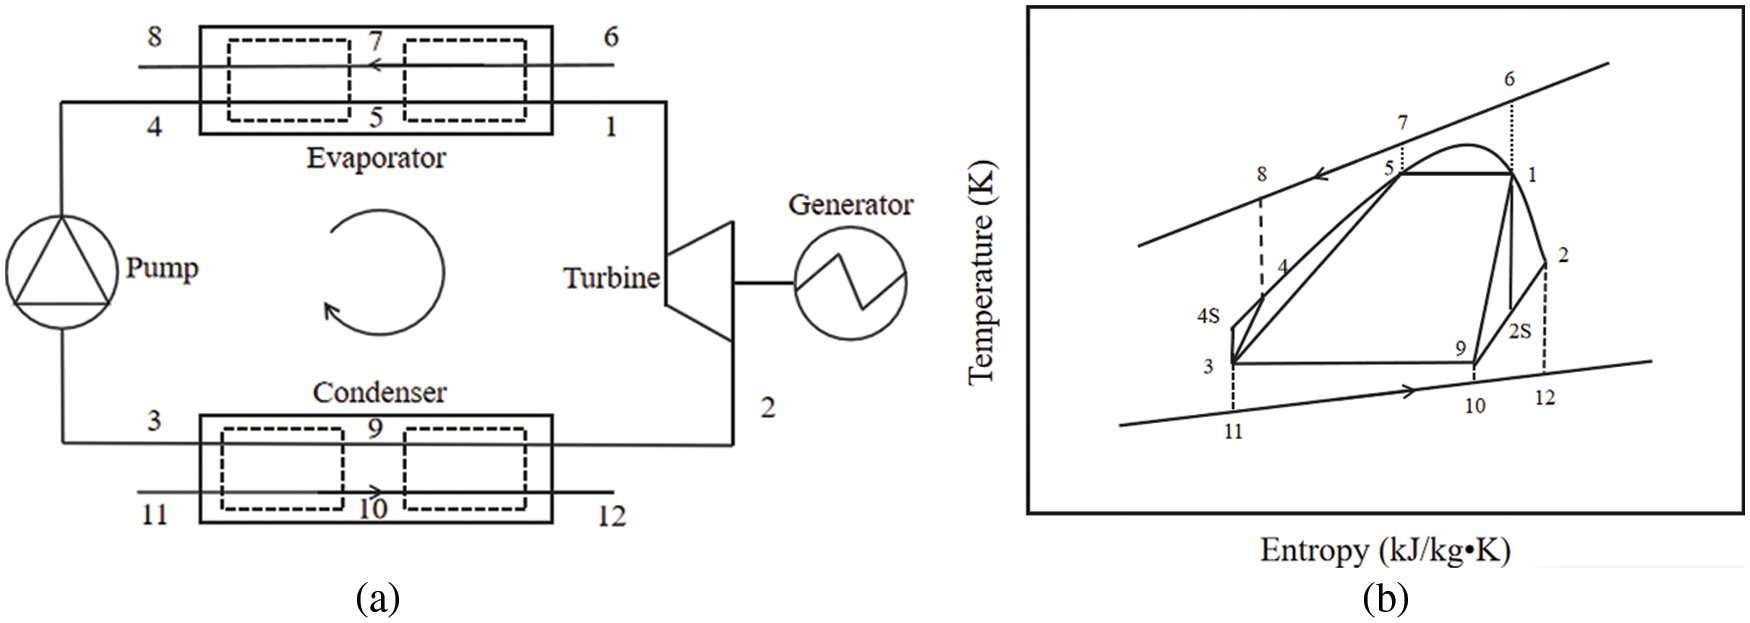
Figure 1: Schematic diagram of the ORC: (a) Cycle configuration; (b) T-S diagram
Process 4–1: The isobaric heat absorbing process in the evaporator. The amount heat absorbed by the refrigerant in the evaporator is defined as:
where
Based on the heat balance:
Among which:
The mass flow rate of refrigerant is obtained according to Eqs. (1) to (4):
where mg stands for the mass flow of flue gas, kg/s; cp stands for the average specific heat capacity under fixed pressure of flue gas, kJ/(kg·K); Tgin stands for the inlet temperature of the flue gas, K; Tm stands for the corresponding flue gas temperature to make the refrigerant reach the evaporation temperature, K; Tgout stands for the outlet temperature of the flue gas, K; T1 stands for the evaporation temperature, K; ΔTevp stands for the pinch point temperature of the evaporator, K; h5 stands for the corresponding specific enthalpy of the refrigerant which just reached the evaporation temperature in the evaporator, kJ/kg.
Exergy loss in evaporator:
In the equation, T0 stands for ambient temperature, K; TH stands for the heat-absorbing temperature of refrigerant, K; S1 and S4 is the specific entropy of state points 1 and 4, kJ/(kg·K).
Process 1–2: The expansion process in the turbine. the ideal power generated by the turbine can be calculated as:
The isentropic efficiency of the turbine is:
The practical power generated by the turbine can be calculated as:
where h2 and h2s are the actual and ideal specific enthalpy of refrigerant at the outlet of the expander, kJ/kg.
The exergy loss in the expander is:
where S2 stands for the specific entropy of state point 2, kJ/(kg·K).
Process 2–3: The isobaric condensation process in the condenser. The total heat released by the refrigerant in the condenser can be expressed as:
where h3 stands for the specific enthalpy at the outlet of the condenser, kJ/kg.
The exergy loss in the condenser is:
where TL stands for the exothermic temperature of the refrigerant in the condenser, K; S3 stands for the specific entropy of state point 3, kJ/(kg·K).
Process 3–4: The pressure of refrigerant is raised by the pump. The ideal power input consumed by the pump can be expressed as:
where h4s stands for the ideal specific enthalpy of the refrigerant at the entrance of the evaporator, kJ/kg.
The isentropic efficiency of the pump is:
The practical power input consumed by the pump is:
The exergy loss of the pump is:
where s4 stands for specific entropy of state point 4, kJ/(kg·K).
The net power output of the ORC system is calculated as:
The thermal efficiency of the ORC system can be expressed as:
The exergy efficiency of ORC system can be calculated as:
where T0 is the environment temperature, K; TH is the logarithmic mean temperature of the flue gas;
2.3 Boundary of the ORC in the Life Cycle
The system boundaries include ORC components (evaporator, condenser, expander, pump), refrigerant, and nanoparticles, as shown in Fig. 2. The life cycle includes the manufacturing phase, the construction transportation phase, the operation phase and the retirement phase. Since the system is simple, the environmental impact of all lines and valves in the system is ignored. Considering the preparation and transportation of raw materials, assuming 2-ton petrol trucks are used for transport, with an average domestic transport distance of 186.72 km [36]. The operating stage recovers waste heat, does not consume fuel, and has no environmental impact. The ORC components are all steel-made, and if electrosmelting of steel uses scrap steel as raw material, it can save 60% of the energy [37] compared to long-process steel-making, but the impact of recycling steel and its transportation process shall be taken into account during the waste phase [38]. It should be pointed out that there will be a small amount of leakage of nanorefrigerant in the operation stage and waste stage, which will cause a small amount of impact on the environment, but the recycling of the surplus will produce a lot of environmental benefits. Due to the lack of relevant data, it is assumed that the positive and negative effects are offset in the calculation. In addition, the volume of nanorefrigerant is small, and the environmental impact caused by the transportation process is negligible in the retirement phase. We choose a nanorefrigerant ORC system of Al2O3/R141b as the functional unit.
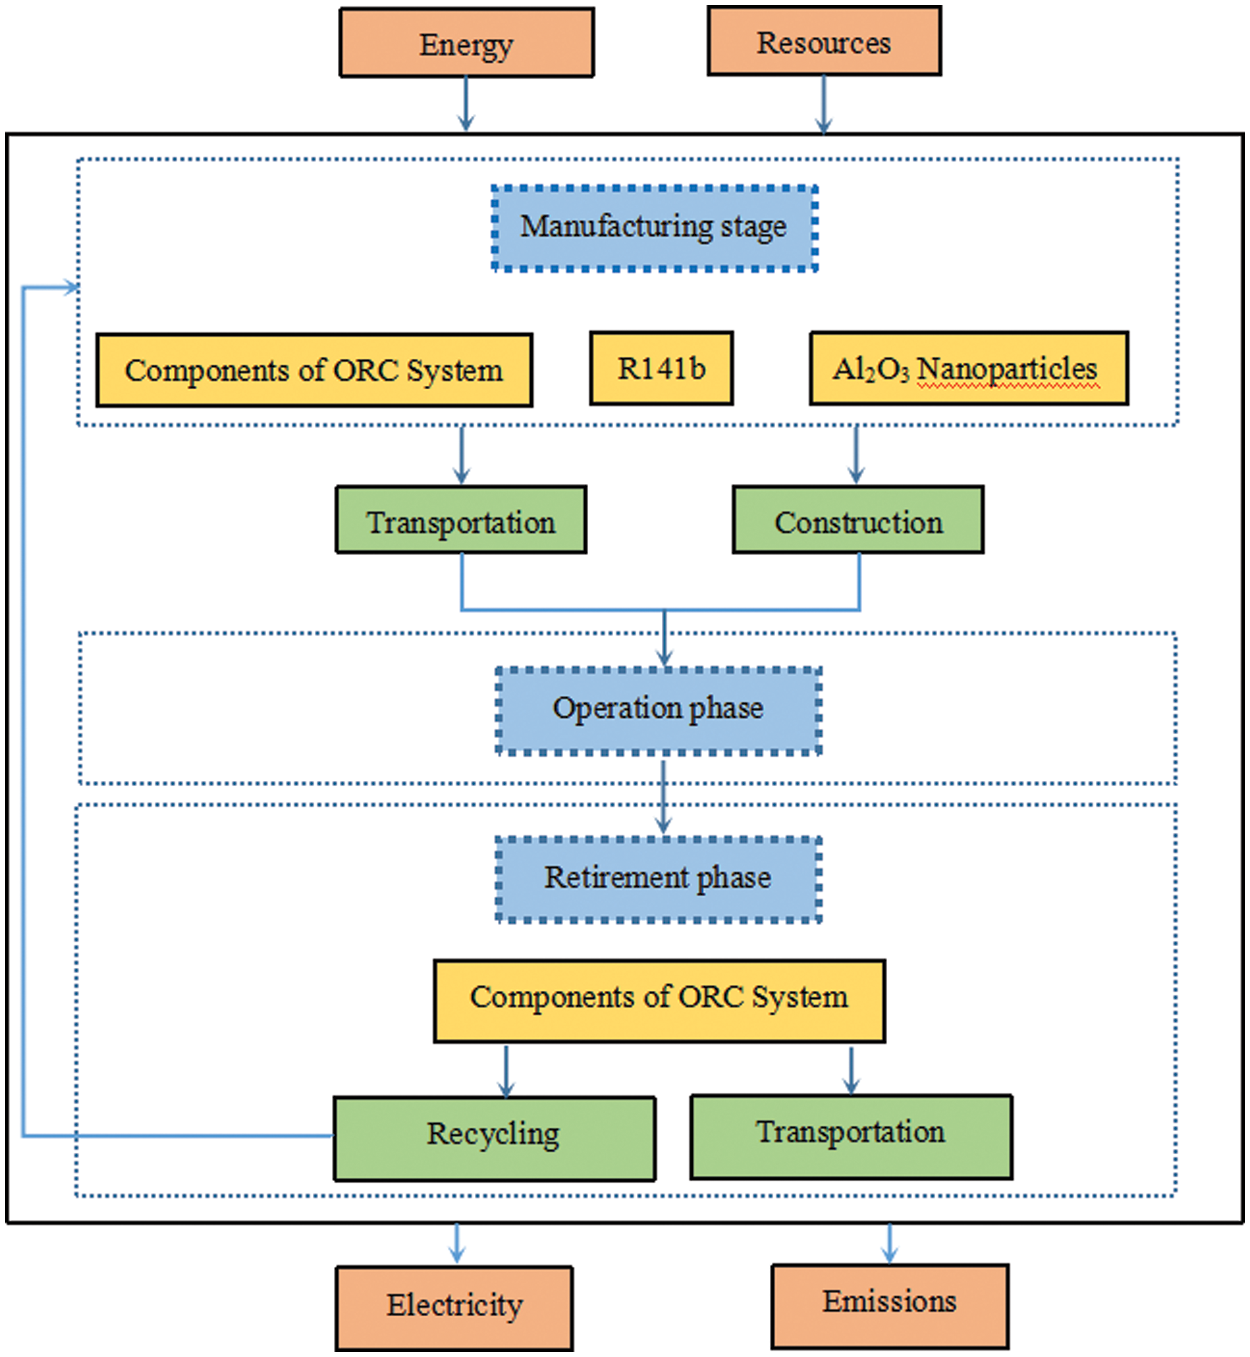
Figure 2: LCA system boundary diagram of ORC system
2.4.1 Selection of Refrigerant and Nanoparticles
(1) The boiling point of R141b is 32.06°C, and it can keep the liquid state under normal environmental conditions, which is convenient for the preparation of nanorefrigerants; (2) The basic thermophysical properties of R141b are similar to most commonly used refrigerants compared with non-refrigerant fluids. Therefore, the performance of nanorefrigerants based R141b can reflect that of nanorefrigerants based other refrigerants to some extent; (3) The thermophysical properties of R141b are the best under various refrigerants in assumptions of ORC [39,40]. (4) Al2O3 nanoparticles are widely used and their properties are well defined. Based on the above four points, Al2O3/R141b nanorefrigerant is chosen for this work. According to the previous research [41,42], the suspension stability of low concentration of nanorefrigerant is very good, and after the ORC system runs normally, the fluid flow and bubble disturbance in the flow boiling process can play a role in preventing nanoparticles from gathering, depositing, rubbing parts and blocking pipes, it is feasible for low concentration of Al2O3/R141b nanorefrigerant to operate in the system. Therefore, Al2O3 nanoparticles with concentrations of 0.02 vol.%–0.2 vol.% were studied in this paper.
2.4.2 Operating Conditions of ORC System
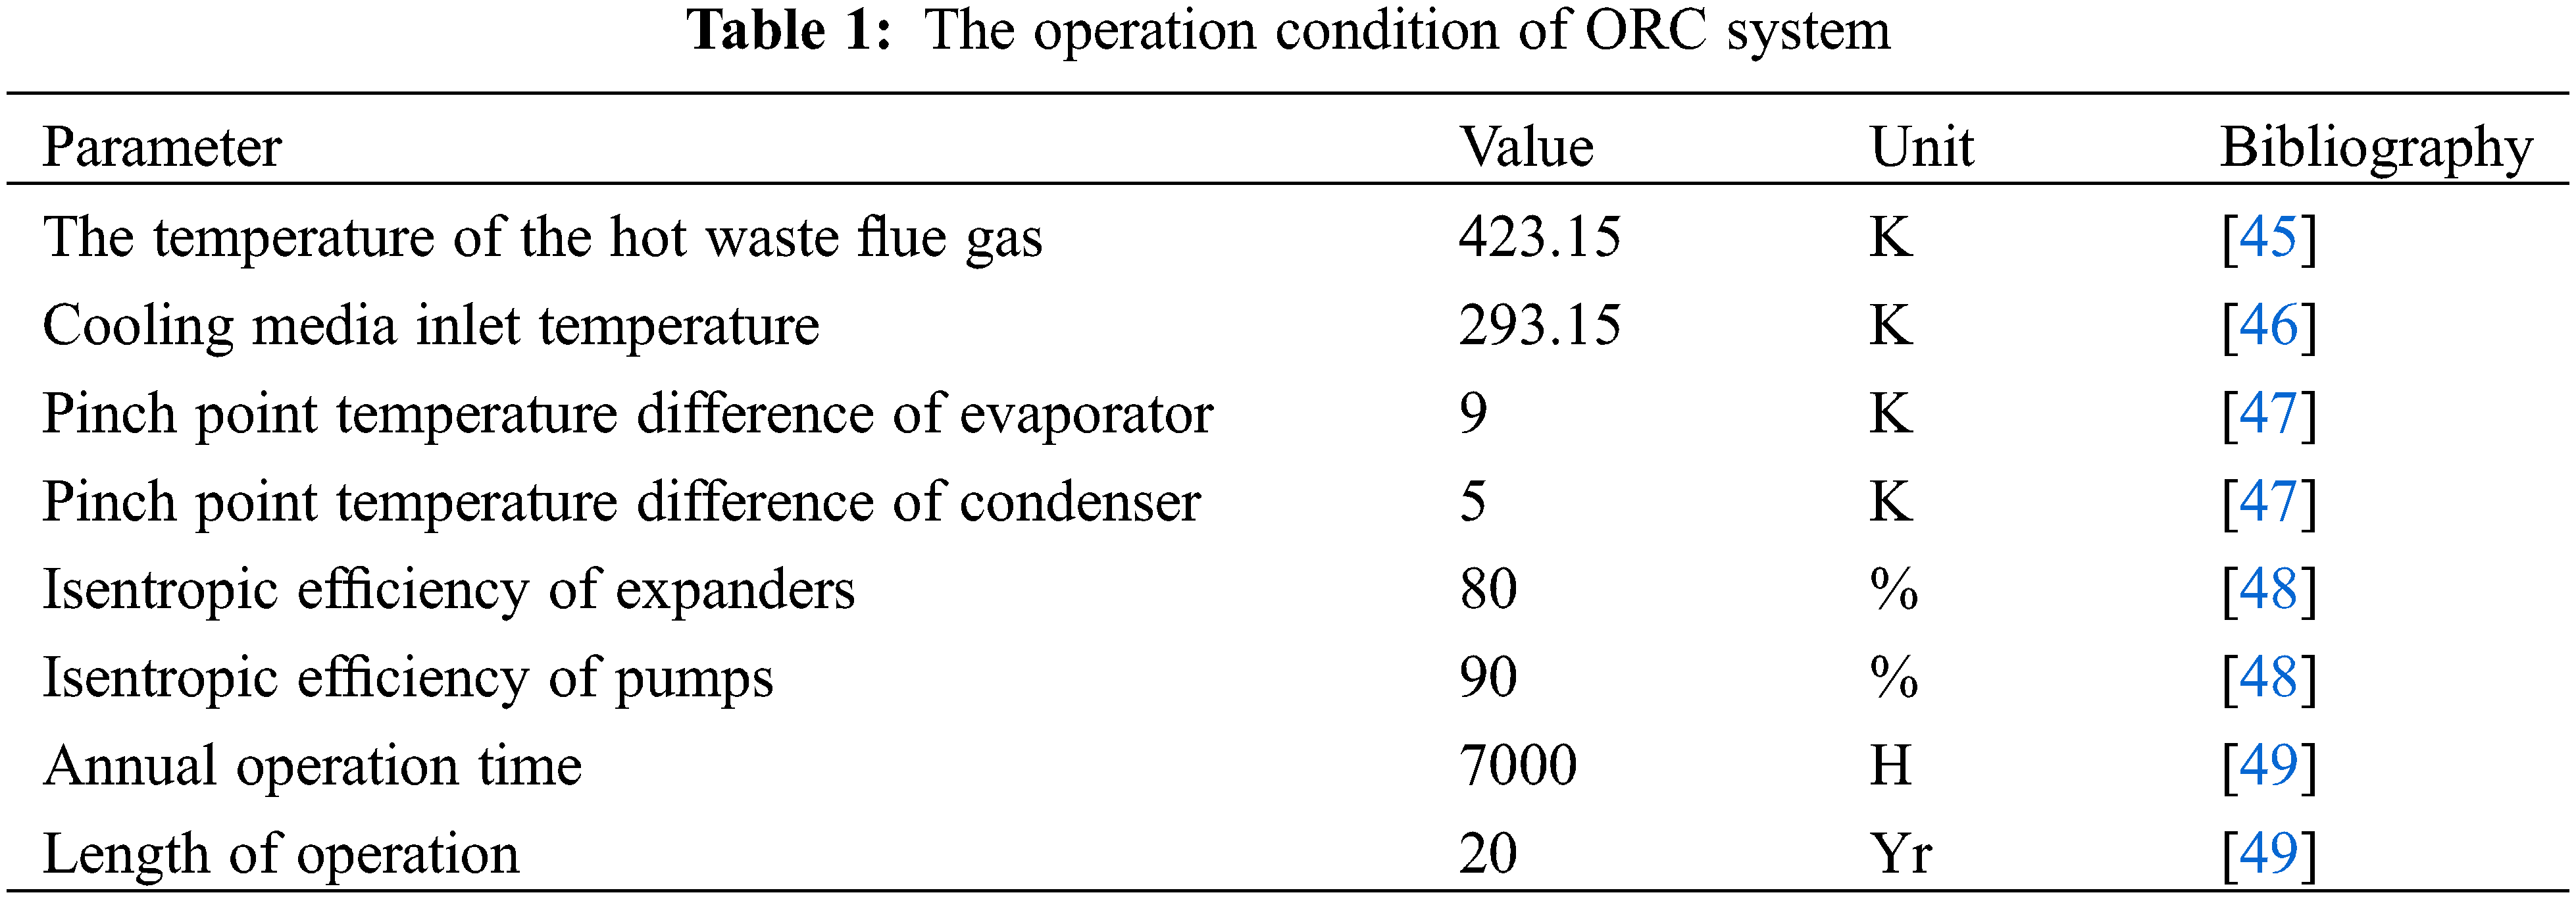
First, assumptions of the present ORCs model have been made as follows: the flue gas flow rate is 0.5675 m3/s, the waste heat flue gas density is 1.283 kg/m3, and the specific heat capacity of the waste heat flue gas is 1.372 kJ/kg·K [43]; the ORC system operates steadily under working conditions, the refrigerant evaporates at constant temperature in the evaporation section of the evaporator; ignore the heat loss in the system components; ignore the pressure drop loss of the evaporator, condenser and system pipeline; the refrigerant is in the saturated liquid state and saturated gas state at the pump outlet and expander inlet respectively. Due to the simple structure, easy and reliable operation, the use of a variety of materials for preparation, and high temperature and high pressure ressistance of the shell tube heat exchanger, most ORC power plants are currently using shell tube heat exchanger [44]. so set the evaporator and condenser as shell tube heat exchanger. The heat exchanger model is shown in Fig. 3, and the temperature identification of each state point in the figure is the same as in Fig. 1. The evaporator is divided into preheating section and evaporation section, and the condenser is divided into cooling section and condensation section. The system operation conditions are shown in Table 1.
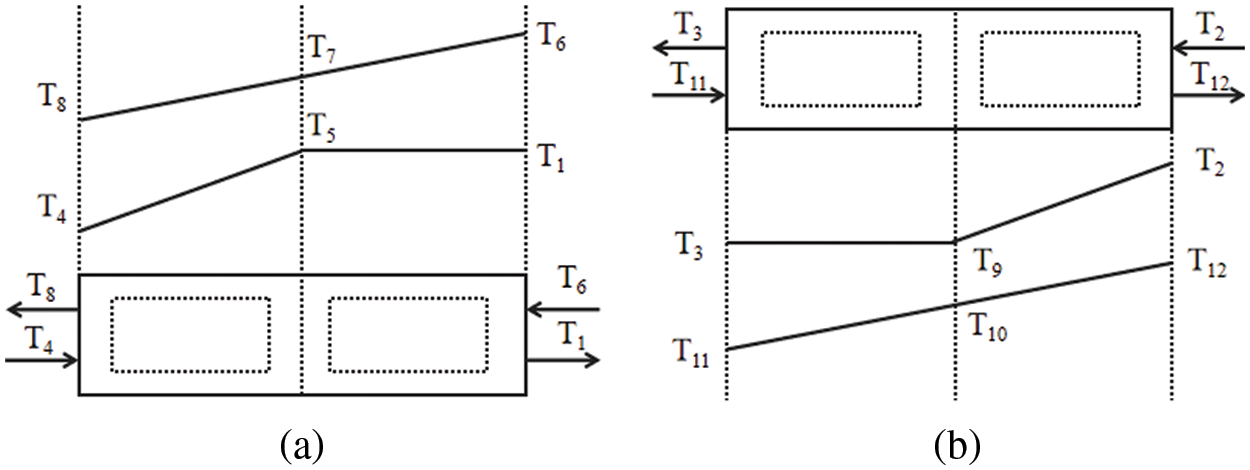
Figure 3: Model of heat exchanger: (a) Evaporator; (b) Condenser
2.4.3 Optimization Results of ORC System
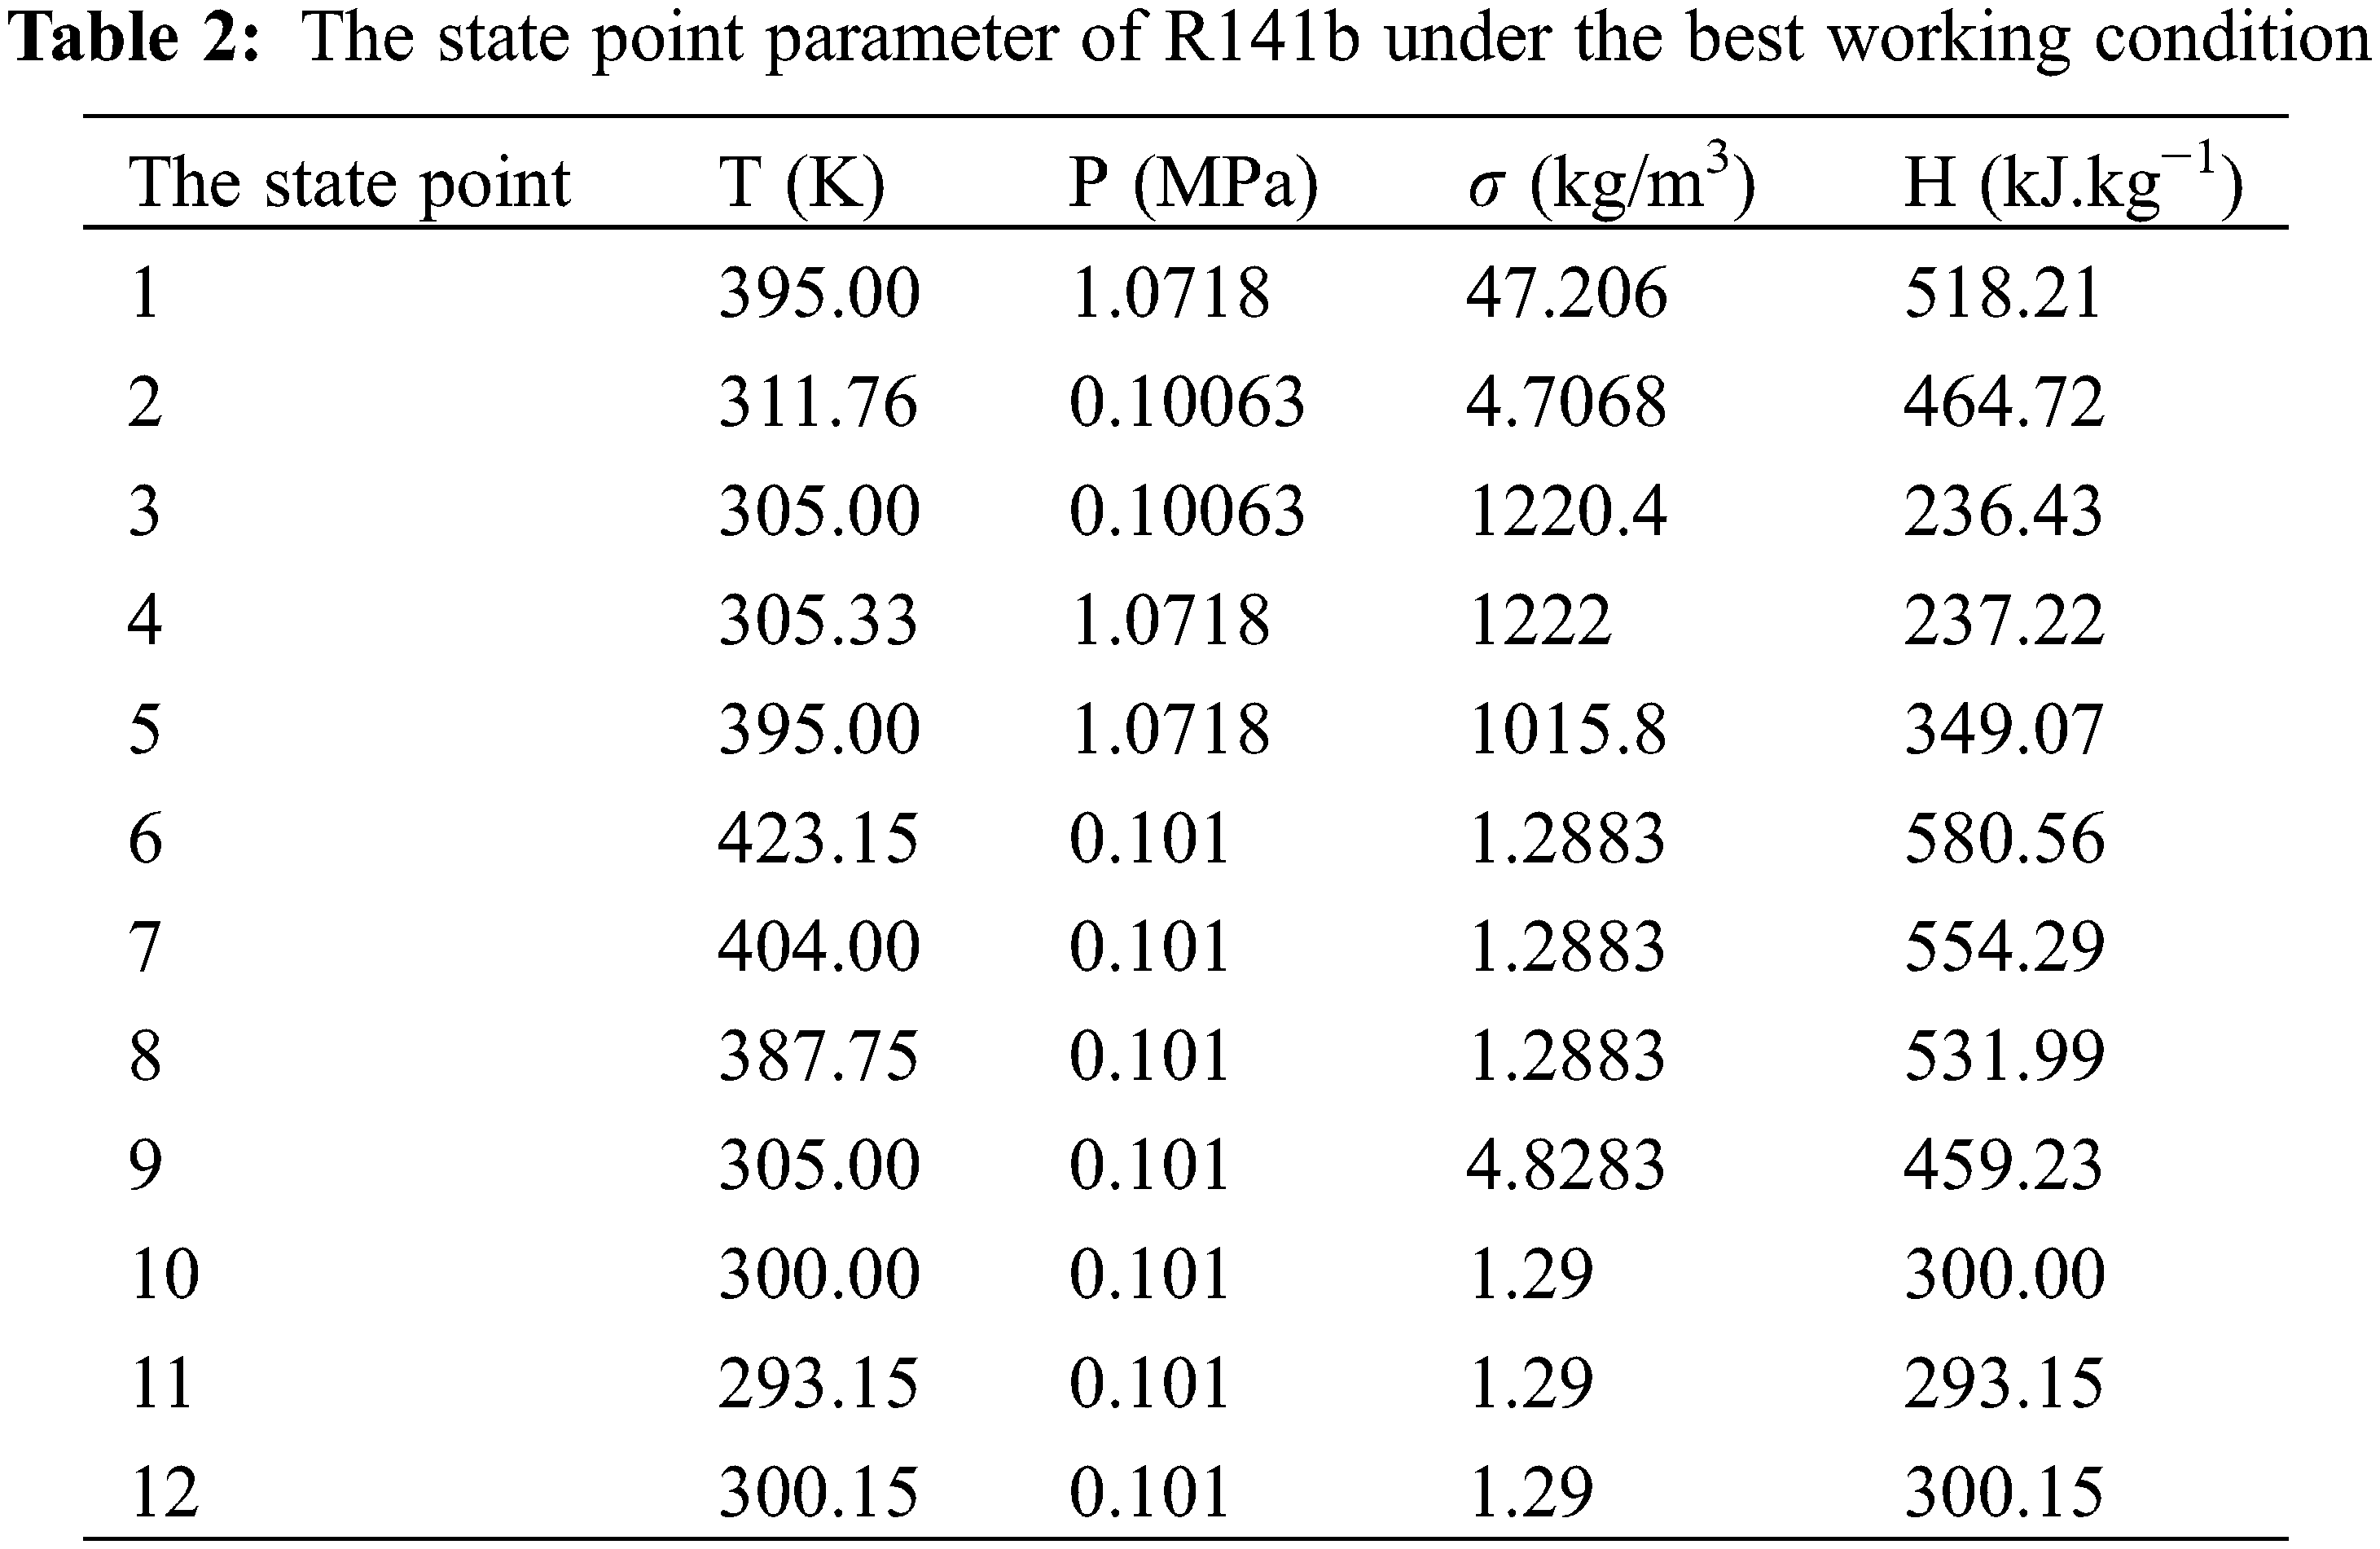
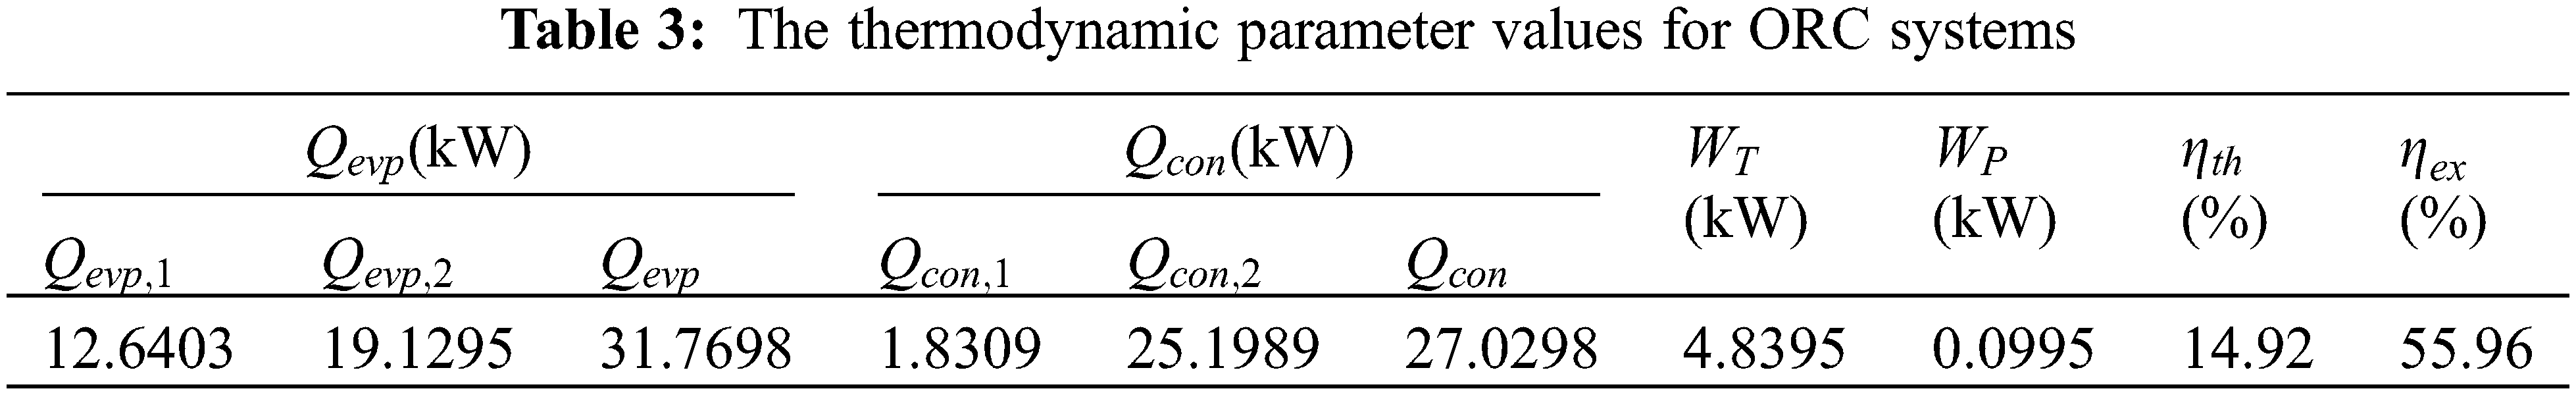
Based on the established thermal economic model, the use of MATLAB software and genetic algorithm is aimed at the minimizing the Levelized cost of power generation and optimizing the operating parameters of ORC system using R141b as circulating working medium, thus the optimal combination is confrimed: 395 K for evaporation temperature, 305 K for condensation temperature, 4.74 kW for network [50]. Then, according to evaporation temperature and condensation temperature, thermodynamic parameters of each state point are obtained through REFPROP 9.0, as shown in Table 2. The parameters of each cycle state point and each thermodynamic parameter are calculated by substituting the parameters in the thermodynamic formula, as shown in Tables 2 and 3.
2.5 Mass Calculation of Components and Nanorefrigerant
In the manufacturing stage, the raw materials of the system equipment are mainly steel, and the materials required for various valves and pipes are less and neglected. The consumables of evaporator, condenser, expander and pump components are mainly considered.
The evaporator is divided into preheating section and evaporation section:
The required heat transfer area of single-phase region in preheating section is:
where Qevp,1 stands for the heat absorption capacity of the preheating section, kW; mr/nr stands for the mass flow rate of the heat exchange medium, kg/s; h4, h5 stand for state point 4, 5, which are the specific enthalpy value of the heat exchange medium at the inlet position of the evaporator and at the start position of the evaporation section in the evaporator, kJ/kg; Uevp,1 stands for the comprehensive heat transfer coefficient of the preheating section, W/m2·K; ΔTevp,1 stands for the logarithmic mean temperature difference of the preheating section, and the calculation formula is as follows:
The required heat transfer area of two-phase region in evaporation section is:
The calculation formula of logarithmic mean temperature difference, ΔTevp,2 in evaporation section is:
The condenser is divided into cooling section and condensing section:
The required heat transfer area of single-phase region in cooling section is:
The required heat transfer area of the two-phase region of the condensing section is:
The calculation method of the logarithmic mean temperature differences for cooling section and condensing section is the same as that of evaporator. The comprehensive heat transfer coefficients (Uevp,1, Uevp,2, Ucon,1, Uevp,2) of preheating section, evaporation section, cooling section and condensation section are calculated by the following formula:
where, D0 and Di stand for the outer diameter and inner diameter of the tested copper tube, m; λ stands for the thermal conductivity of the heat exchange tube, which is 383 W/m·K; R0 and Ri stand for the fouling thermal resistance outside and inside the tube, whose value is set to 0.0002 and 0.001 m2·K/W [51]; hr/nr stands for the heat transfer coefficient of the heat exchange medium inside the tube, W/m2·K; h0 stands for the heat transfer coefficient of the heat exchange medium of the heat source or the cold source outside the tube, W/m2·K; the heat transfer coefficients of the gas side of the evaporator and condenser are set to 70 and 50 W/(m2·K) [52], respectively.
Dittus-Boelter formula is used to calculate the heat transfer coefficient in the single-phase region as follows:
where n is set to 0.3 when the medium is cooled and 0.4 when heated.
Liu-Winterton formula is used to calculate the heat transfer coefficient of refrigerant flowing and boiling in the evaporation section of the evaporator, as follows:
E stands for the two-phase convection enhancement factor, W/(m2·K); S stands for the nucleate boiling inhibition factor, W/(m2·K); hpool stands for the boiling heat transfer coefficient, W/(m2·K); M stands for molar mass; Pr stands for relative pressure. In the evaporation section (state point 5-state point 1), the vapor quality increases. In order to facilitate the calculation, it is assumed that the vapor quality increases linearly with the length of the heat exchange tube. In the calculation process, the evaporation section is divided into several small unit sections, and the average heat transfer coefficient is used to solve the problem. The heat transfer coefficient of nanorefrigerant can be calculated according to the following formula:
among which:
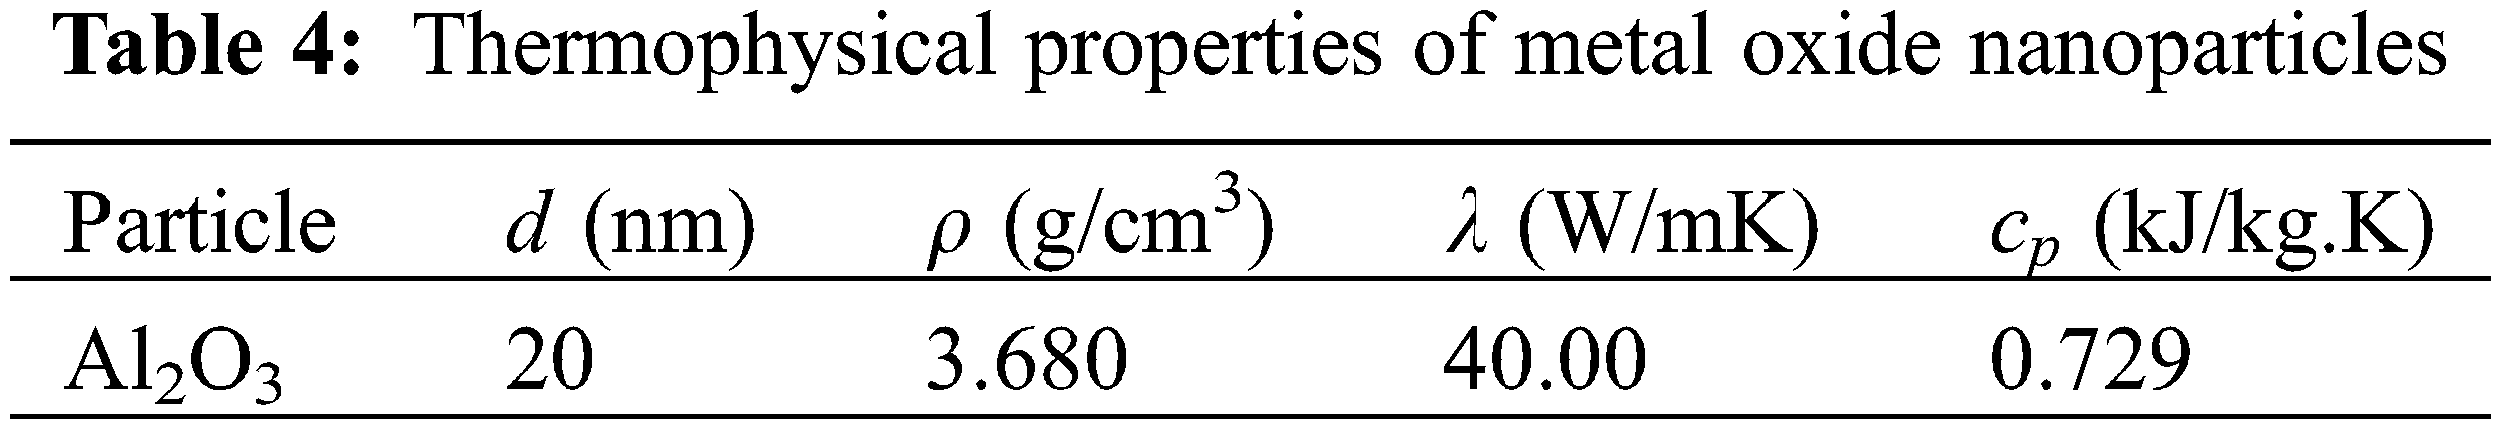
where FHT is the heat transfer influence factor of nanoparticles; KB is Boltzmann constant, with the value of 1.381 × 10⁻²³ J·K−1; ρ, c, μ, λ respectively stand for density, specific heat, viscosity and thermal conductivity; subscripts nr, r, n respectively stand for nanorefrigerant, refrigerant and nanoparticles; specific parameters of Al2O3 nanoparticles are shown in Table 4; and specific parameters of R141b are obtained by REFPROP 9.0 software.
For the condensing section of the condenser, the working medium condenses from the saturated steam to the saturated liquid, and the heat transfer coefficient of the two-phase region of the heat transfer medium in the tube is calculated by using the Dittus-Boelter formula (32) modified by Shah [53]. The calculation process still uses the subsection method of heat transfer coefficient in the evaporation section.
The mass of the evaporator:
and the mass of the condenser:
among which Mevp and Mcon stand for the masses of the evaporator and the condenser, respectively; σ stands for the steel density (
The mass of the expander:
and the mass of the pump:
among which αT stands for the mass of steel required for expander of 1 kW power; αP stands for the mass of steel for pump of 1 kW. According to the literature [55], αT equals 14 kg/kW and αP equals 31.22 kg/kW.
Mass of refrigerant:
among which αr stands for the mass of refrigerant required for 1 kW power of expander, which is 5.4 kg according to reference [56]. Since there is no environmental impact data of R141b in the database, it is necessary to trace back to the production process of R141b. In this paper, the chemical reaction formula for preparation technology is C2H2CI2+HF→C2H3CI2F [57]. If the conversion rate is 100%, preparing 3 kg R141b needs 2.5 kg vinylidene chloride, 0.58 kg hydrogen fluoride, 0.3 kg chlorosulfonic acid, 5 h working time for reactor (rated power is 1 kW), 12 kg water for water washing, 0.6 kg caustic soda and 6 kg water for alkali washing. Since there is no relevant data of molecular sieve drying tower, and the power consumption is small, its power consumption can be ignored.
The environmental impact data of vinylidene chloride in the above R141b upstream raw material cannot be found in the database, so it is necessary to calculate the input of materials required for synthesis of vinylidene chloride. The preparation method of this method is vinyl chloride hydrochlorination [58], and the reaction formula is CH2=CHCI+HCI→CH3CHCI2; CH3CHCI2+CI2→CH3CCI3+HCI (chlorination at 480°C); CH3CCI3→CH2CCI2+HCI (autolysis reaction at 510°C). If the conversion is 100%, preparing 1 kg vinylidene chloride needs 0.6443 kg vinyl chloride, 0.3763 kg hydrogen chloride and 0.7320 kg chlorine gas.
The mass of Al2O3 nanoparticles can be obtained by formula (38).
φ stands for the volume fraction of nanoparticles; mn stands for the mass of nanoparticles, kg; ρn stands for the density of nanoparticles (3680 kg/m3); ρr stands for the density of R141b (1227 kg/m3).
Since there is no environmental impact data of Al2O3 in the database, it is necessary to trace its preparation process. In this paper, the preparation process of Al2O3 by liquid deposition method is studied [59], and the reaction formula is AlCl3+3NH3·H2O→Al(OH)3↓+3NH4Cl; 2Al(OH)3→Al2O3+3H2O. Preparing 0.051 kg alumina nanoparticles needs 0.06675 kg aluminum chloride, 0.0525 kg ammonia, 0.381262 kg ethanol, 25 ml deionized water, drying oven (rated power 0.85 kW) for 10 h, resistance furnace (rated power 8 kW) for 2 h, product pickling for 2 h, which requires 0.1149 kg hydrochloric acid.
2.5.4 Mass List of Components and Nanorefrigerant
According to the above calculation formula and related results, the data list of ORC system with Al2O3/R141b or R141b as cycle working medium in its manufacturing stage can be sorted out and calculated, as shown in Table 5.

Based on the inventory data of the ORC system with Al2O3/R141b or R141b as the cycle working medium in its manufacturing stage, construction and transportation stage and decommissioning stage, the LCA modeling calculation is carried out with the help of eBalance 4.7 software.
The quantitative model constructed in this study is based on the Chinese 13th five-year comprehensive energy conservation and emission reduction overall indicator “ECER-135” built in the software eBalance v4.7 as the evaluation system. This weighted comprehensive index includes seven characteristic indicators, which are primary energy demand (PED), carbon dioxide (CO2), chemical oxygen demand (COD), industrial water usage (IWU), ammonia nitrogen (NH3-N), nitrogen oxides (NOx) and sulfur dioxide (SO2). According to the “Decrement Rate of Energy Consumption per Unit of GDP” in the corresponding part of the energy conservation and emission reduction policy target in the 13th Five-Year Plan for Economic and Social Development of the People’s Republic of China, ECER-135 obtains the weight value after taking the reciprocal normalization. The weight values of the above characteristic indicators are 6.250, 5.882, 2.907, 3.333, 2.791, 2.791 and 2.907, respectively. Table 6 lists the evaluation results of seven weighted comprehensive indicators of environmental impact types in the whole life cycle of the ORC system with Al2O3/R141b or R141b as the circulation working medium.

As shown in Table 6, the characteristic indexes and comprehensive index ECER-135 of ORC system both decrease with the addition of Al2O3 nanoparticles. With the increase of the volume concentration of nanoparticles, the comprehensive index ECER-135 decreases by 0.67%, 0.91%, 1.29% and 1.50%, respectively. Even though the addition of Al2O3 nanoparticles induces the environmental impact of the preparation process of nanoparticles, the consumption amount of steel used by evaporator and condenser decreases with the increase of heat transfer coefficient at the same time. Therefore, the overall environmental impact of ORC system is reduced. However, after adding nanoparticles, the environmental impact is far less than that of the enhancement of the heat transfer coefficient on the working medium side. This is because there is phase change on the working medium side of the heat exchanger, the heat transfer coefficient of single-phase gas on the flue gas side and air side is relatively small, and the total heat transfer coefficient of the heat exchanger is closer to that on the gas side. The enhancement of the heat transfer coefficient on the working medium side is reflected in the total heat transfer coefficient of the heat exchanger. Therefore, in this sense, it is very beneficial to select the heat source and cold source working medium which are closer to the heat transfer coefficient of heat transfer medium.
In order to qualitatively describe and quantitatively rank the environmental impact of different life cycle stages of ORC system, the 0.2% Al2O3/R141b nanorefrigerant ORC (NORC) system with the smallest environmental impact was selected for the following analysis and comparison.
3.2 Energy Payback Time of ORC System
Energy Payback Time (EPBT) is a widely used environmental indicator to evaluate the environmental protection and sustainability of the NORC system. It is defined as the time required when the cumulative power generation of the renewable energy system is equal to its energy consumption in its whole life cycle. Therefore, it can be calculated by dividing the energy consumed in the whole life cycle of the NORC system by the annual average energy output of the system. The calculation formula [60] is:
Among which Ein is the energy consumed by the NORC system throughout its life cycle; Eout is the annual output of the NORC system. The overall energy consumption (Ein) is evaluated using a primary energy demand (PED) evaluation indicator, which is 64,770.3763 MJ.
The average annual energy output of the NORC system is:
Among which n stands for the operating life; Eaout stands for the total electric energy output in the entire life cycle of NORC system, calculated as:
Among which T stands for the annual operation time. Through calculation, the total energy output of NORC system in its life cycle (Eaout) is 2.38896E+12J (6.636E + 5 kWh), and the annual average energy output of NORC system (Eout) is 1.19448E+11J. It can be calculated that the energy payback time (EPBT) is 0.54 years, which only accounts for 2.7% of the 20-year service life of the NORC system. From the perspective of energy, it fully shows that it is very practical to vigorously develop the NORC system power station.
3.3 Energy Saving and Emission Reduction Effect
According to the National Power Industry Statistics Express, China’s thermal power generation accounted for 70.39% of the total power generation in 2018. Although the proportion decreased year by year, the current power production structure is still dominated by coal-fired power generation, with great environmental pressure. NORC system can reduce traditional coal-fired power generation while using low-temperature flue gas, which has a very important value in energy conservation and emission reduction. In order to objectively reflect the good energy conservation and emission reduction effect of the NORC system power generation, taking the national grid average electricity in CLCD database as a reference, seven characteristic indexes of the ECER-135 evaluation system are used to quantify the energy conservation and emission reduction effect of NORC system power generation. The results are shown in Table 7.

It can be seen from Table 7 that in the 20-year life cycle of NORC system, compared with the national grid average electricity, the total emissions of CO2, COD, NH3-N, NOx and SO2 are reduced by 5.80 × 10⁵ kg, the industrial water consumption reduced by 2.04 × 10⁶ kg, and the primary energy consumption reduced by 8.21 × 10⁶ MJ, which has significant environmental benefits of energy conservation and emission reduction.
Contribution analysis is to analyze the structure of each indicator, and then identify the main links and causes of problems. The contribution analysis in this paper involves comprehensive environmental impact contribution analysis and characteristic indicator contribution analysis. The contribution analysis of comprehensive environmental impact includes the contribution analysis of each process stage in the whole life cycle of NORC system to the comprehensive index ECER-135, and the contribution analysis of each environmental impact index (PED, CO2, COD, IWU, NH3-N, NOx, SO2) to the comprehensive index ECER-135. The contribution analysis of characteristic indicators includes the contribution analysis of each process stage in the whole life cycle of NORC system to each environmental impact indexes (PED, CO2, COD, IWU, NH3-N, NOx, and SO2) and the contribution analysis of each environmental impact type to each process stage.
3.4.1 Contribution to the Total Index
The contribution percentage of each stage to the comprehensive index ECER-135 is shown in Fig. 4. It can be seen from Fig. 4 that the manufacturing phase of the entire NORC system has the greatest environmental impact, and its contribution to the comprehensive index ECER-135 is 140.75%. In the manufacturing stage, the production process of NORC components contributed the most, accounting for 137.74%; the preparation process of R141b accounted for 2.85% of the comprehensive index; while the preparation process of Al2O3 nanoparticles had little impact on the environment, accounting for only 0.16% of the comprehensive index. The retirement stage of the NORC system plays a very important role in the whole life cycle, producing 43.73% of good environmental benefits, indicating that the recycling of heat exchanger tubes plays an important role in the environmental impact of the system. In addition, the construction and transportation phase also contributed 2.98% of the environmental impact.

Figure 4: Contribution of each unit stage to the total index as percentage
The contribution percentage of each characteristic indicator to the comprehensive indicator ECER-135 is shown in Fig. 5. It can be seen from the figure that among the seven characteristic indexes of ECER-135, the contribution of PED and NOx is the largest, both accounting for 21.3%, followed by SO2, COD, CO2 and IWU, accounting for 18.9%, 15.5%, 14.9% and 6.7%, respectively, while the contribution of NH3-N is the smallest, accounting for only 1.5% of the total.

Figure 5: Contribution of characteristic indicators to the total index (ECER-135) as percentage
3.4.2 Contribution to the Characterization Indexes
The result of analyzing the contribution of seven characteristic indexes of comprehensive index ECER-135 is shown in Fig. 6. The contribution of the manufacturing stage to each characterization index is still the largest; as PED, CO2 and SO2 are greatly affected by the consumption of high energy consuming products and power demand, the contribution proportion of each process stage to them is relatively close; among all characterization indexes, the environmental impact of construction and transportation stage on NH3-N is the largest, reaching 12.92%, which is attributed to the use of gasoline in the transportation process of various parts of the NORC system, while the impact of retirement stage on the good environment of NH3-N is the least, which is 14.59%, mainly because the impact of recycled steel on the environment of NH3-N is small.

Figure 6: Contribution of each unit stage to the the characterization indexes of NORC system
The contribution of each characteristic indexes to the environmental impact percentage of each stage of the NORC system is shown in Fig. 7.

Figure 7: Contribution of characteristic indexes to each unit stage of NORC system as percentage
As shown in the figure that NH3-N contributed the most in the construction and decommissioning transportation stages, followed by NOx; SO2 contributed the least and followed by IWU. SO2 makes a great contribution to R141b manufacturing and nanoparticles manufacturing, mainly due to the power consumption. The contribution of the seven environmental impact indexes in the steel recovery stage and ORC system component production stage is very similar, almost equally divided into two stages.
Once the inventory data (Inventoryj) changes, the LCA results will change. Sensitivity analysis is to analyze the sensitivity (Sensitivityij) of inventory data to each index (Indexi) and identify the most effective improvement points with the improvement potential estimation. Sensitivity is defined as the index change rate (ΔIndexi/Indexi) caused by the unit change rate of inventory data (ΔInventoryj/Inventoryj). The ratio of the two is the sensitivity, as shown in formula (42). If the calculation result shows high sensitivity, it means that it is the direction and focus of improvement.
3.5.1 Sensitivity Analysis for the Total Environmental Impact Index
The sensitivity analysis list is shown in Table 8, which only shows the first few items with the highest sensitivity in each process of NORC system life cycle.
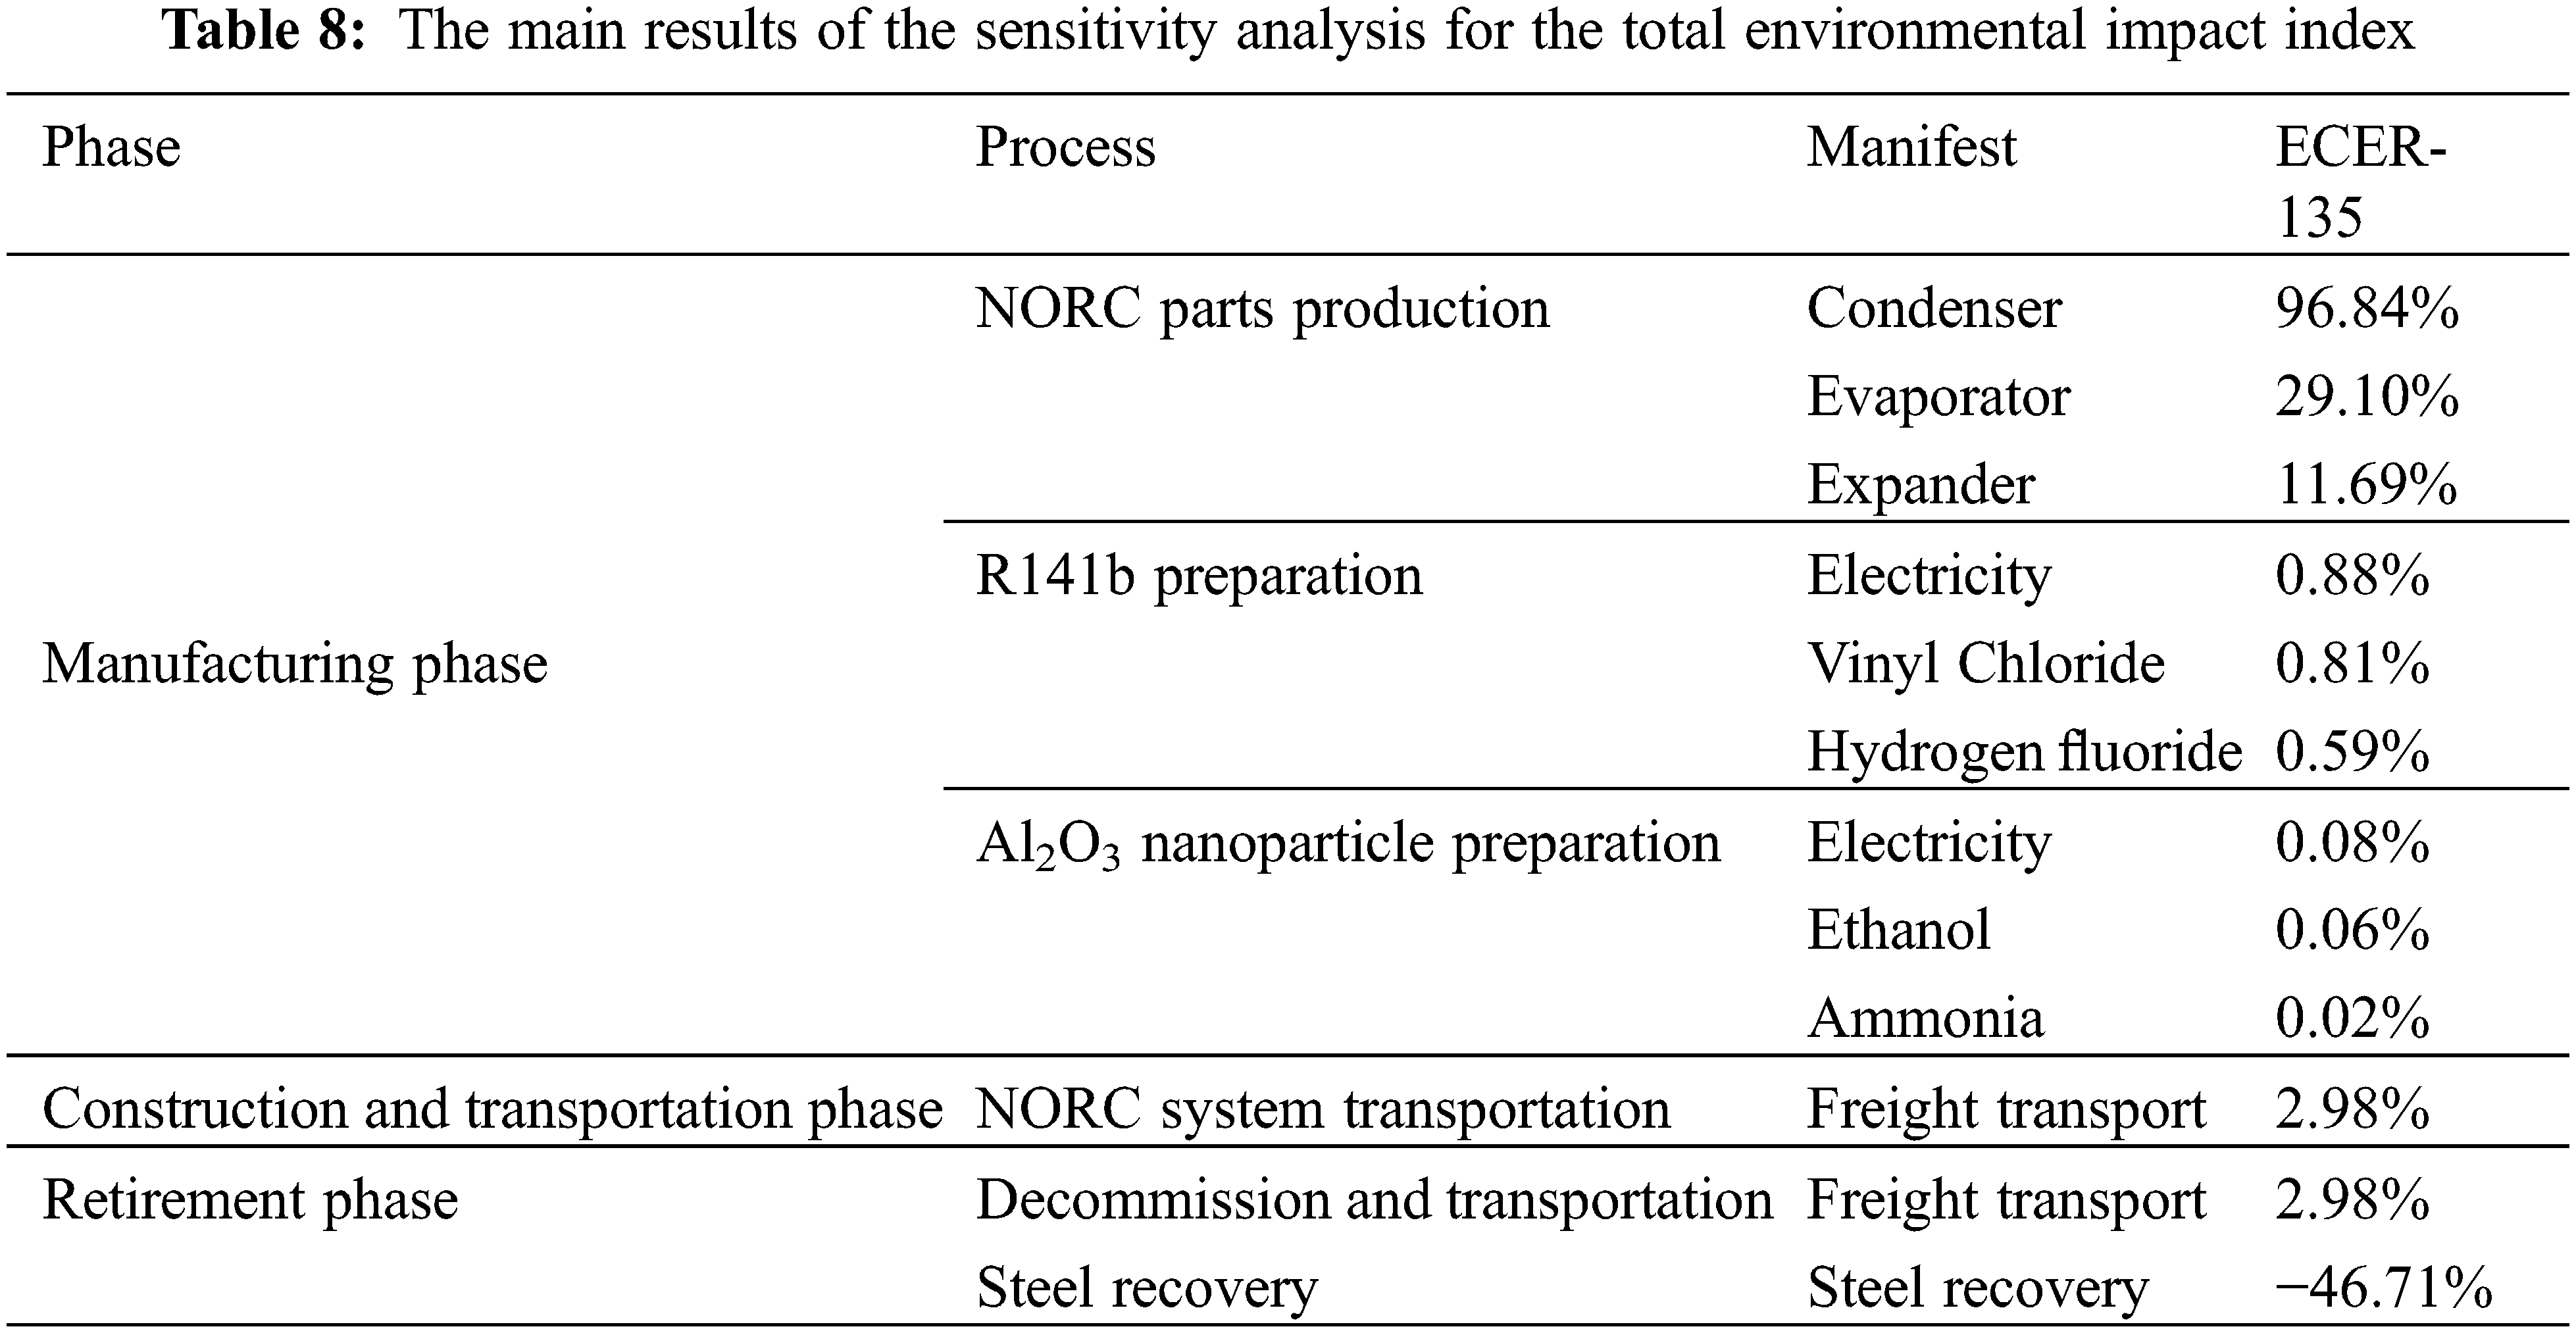
As shown in Table 8 that the highest sensitivity to the comprehensive indexes is the condenser, evaporator and expander in the production process of NORC components in the manufacturing stage, which are 96.84%, 29.10% and 11.69%, respectively; the second highest is the freight transport process, which is 2.98%; followed by the consumption of electric energy and vinyl chloride in the preparation process of R141b, which are 0.88% and 0.81%, respectively; in contrast, the sensitivity of Al2O3 nanoparticles is very small; while the sensitivity of retirement phase is relatively high, which is −46.71%. Obviously, the production of NORC components, especially the condenser, has a great negative environmental impact, while the retirement stage has a significant positive impact through steel recovery.
3.5.2 Sensitivity Analysis for the Characterization Indexes
The results of sensitivity analysis of characteristic indexes are shown in Table 9, which gives a list with sensitivity of more than 1% for each characteristic index.

Combined with the previous life cycle impact analysis, this paper aims to reduce the comprehensive environmental impact, and put forward the improvement direction and key points of certain stages in the whole life cycle of NORC system.
The process stage, which makes a great contribution to the environmental impact indicators and the list of substances with high sensitivity, are the key points to reduce the environmental impact. For the production process of NORC components, the goal should be to reduce the use of steel, especially for the condenser. The heat transfer area of the heat exchanger determines the amount of steel to be used. To transfer the same amount of heat, the area of the heat exchanger is related to two factors, the total heat transfer coefficient and the logarithmic mean temperature difference. The total heat transfer coefficient is determined by the heat transfer coefficient of the working medium inside and outside the tube under working conditions. Therefore, the heat source and cold source working medium with high heat transfer coefficient are selected to make the heat transfer coefficient of the working medium outside the tube close to the working medium inside the tube. Under this condition, it is very meaningful to select the nanorefrigerant which can enhance the maximum heat transfer performance, so as to improve the overall heat transfer coefficient significantly. The increase of logarithmic mean temperature difference is related to the system working condition, so it is necessary to optimize the system working condition. In addition, optimizing the design of the heat exchanger and changing the type of materials for the heat exchanger can also change the environmental impact. Besides, the appropriate software or calculation method can be selected to get a more comprehensive optimization scheme, so that the size of the expander can be reduced under the premise of large work output. In the preparation process of R141b, attention should be paid to save electricity, improve productivity, and reduce the use of vinyl chloride and hydrogen fluoride, or adopt other cleaner and ecological preparation methods. It can be summarized as the following four ways: 1. Select the appropriate software or calculation method to get a comprehensive working condition optimization scheme; 2. Optimize the design of heat exchanger; 3. Explore better heat transfer performance of heat source transition working medium, cold source working medium and nanorefrigerant; 4. Optimize the preparation process of R141b.
The results of LCA comparison between other energy sources and NORC system are shown in Fig. 8. With the help of eBalance v4.7 software, the same system boundary and functional unit (generating 1 kWh) are selected based on the same model method and comprehensive indexes. The data of national grid average electricity, coal-fire generated electricity and hydropower generated electricity are from CLCD database, and the remaining data are from ELCD and Ecoinvent database.
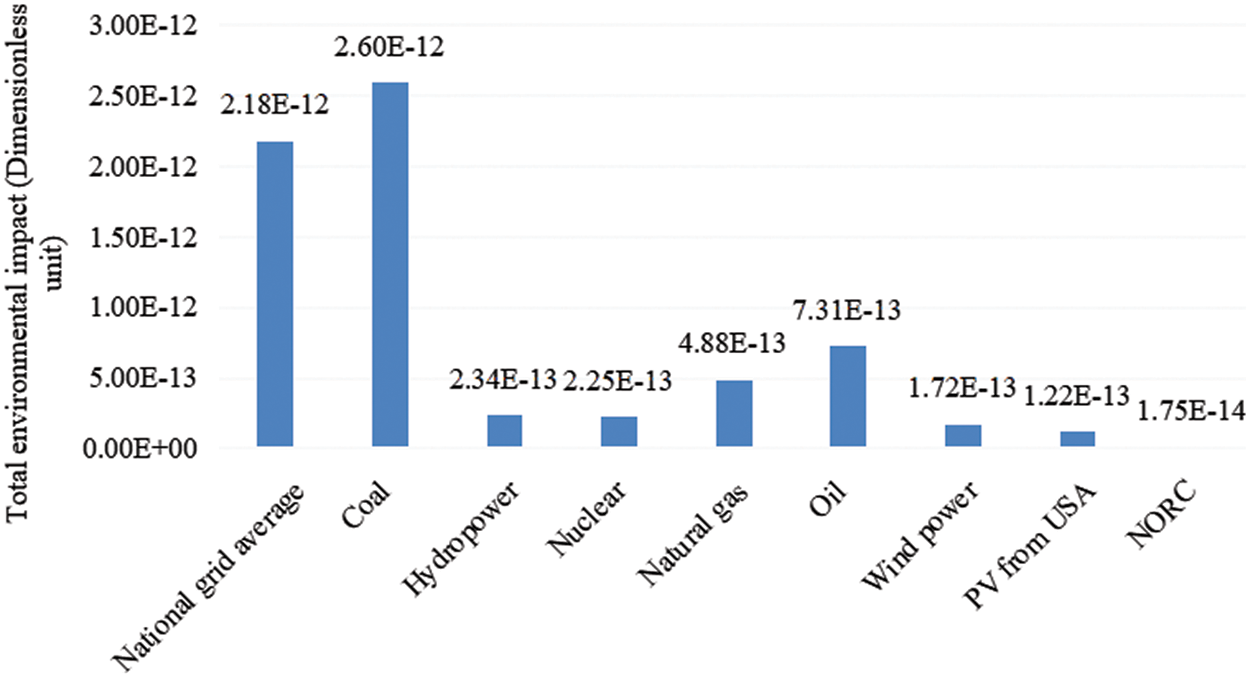
Figure 8: Comparison between total environmental impact indexes in the other power generation and NORC system
As shown in the figure, in the comparison with both the traditional fossil energy and the renewable energy, the environmental impact of NORC system power generation is the smallest, only 0.67% of coal-fired power generation, and 14.34% of photovoltaic power generation in the United States, which has the smallest environmental impact among other energy generation. This shows that vigorously developing low-temperature waste heat power generation of NORC system and striving to reduce the proportion of thermal power in the power generation system is in line with the 13th Five-Year plan of energy conservation and emission reduction in China. At the same time, the environmental advantages of power generation of NORC system with Al2O3/R141b as the circulating working medium are quantified.
LCA has been performed on the ORC system which uses nanorefrigerant as its cyclic working medium. The main findings are as follows:
1) With the addition of Al2O3 nanoparticles to R141b, the comprehensive environmental impact index of ECER-135 decreased by 1.50%. The total energy consumption of the system is 64,770.3763 MJ, and the energy recovery period is 0.54 years, which only accounts for 2.70% of the 20-year service life of the ORC system.
2) In the 20-year life cycle of NORC system, compared with the national average power grid, the total emission of five main pollutants including CO2 is reduced by 5.80 × 10⁵ kg, the industrial water consumption is saved by 2.04 × 10⁶ kg, and the primary energy is saved by 8.21 × 10⁶ MJ.
3) In the whole life cycle of the NORC system, the manufacturing stage has the greatest impact on the comprehensive environment and the most contribution to the characterization indexes. In the manufacturing stage, the production process of ORC components has the largest contribution to the overall environmental impact, while other processes have relatively small contributions, especially the preparation process of Al2O3 nanoparticles.
4) In the production process of ORC components, the manufacturing process of evaporator, condenser and expander have the greatest impact on the environment, mainly due to the extensive use of steel. In order to reduce the environmental load, we should optimize the system working conditions, improve the component structure and explore nanorefrigerant with better heat transfer performance.
5) Compared with traditional fossil energy and renewable energy, the NORC system has the smallest environmental impact, which is only 0.67% of coal-fire generated electricity and 14.34% of photovoltage generated electricity of the United States, indicating that the NORC system has obvious environmental advantages.
Funding Statement: We acknowledge the support of Kunming University of Science and Technology Talent Introduction Research Startup Fund Project in 2020, China (No. KKZ3202052058) and the support of Scientific Research Fund from Yunnan Education Department in China (No. 2022J0064).
Conflicts of Interest: The authors declare that they have no conflicts of interest to report regarding the present study.
References
1. Wang, C., Huang, X., Chen, H. Q., Liang, W. J. (2021). A study for the inflfluence of the location of PCMs assembly system on improving thermal environment inside disaster-relief temporary houses. Journal of Renewable Materials, 9(7), 1239–1252. DOI 10.32604/jrm.2021.014746. [Google Scholar] [CrossRef]
2. Martinopoulos, G. (2020). Are rooftop photovoltaic systems a sustainable solution for Europe? A life cycle impact assessment and cost analysis. Applied Energy, 257(3), 114035. DOI 10.1016/j.apenergy.2019.114035. [Google Scholar] [CrossRef]
3. World Meteorological Organization (2021). State of the global climate 2020. [Google Scholar]
4. Liu, J., Zhou, Y. K., Yang, H. X., Wu, H. J. (2022). Uncertainty energy planning of net-zero energy communities with peer-to-peer energy trading and green vehicle storage considering climate changes by 2050 with machine learning methods. Applied Energy, 321(8), 119394. DOI 10.1016/j.apenergy.2022.119394. [Google Scholar] [CrossRef]
5. Njock, J. P., MNgangue, M. N., Biboum, A. C., Sosso, O. T., Nzengwa, R. (2022). Investigation of an Organic Rankine Cycle (ORC) incorporating a heat recovery water-loop: Water consumption assessment. Thermal Science and Engineering Progress, 22, 101303. [Google Scholar]
6. Chen, H. J., Goswami, D. Y., Stefanakos, E. K. (2010). A review of thermodynamic cycles and working mediums for the conversion of lowgrade heat. Renewable and Sustainable Energy Reviews, 14(9), 3059–3067. DOI 10.1016/j.rser.2010.07.006. [Google Scholar] [CrossRef]
7. Uusitalo, A., Honkatukia, J., Turunen-Saaresti, T., Grönman, A. (2018). Thermodynamic evaluation on the effect of working medium type and fluids critical properties on design and performance of organic rankine cycles. Journal of Cleaner Production, 188(3), 253–263. DOI 10.1016/j.jclepro.2018.03.228. [Google Scholar] [CrossRef]
8. He, C., Liu, C., Gao, H., Xie, H., Li, Y. R. (2012). The optimal evaporation temperature and working mediums for subcritical organic rankine cycle. Energy, 38(1), 136–143. DOI 10.1016/j.energy.2011.12.022. [Google Scholar] [CrossRef]
9. Molana, M., Wang, H. L. (2020). A critical review on numerical study of nanorefrigerant heat transfer enhancement. Powder Technology, 368(6), 18–31. DOI 10.1016/j.powtec.2020.04.044. [Google Scholar] [CrossRef]
10. Sun, B., Yang, D. (2013). Experimental study on the heat transfer characteristics of nanorefrigerants in an internal thread copper tube. International Journal of Heat and Mass Transfer, 64(4), 559–566. DOI 10.1016/j.ijheatmasstransfer.2013.04.031. [Google Scholar] [CrossRef]
11. Yang, D., Sun, B., Li, H. W., Fan, X. C. (2015). Experimental study on the heat transfer and flow characteristics of nanorefrigerants inside a corrugated tube. International Journal of Refrigeration, 56(2), 213–223. DOI 10.1016/j.ijrefrig.2015.04.011. [Google Scholar] [CrossRef]
12. Sun, B., Wang, H. L., Yang, D. (2018). Effects of surface functionalization on the flow boiling heat transfer characteristics of MWCNT/R141b nanorefrigerants in smooth tube. Experimental Thermal and Fluid Science, 92, 162–173. [Google Scholar]
13. Alawi, O. A., Sidik, N. A. C., Kherbeet, A. S. (2015). Measurements and correlations of frictional pressure drop of TiO2/R123 flow boiling inside a horizontal smooth tube. International Communications in Heat and Mass Transfer, 61, 42–48. [Google Scholar]
14. Alawi, O. A., Sidik, N. A. C. (2014). Influence of particle concentration and temperature on the thermophysical properties of CuO/R134a nanorefrigerant. International Communications in Heat and Mass Transfer, 58, 79–84. [Google Scholar]
15. Mahbubul, I. M., Fadhilah, S. A., Saidur, R., Leong, K. Y., Amalina, M. A. (2013). Thermophysical properties and heat transfer performance of Al2O3/R-134a nanorefrigerants. International Journal of Heat and Mass Transfer, 57(1), 100–108. [Google Scholar]
16. Parsa, S. M., Yazdani, A., Aberoumand, H., Farhadi, Y., Ansari, A. et al. (2022). A critical analysis on the energy and exergy performance of photovoltaic/thermal (PV/T) system: The role of nanofluids stability and synthesizing method. Sustainable Energy Technologies and Assessments, 51, 101887. [Google Scholar]
17. Lin, L. N., Peng, H., Ding, G. L. (2018). Model for predicting particle size evolution during nanoparticle aggregation in refrigerant-oil mixture. International Journal of Heat and Mass Transfer, 119, 91–104. [Google Scholar]
18. Dey, P., Mandal, B. K. (2021). Performance enhancement of a shell-and-tube evaporator using Al2O3/R600a nanorefrigerant. International Journal of Heat and Mass Transfer, 170, 121015. [Google Scholar]
19. Praveen, B. R., Javeed, S., Joe, J. R., Padmanathan, P., Satheesh, A. (2021). A critical review on nanorefrigerants: Boiling, condensation and tribological properties. International Journal of Refrigeration, 128, 139–152. [Google Scholar]
20. Darzi, M., Sadoughi, M. K., Sheikholeslami, M. (2018). Condensation of nano-refrigerant inside a horizontal tube. Physica B: Condensed Matter, 537, 33–39. [Google Scholar]
21. Sheikholeslami, M., Darzi, M., Sadoughi, M. K. (2018). Heat transfer improvement and pressure drop during condensation of refrigerant-based nanoflfluid; an experimental procedure. International Journal of Heat and Mass Transfer, 122, 643–650. [Google Scholar]
22. Sheikholeslami, M., Rezaeianjouybari, B., Darzi, M., Shafee, A., Li, Z. et al. (2019). Application of nano-refrigerant for boiling heat transfer enhancement employing an experimental study. International Journal of Heat and Mass Transfer, 141, 974. [Google Scholar]
23. Mahbubul, I. M., Khaleduzzaman, S. S., Saidur, R., Amalina, M. A. (2014). Rheological behavior of Al2O3/R141b nanorefrigerant. International Journal of Heat and Mass Transfer, 73, 118–123. [Google Scholar]
24. Boyaghchi, F. A., Chavoshi, M. (2017). Multi-criteria optimization of a micro solar-geothermal CCHP system applying water/CuO nanofluid based on exergy, exergoeconomic and exergoenvironmental concepts. Applied Thermal Engineering, 112, 660–675. [Google Scholar]
25. Huang, H. Z., Zhu, J., Yan, B. (2016). Comparison of the performance of two different Dual-Loop Organic Rankine Cycles (DORC) with nanofluid for engine waste heat recovery. Energy Conversion and Management, 126, 99–109. [Google Scholar]
26. Boyaghchi, F. A., Chavoshi, M., Sabeti, V. (2015). Optimization of a novel combined cooling, heating and power cycle driven by geothermal and solar energies using the water/CuO (copper oxide) nanofluid. Energy, 91, 685–699. [Google Scholar]
27. Sardarabadi, M., Passandideh-Fard, M., Heris, S. Z. (2014). Experimental investigation of the effects of silica/water nanofluid on PV/T (photovoltaic thermal units). Energy, 66(1), 264–272. [Google Scholar]
28. Istrate, I. R., Juan, R., Martin-Gamboa, M., Domínguez, C., García-Munoz, R. A. et al. (2021). Environmental life cycle ssessment of the incorporation of recycled high-density polyethylene to olyethylene pipe grade resins. Journal of Cleaner Production, 319, 128580. DOI 10.1016/j.jclepro.2021.128580. [Google Scholar] [CrossRef]
29. Ding, Y., Liu, C., Zhang, C., Xu, X. X., Li, Q. B. et al. (2018). Exergoenvironmental model of Organic Rankine Cycle system including the manufacture and leakage of working medium. Energy, 145(7), 52–64. DOI 10.1016/j.energy.2017.12.123. [Google Scholar] [CrossRef]
30. Fergani, Z., Touil, D., Morosuk, T. (2016). Multi-criteria exergy based optimization of an Organic Rankine Cycle for waste heat recovery in the cement industry. Energy Conversion and Management, 112, 81–90. DOI 10.1016/j.enconman.2015.12.083. [Google Scholar] [CrossRef]
31. Wang, H. R., Xu, J. L., Yang, X. F., Miao, Z., Yu, C. (2015). Organic Rankine Cycle saves energy and reduces gas emissions for cement production. Energy, 86(10), 59–73. DOI 10.1016/j.energy.2015.03.112. [Google Scholar] [CrossRef]
32. Prajapati, P. P., Patel, V. K. (2020). Thermo-economic optimization of a nanofluid based Organic Rankine Cycle: A multi-objective study and analysis. Thermal Science and Engineering Progress, 17(14–15), 100381. DOI 10.1016/j.tsep.2019.100381. [Google Scholar] [CrossRef]
33. Kosmadakis, G., Neofytou, P. (2020). Investigating the performance and cost effects of nanorefrigerants in a low-temperature ORC unit for waste heat recovery. Energy, 204, 117966. [Google Scholar]
34. Dey, P., Kumar Mandal, B. (2021). Performance enhancement of a shell-and-tube evaporator using Al2O3/R600a nanorefrigerant. International Journal of Heat and Mass Transfer, 170, 121015. [Google Scholar]
35. Yue, D., You, F., Darling, S. B. (2014). Domestic and overseas manufacturing scenarios of silicon-based photovoltaics: Life cycle energy and environmental comparative analysis. Solar Energy, 105, 669–678. [Google Scholar]
36. Uusitalo, A., Honkatukia, J., Saaresti, T. T., Grönman, A. (2018). Thermodynamic evaluation on the effect of working medium type and fluids critical properties on design and performance of Organic Rankine Cycles. Journal of Cleaner Production, 188, 253–263. [Google Scholar]
37. Guo, T., Wang, H. X., Zhang, S. J. (2011). Fluids and parameters optimization for a novel cogeneration system driven by low-temperature geothermal sources. Energy, 36, 2639–2649. [Google Scholar]
38. Somayaji, C., Chamra, L. M., Mago, P. J. (2007). Performance analysis of different working mediums for use in organic rankine cycles. Proceedings of the Institution of Mechanical Engineers, Part A: Journal of Power and Energy, 221(3), 255–263. [Google Scholar]
39. Zhang, X., Bai, H., Zhao, X. C. (2018). Multi-objective optimisation and fast decision-making method for working medium selection in Organic Rankine Cycle with low-temperature waste heat source in industry. Energy Conversion and Management, 172, 200–211. [Google Scholar]
40. Zhang, S. Y., Yu, Y. N., Xu, Z., Huang, H., Liu, Z. N. et al. (2020). Measurement and modeling of the thermal conductivity of nanorefrigerants with low volume concentrations. Thermochimica Acta, 688, 178603. [Google Scholar]
41. Zhang, S. Y., Li, Y., Xu, Z., Liu, C., Liu, Z. et al. (2022). Experimental investigation and intelligent modeling of thermal conductivity of R141b based nanorefrigerants containing metallic oxide nanoparticles. Powder Technology, 395, 850–871. [Google Scholar]
42. Jiang, F., Zhu, J. L., Xin, G. L. (2018). Experimental investigation on Al2O3-R123 nanorefrigerant heat transfer performances in evaporator based on Organic Rankine Cycle. International Journal of Heat and Mass Transfer, 127, 145–153. [Google Scholar]
43. Diao, A. A. (2018). Research on the characteristics of the ORC system for marine diesel engine exhaust energy recovery with oil-free screw expander (Ph.D. Thesis). China Ship Research and Development Academy, Shanghai, China. [Google Scholar]
44. Liu, B. T., Chien, K. H., Wang, C. C. (2004). Effect of working mediums on organic rankine cycle for waste heat recovery. Energy, 29(8), 1207–1217. [Google Scholar]
45. Zhang, X. J., Wang, F., Li, L., Li, F., Zhao, N. et al. (2018). Design and economic evaluation of temperature swing adsorption process for CO2 capture from power plant flue gas. Petrochemical technology, 47(4), 65–70. [Google Scholar]
46. Liu, G. L., Xu, J. L., Miao, Z. (2015). Geothermal organic rankin cycle system hybrid quality optimization. Journal of Engineering Thermophysics, 36(12), 2716–2720. [Google Scholar]
47. Zhou, S. (2014). Optimization and matching analysis of pinch point temperature difference in evaporator and condenser for organic Rankine cycle system (Master Thesis). Chongqing University, Chongqing, China. [Google Scholar]
48. Yan, J. D. (1982). Thermodynamic principles and formulas for choosing working fluids and parameters in designing power plant of low temperature heat. Journal of Engineering Thermophysics, 3(1), 1–7. [Google Scholar]
49. Fergani, Z., Touil, D., Morosuk, T. (2016). Multi-criteria exergy based optimization of an Organic Rankine Cycle for waste heat recovery in the cement industry. Energy Conversion and Management, 112, 81–90. [Google Scholar]
50. Shi, Y. (2015). Performance study and optimization of organic ranking cycle using medium and low temperature heat (Master Thesis). Harbin Institute of Technology, Harbin, China. [Google Scholar]
51. Zhang, S. Y. (2017). Heat transfer mechanism and application of nano-organic working medium in organic rankine cycle (Ph.D. Thesis). Kunming University of Science and Technology, Kunming, China. [Google Scholar]
52. Zhou, Q. M., Huang, S. Y., Ye, J. G. (2004). Research on the new reflux rod shell heat exchanger. Changsha Electric Power College Journal (Natural Science Edition), 19(3), 76–79. [Google Scholar]
53. Shah, M. M. (1979). A general correlation for heat transfer during film condensation inside pipes. International Journal of Heat and Mass Transfer, 22(4), 547–556. DOI 10.1016/0017-9310(79)90058-9. [Google Scholar] [CrossRef]
54. Akhavan, M. A., kumarr, R., Salimpour, M. R., Azimi, R. (2010). Pressure drop and heat transfer augmentation due to coiled wire inserts during laminar flow of oil inside a horizontal tube. International Journal of Thermal Sciences, 49(2), 373–379. DOI 10.1016/j.ijthermalsci.2009.06.004. [Google Scholar] [CrossRef]
55. Zhang, H. L., Guan, X., Ding, Y., Liu, C. (2018). Emergy analysis of Organic Rankine Cycle (ORC) for waste heat power generation. Journal of Cleaner Production, 183, 1207–1215. DOI 10.1016/j.jclepro.2018.02.170. [Google Scholar] [CrossRef]
56. Ding, Y., Liu, C., Zhang, C., Xu, X. X., Li, Q. B. et al. (2018). Exergoenvironmental model of Organic Rankine Cycle system including the manufacture and leakage of working medium. Energy, 145(7), 52–64. DOI 10.1016/j.energy.2017.12.123. [Google Scholar] [CrossRef]
57. (1993). Produced by 1,1- vinyl dichloroethylene liquid phase fluorination 1,1- dichloro -1 one fluoroethane (P). China. Disclosure manual for patent applications for inventions. 92114577.2. [Google Scholar]
58. Xie, X. Z. (2016). Active carbon catalysis 1,1,2-Hydrogen chloride phase dechlorination of triclosan gas preparation biased vinyl chloride performance study (Master Thesis). Zhejiang University of Technology, Zhejiang, China. [Google Scholar]
59. Ma, X. Y. (2018). Preparation and characterization of γ alumina nanoparticles (Master Thesis). Zhejiang University of Technology, Zhejiang, China. [Google Scholar]
60. Yang, J. H. (2010). Analysis of the energy repayment time of photovoltaic system. Shanghai Energy Saving, 1, 11–14. [Google Scholar]
Cite This Article
 Copyright © 2023 The Author(s). Published by Tech Science Press.
This work is licensed under a Creative Commons Attribution 4.0 International License , which permits unrestricted use, distribution, and reproduction in any medium, provided the original work is properly cited.
 Downloads
 Citation Tools