
 Submit a Paper
 Propose a Special lssue
 Open Access
ARTICLE

Study on Hydrogen Storage Properties, Anti-Oxide Ability and Rate Limiting Step of ZrCr-Based Alloy after Introducing Cobalt as Additive
1 Jiangxi Key Laboratory for Mass Spectrometry and Instrumentation, East China University of Technology, Nanchang, 330013, China
2 Jiangxi Province Key Laboratory of Polymer Micro/Nano Manufacturing and Devices, East China University of Technology, Nanchang, 330013, China
3 Engineering Research Center of Nuclear Technology Application (East China University of Technology), Ministry of Education, Nanchang, 330013, China
4 School of Innovation and Entrepreneurship Education, East China University of Technology, Nanchang, 330013, China
* Corresponding Author: Peng Lv. Email:
(This article belongs to the Special Issue: Advanced Renewable Energy Storage Materials and Their Composite: Preparation, Characterization and Applications)
Journal of Renewable Materials 2023, 11(3), 1383-1400. https://doi.org/10.32604/jrm.2022.023261
Received 25 April 2022; Accepted 27 May 2022; Issue published 31 October 2022
 View Full Text
 Download PDF
Abstract
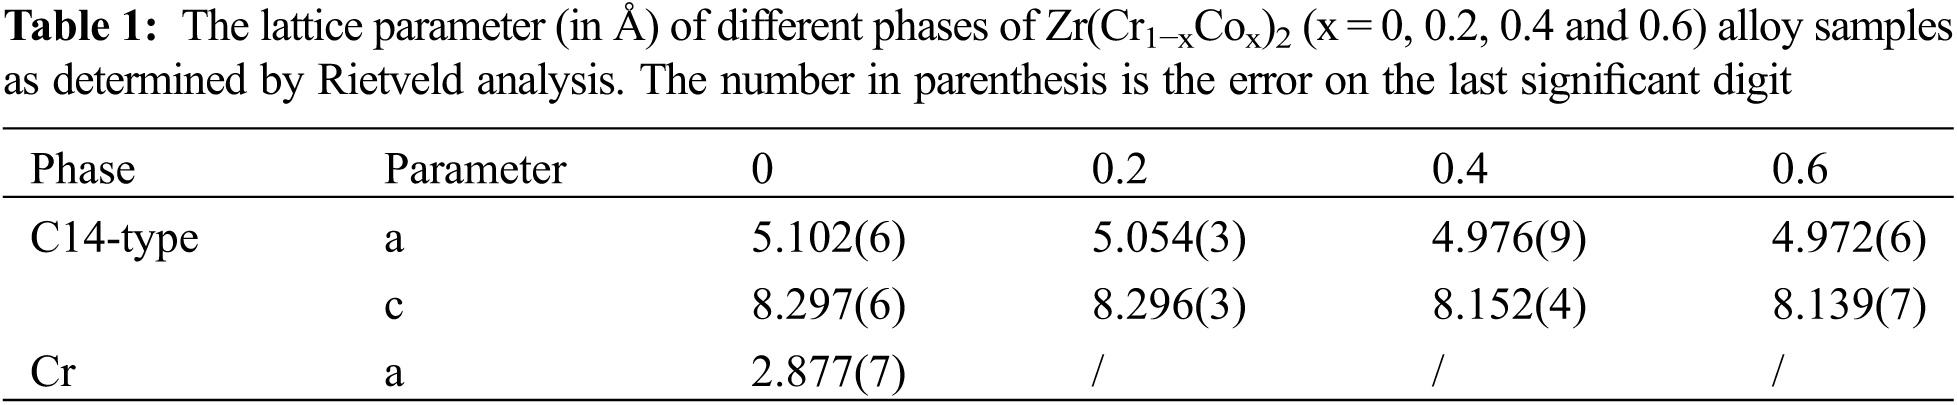
In this work, the microstructure, hydrogen storage properties, anti-oxide ability and rate limiting step of Zr(Cr1−xCox)2 (x = 0, 0.2, 0.4 and 0.6) alloys have been investigated. After studying the crystal structure, we found that all alloy samples could show C14-type phase but the alloy sample x = 0 could also show a small amount of Cr phase. Rietveld fitting showed that lattice parameter and unit cell volume of C14-type phase decreased with increasing x. After further research, it was clear that the first hydrogen absorption capacity decreased with increasing x. But introducing more Co content had a positive influence on the effective hydrogen storage capacity and cyclic hydrogen absorption and desorption properties of the alloy sample. We also found that adding Co to ZrCr2 alloy could improve its anti-oxide ability. In addition to this, the rate limiting step model was also studied.Keywords
Hydrogen is considered to be one of the most promising clean energy [1–5]. But in order to successfully promote the application of hydrogen energy, we should take care of the issue of hydrogen storage [6]. AB2 alloys are considered as excellent hydrogen storage materials for hydrogen storage applications because of their availability of high interstitial sites in their crystal structure. Among AB2 alloys, ZrCr2 alloy is viewed as a decent material for solid state hydrogen storage technology because of its relatively excellent hydrogen storage capacity. However, this alloy has some drawbacks in its application, such as the difficulty during its first hydrogenation process (usually also called activation) and the formation of stable hydrides at room temperature. Thus, one way to apply this alloy in practical applications is to make its first hydrogenation process possible under mild conditions. The other way is to reduce the stability of its hydrides [7–10].
In order to further improve the hydrogen storage properties and reduce the stability of hydrides, various elements including Mn, Fe, Co, Ni, Cu, Si, Ge have been introduced to ZrCr2 alloy [8–15]. In the earliest days, Drasner et al. [16] conducted in-depth research on Zr-Cr system hydrogen storage alloys. They prepared Zr(Cr1−xCux)2 alloys (x = 0.1, 0.3 and 0.5) and uncovered that the desorption plateau pressure increased but the hydrogen capacity decreased with increasing Cu content. Drasner et al. [17] also synthesized Zr(Cr1−xNix)2 alloys (x = 0.125, 0.25, 0.375 and 0.5) and revealed that replacing Cr by Ni could not affect the crystal structure of ZrCr2 alloy. Later, Bulyk et al. [14] studied the impact of Ti on the hydrogen-induced phase-structure transformations in ZrCr2 intermetallic compound. They found that the partial replacement of zirconium by titanium in ZrCr2 intermetallic compound resulted in the increase of its stability in hydrogen. Recently, Bodega et al. [18] synthesized ZrCr2 laves phases and investigated the thermodynamic stability of their hydrides. Ahmad et al. [19] used the in-situ NMR technology to study the hydrogenation and dehydrogenation of ZrCr2 alloy. Erika et al. [10] got ZrCr1−xNiMox alloys to systematically investigate its electrochemical and metallurgical characterization. Merlino et al. [9] adopted the density functional calculations to research the total energy, electronic structure and bond of Zr(Cr0.5Ni0.5)2 intermetallic compound. Ha et al. [20] prepared TiFe–ZrCr2 alloy and studied the hydrogen storage behavior and microstructural feature.
In previous studies, we found that adding or replacing Co was an important way to enhance the hydrogen storage properties of alloys [21–25]. At early stages, Hirosawa et al. [26] prepared Zr(Cr1−xCox)2 alloys to investigate the influence of adding Co on the magnetic properties. Soubeyroux et al. [27] also prepared Zr(Cr1−xMx)2 (M = Mn, Fe, Co, Ni, Cu) alloy to investigate the binding energies and electronic structure with different M. However, they did not deeply study the change in the hydrogen storage properties of ZrCr2 hydrogen storage alloys after Co replaced Cr. In addition, we also found that ZrCr2 hydrogen storage alloys handled by element substitution still required prior heat treatment and hydrogen exposure before it could absorb and desorb the hydrogen normally. For the above reasons, we believed that it was important to investigate the influence of introducing Co on the microstructure, hydrogen storage properties, anti-oxide ability and rate limiting step of ZrCr2 alloy.
Zhongnuo Advanced Material (Beijing) Technology Co., Ltd. (China) provided the metal raw materials including Zr element (99.5%), Cr element (99.9%) and Co element (99.9%). The Zr(Cr1−xCox)2 (x = 0, 0.2, 0.4 and 0.6) alloy samples were prepared by using arc melting equipment (SP-MSM20–7, Shenyang Kejing Co., Ltd., China) under argon atmosphere. Before the arc melting, raw metal materials were mixed at the proper ratio. In the process of arc melting, in order to obtain the alloy sample with uniform composition, we used the method of turning the alloy sample several times. The schematic diagram of the preparation process of Zr(Cr1−xCox)2 (x = 0, 0.2, 0.4 and 0.6) alloy samples is shown in Fig. 1.
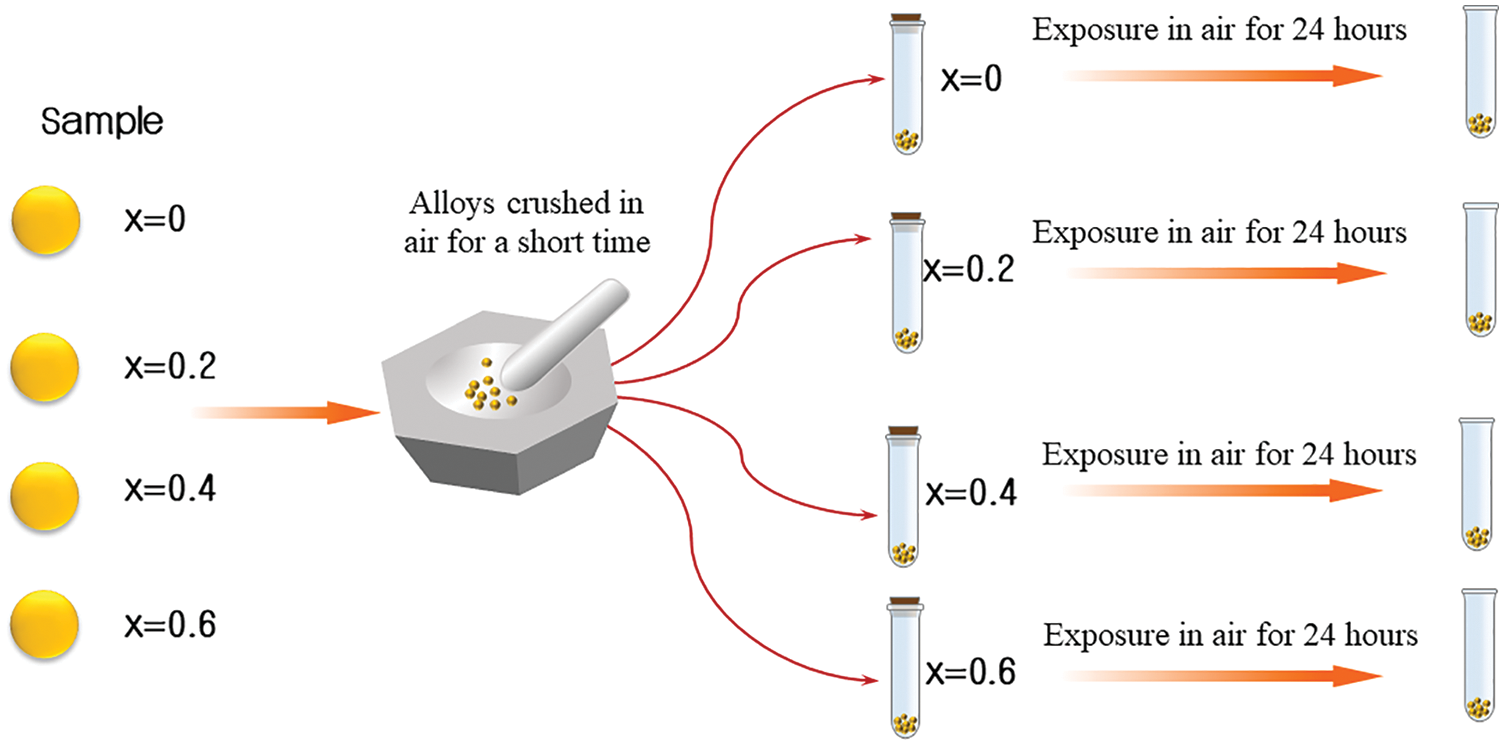
Figure 1: Schematic diagram of the preparation process of Zr(Cr1−xCox)2 (x = 0, 0.2, 0.4 and 0.6) alloy samples
We used a Bruker D8 Advance X-ray diffractometer (XRD) to characterize the crystal structure of the alloy samples. In order to obtain the lattice parameters of different phases, we introduced the Rietveld refinement method (Maud software) to analyze the XRD pattern [28]. In order to obtain the phase distribution and elemental distribution of the alloy samples, we measured the alloy samples using a Hitachi SU8010 Field Emission Scanning Electron Microscope (SEM). In order to obtain the hydrogen absorption and desorption properties of the alloy samples, we used a self-made Sieverts type hydrogen storage test device. The alloy samples needed to be evacuated in the sample holder at room temperature for 0.5 h before the hydrogen absorption test.
The backscattered electron micrograph of Zr(Cr1−xCox)2 (x = 0, 0.2, 0.4 and 0.6) alloy samples was shown in Fig. 2a. It was clear from Fig. 2a that except for the alloy sample x = 0 exhibiting a two-phase structure, all other alloy samples had only one phase. Similarly, Kanazawa et al. [29] also found that the microstructure of Zr-Cr alloys had two-phase or one-phase morphology structure. In order to further determine the element distribution in these alloy samples with only one phase, the element distribution map of the alloy samples x = 0.2, 0.4 and 0.6 were shown in Figs. 2b–2d. We could clearly see that all elements including Zr, Cr and Co were evenly distributed in all corners of the alloy samples.
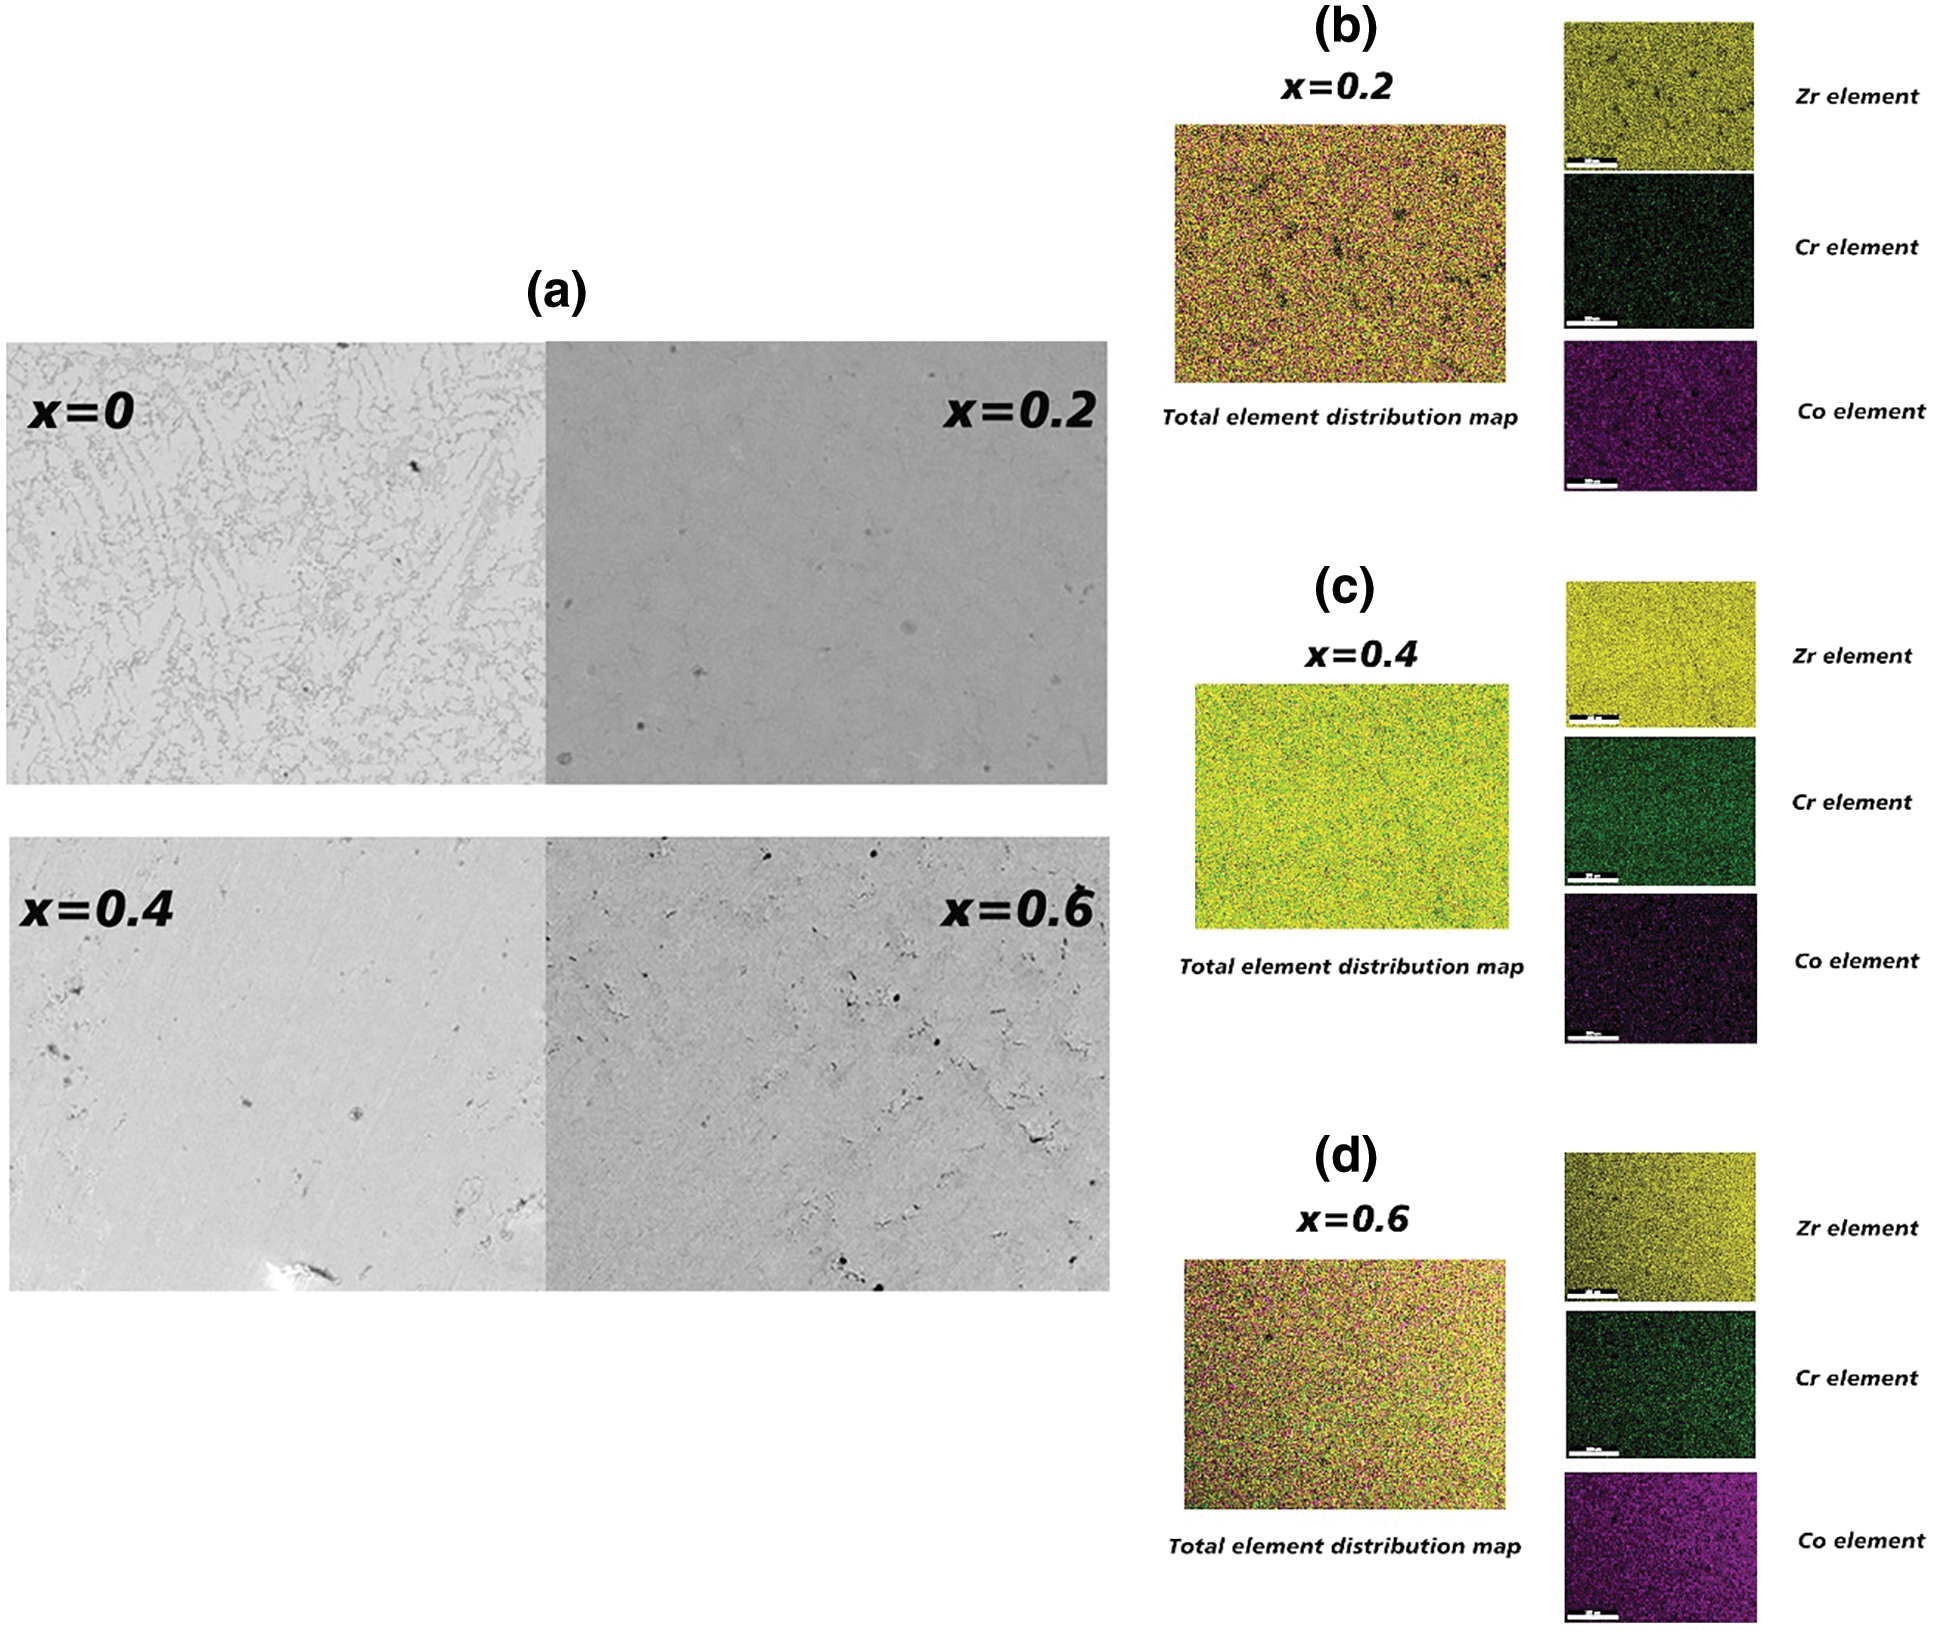
Figure 2: (a) Backscattered electron micrograph of Zr(Cr1−xCox)2 (x = 0, 0.2, 0.4 and 0.6) alloys. (b) Element map of the alloy sample x = 0.2. (c) Element map of the alloy sample x = 0.4. (d) Element map of the alloy sample x = 0.6
Fig. 3 shows the crystal structure of all alloy samples. It could be clearly seen that all alloy samples displayed C14-type main phase (P63/mmc (194)) and the alloy sample x = 0 also showed a small amount of Cr phase. For the alloy with/without introducing Co, the position of the C14-type peak was shifted slightly. This conclusion was also completely consistent with the results of the previous backscattered electron micrograph in Fig. 2a. This result proved that the alloy sample x = 0 had a two-phase structure including C14-type main phase and Cr minor phase again [30–32].
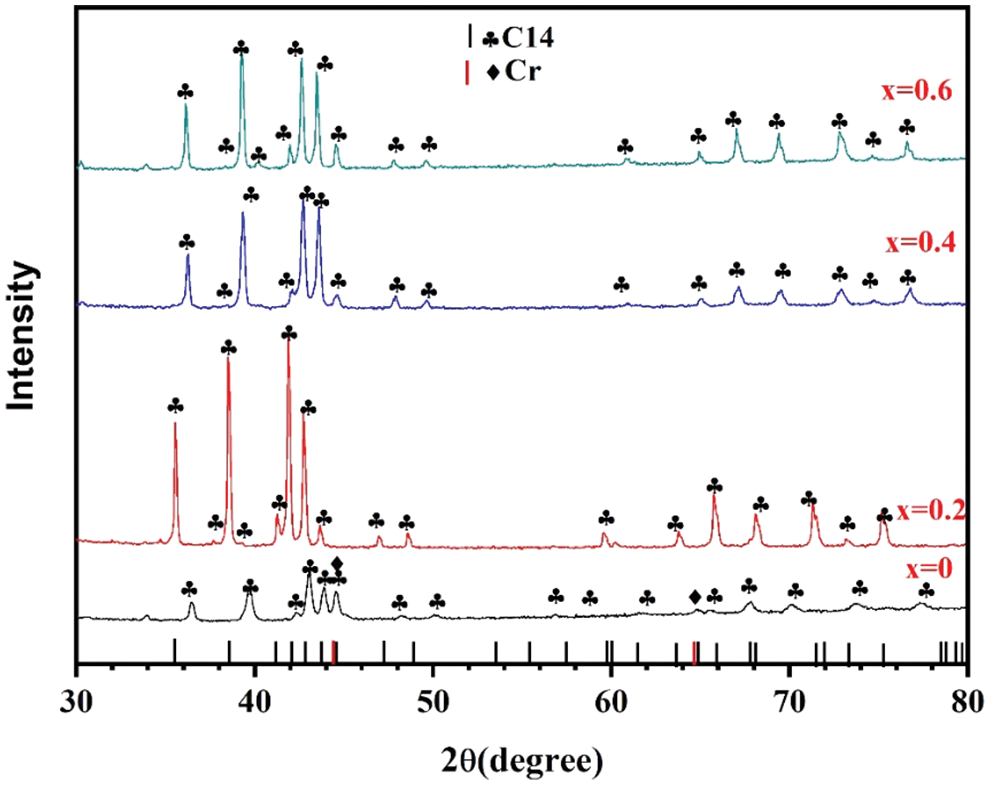
Figure 3: XRD of Zr(Cr1−xCox)2 (x = 0, 0.2, 0.4 and 0.6) alloys
In order to accurately obtain the lattice parameters of the alloy samples, we processed the XRD data in Fig. 3 using the Rietveld refinement method. The relevant results were shown in Fig. 4. Black points are experimental data and red lines are computed results. From Fig. 4, we could find that red lines fit the black points very well (Sig < 4 and Rwp < 4), which proved the results of crystal structure again. Table 1 presents the calculated lattice parameters for all alloy samples from Fig. 4. It was very clear that the lattice parameters of the C14-type phase reduced with rising Co content. This conclusion agreed with the values previously published for Zr-Cr alloys [26]. The observed minor contraction of the unit cell volume of the C14-type phase may be due to the presence of a small amount of Co in solid solution. As we know, the atoms of Zr, Cr and Co are 1.60 (Å), 1.27 (Å) and 1.26 (Å). When Co was added to ZrCr2 alloy, the atom Co may replace the atoms Zr and Cr. But the atom size of Co was less than the atom size of Zr and Cr. This was why there was a minor contraction of the C14 unit cell.
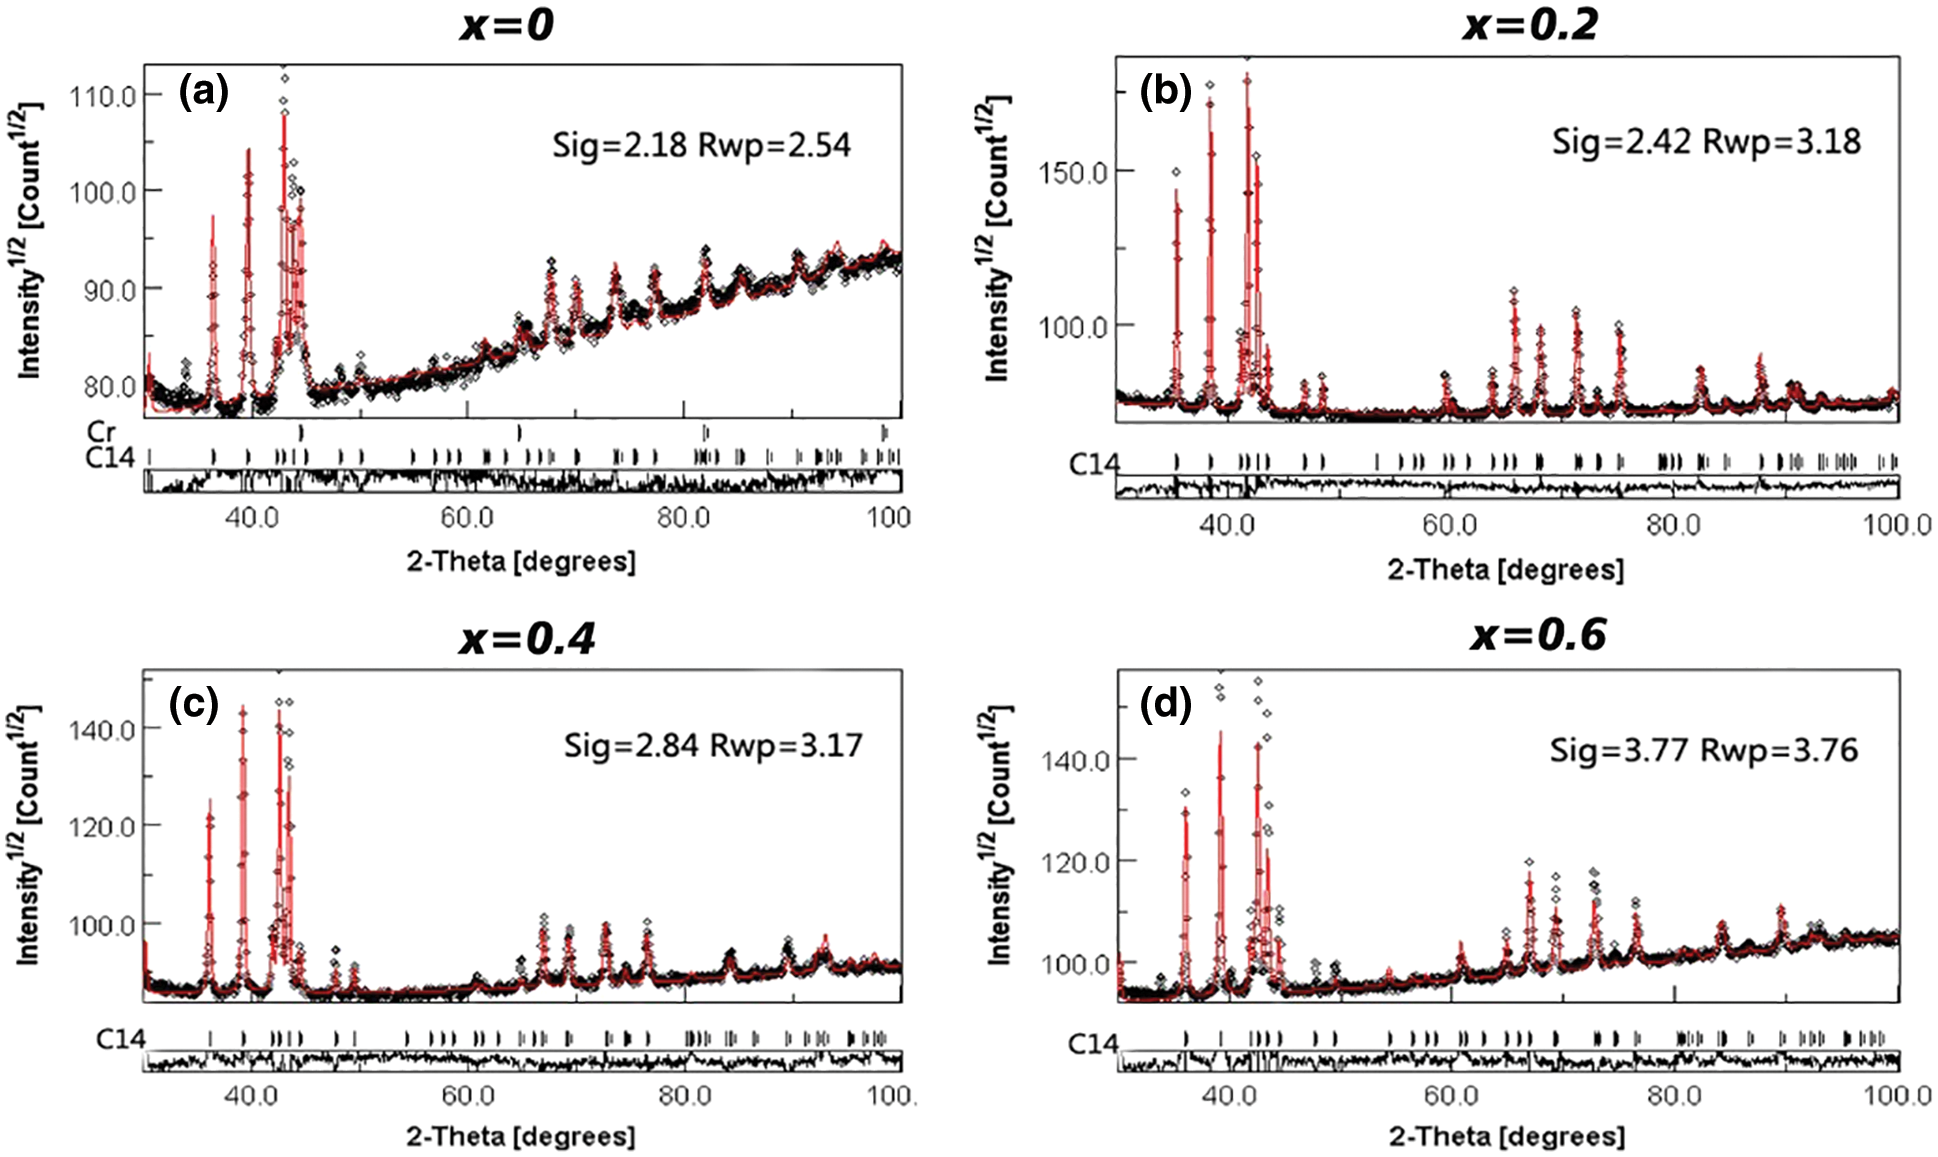
Figure 4: Refinement analysis for XRD of Zr(Cr1−xCox)2 (x = 0, 0.2, 0.4 and 0.6) alloys
3.3 First Hydrogenation Properties
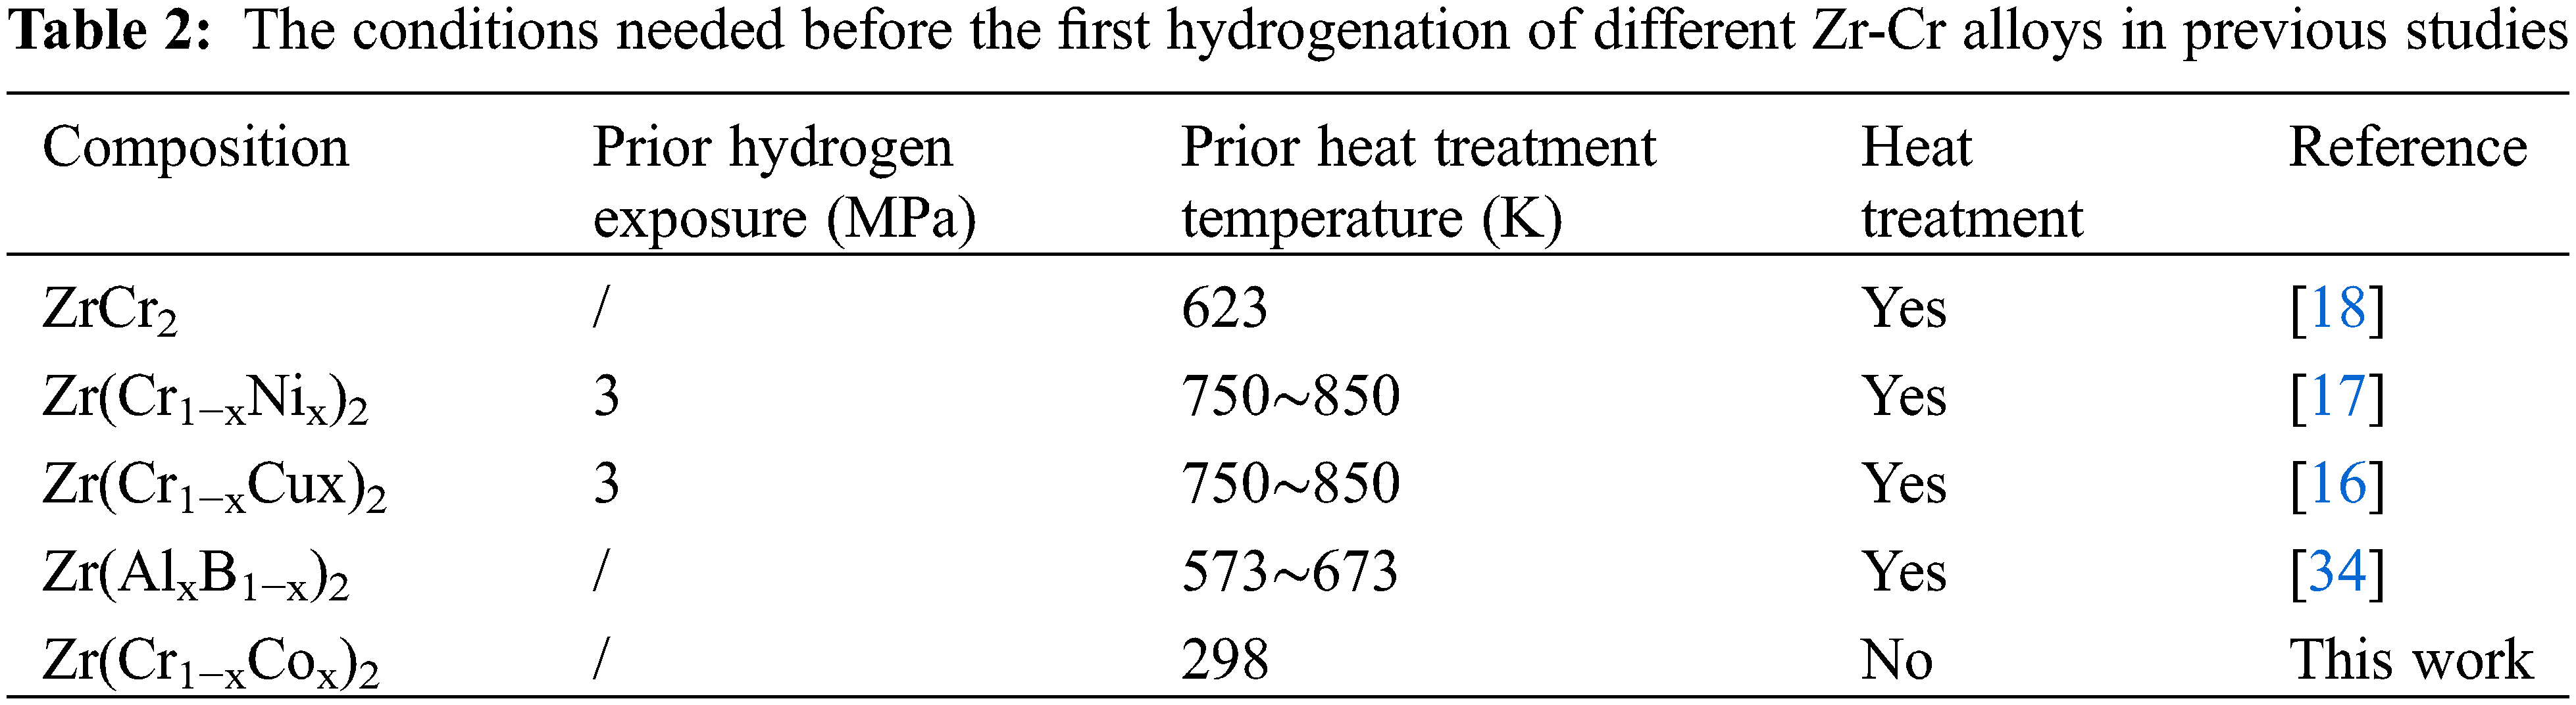
Fig. 5 presents the first hydrogenation curves of all alloy samples at room temperature and under 3 MPa hydrogen pressure. We directly carried out the first hydrogen absorption process under mild experimental conditions. Table 2 shows the conditions needed before the first hydrogenation of different Zr-Cr alloys in previous studies [8,10,14,16–19,26,30,32–34]. The high temperature (573∼850 K) and prior hydrogen exposure (∼3 MPa) were needed to activate the Zr-Cr alloys in most previous studies. This was very different from our work. Compared with previous studies, we had to point out that we did not have a traditional activation process for our hydrogen absorption and desorption experiments. In our experiments, we first evacuated the alloy samples for 0.5 h. Then, we allowed the alloy samples to absorb hydrogen directly without any heat treatment or hydrogen exposure.
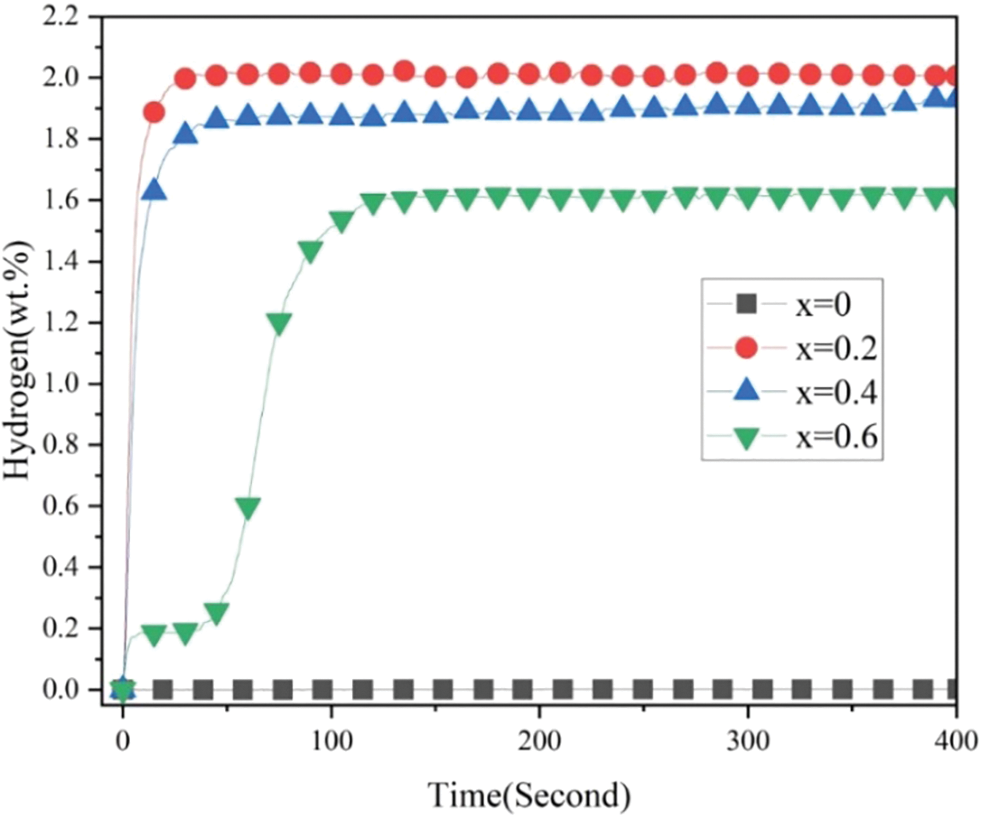
Figure 5: First hydrogenation properties of Zr(Cr1−xCox)2 (x = 0, 0.2, 0.4 and 0.6) alloys at room temperature and under 3 MPa hydrogen pressure
From Fig. 5 it was very clear that pure ZrCr2 alloy could not absorb any hydrogen during the first hydrogenation process. However, the alloy samples x = 0.2 and 0.4 could absorb the hydrogen and showed very short incubation time (< 5 s). The alloy sample x = 0.6 showed a relatively long incubation time (< 50 s). Among these three alloy samples, the alloy sample x = 0.2 had the highest hydrogen storage capacity (around 2 wt.%). This value of hydrogen storage capacity was higher than some different hydrogen storage alloy systems reported in previous studies (TiFe-based alloys [35–38], ZrCo-based alloys [21,39] and LaNi5-based alloys [40–42]). Further study, it was clear from Fig. 5 that the maximum hydrogen storage capacity was decreasing with rising Co. The reduction of maximum hydrogen storage capacity was a consequence of the decrease in the size of the interstitial sites [13,16,17]. In fact, we observed the minor contraction of the unit cell volume of the C14-type phase after introducing a small amount of Co in Table 1, which may lead to the decrease of the interstitial sites. For example, Jacob et al. [34] also found that partial substitution of V, Cr or Mn by Fe or Co decreased the maximum hydrogen storage capacity of ZrCr2 alloy. These above results show that the microstructure of composite critically affected the first hydrogenation properties.
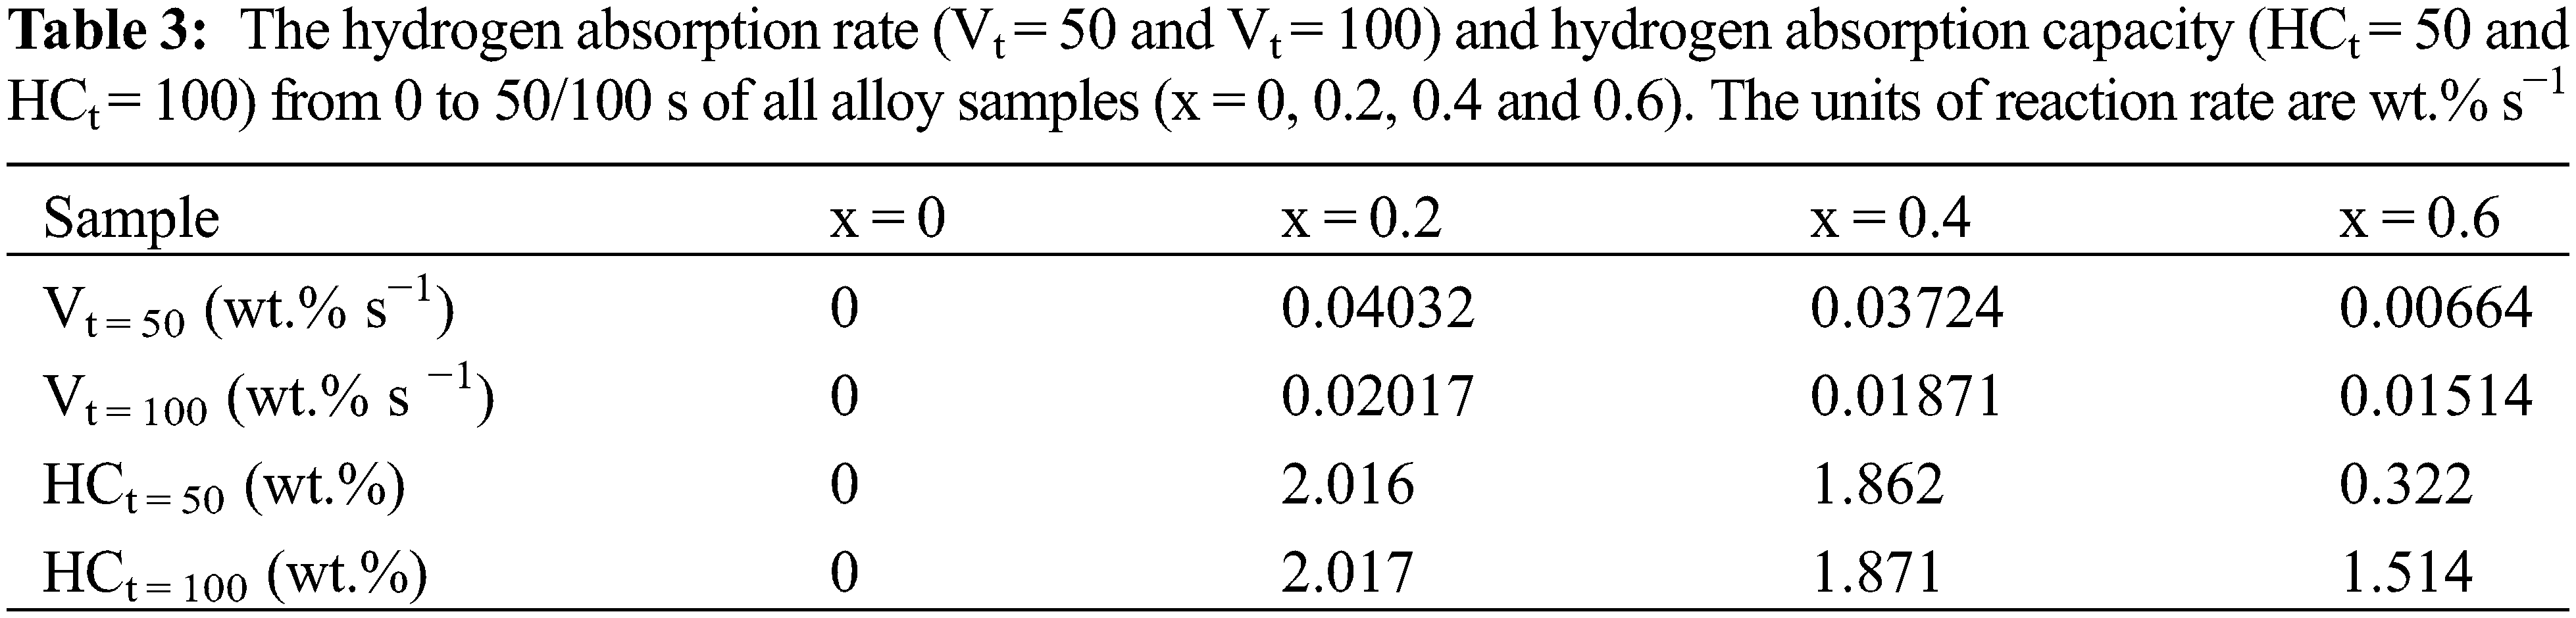
The discrepancy between hydrogen absorption rate and hydrogen absorption capacity of alloy samples in different time periods had important research significance. For this reason, we calculated the hydrogen absorption rate and hydrogen absorption capacity from 0 to 50/100 s of different alloy samples. The relevant data was summarized in Table 3. First, we found that the alloy sample x = 0 did not absorb any hydrogen, so its values were zero in Table 3. Second, for the remaining alloy samples, Vt = 50, HCt = 50, Vt = 100 and HCt = 100 showed a decrease from x = 0.2 to 0.6. This meant that the alloy sample x = 0.2 displayed the fast hydrogen absorption rate and highest hydrogen absorption capacity in the same time frame. These results demonstrated that the addition of Co allowed the pure ZrCr2 alloy to absorb the hydrogen without other treatment. But increasing more Co had a negative impact on the hydrogen absorption capacity.
The anti-oxide ability of hydrogen storage alloys is very important, because we cannot guarantee that all operations are under an inert gas atmosphere. Therefore, we believe that the anti-oxide ability of Zr(Cr1−xCox)2 (x = 0, 0.2, 0.4 and 0.6) alloys has important research significance. In order to fully oxidize the alloy sample, we first pulverized the alloy sample into powder, and then put it into a small plastic bottle without cap for 24 h. After that, we took out the alloy sample exposed to air for 24 h and investigated the effect of air exposure for 24 h on the first hydrogenation properties of all alloy samples. Likewise, we also allowed the alloy sample could absorb the hydrogen directly before the first hydrogenation process without other treatment. Fig. 6 presents the first hydrogenation curves of all alloy samples after air exposure for 24 h at room temperature and under 3 MPa hydrogen pressure. It can be seen that the alloy sample x = 0 still did not absorb any hydrogen. The alloy samples x = 0.2, 0.4 and 0.6 could absorb the hydrogen in less than 25 s. They could absorb 90% of hydrogen in around 25 s (x = 0.2), 50 s (x = 0.4) and 100 s (x = 0.6). Besides, we also could see clearly that the maximum hydrogen storage capacity diminished with expanding x from 0.2 to 0.6.
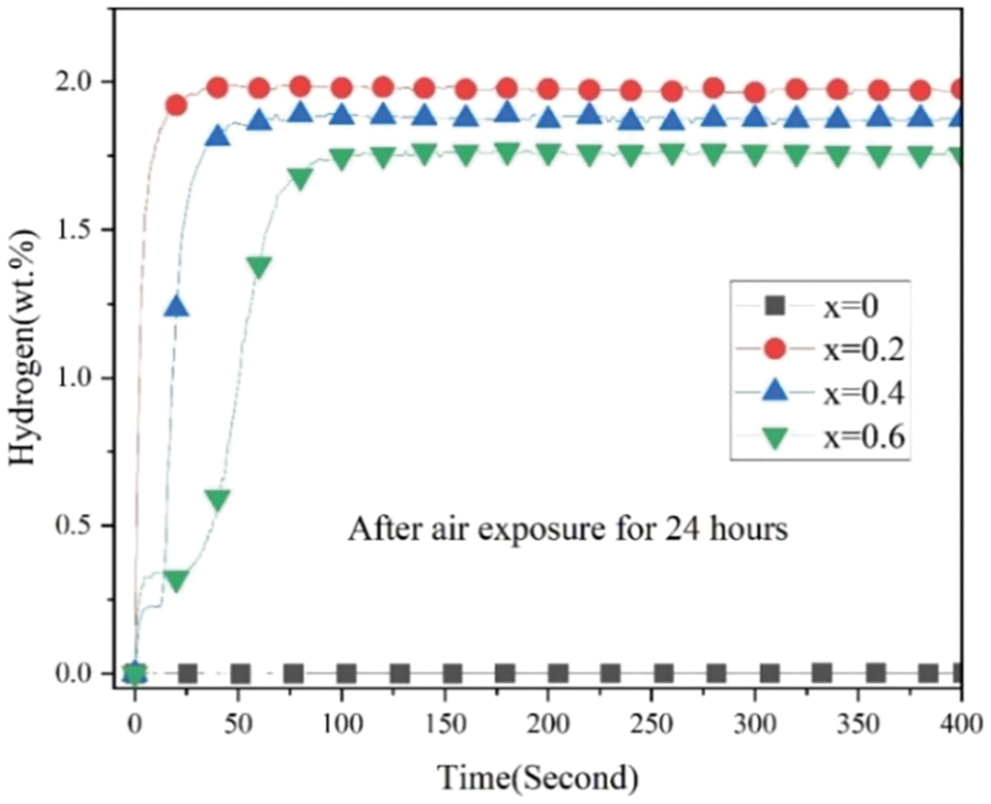
Figure 6: First hydrogenation properties of Zr(Cr1−xCox)2 (x = 0, 0.2, 0.4 and 0.6) alloys after air exposure for 24 h at room temperature and under 3 MPa hydrogen pressure
Fig. 7 presents the first hydrogenation curves of alloy samples before (black) and after (red) exposure to air for 24 h. It could be found that air exposure for 24 h marginally affected the hydrogen absorption rate and the maximum hydrogen storage capacity of the alloy sample x = 0.2. For the alloy sample x = 0.4, air exposure for 24 h only reduced the hydrogen absorption rate. For the alloy sample x = 0.6, air exposure for 24 h not only reduced the hydrogen absorption rate but also lowered the maximum hydrogen storage capacity. This showed that introducing a certain amount of Co had obvious effect on the anti-oxide ability of ZrCr2 alloy. Table 4 shows the detailed data about hydrogen absorption capacity and loss of capacity getting from Fig. 7. It was very clear that the increase in the amount of Co resulted in an increase in the loss of capacity. This result revealed that long-term air exposure had a great influence on the hydrogen storage properties of the alloy samples.
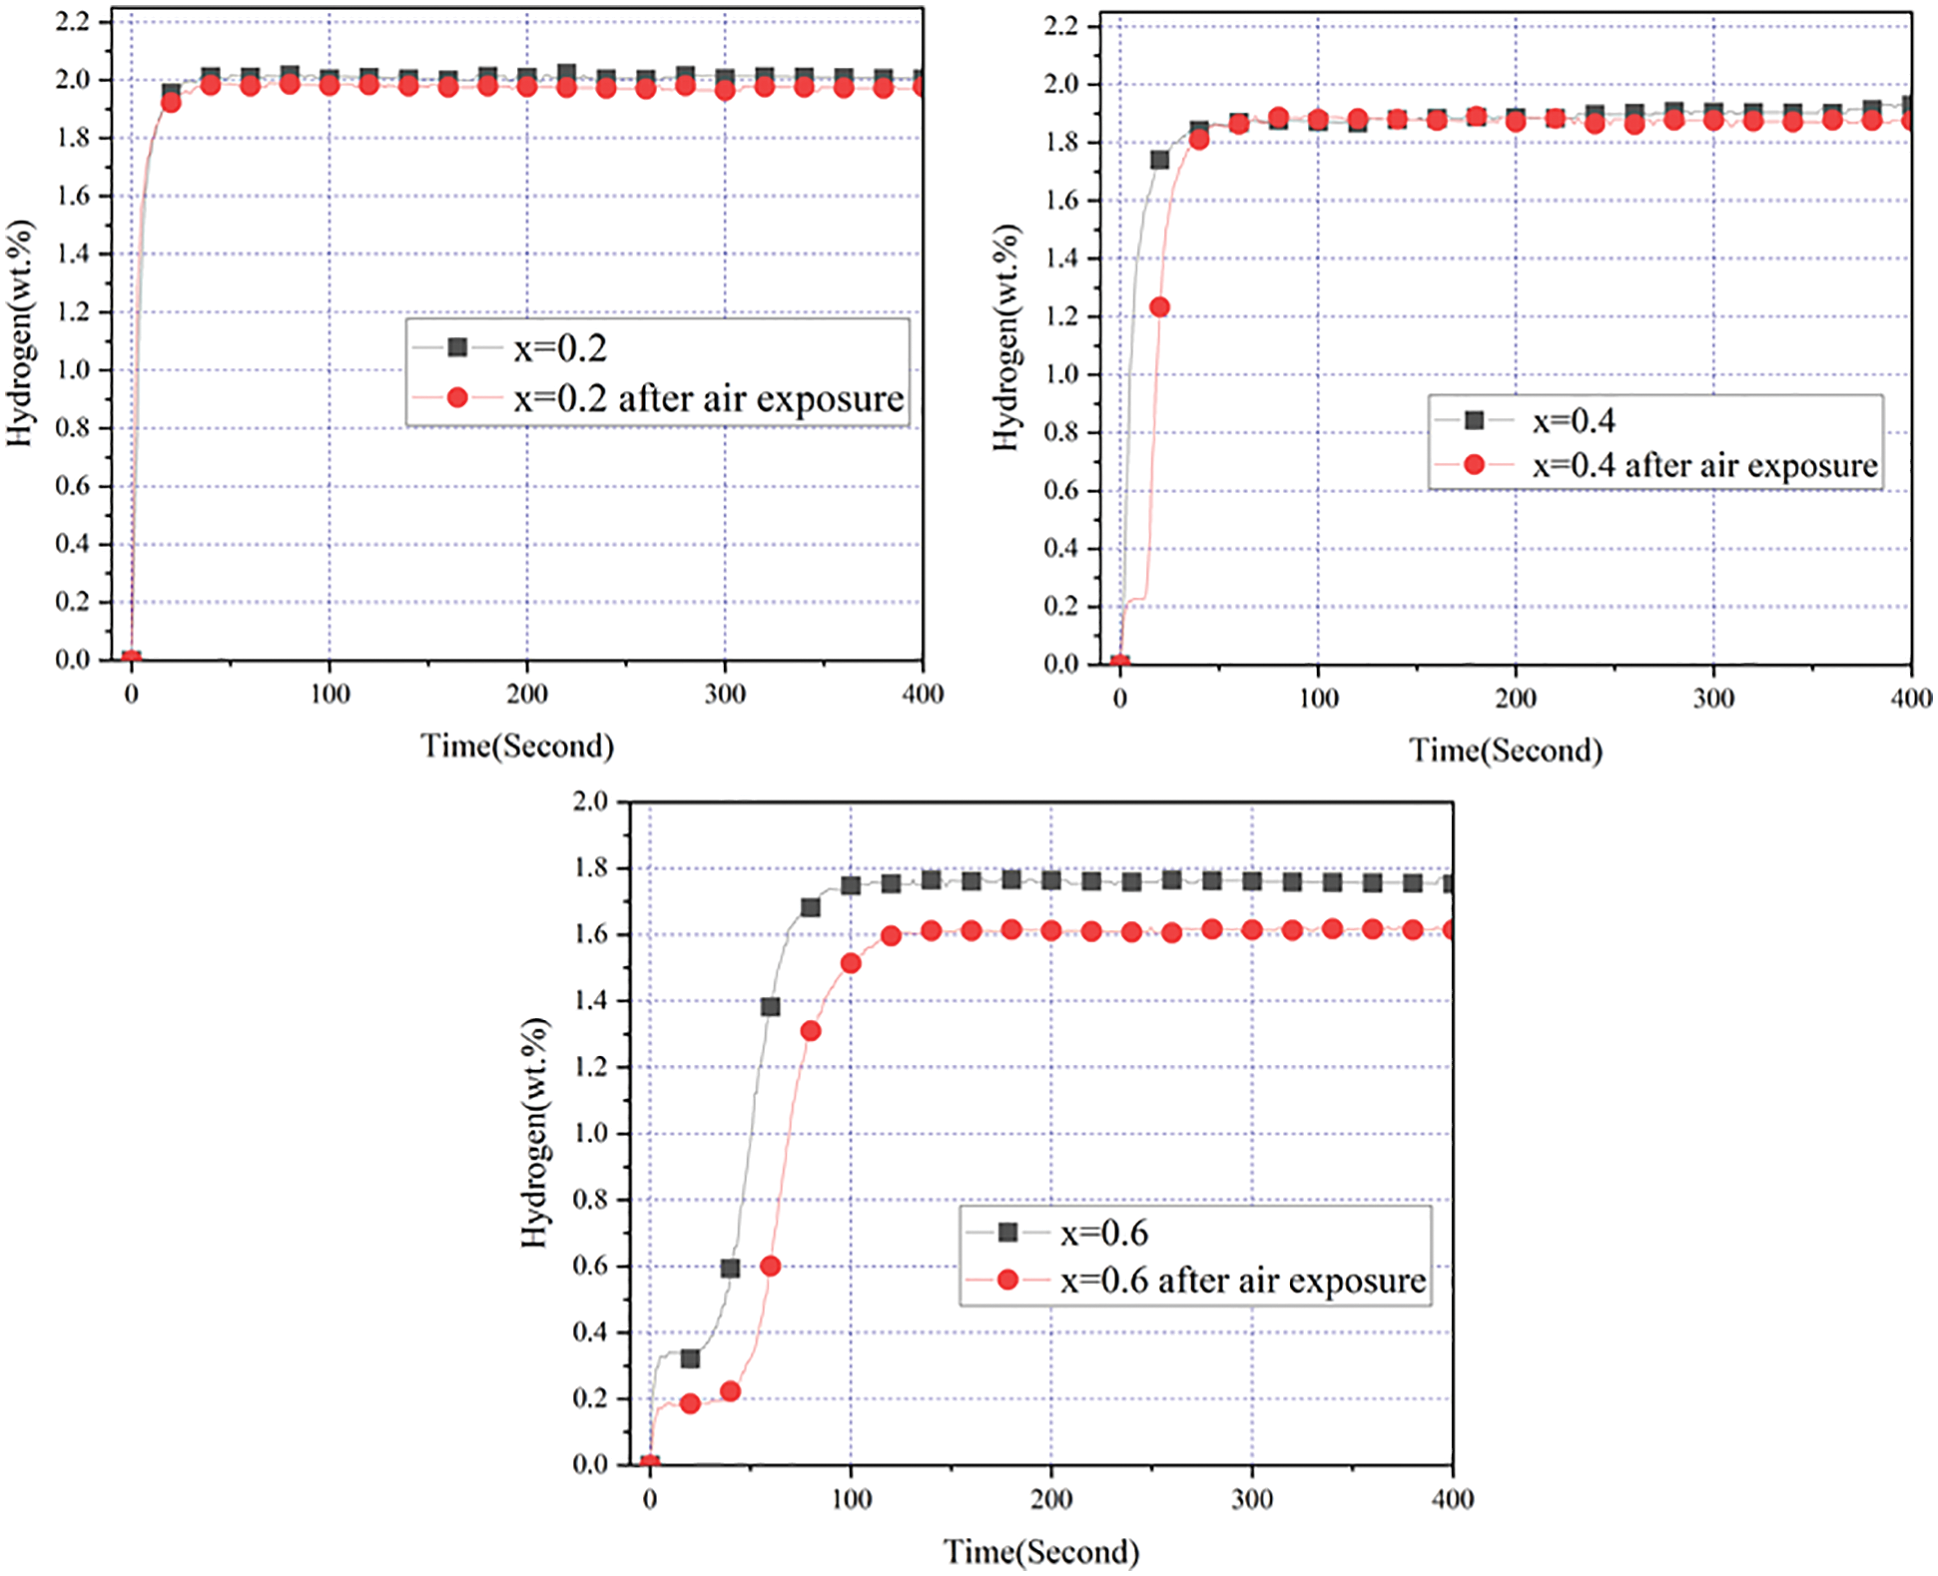
Figure 7: First hydrogenation properties of Zr(Cr1−xCox)2 (x = 0.2, 0.4 and 0.6) alloys before and after air exposure for 24 h at room temperature and under 3 MPa hydrogen pressure
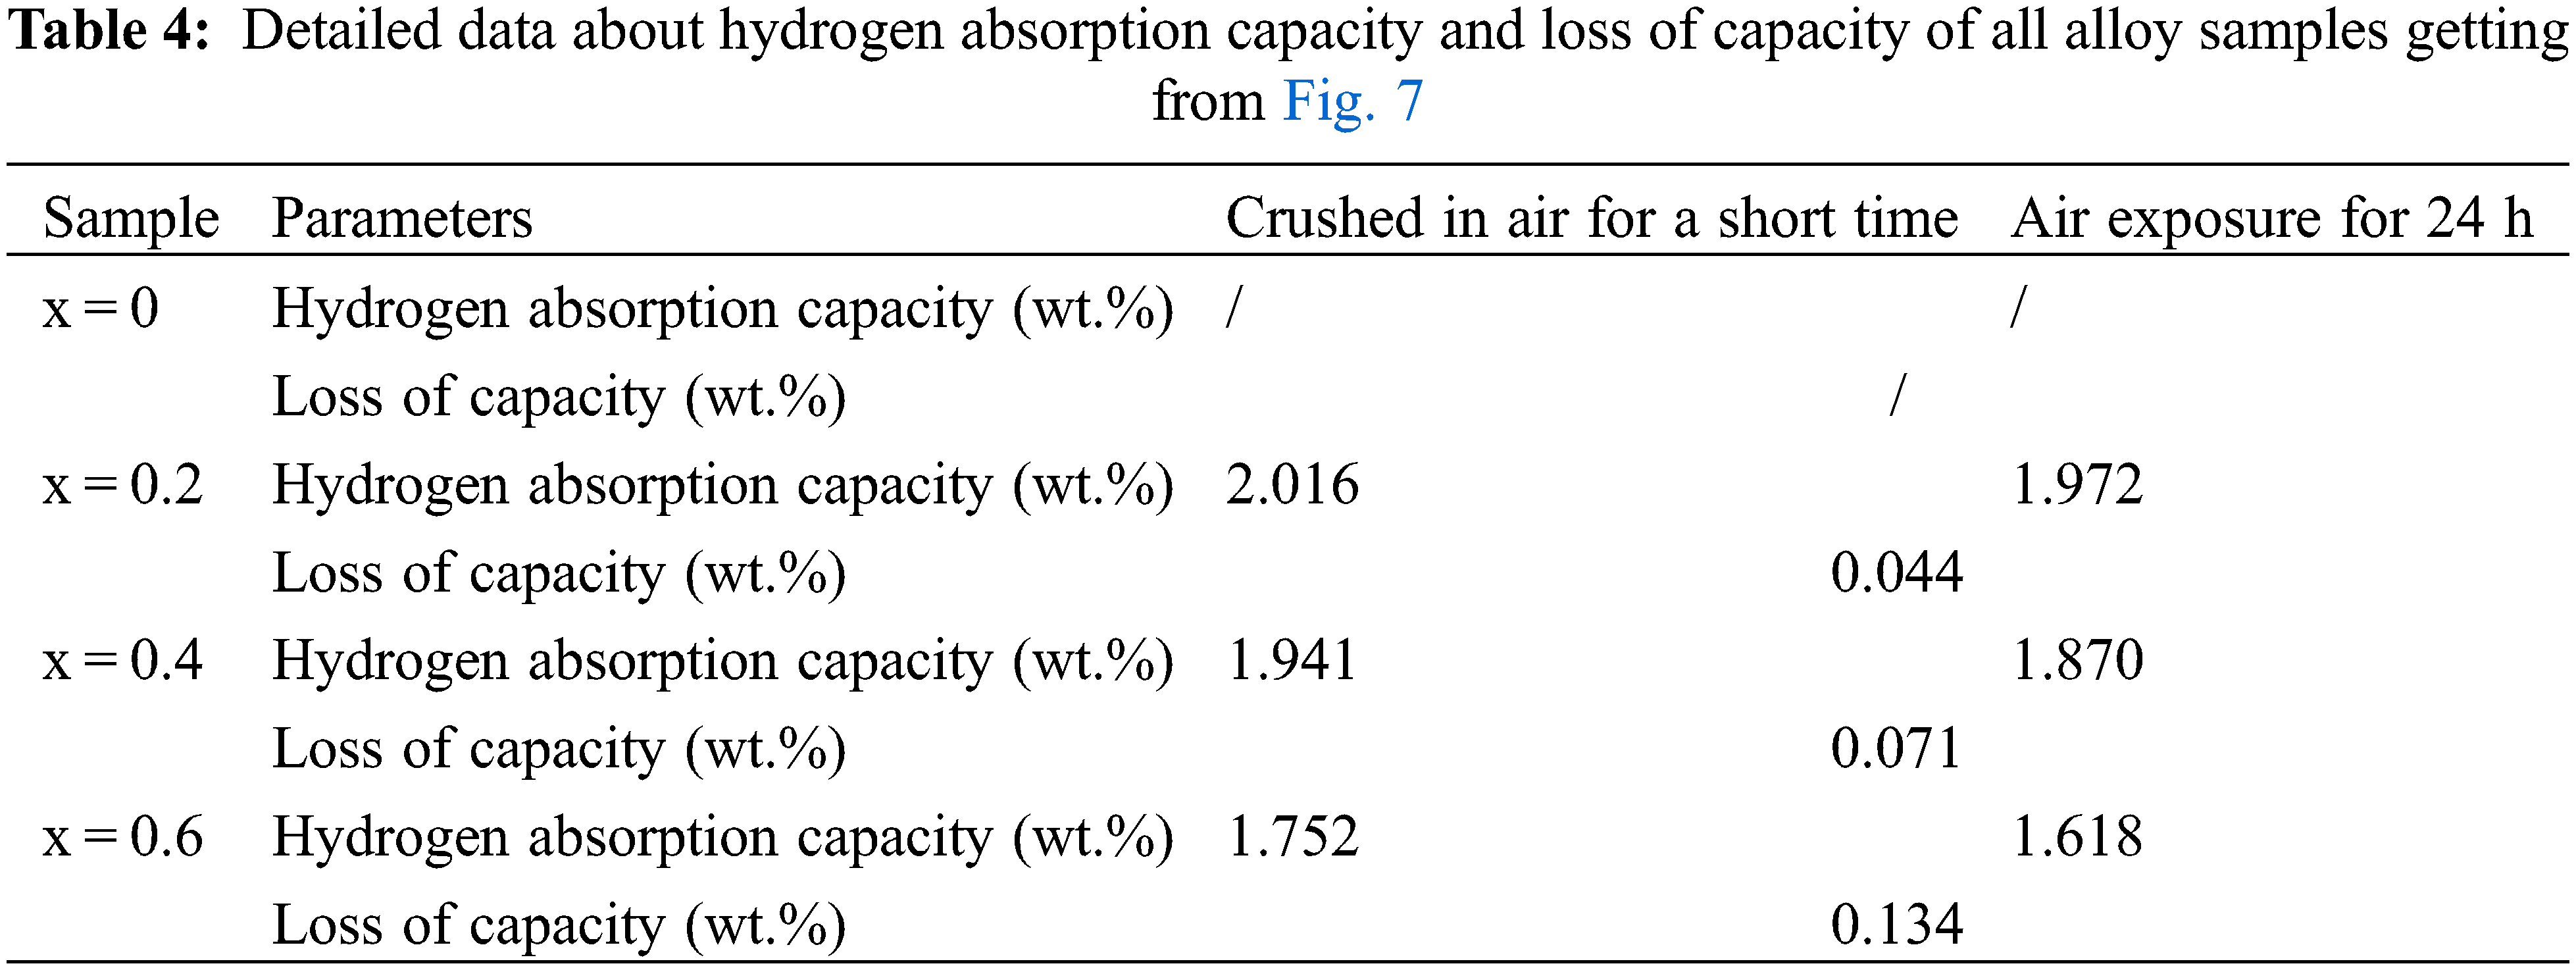
Fig. 8 presents the capacity retention rate for the alloy samples x = 0.2, 0.4 and 0.6 after air exposure for 24 h. The capacity retention rate of Zr(Cr1−xCox)2 (x = 0.2, 0.4 and 0.6) alloys were about 97.82% (x = 0.2), 96.34% (x = 0.4), 92.35% (x = 0.6), respectively. It was clear that prolonged air exposure resulted in a decrease in the maximum hydrogen storage capacity. But this effect was within our acceptable range due to a more than 90% capacity retention rate after adding Co. In particular, it should be pointed out that the anti-oxide ability of the alloy sample x = 0.2 was particularly outstanding, which presented up to 97.82% capacity retention rate.
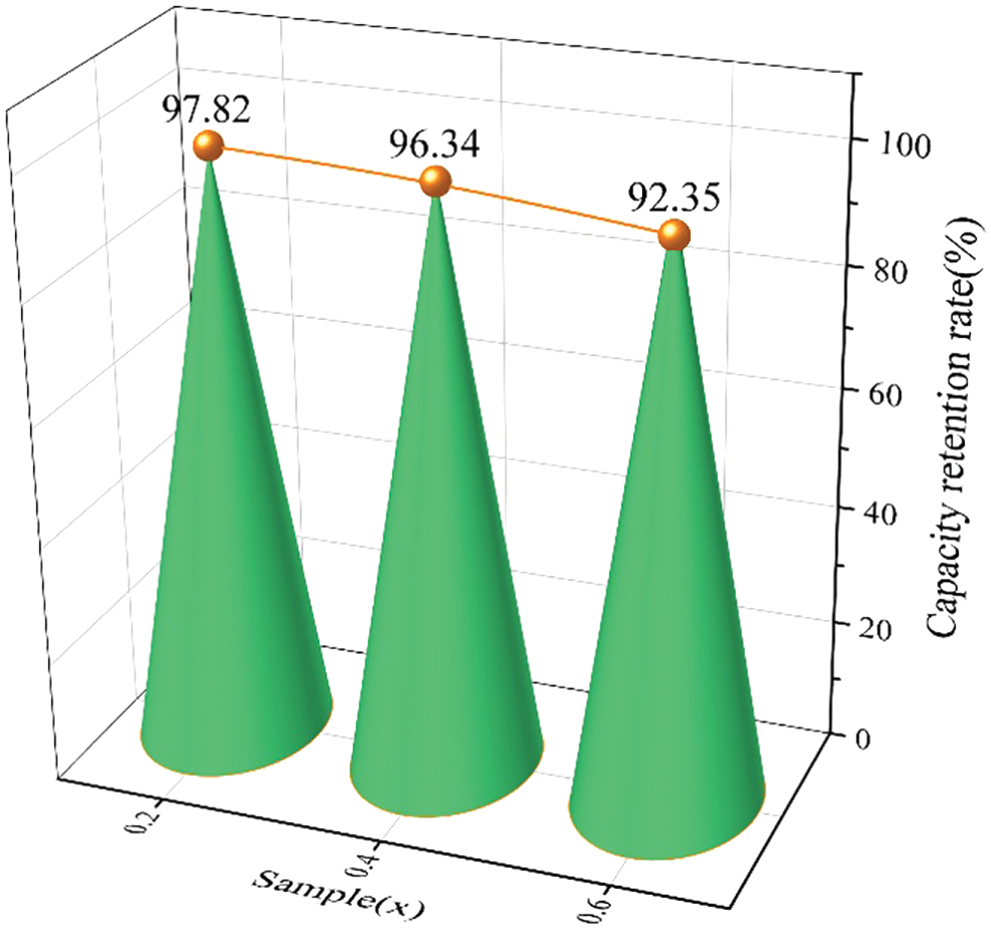
Figure 8: The capacity retention rate for the alloy samples x = 0.2, 0.4 and 0.6 after air exposure for 24 h
For actual needs in industrial production, we believe that it was very important to study the mechanism of the anti-oxide ability of hydrogen storage alloys. Fig. 9 presents the microscopic schematic diagram of Zr(Cr1−xCox)2 (x = 0.2, 0.4 and 0.6) alloy samples after oxidation in air. First, it was clear that the higher the Co content, the lower the maximum hydrogen storage capacity of the alloy sample. We think that the introduction of Co caused the reduction of C14 unit cell volume. This shrinking C14 unit cell accommodated fewer hydrogen atoms and decreased the maximum hydrogen storage capacity. In previous studies, Chen et al. [43] found that the unit cell had an important impact on the hydrogen storage capacity. Second, when Co was exposed to air for a long time, oxides of Co were shaped on the outermost layer of the alloy sample. The higher the Co content, the larger the area of the oxides of Co shaped on the outermost layer of the alloy sample. And the oxides of Co could effectively hinder the diffusion of hydrogen atoms into the alloy. This resulted in a slower rate of hydrogen absorption. In addition, the higher oxides of Co content prompted a critical loss of the hydrogen-absorbing C14-type phase, which additionally decreased the hydrogen storage capacity.
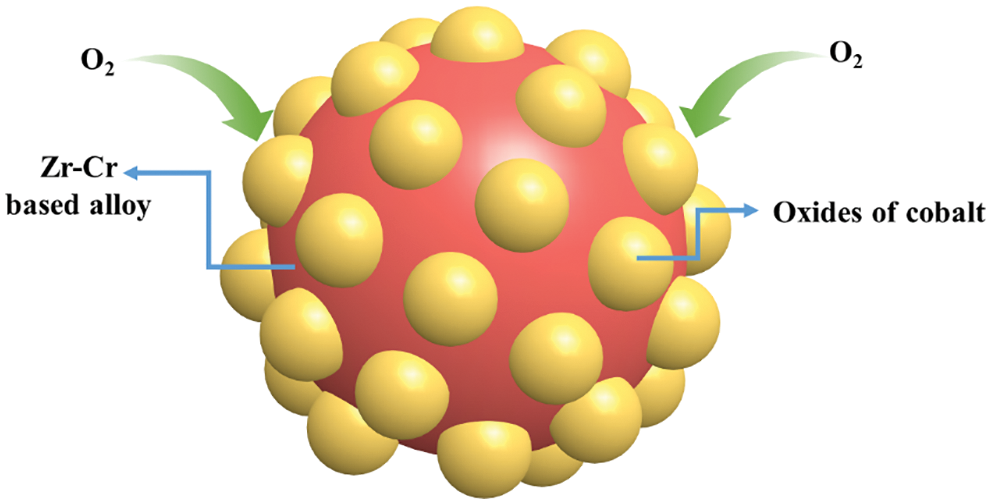
Figure 9: Microscopic schematic diagram of Zr(Cr1−xCox)2 (x = 0.2, 0.4 and 0.6) alloy samples after oxidation in air
Fig. 10 presents the first and third hydrogen absorption curves for the alloy samples x = 0.2, 0.4 and 0.6 at room temperature and under 3 MPa hydrogen pressure. Fig. 11 shows the capacity of first and third hydrogenation and loss of capacity for the alloy samples x = 0.2, 0.4 and 0.6 during the first and third hydrogenation cycles. During the hydrogen absorption and desorption cycle test, we always pumped the entire system for 0.5 h before we started a new hydrogen absorption process in order to ensure that the alloy samples could release the hydrogen to the maximum extent. First, we can clearly observe that all alloy samples exhibited a fast hydrogen absorption rate and lowered maximum hydrogen storage capacity during the third hydrogen absorption process. However, it was very clear that increasing Co content resulted in the increase of effective hydrogen absorption capacity from x = 0.2 to 0.6 in Fig. 11. To start with, it was notable that the reduction of effective hydrogen absorption capacity during the first and third cycles was probably because of the development of Cr irreversible hydride phase that caught a portion of hydrogen. In addition, the Cr irreversible hydride phase formed was stable at room temperature [44]. Second, this may be because the higher the Co content, the higher the content of a certain Co-containing hydride that was reversible at room temperature. Therefore, the alloy sample x = 0.6 exhibited the highest effective hydrogen absorption capacity during hydrogen absorption and desorption cycles at room temperature.
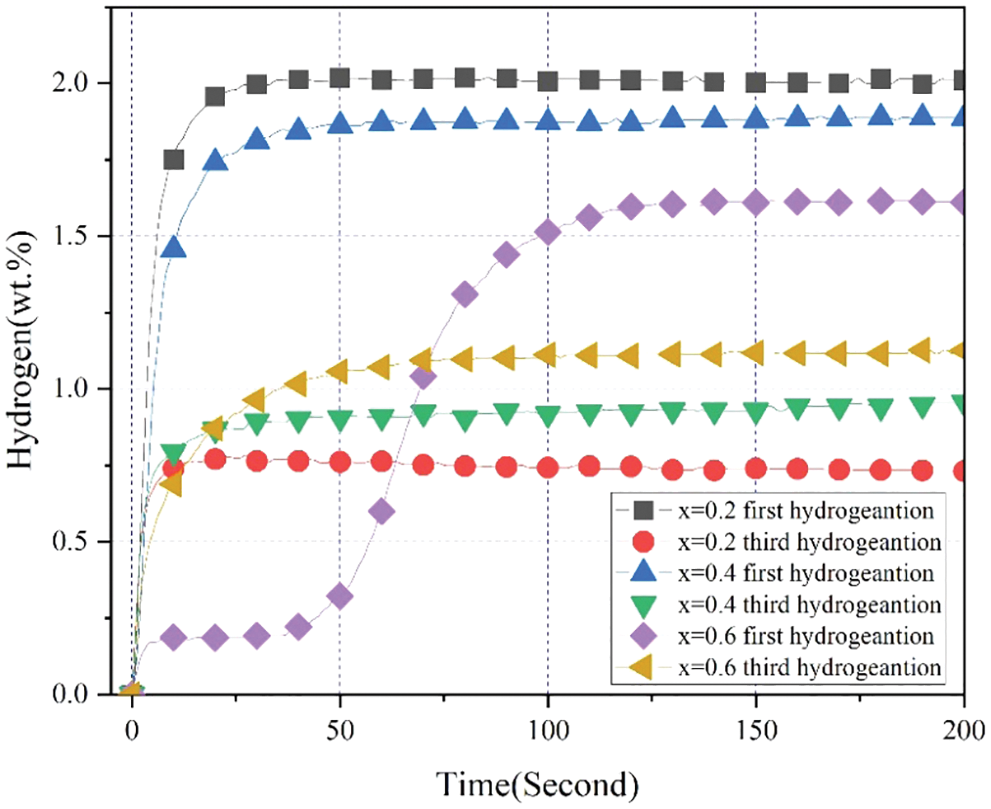
Figure 10: First and third hydrogen absorption curves for the alloy samples x = 0.2, 0.4 and 0.6 at room temperature and under 3 MPa hydrogen pressure
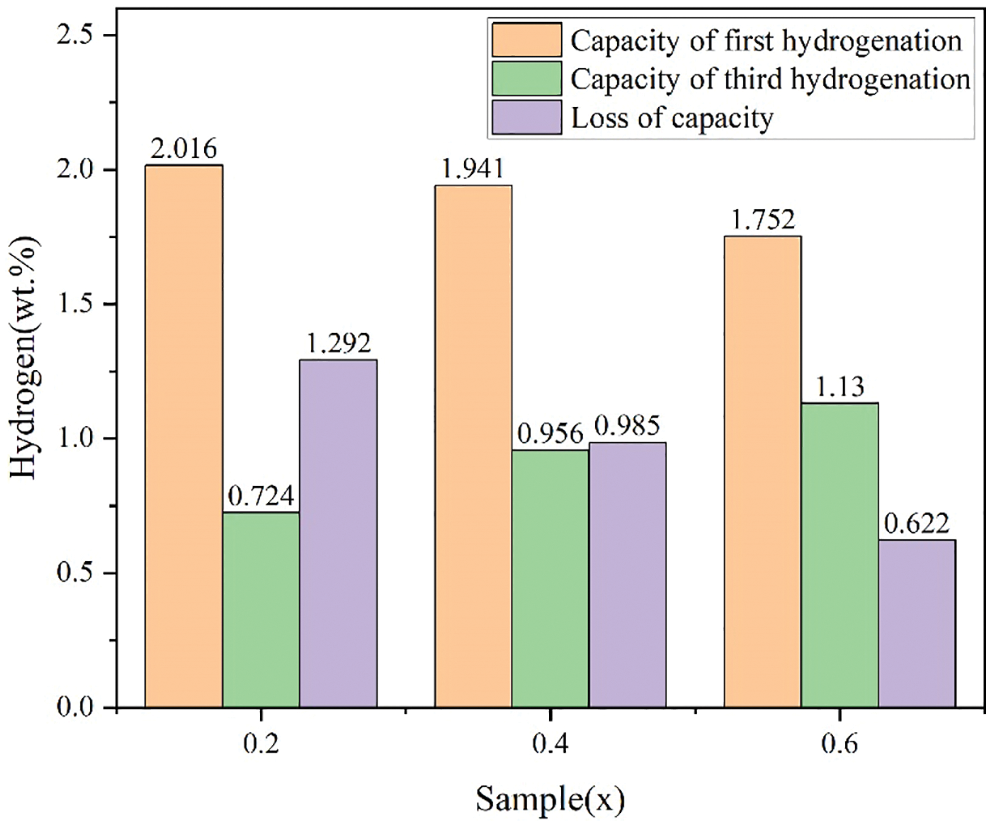
Figure 11: Capacity of first and third hydrogenation and loss of capacity for the alloy samples x = 0.2, 0.4 and 0.6 during the first and third hydrogenation cycles
Fig. 12 presents the capacity retention of all alloy samples after the third hydrogen absorption. We could see that the capacity retention rate after the third hydrogen absorption rose with x from 0.2 to 0.6, suggesting that introducing more Co content had a favorable influence on the effective hydrogen storage capacity and cycle properties of the alloy sample.
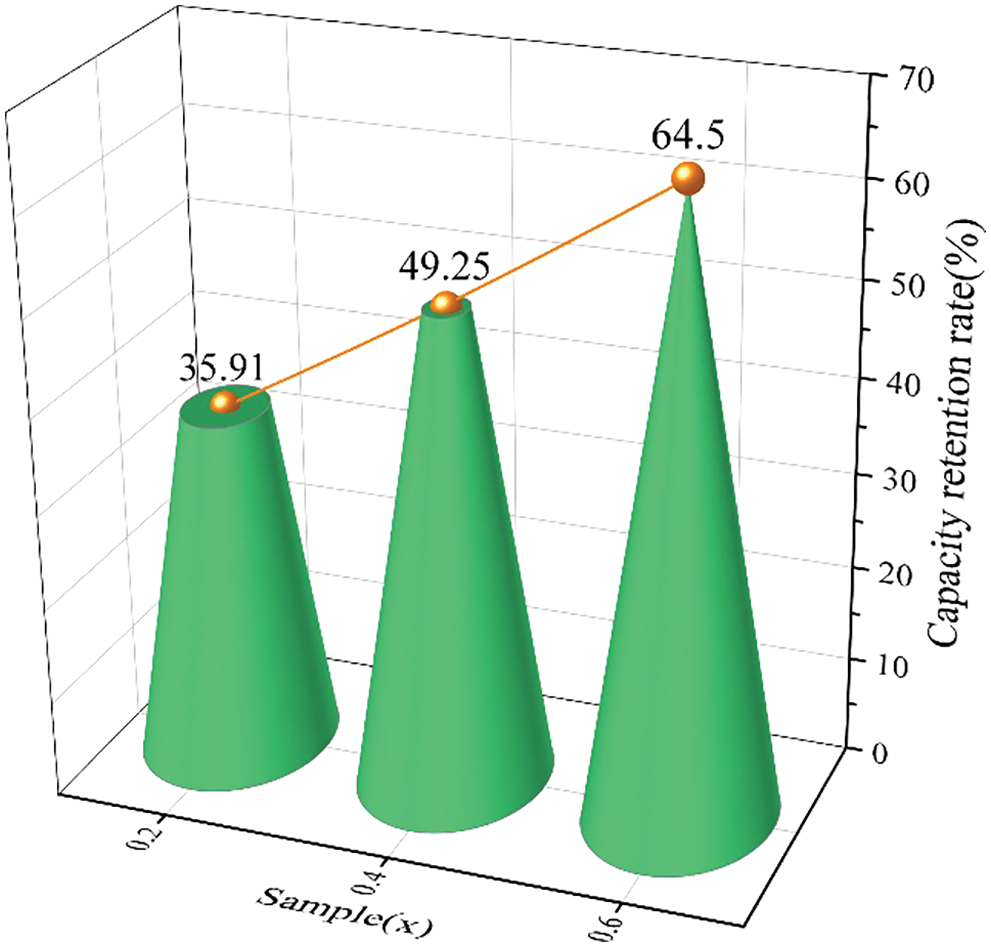
Figure 12: The capacity retention rate of all alloy samples after the third hydrogen absorption
In order to further verify the good cycle properties of the alloy sample x = 0.6, the alloy sample x = 0.6 had been cycled for 7 times with desorption at room temperature under vacuum in Fig. 13. We could clearly see that the first and seventh cycles showed very similar kinetics and maximum hydrogen desorption capacity (∼1.13 wt.%). In addition, the value of the maximum hydrogen desorption capacity also agreed with the effective hydrogen storage capacity in Fig. 11. This suggested a good cycling stability of the alloy sample x = 0.6 again. But if we compared the details of the two desorption cycles, it was clear from the first to seventh cycle, the initial kinetic rose with growing cycles but the maximum hydrogen desorption capacity decreased a little. The loss of capacity between the first and seventh absorption was very small, which may be explained by the nature of the apparatus during the measurement process [45]. More cycles for the alloy sample x = 0.6 need to be measured in the future.
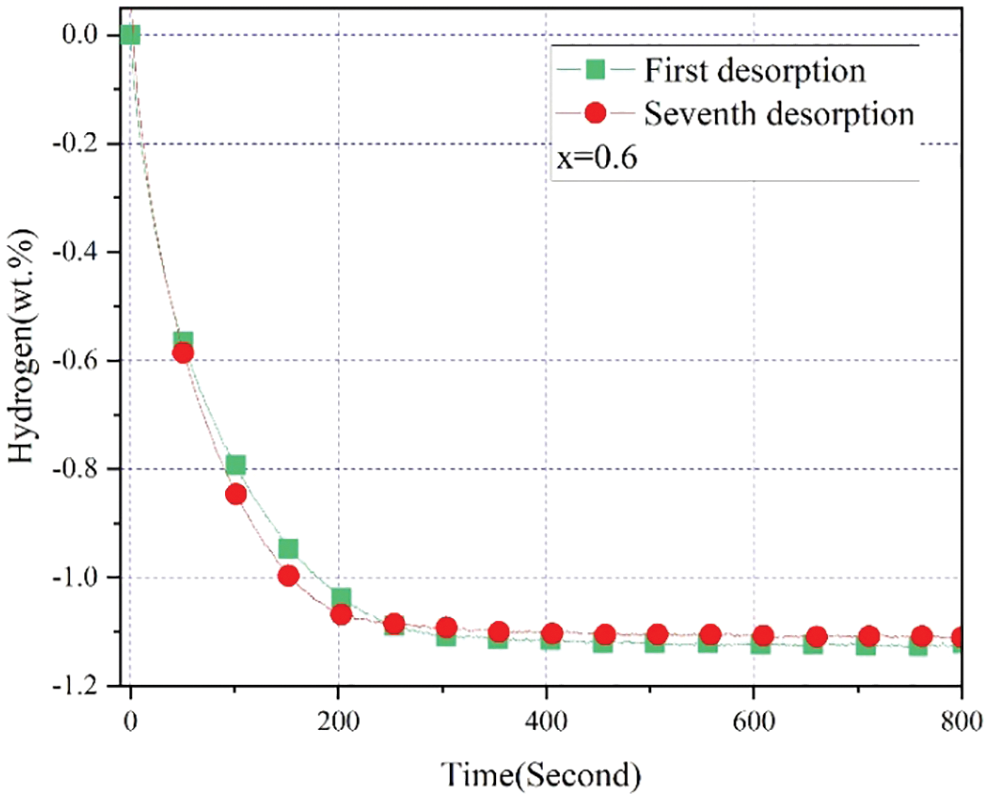
Figure 13: Hydrogen desorption cycles of 1st and 7th for Zr(Cr1−xCox)2 (x = 0.6) alloy
3.6 Effect of 24 h of Air Exposure on Rate Limiting Step
We adopted the rate limiting step model to analyze the mechanism of the first hydrogen absorption before and after air exposure. Table 5 shows different rate limiting step models from our previous paper including Nucleation-growth-impingement model (JMA) [46,47], Contracting volume model (CV) [48,49] and Ginstling-Brounshtein model (GB) [50]. For all model equations, the left hand of the equation is a function of the reaction completion ratio α(t) (α = %Habs/%Hmax), t is the reaction time, and k is the kinetic rate constant [51].
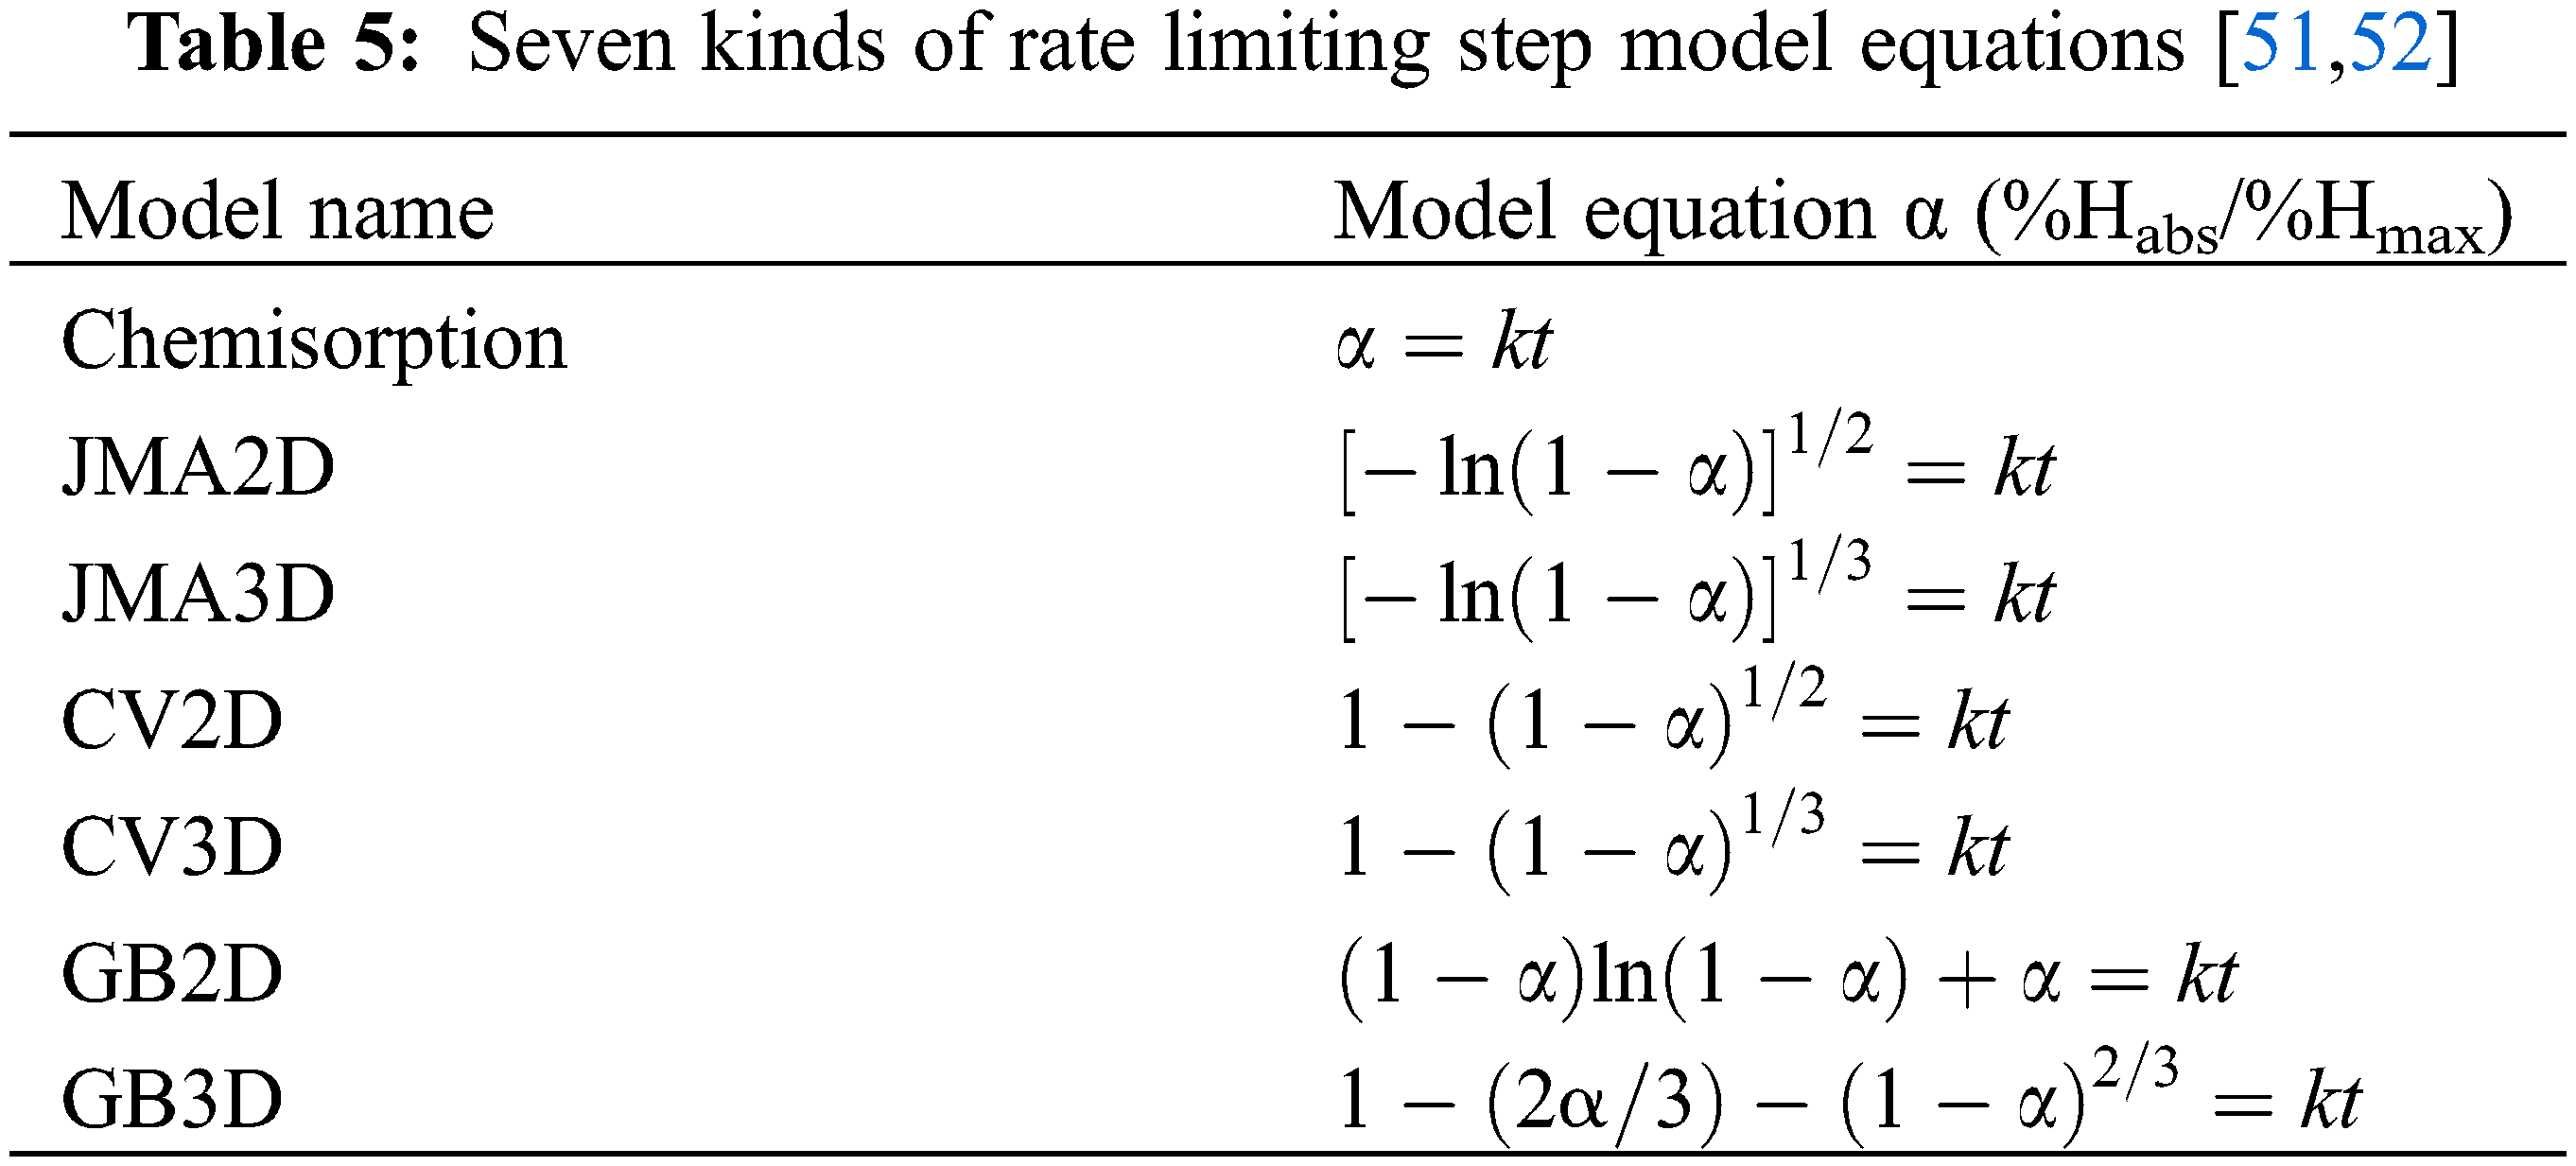
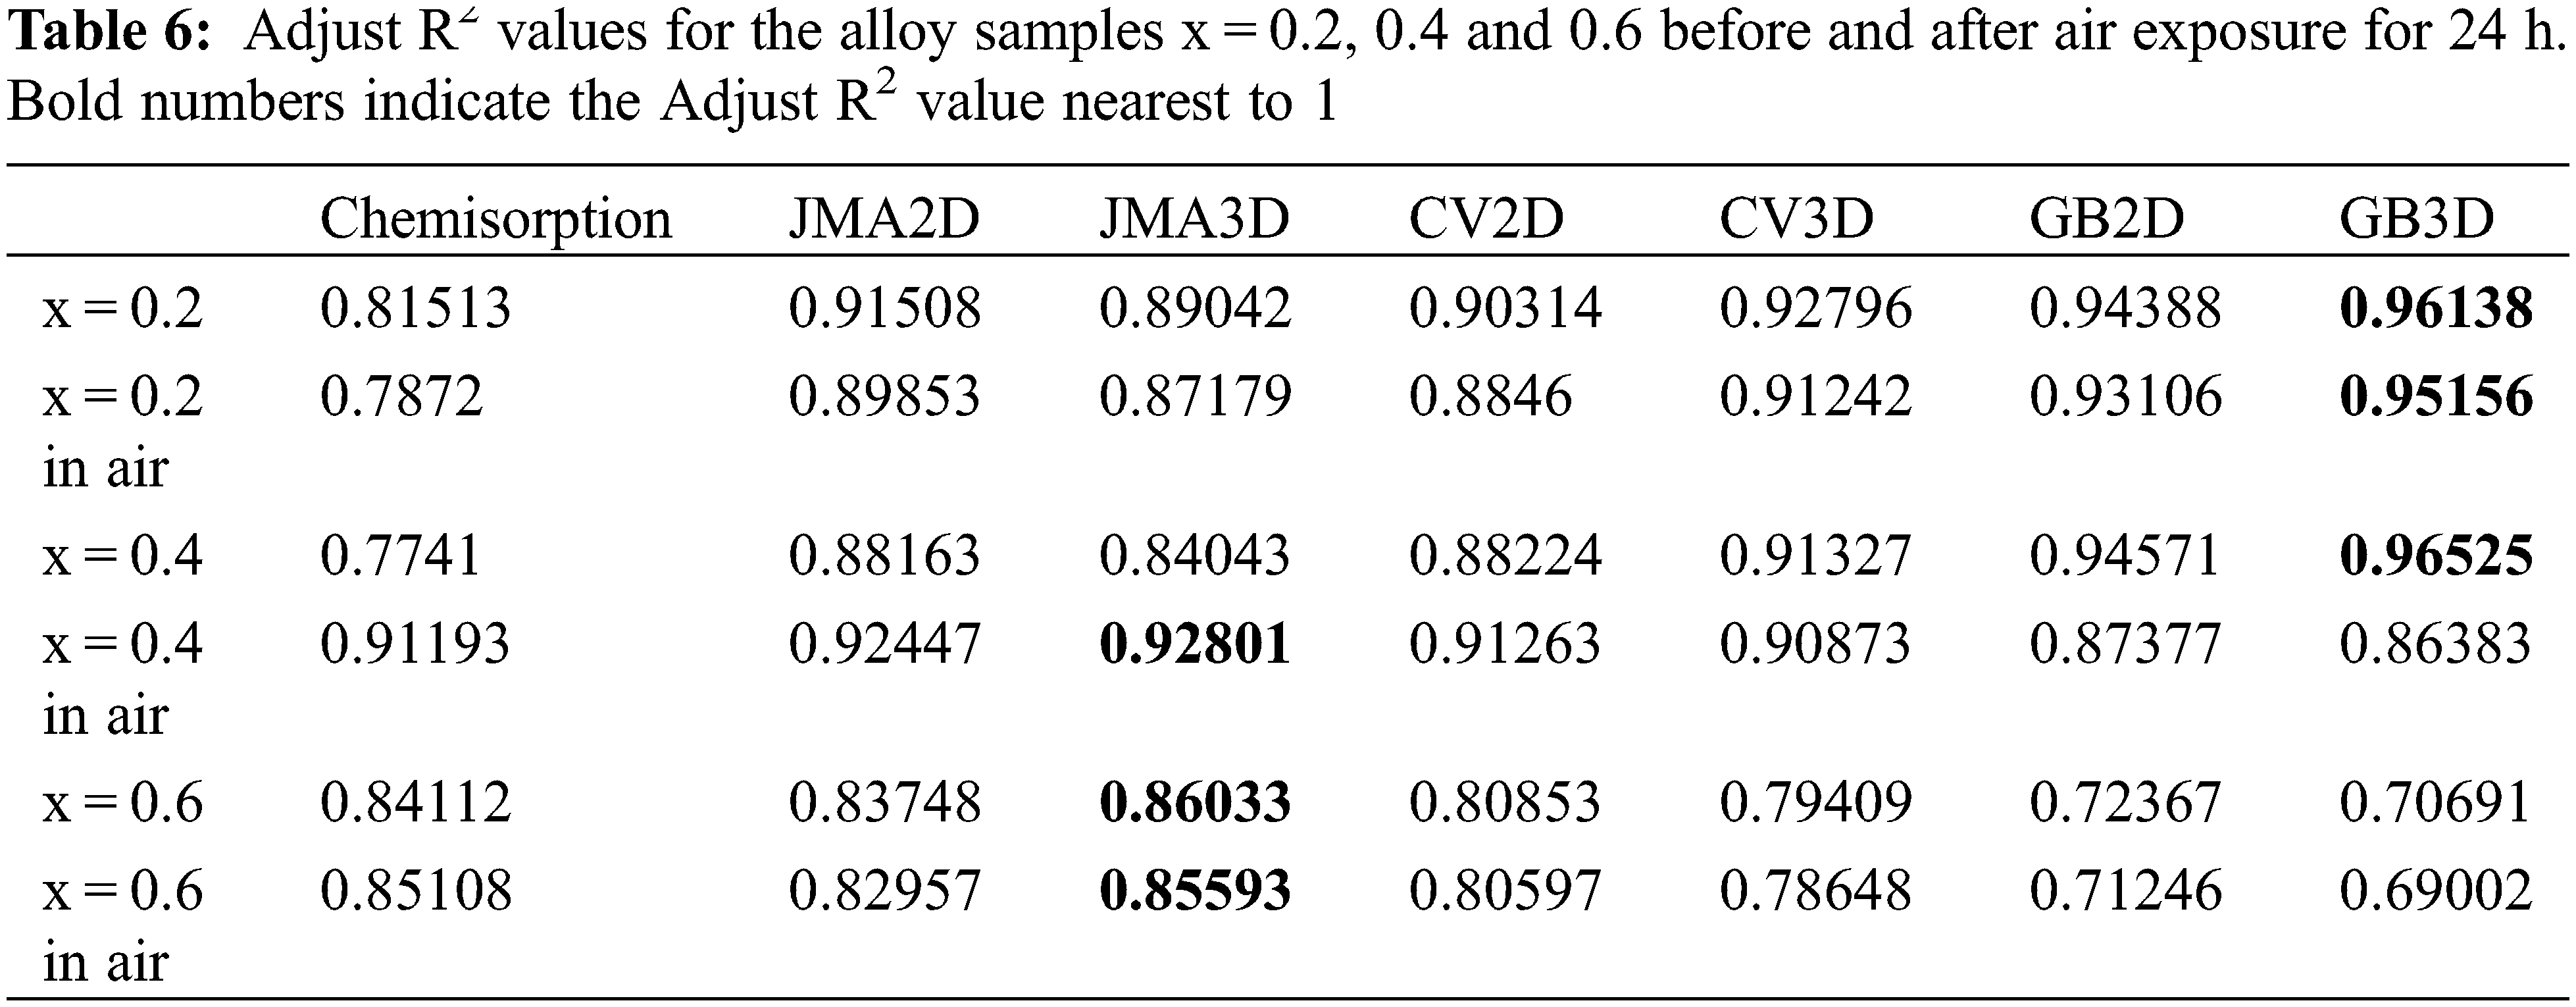
Fig. 14 presents the rate limiting step curves calculated from of first hydrogenation curves of Zr(Cr1−xCox)2 (x = 0.2, 0.4 and 0.6) alloys before and after air exposure for 24 h. Linear regressions were performed on each model. According to the results of previous literature, the regressions should be made in the range from 0.1 to 0.9 of the reaction completion [51,52]. In order to choose the rate limiting step model that showed the best fit, we calculated the Adjust R2 values from Fig. 14. The Adjust R2 values for all alloy samples are show in Table 6. It was very clear that air exposure for 24 h had no effect on rate limiting step of the alloy sample x = 0.2, which still showed GB3D model. This suggested that the rate limiting step of the alloy sample x = 0.2 was three-dimensional growth and the diffusion of hydrogen showed reduced interface velocity. For the alloy sample x = 0.4, air exposure for 24 h had an obvious effect on rate limiting step. The rate limiting step model changed from GB3D to JMA3D. This suggested that the rate limiting step of the alloy sample x = 0.4 was three-dimensional growth of existing nuclei and the interface velocity was stable. For the alloy sample x = 0.6, it was clear that the rate limiting step model was still JMA3D even though it was exposed to air for 24 h. The above results demonstrated that the distinction of first hydrogenation curves before and after air exposure for 24 h was because of the adjustment of the rate limiting step.
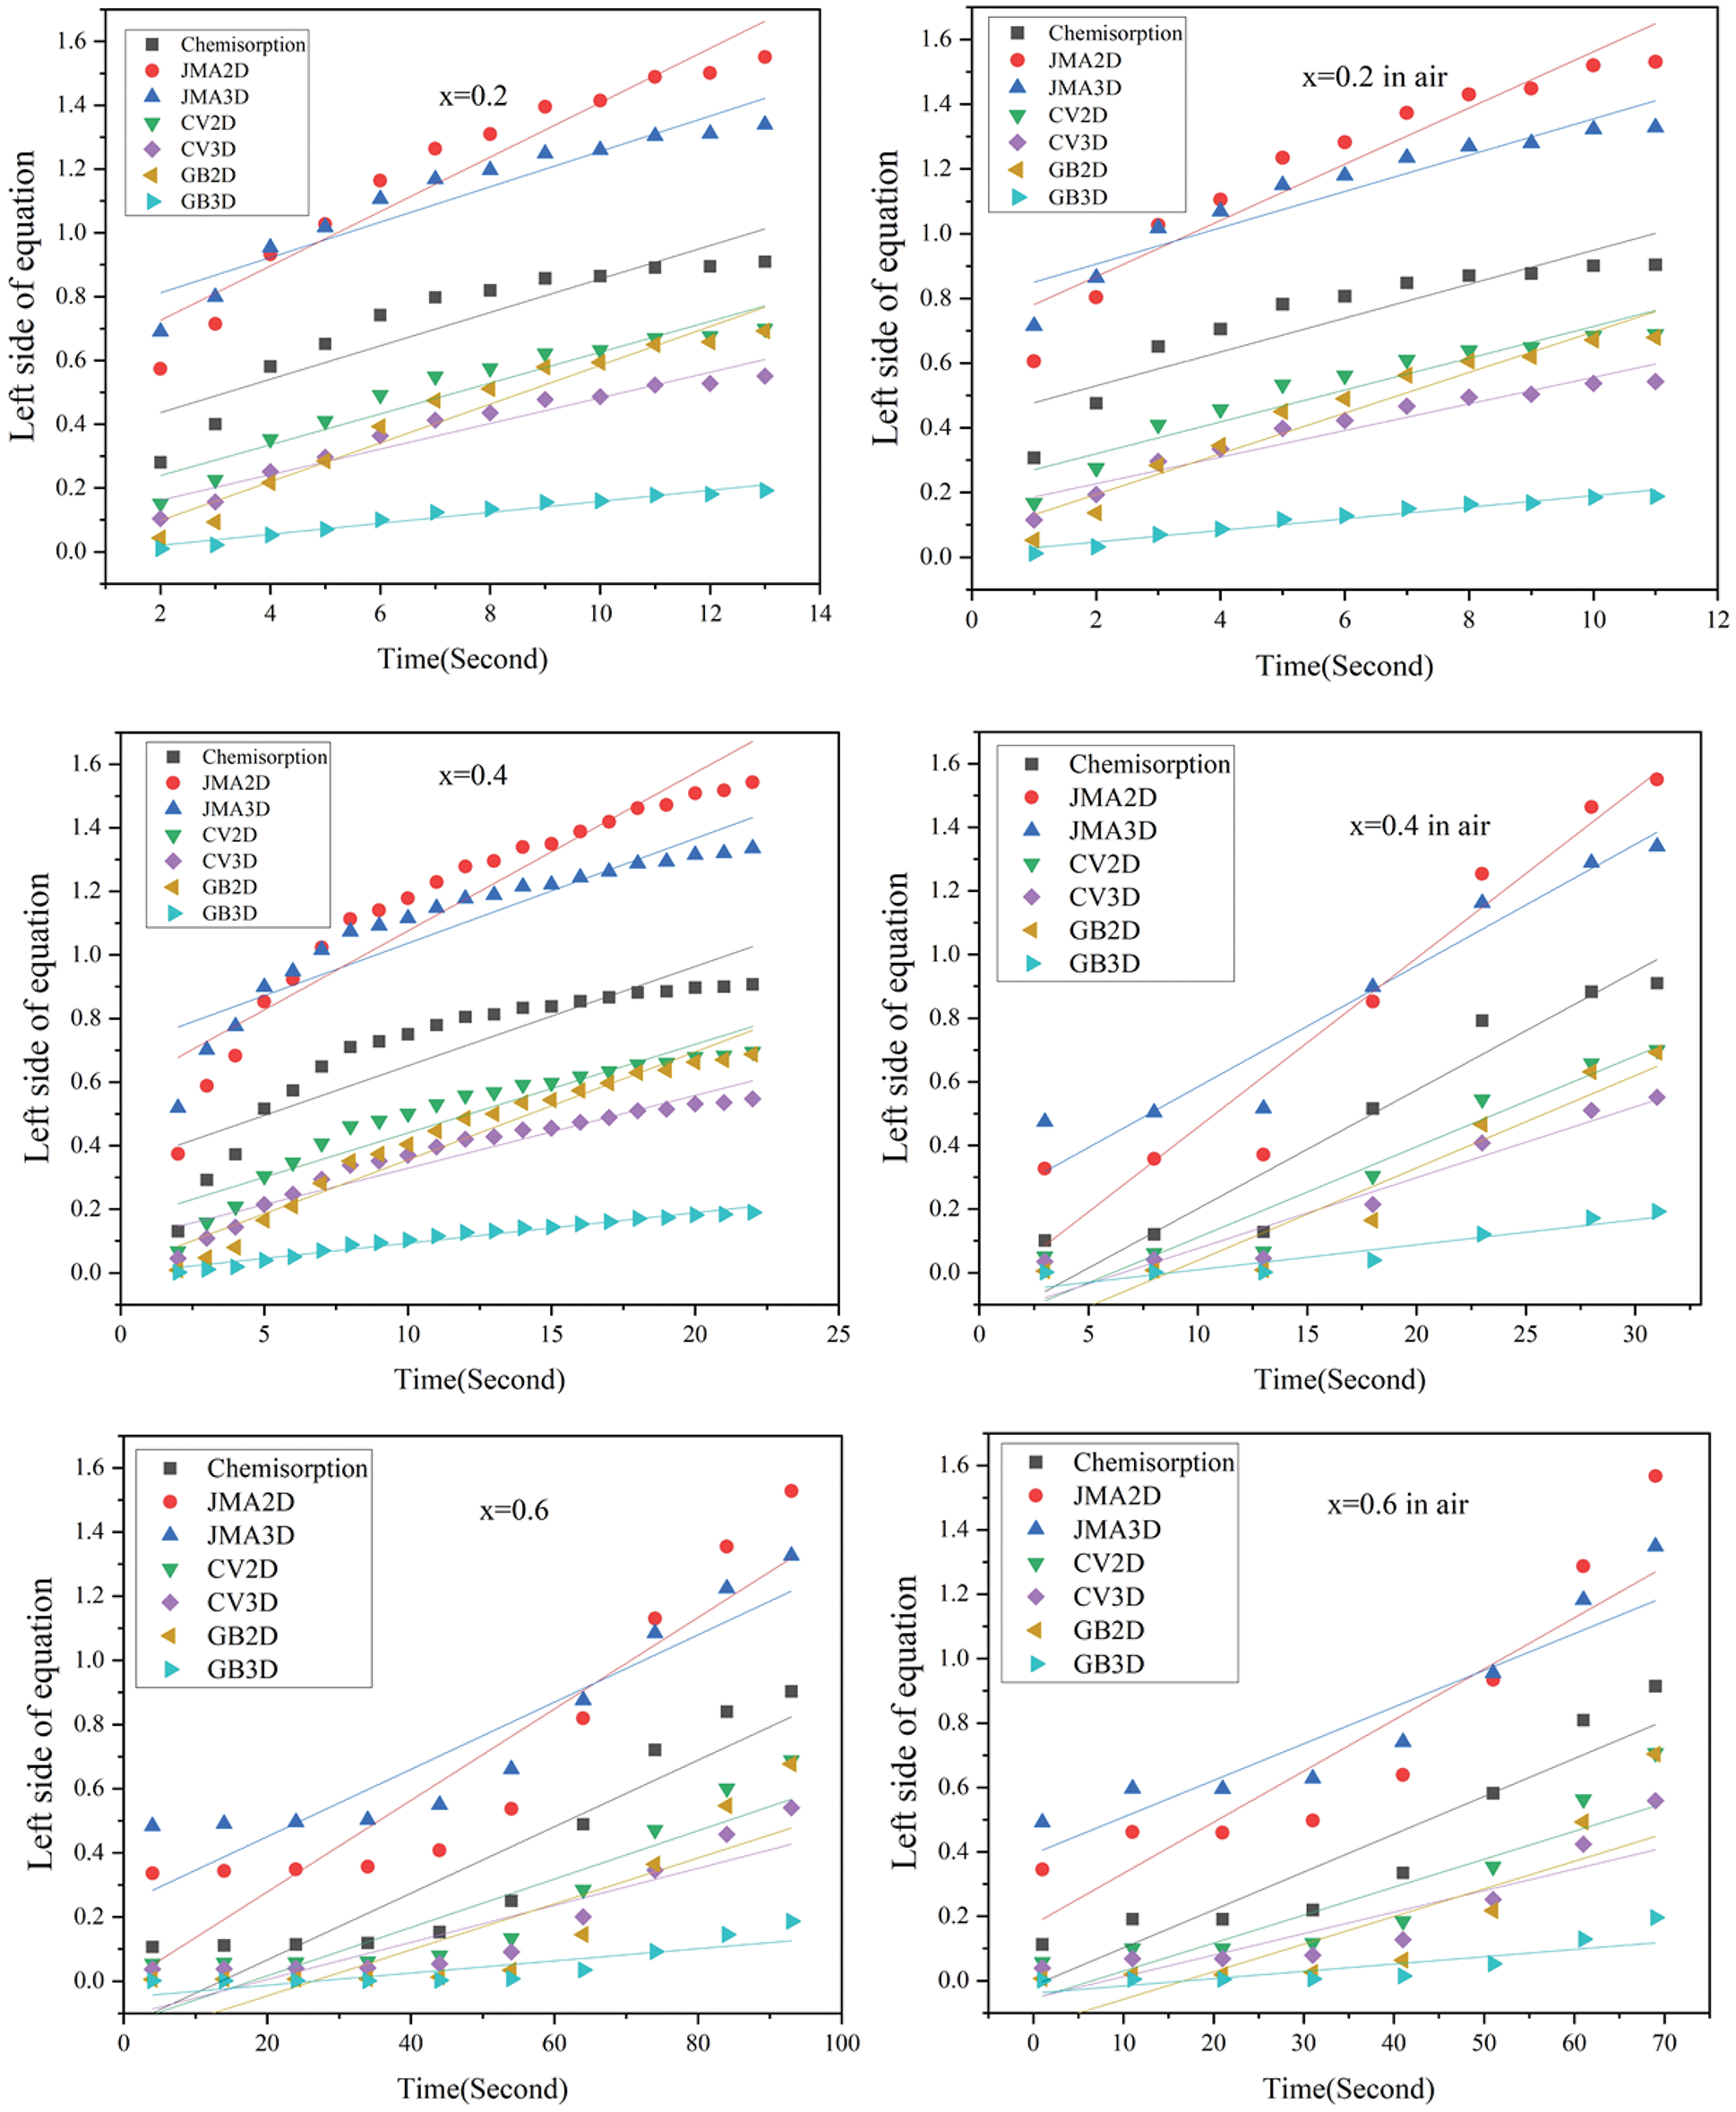
Figure 14: Rate limiting step curves calculated from of first hydrogenation curves of Zr(Cr1−xCox)2 (x = 0.2, 0.4 and 0.6) alloys before and after air exposure for 24 h
We mainly studied the morphology, hydrogen storage properties, anti-oxide ability and rate limiting step of Zr(Cr1−xCox)2 (x = 0, 0.2, 0.4 and 0.6) alloys in this work. The conclusions are made as follows:
(1) All alloy samples showed the C14-type phase, but the alloy sample x = 0 also showed a small amount of Cr phase. The introducing Co resulted in the minor contraction of the unit cell volume of the C14-type phase. This meant that there was a decrease in the size of the interstitial sites, which held fewer hydrogen atoms.
(2) Introducing Co to ZrCr2 alloy could obviously lower its first hydrogenation condition without prior heat treatment and hydrogen exposure. The alloy could absorb the hydrogen directly after introducing Co. But the first hydrogen storage capacity of ZrCr2 alloy was reduced with Co content.
(3) Introducing more Co content to ZrCr2 alloy could enhance its effective hydrogen storage capacity and cycle stability. This meant that increasing Co content could effectively decrease the stability of Zr(Cr1−xCox)2 (x = 0, 0.2, 0.4 and 0.6) alloys-H2 system.
(4) Introducing Co to ZrCr2 alloy could improve its anti-oxide ability. All alloy samples could still absorb the hydrogen in less than 25 s with a slower hydrogen absorption rate and lower hydrogen storage capacity. This may be because introducing Co could result in the formation of the oxides of Co on the alloy surface. These oxides reduced the diffusion rate of hydrogen atoms and lowered the maximum first hydrogen storage capacity of the alloy.
(5) Air exposure for 24 h had no effect on rate limiting step of the alloy samples x = 0.2 and 0.6, which still showed GB3D and JMA3D model. But for the alloy sample x = 0.4, air exposure for 24 h resulted in the change of the rate limiting step from GB3D to JMA3D model.
Funding Statement: This work is supported by Natural Science Foundation of Jiangxi Province (20202BABL214003), Jiangxi Key Laboratory for Mass Spectrometry and Instrumentation (JXMS202008 and JXMS202009), Jiangxi Province Key Laboratory of Polymer Micro/Nano Manufacturing and Devices (PMND201902), Engineering Research Center of Nuclear Technology Application (East China University of Technology), Ministry of Education (HJSJYB2019–5), Science and Technology Project Founded by Education Department of Jiangxi Province (GJJ190406), Research Foundation for Advanced Talents of East China University of Technology (DHBK2019091).
Conflicts of Interest: The authors declare that they have no conflicts of interest to report regarding the present study.
References
1. Tarhan, C., Çil, M. A. (2021). A study on hydrogen, the clean energy of the future: Hydrogen storage methods. Journal of Energy Storage, 40, 102676. DOI 10.1016/j.est.2021.102676. [Google Scholar] [CrossRef]
2. Shet, S. P., Shanmuga Priya, S., Sudhakar, K., Tahir, M. (2021). A review on current trends in potential use of metal-organic framework for hydrogen storage. International Journal of Hydrogen Energy, 46(21), 11782–11803. DOI 10.1016/j.ijhydene.2021.01.020. [Google Scholar] [CrossRef]
3. Hou, Q., Yang, X., Zhang, J. (2021). Review on hydrogen storage performance of MgH2: Development and trends. ChemistrySelect, 6(7), 1589–1606. DOI 10.1002/slct.202004476. [Google Scholar] [CrossRef]
4. Ali, N. A., Ismail, M. (2021). Advanced hydrogen storage of the Mg-Na-Al system: A review. Journal of Magnesium and Alloys, 9(4), 1111–1122. DOI 10.1016/j.jma.2021.03.031. [Google Scholar] [CrossRef]
5. Srinivasan, S. S., Demirocak, D. E. (2017). Nanostructured materials for next-generation energy storage and conversion: Hydrogen production, storage, and utilization, pp. 225–255. Berlin, Heidelberg: Springer. DOI 10.1007/978-3-662-53514-1_8. [Google Scholar] [CrossRef]
6. Ali, N. A., Sazelee, N. A., Ismail, M. (2021). An overview of reactive hydride composite (RHC) for solid-state hydrogen storage materials. International Journal of Hydrogen Energy, 46(62), 31674–31698. DOI 10.1016/j.ijhydene.2021.07.058. [Google Scholar] [CrossRef]
7. Luo, L., Ye, X., Zhao, C., Zhang, G., Kou, H. et al. (2020). Effects of Mo substitution on the kinetic and thermodynamic characteristics of ZrCo1-xMox (x = 0–0.2) alloys for hydrogen storage. International Journal of Hydrogen Energy, 45(4), 2989–2998. DOI 10.1016/j.ijhydene.2019.11.126. [Google Scholar] [CrossRef]
8. Teliz, E., Díaz, V., Piganelli, F., Faccio, R., Zinola, C. F. (2018). Thermodynamic analysis of AB2 hydrides: ZrCr1-xTixNiMo0.3 alloys. Journal of the Electrochemical Society, 165(14), A3389. DOI 10.1149/2.0751814jes. [Google Scholar] [CrossRef]
9. Merlino, A. R., Luna, C. R., Juan, A., Pronsato, M. E. (2016). A DFT study of hydrogen storage in Zr(Cr0.5Ni0.5)2 laves phase. International Journal of Hydrogen Energy, 41(4), 2700–2710. DOI 10.1016/j.ijhydene.2015.10.077. [Google Scholar] [CrossRef]
10. Erika, T., Ricardo, F., Fabricio, R., Fernando, Z., Verónica, D. (2015). Electrochemical and metallurgical characterization of ZrCr1-xNiMox AB2 metal hydride alloys. Journal of Alloys Compounds, 649, 267–274. DOI 10.1016/j.jallcom.2015.07.206. [Google Scholar] [CrossRef]
11. Babai, D., Bereznitsky, M., Shneck, R. Z., Jacob, I. (2020). Compounds, mutual impact of crystal volume and heat of alloy formation on hydride stabilities in Zr (PdxCr1−x)2 and similar intermetallics. Journal of Alloys and Compounds, 814, 152268–152268. DOI 10.1016/j.jallcom.2019.152268. [Google Scholar] [CrossRef]
12. Zinola, C. F., Díaz, V., Teliz, E. (2016). Electrochemical determination of physicochemical and mechanical properties in ZrCr1-xNiMox hydrides. Journal of the Electrochemical Society, 163(13), A2579–A2585. DOI 10.1149/2.0501613jes. [Google Scholar] [CrossRef]
13. Drašner, A., Blaẑina, Ẑ (2010). The influence of Si and Ge on the hydrogen sorption properties of the intermetallic compound ZrCr2. Journal of Alloys Compounds, 199(1–2), 101–104. DOI 10.1016/0925-8388(93)90433-N. [Google Scholar] [CrossRef]
14. Bulyk, I. I., Basaraba, Y. B., Dovhyj, Y. O. (2006). Influence of Ti on the hydrogen-induced phase-structure transformations in the ZrCr2 intermetallic compound. Intermetallics, 14(7), 735–741. DOI 10.1016/j.intermet.2005.11.008. [Google Scholar] [CrossRef]
15. Hong, S., Fu, C. (2002). Hydrogen in laves phase ZrX2 (X=V, Cr, Mn, Fe, Co. Ni) Compounds: Binding energies and electronic and magnetic structure. Physical Review B, 66(9), 094109. [Google Scholar]
16. Drasner, A., Blazina, Z. (1991). On the structural and hydrogen desorption properties of the Zr(Cr1-xCux)2 alloys. Journal of the Less-Common Metals, 175(1), 103–108. DOI 10.1016/0022-5088(91)90354-7. [Google Scholar] [CrossRef]
17. Drašner, A., Blažina, Ž. (1991). On the structural and hydrogen desorption properties of the Zr(Cr1-xNix)2 alloys. Journal of the Less-Common Metals, 163(1), 151–157. DOI 10.1016/0022-5088(90)90094-Z. [Google Scholar] [CrossRef]
18. Bodega, J., Fernández, J. F., Leardini, F., Ares, J. R., Sánchez, C. (2011). Synthesis of hexagonal C14/C36 and cubic C15 ZrCr2 laves phases and thermodynamic stability of their hydrides. Journal of Physics and Chemistry of Solids, 72(11), 1334–1342. DOI 10.1016/j.jpcs.2011.08.004. [Google Scholar] [CrossRef]
19. Ahmad, J., Maekawa, H., Takamura, H., Oikawa, I., Ando, M. et al. (2012). In situ NMR study of hydrogenation/dehydrogenation of ZrCr2 and physisorbed hydrogen. Journal of Alloys and Compounds, 540, 222–227. DOI 10.1016/j.jallcom.2012.06.080. [Google Scholar] [CrossRef]
20. Ha, T., Lee, S. I., Hong, J., Lee, Y. S., Kim, D. I. et al. (2021). Hydrogen storage behavior and microstructural feature of a TiFe–ZrCr2 alloy. Journal of Alloys Compounds, 853, 157099. DOI 10.1016/j.jallcom.2020.157099. [Google Scholar] [CrossRef]
21. Liang, L., Wang, F., Wang, J., Wu, C., Wang, Z. et al. (2022). Effects of V doping on microstructure, kinetic, and thermodynamic characteristics of Zr50-xVxCo50 (x = 0, 2.5, 3.5, and 5.0) hydrogen storage alloys. International Journal of Energy Research, 46(5), 6833–6846. [Google Scholar]
22. Yao, Z., Xiao, X., Liang, Z., Kou, H., Luo, W. C. et al. (2019). Improvement on the kinetic and thermodynamic characteristics of Zr1-xNbxCo (x = 0–0.2) alloys for hydrogen isotope storage and delivery. Journal of Alloys and Compounds, 784(5), 1062–1070. [Google Scholar]
23. Lu, C., Zou, J., Zeng, X., Ding, W. (2017). Hydrogen storage properties of core-shell structured Mg@TM (TM= Co., V) Composites. International Journal of Hydrogen Energy, 42(22), 15246–15255. [Google Scholar]
24. Jat, R. A., Pati, S., Parida, S. C., Agarwal, R., Mukerjee, S. K. (2017). Synthesis, characterization and hydrogen isotope storage properties of Zr-Ti-Co ternary alloys. International Journal of Hydrogen Energy, 42(4), 2248–2256. [Google Scholar]
25. Qu, H., Du, J., Pu, C., Niu, Y., Huang, T. et al. (2015). Effects of Co introduction on hydrogen storage properties of Ti-Fe-Mn alloys. International Journal of Hydrogen Energy, 40(6), 2729–2735. [Google Scholar]
26. Hirosawa, S., Pourarian, F., Sinha, V. K., Wallace, W. E. (1983). Magnetic properties of Zr(Cr1-xCox)2 alloys and their hydrides. Journal of Magnetism Magnetic Materials, 38(2), 159–164. [Google Scholar]
27. Soubeyroux, J. L., Bououdina, M., Fruchart, D., Pontonnier, L. (1995). ChemInform abstract: Phase stability and neutron diffraction studies of laves phases Zr(Cr1-xMx)2 with M: Mn, Fe, Co, Ni, Cu and 0 < x < 0.2 and their hydrides. Journal of Alloys Compounds, 219(1–2), 48–54. [Google Scholar]
28. Lutterotti, L., Matthies, S., Wenk, H. R. (1999). MAUD: A friendly java program for material analysis using diffraction. IUCr: Newsletter of the CPD, 21, 14–15. [Google Scholar]
29. Kanazawa, S., Kaneno, Y., Inoue, H., Kim, W. Y., Takasugi, T. (2002). Microstructures and defect structures in ZrCr laves phase based intermetallic compounds. Intermetallics, 10(8), 783–792. [Google Scholar]
30. Bououdina, M., Soubeyroux, J., Fruchart, D. (1997). Stability of laves phases type of alloys ZrCr2(1−x) M2x and their hydrides. International Journal of Hydrogen Energy, 22(2–3), 329–332. [Google Scholar]
31. Bououdina, M., Soubeyroux, J. L., Rango, P., Fruchart, D. (2000). Phase stability and neutron diffraction studies of the laves phase compounds Zr(Cr1−xMox)2 with 0.0 ≤ x ≤ 0.5 and their hydrides. International Journal of Hydrogen Energy, 25(11), 1059–1068. DOI 10.1016/S0360-3199(99)00087-7. [Google Scholar] [CrossRef]
32. Bououdina, M., Soubeyroux, J. L., Fruchart, D. (2000). Study of the ZrCr0.7ni1.3 multiphased system under hydrogen pressure by in-situ neutron diffraction. Journal of Alloys and Compounds, 311(2), 248–251. DOI 10.1016/S0925-8388(00)01061-6. [Google Scholar] [CrossRef]
33. Van Midden, H. J., Prodan, A., Zupanic, E., Zitko, R., Makridis, S. et al. (2010). Structural and electronic properties of the hydrogenated ZrCr2 laves phases. The Journal of Physical Chemistry C, 114(9), 4221–4227. DOI 10.1021/jp9101288. [Google Scholar] [CrossRef]
34. Jacob, I., Shaltiel, D. (1978). Hydrogen absorption in Zr(AlxB1−x)2 (B=Fe, Co) laves phase compounds. Solid State Communications, 27(2), 175–180. DOI 10.1016/0038-1098(78)90826-8. [Google Scholar] [CrossRef]
35. Dematteis, E. M., Cuevas, F., Latroche, M. (2021). Hydrogen storage properties of Mn and Cu for Fe substitution in TiFe0.9 intermetallic compound. Journal of Alloys and Compounds, 851(15), 156075. DOI 10.1016/j.jallcom.2020.156075. [Google Scholar] [CrossRef]
36. Zeaiter, A., Nardin, P., Pour Yazdi, M. A., Billard, A. (2019). Outstanding shortening of the activation process stage for a TiFe-based hydrogen storage alloy. Materials Research Bulletin, 112, 132–141. DOI 10.1016/j.materresbull.2018.12.015. [Google Scholar] [CrossRef]
37. Zadorozhnyy, V., Berdonosova, E., Gammer, C., Eckert, J., Zadorozhnyy, M. et al. (2019). Mechanochemical synthesis and hydrogenation behavior of (TiFe)100−xNix alloys. Journal of Alloys and Compounds, 796, 42–46. DOI 10.1016/j.jallcom.2019.04.339. [Google Scholar] [CrossRef]
38. Shang, H., Zhang, Y., Li, Y., Qi, Y., Guo, S. et al. (2019). Effects of adding over-stoichiometrical Ti and substituting Fe with Mn partly on structure and hydrogen storage performances of TiFe alloy. Renewable Energy, 135, 1481–1498. DOI 10.1016/j.renene.2018.09.072. [Google Scholar] [CrossRef]
39. Wang, F., Liu, J., Liang, L., Luo, Y., Xiong, T. et al. (2022). Synergetic catalyst effect of Ni/Pd dual metal coating accelerating hydrogen storage properties of ZrCo alloy. International Journal of Hydrogen Energy, 47(17), 9946–9957. DOI 10.1016/j.ijhydene.2022.01.096. [Google Scholar] [CrossRef]
40. Zhou, S., Zhang, X., Wang, L., Zhao, Y., Xiong, W. et al. (2021). Effect of element substitution and surface treatment on low temperature properties of AB3.42-type La-Y-Ni based hydrogen storage alloy. International Journal of Hydrogen Energy, 46(5), 3414–3424. DOI 10.1016/j.ijhydene.2020.10.158. [Google Scholar] [CrossRef]
41. Zhu, Z., Zhu, S., Lu, H., Wu, J., Yan, K. et al. (2019). Stability of lani5−xCox alloys cycled in hydrogen—Part 1 evolution in gaseous hydrogen storage performance. International Journal of Hydrogen Energy, 44(29), 15159–15172. DOI 10.1016/j.ijhydene.2019.04.111. [Google Scholar] [CrossRef]
42. Liu, J., Zheng, Z., Cheng, H., Li, K., Yan, K. et al. (2018). Long-term hydrogen storage performance and structural evolution of LaNi4Al alloy. Journal of Alloys and Compounds, 731, 172–180. DOI 10.1016/j.jallcom.2017.10.042. [Google Scholar] [CrossRef]
43. Chen, Z., Xiao, X., Chen, L., Fan, X., Liu, L. et al. (2014). Influence of Ti super-stoichiometry on the hydrogen storage properties of Ti1+ xCr1.2Mn0.2Fe0.6 (x = 0–0.1) alloys for hybrid hydrogen storage application. Journal of Alloys and Compounds, 585, 307–311. DOI 10.1016/j.jallcom.2013.09.141. [Google Scholar] [CrossRef]
44. Beeri, O., Cohen, D., Gavra, Z., Mintz, M. H. (2003). Sites occupation and thermodynamic properties of the TiCr2xMnx-H2(0≤x≤1) system: Statistical thermodynamics analysis. Journal of Alloys and Compounds, 352(1–2), 111–122. DOI 10.1016/S0925-8388(02)01155-6. [Google Scholar] [CrossRef]
45. Lv, P., Liu, Z., Dixit, V., Huot, J. (2019). Improved hydrogen storage properties of TiFe alloy by doping (Zr+2 V) additive and using mechanical deformation. International Journal of Hydrogen Energy, 44(51), 27843–27852. DOI 10.1016/j.ijhydene.2019.08.249. [Google Scholar] [CrossRef]
46. Barkhordarian, G., Klassen, T., Bormann, R. (2006). Kinetic investigation of the effect of milling time on the hydrogen sorption reaction of magnesium catalyzed with different Nb2O5 contents. Journal of Alloys and Compounds, 407(1), 249–255. DOI 10.1016/j.jallcom.2005.05.037. [Google Scholar] [CrossRef]
47. Avrami, M. (1941). Granulation, phase change, and microstructure kinetics of phase change. II. The Journal of Chemical Physics, 9(2), 177–184. DOI 10.1063/1.1750872. [Google Scholar] [CrossRef]
48. Bösenberg, U., Kim, J. W., Gosslar, D., Eigen, N., Jensen, T. R. et al. (2010). Role of additives in LiBH4–MgH2 reactive hydride composites for sorption kinetics. Acta Materialia, 58(9), 3381–3389. DOI 10.1016/j.actamat.2010.02.012. [Google Scholar] [CrossRef]
49. Koga, N., Criado, J. M. (1998). Kinetic analyses of solid-state reactions with a particle-Size distribution. Journal of the American Ceramic Society, 81(11), 2901–2909. DOI 10.1111/(ISSN)1551-2916. [Google Scholar] [CrossRef]
50. Ginstling, A., Brounshtein, B. (1950). Concerning the diffusion kinetics of reactions in spherical particles. Journal of Applied Chemistry, 23(12), 1327–1338. [Google Scholar]
51. Lv, P., Zhong, C., Huang, D., Zhou, X., Liu, Z. et al. (2022). Effect of introducing manganese as additive on microstructure, hydrogen storage properties and rate limiting step of Ti-Cr alloy. International Journal of Hydrogen Energy, 47(1), 459–469. DOI 10.1016/j.ijhydene.2021.10.029. [Google Scholar] [CrossRef]
52. Lang, J., Eagles, M., Conradi, M. S., Huot, J. (2014). Hydrogenation rate limiting step, diffusion and thermal conductivity in cold rolled magnesium hydride. Journal of Alloys and Compounds, 583, 116–120. DOI 10.1016/j.jallcom.2013.08.126. [Google Scholar] [CrossRef]
Cite This Article
 Copyright © 2023 The Author(s). Published by Tech Science Press.
This work is licensed under a Creative Commons Attribution 4.0 International License , which permits unrestricted use, distribution, and reproduction in any medium, provided the original work is properly cited.
 Downloads
 Citation Tools