
 Submit a Paper
 Propose a Special lssue
 Open Access
ARTICLE

Effect of Polypropylene Fiber on the Unconfined Compressive Strength of Loess with Different Water Content
1
College of Geological Engineering and Geomatics, Chang’an University, Xi’an, 710054, China
2
Ningxia Institute of Survey and Monitoring of Land and Resources, Yinchuan, 750002, China
* Corresponding Author: Haiman Wang. Email:
Journal of Renewable Materials 2023, 11(4), 1699-1814. https://doi.org/10.32604/jrm.2022.023805
Received 16 May 2022; Accepted 18 July 2022; Issue published 01 December 2022
 View Full Text
 Download PDF
Abstract
Fiber-reinforced soils have been of great interest to experimenters for building foundations’strength performance, time, and economy. This paper investigates the effects of water content and polypropylene fiber dosage and length on loess’s unconfined compressive strength (UCS) according to the central composite response surface design test procedure. The water content is 11%–25%, the mass ratio of fiber to soil is 0.1%–0.9%, and the fiber length ranges from 6–18 mm. The response surface method (RSM) developed full quadratic models of different variables with response values. After analysis of variance (ANOVA), the mathematical model developed in this study was statistically significant (p ≤ 0.05) and applicable to the optimization process. The optimization results showed that the optimal water content values, fiber amount, and fiber length were 16.41%, 0.579%, and 14.90 mm, respectively. The unconfined compressive strength of the optimized specimens was increased by 288.017 kPa. The research results can reference the design and construction of fiber-reinforced soil in practical projects such as road base engineering and foundation engineering.Graphic Abstract
Keywords
Collapsible loess is a typical structural soil with strong water sensitivity [1,2]. Although loess exhibits high strength and low compressibility at low water content, its strength decreases when wetted with water [3]. Loess is widely distributed worldwide, a large area of loess covers the northwest of China, and seepage of water leading to instability of the foundation is not uncommon [4]. Especially near the highway pipe culvert, it is easy to cause the soil water content to rise, which causes the soil strength to decrease. The water content of different parts of the roadbed is very different, so it is necessary to improve the loess roadbed with different water content to meet the design strength requirements.
Because traditional stabilizers such as lime and cement have good pozzolanic properties with soil particles, they are often used to improve the engineering properties of soil [5,6]. Traditional stabilizers can improve loess’s physical and mechanical properties by reducing the soil’s water content and increasing the density. However, conventional stabilizers suffer from high energy consumption, CO2 emissions, and resource depletion, e.g., approximately one ton of CO2 is released into the environment for each ton of cement produced [7]. Researchers have been searching for alternatives to traditional improved materials [8,9]. Fiber reinforcement is a new type of soil improvement technique to improve the engineering mechanical properties of soil by uniformly mixing dispersed fiber filaments into the soil to form a soil-reinforcement composite [10]. Since fibers are uniformly distributed in the soil and act as reinforcement in all directions, one of the main advantages of randomly distributed fibers is that there are no potential weak planes parallel to the oriented reinforcing material. Thus, fiber reinforcement is considered a three-dimensional reinforcing technique, and fiber-reinforced soils are often considered isotropic homogeneous materials [11]. The more commonly used fibers are natural and artificial synthetic fibers in two categories [12]. Polypropylene fiber is a polymer compound polymerized by a unique process with high strength, heat resistance, acid and alkali resistance, and no water absorption. Therefore, in recent years attention has shifted to applying polypropylene fibers in soil improvement, including expansive soils, tunnels, landfill linings, and geological barriers [13–16].
Several scholars have conducted experiments on the mechanical properties of reinforced soils [17,18]. The cohesion and the internal friction angle of polypropylene fiber reinforced clay increased and then decreased with fiber content. Akbulut et al. [19] proposed that the shear strength decreases with increasing fiber content for fiber contents exceeding 2%. Fiber-reinforced sandy soils increase residual strength and reduce soil brittleness but have little effect on peak strength [18–20]. The addition of fibers also reduces the volume shrinkage and the number of surface cracks in the soil and improves the crack resistance of the soil [21,22]. The cement soil’s peak and residual strengths increase with the fibers’ content [23]. For fiber-reinforced loess, the main research elements were: unconfined compressive strength under dry and wet cycles and freeze-thaw cycles [24,25]; unconfined compressive strength [26,27]; triaxial shear behaviors [28–30]. The research method mainly uses the control variables method, which examines changes in the level of each independent variable while the other variables are held constant. The control variables approach requires many experiments when studying the effects of multiple factors on the dependent variable, and it is not easy to directly study the interactions between the factors. In order to overcome these drawbacks, a recent optimization technique called Response Surface Methodology (RSM), which utilizes the experimental data to fit first-order or second-order models, could be used. The RSM consists of a series of experiments designed to optimize a response. Due to its capability to provide reasonably alternative solutions for the decision support of engineering problems, RSM has been shown to be relatively beneficial for the determination of optimal mix proportions.
This paper uses polypropylene fiber as an additive material to develop the unconfined compressive strength of loess with different water content. This study applied the surface response method to fiber-strengthened loess and developed a quadratic model between the independent variables and response values. Finally, the mechanism of the influence of polypropylene fibers on the strength of loess was analyzed by scanning electron microscopy. The results of the study can provide theoretical guidance for the use of polypropylene fibers for reinforcing loess.
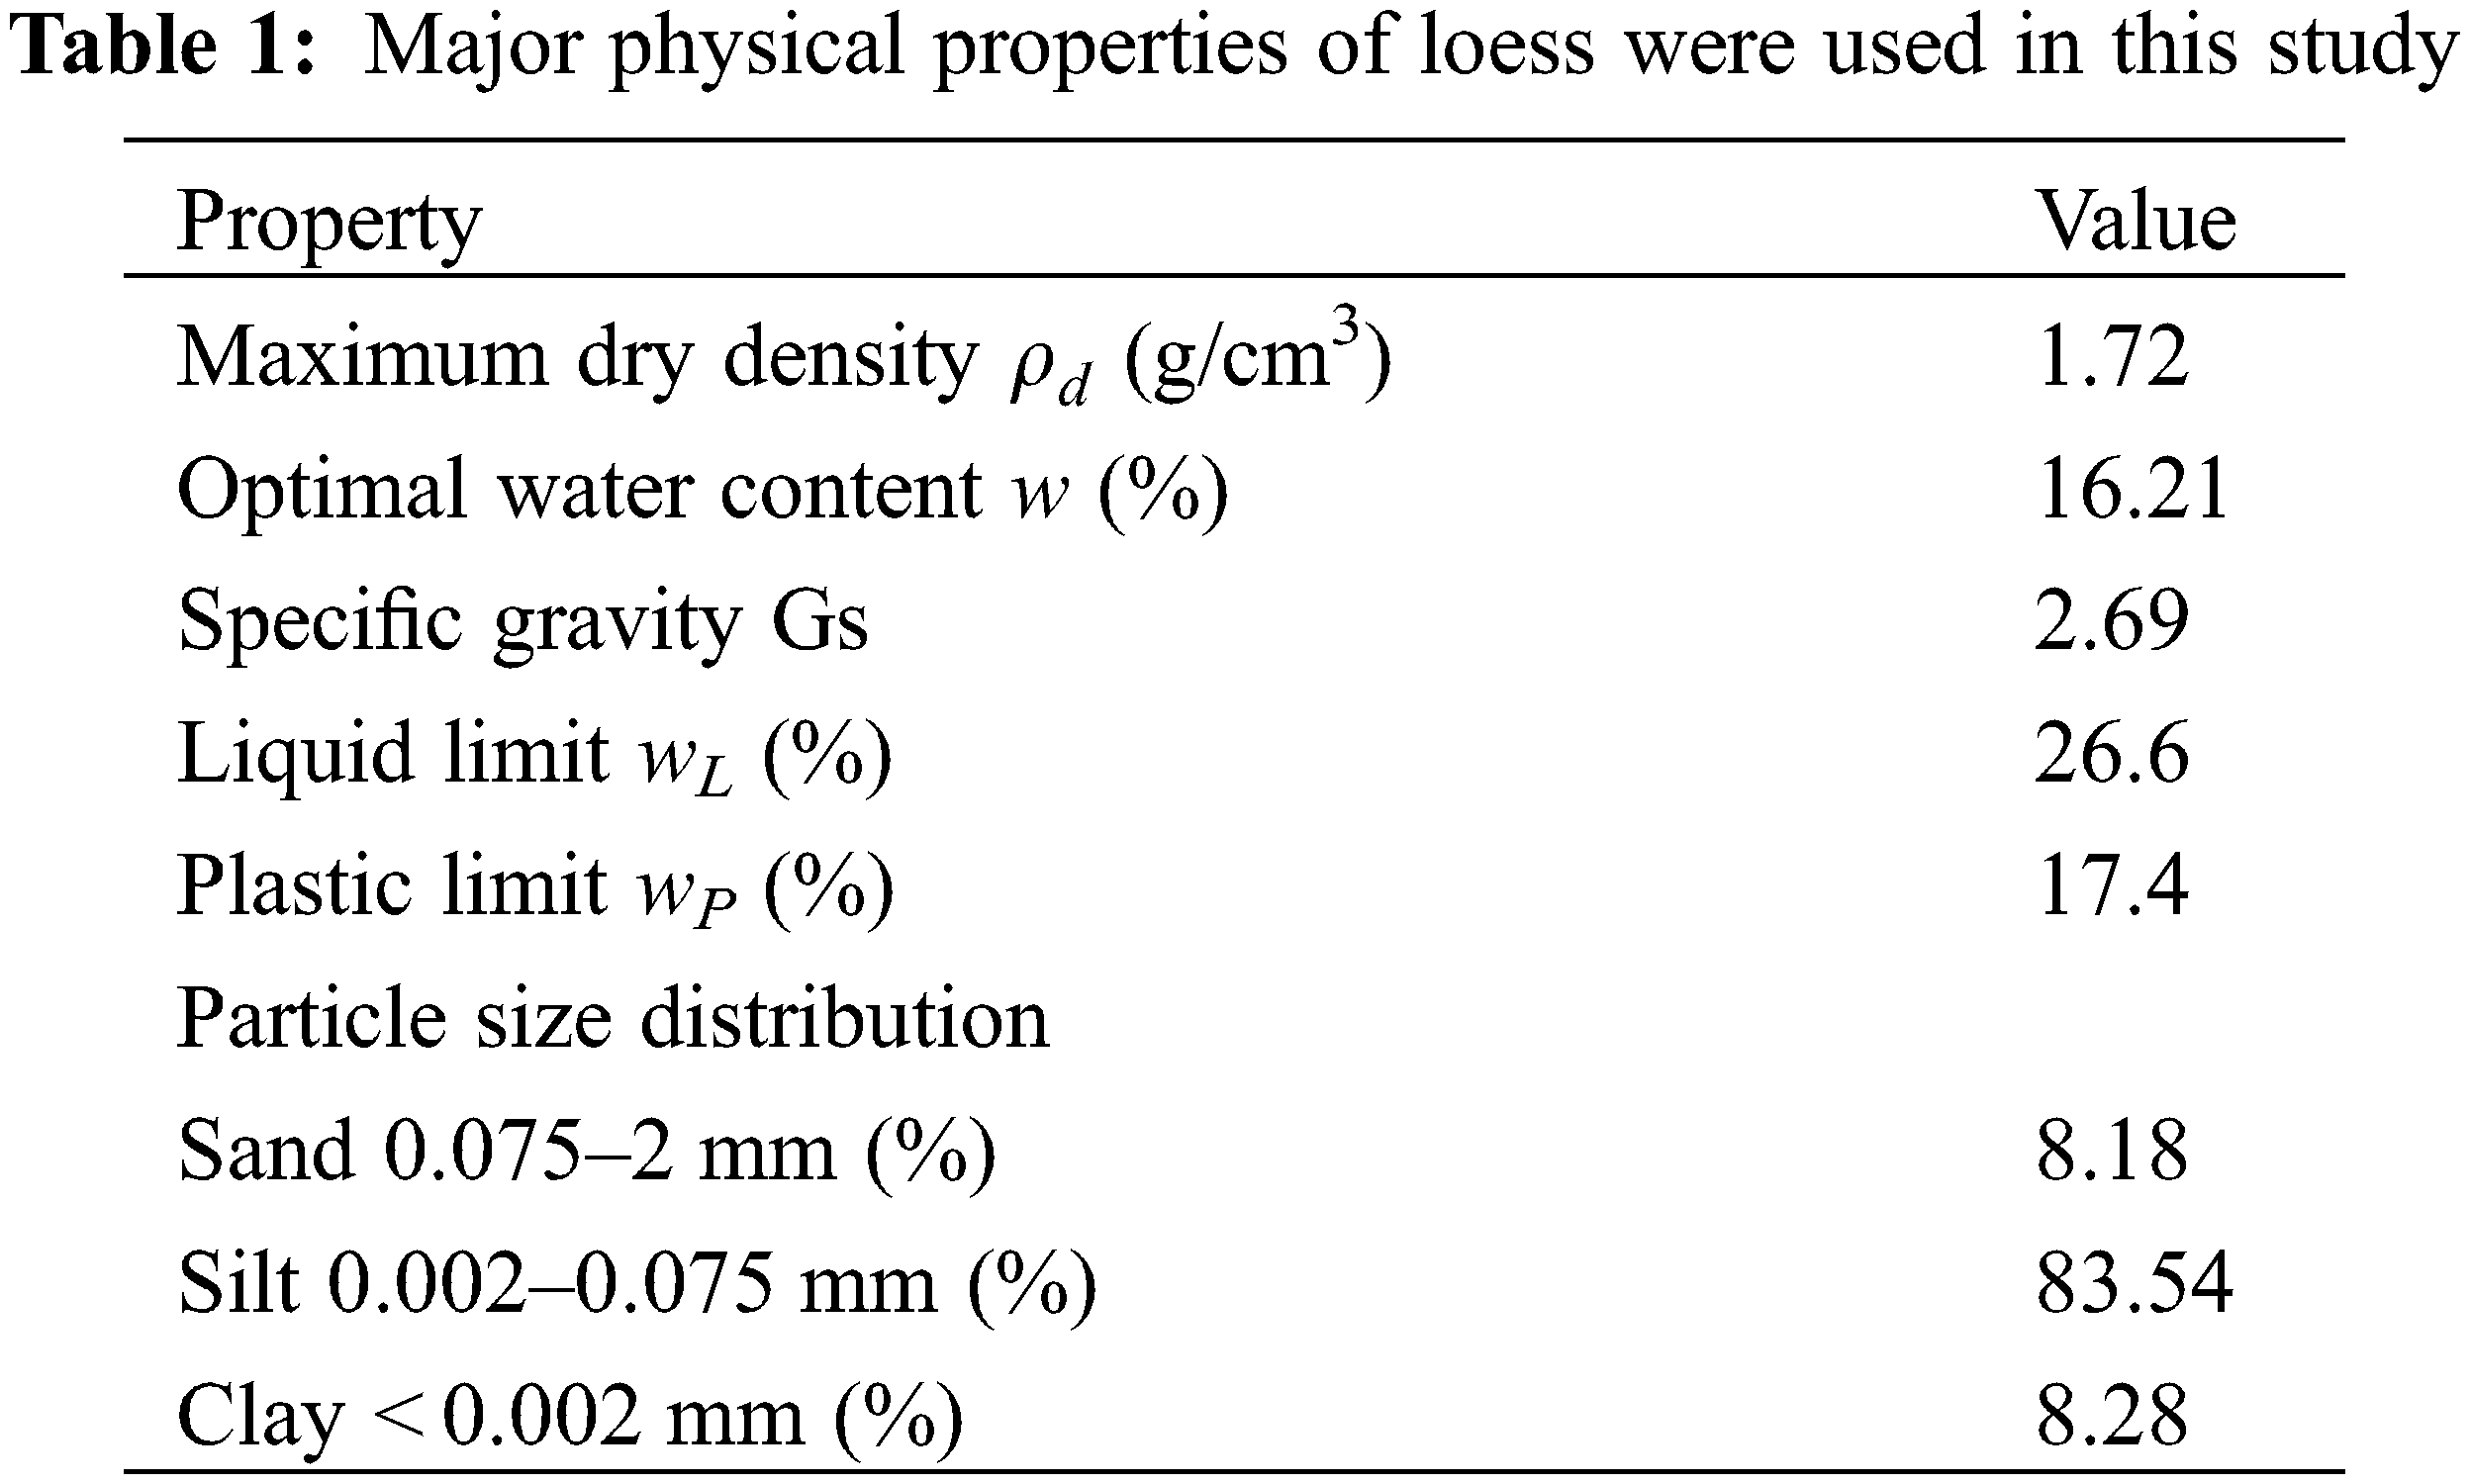
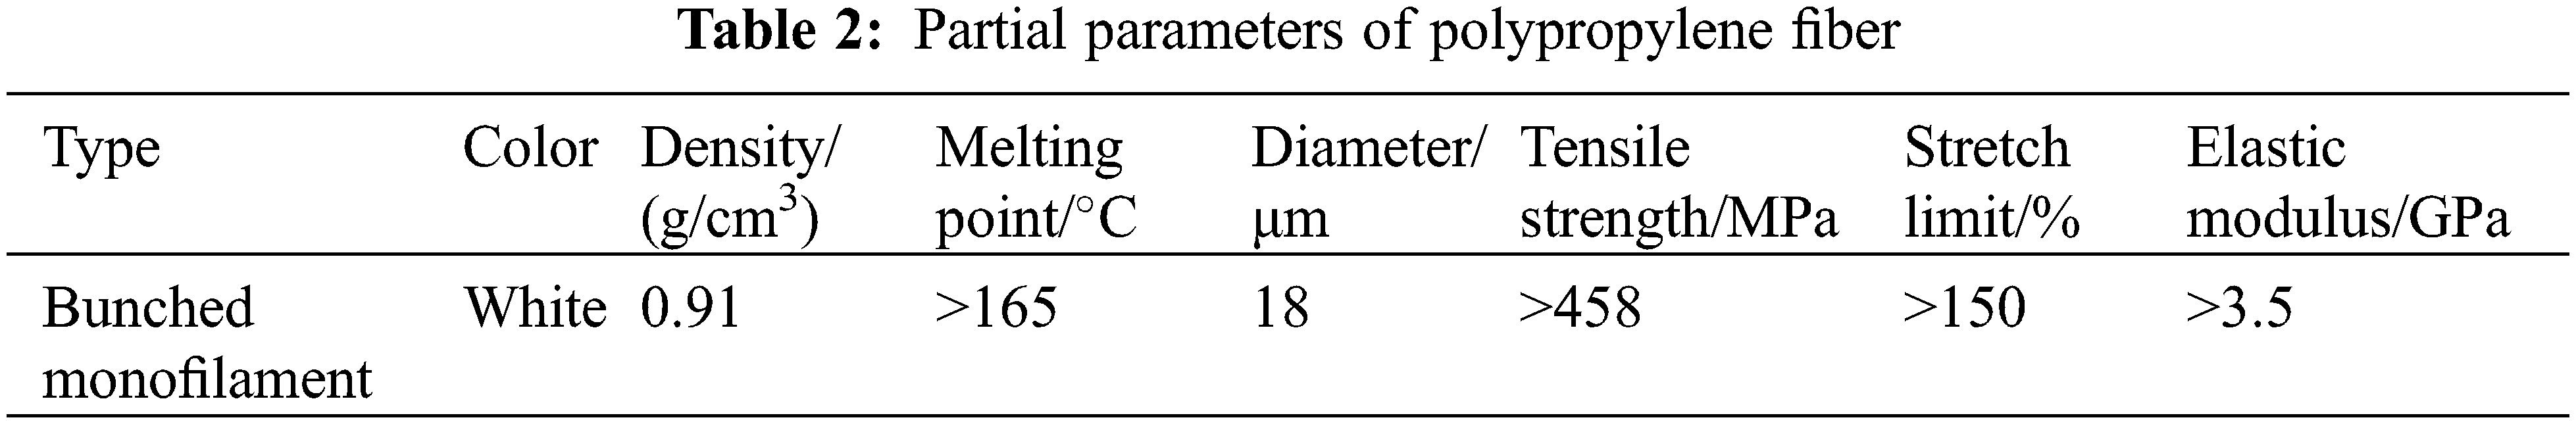
The loess specimens used in this paper were taken from Guyuan City, Ningxia Hui Autonomous Region, with a sampling depth of 3–3.2 m. The soil sample was Malan loess, and a Bettersize2000 laser particle size distribution instrument tested the particle size distribution. The results showed that the loess sample consisted mainly of silt particles (about 83.54%), with approximately the same sand and clay particle content of 8.18% and 8.28%, respectively (Fig. 1). The main physical properties of the loess were determined following the ASTM 2006 standard test methods [31], as listed in Table 1. The fiber selected for this study was polypropylene fibers, a strong monofilament organic fiber with chemically stable properties. Some physical indications of the polypropylene fibers used in the tests are listed in Table 2.

Figure 1: The distribution curve of loess particles
The test results were closely related to the specimen preparation method, so mixing the fibers with the soil was a major consideration in the specimen preparation process. The specific test steps were as follows: The soil obtained in the field was dried, crushed, and passed through a 2 mm sieve. The water mass of the soil humidified to the target water content is calculated, and then the water is added uniformly to the dry soil. After mixing, the soil was sealed and left to stand for 24 h to ensure uniform distribution of water in the soil. Since the fibers are bundles, they are first dispersed in water. The dispersed fibers were air-dried after being removed from the water and mixed into the soil. The dispersed fibers and soil were mixed well and put into the compactor for compaction, and the compaction work per unit volume of the control specimen was 592.2 kJ/m3. Finally, the compacted soil sample was chipped to the specimen size required for the unconfined compressive strength test. The specimen used for the unconfined compressive strength test is cylindrical with a diameter of 39.1 mm and a height of 80 mm. After the samples were prepared, they were placed in a constant temperature and humidity chamber for 7 days at 20°C and 70% humidity. The specimens’ unconfined compressive strength (UCS) was tested by a YSH-2 type unconfined pressure instrument produced by Nanjing Soil Instrument Factory, and the strain rate was controlled as 1 mm/min. Three parallel tests were conducted for each test condition to eliminate errors in test results and take the average value. After the unconfined compression test, representative soil samples were selected for electron microscopy scanning analysis to observe fibers’ distribution characteristics and interface morphology in the soil.
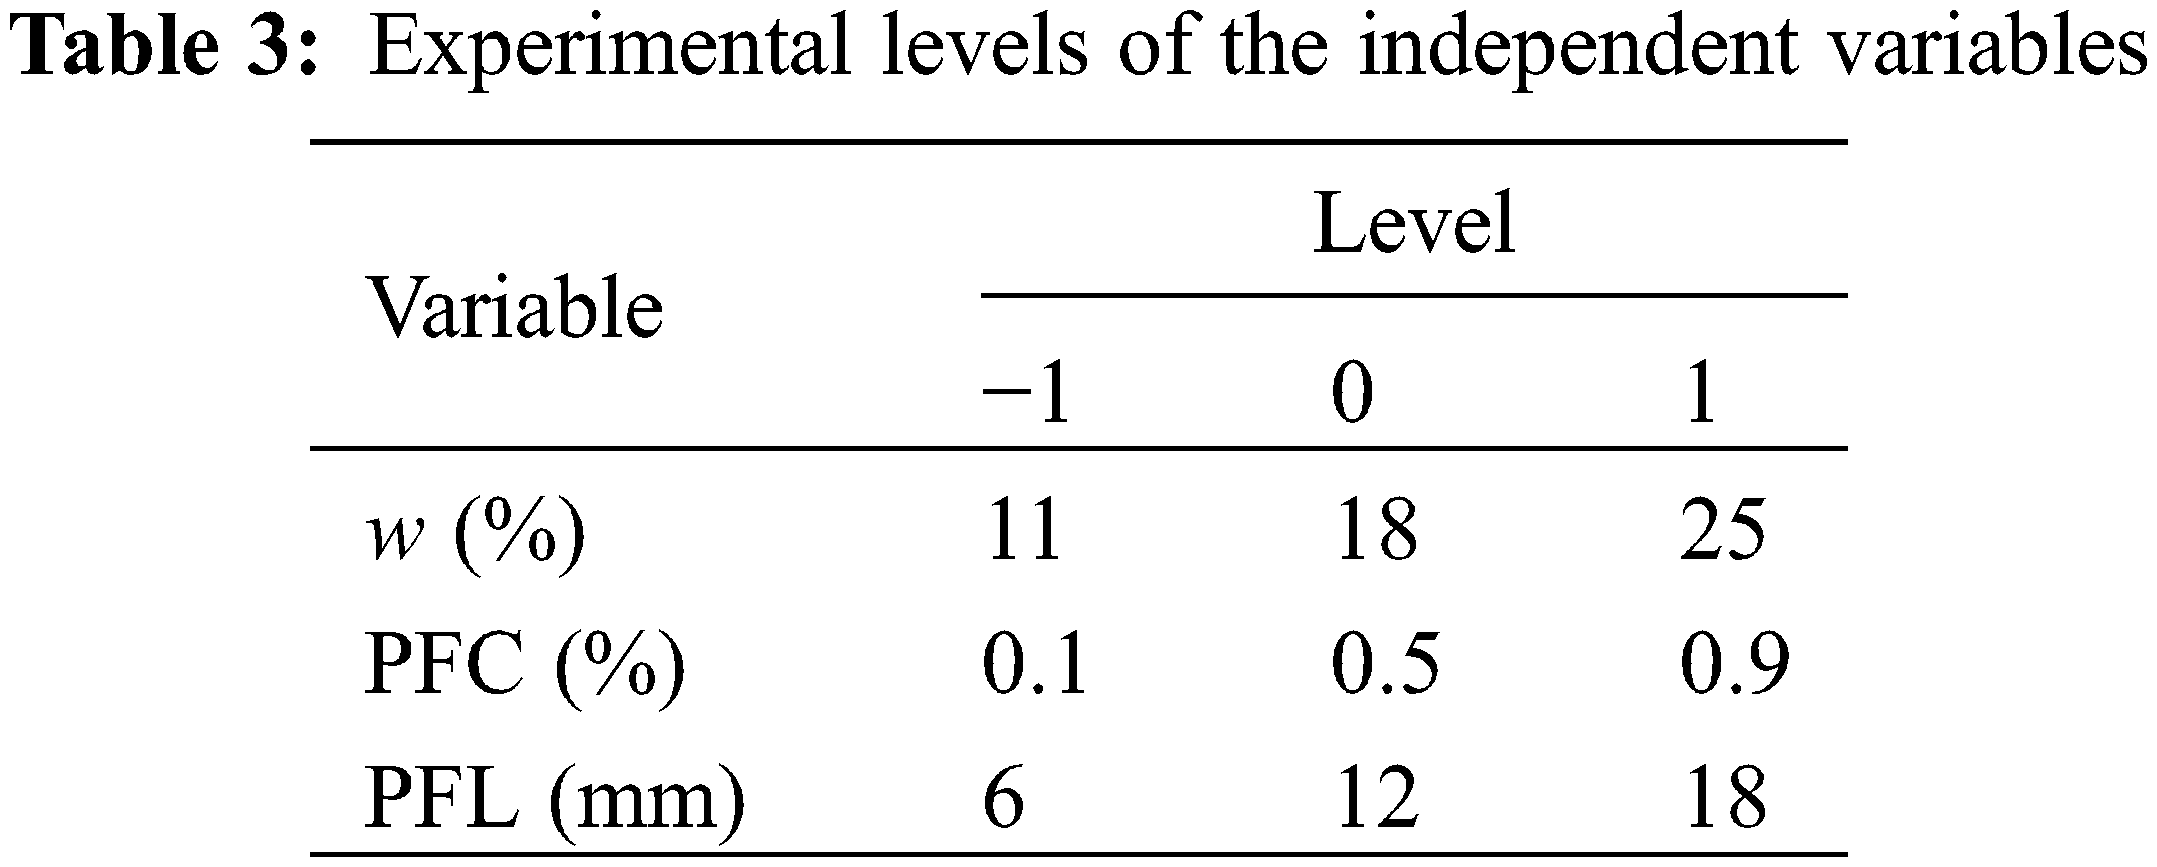
The response surface method (RSM) is a collection of statistical and mathematical techniques that can be used to develop, improve, and optimize the input terms in a manufacturing process [12,32]. The effect of several input (independent) variables on the output (response or dependent) variables can be thoroughly investigated by RSM. Compared to other statistical experimental design techniques, it can be argued that the main advantage of RSM is that it requires a relatively reduced number of experimental trials to evaluate multiple parameters and their interactions. The independent variables in this study were fiber length (PFL), water content (w), and polypropylene fiber content (PFC). The polypropylene fiber content is defined as:
where WPF is the fiber weight, and W is the air-dried soil weight. Considering the cost and permeability, the amount of polypropylene fiber admixture should not exceed 1% [33]. The content of polypropylene fiber was 0.1%, 0.5%, and 0.9%, respectively. According to the common types of polypropylene fibers available in the market, the lengths of polypropylene fibers were set to 6, 12 and 18 mm in this study. Fig. 2 shows the compaction curves of loess with different fiber contents. The optimum moisture content of the loess with different fiber contents is around 18%. The water content of the soil on the site varied between 11% and 25%, with the maximum water content occurring near the pipe culvert. Therefore, the water content levels were set to 11%, 18%, and 25%, respectively. The test levels of the independent variables are given in Table 3. The terms “−1”, “0”, and “1” in Table 3 are the minimum, mean and maximum values of the input variables, respectively.

Figure 2: The compaction curves of loess with different fiber contents
This study used a face-central composite design (FCCCD) for the experimental design, which is essential for developing response surface models. The three-way experimental design using FCCCD contains eight factorial points, six vertices, and six central points. The number of center points was determined according to the design matrix that can be orthogonalized. The center point provides information about curvature in the constructed system. The purely quadratic term can be efficiently estimated by adding axis points if the curvature is available. Table 4 gives the experimental procedures followed in this paper for the experimental study of UCS and the average test results of three parallel specimens.
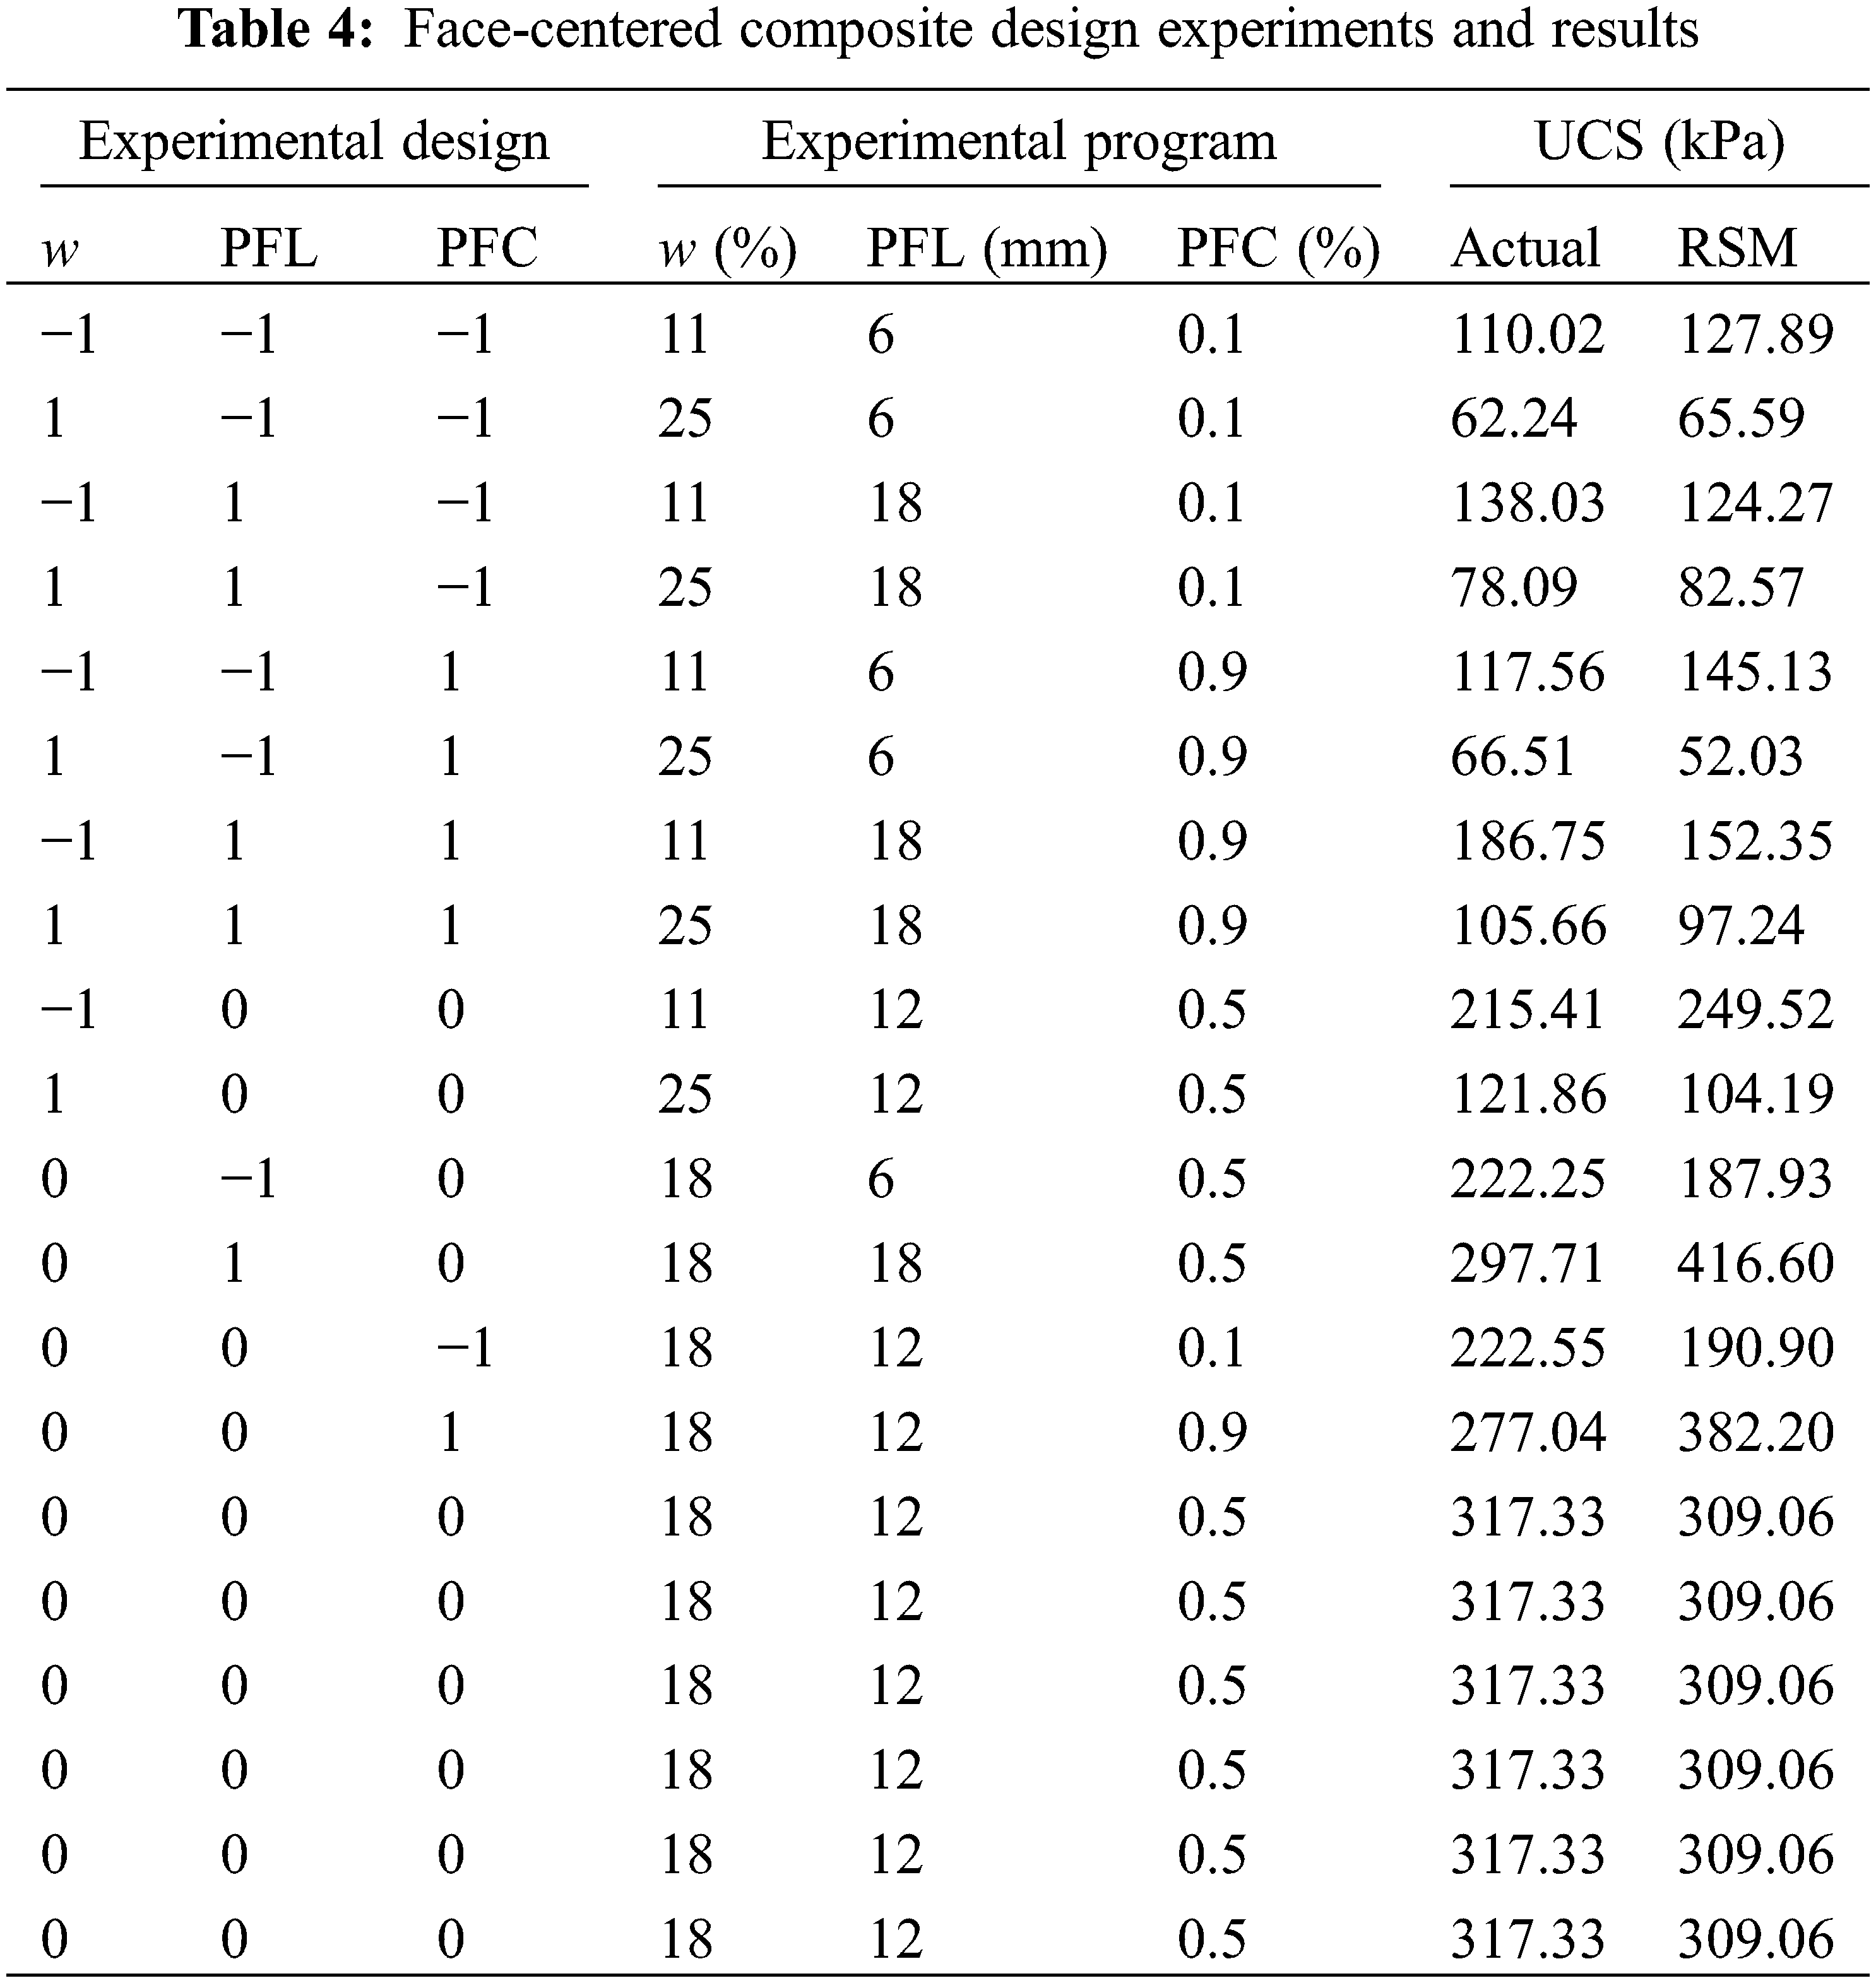
The unconfined compressive strength tests were performed on each group of specimens as described in Table 4, and the relevant results are shown in Table 4. This section includes a statistical evaluation of the UCS test results by analysis of variance (ANOVA) and optimization of the study results by the RSM method.
3.1 Statistics and Evaluation of Experimental Results
In controlled variable methods, it is challenging to examine the interaction of independent variables on the change of the dependent variable, so ANOVA can be helpful for describing the relationship between variables. The independent factor and interaction effects on the dependent variable (UCS) are examined via ANOVA. For RSM methods and ANOVA analysis, Stat-Ease Inc.’s free evaluation statistics package Design-Expert was used. With a 95% confidence level, Table 3 evaluates the established RSM model and its terms with a quadratic model with three factors and three levels. The input factors and the response variable were investigated using backward elimination to create a formulation with only statistically significant terms (P ≤ 0.05). Statistical significance was determined for the test parameters (w, PFC, PFL) at a 95% confidence level. In this study, the data set obtained from the experimental study was transformed using the natural log transformation provided by the software package before the regression analysis. As a next step, the complete quadratic model is transformed into a natural logarithmic form and a posterior analysis is performed. Table 5 presents the results of the ANOVA analysis. According to Table 5, the developed RSM model has a p-value less than 0.05, which indicates statistical significance.
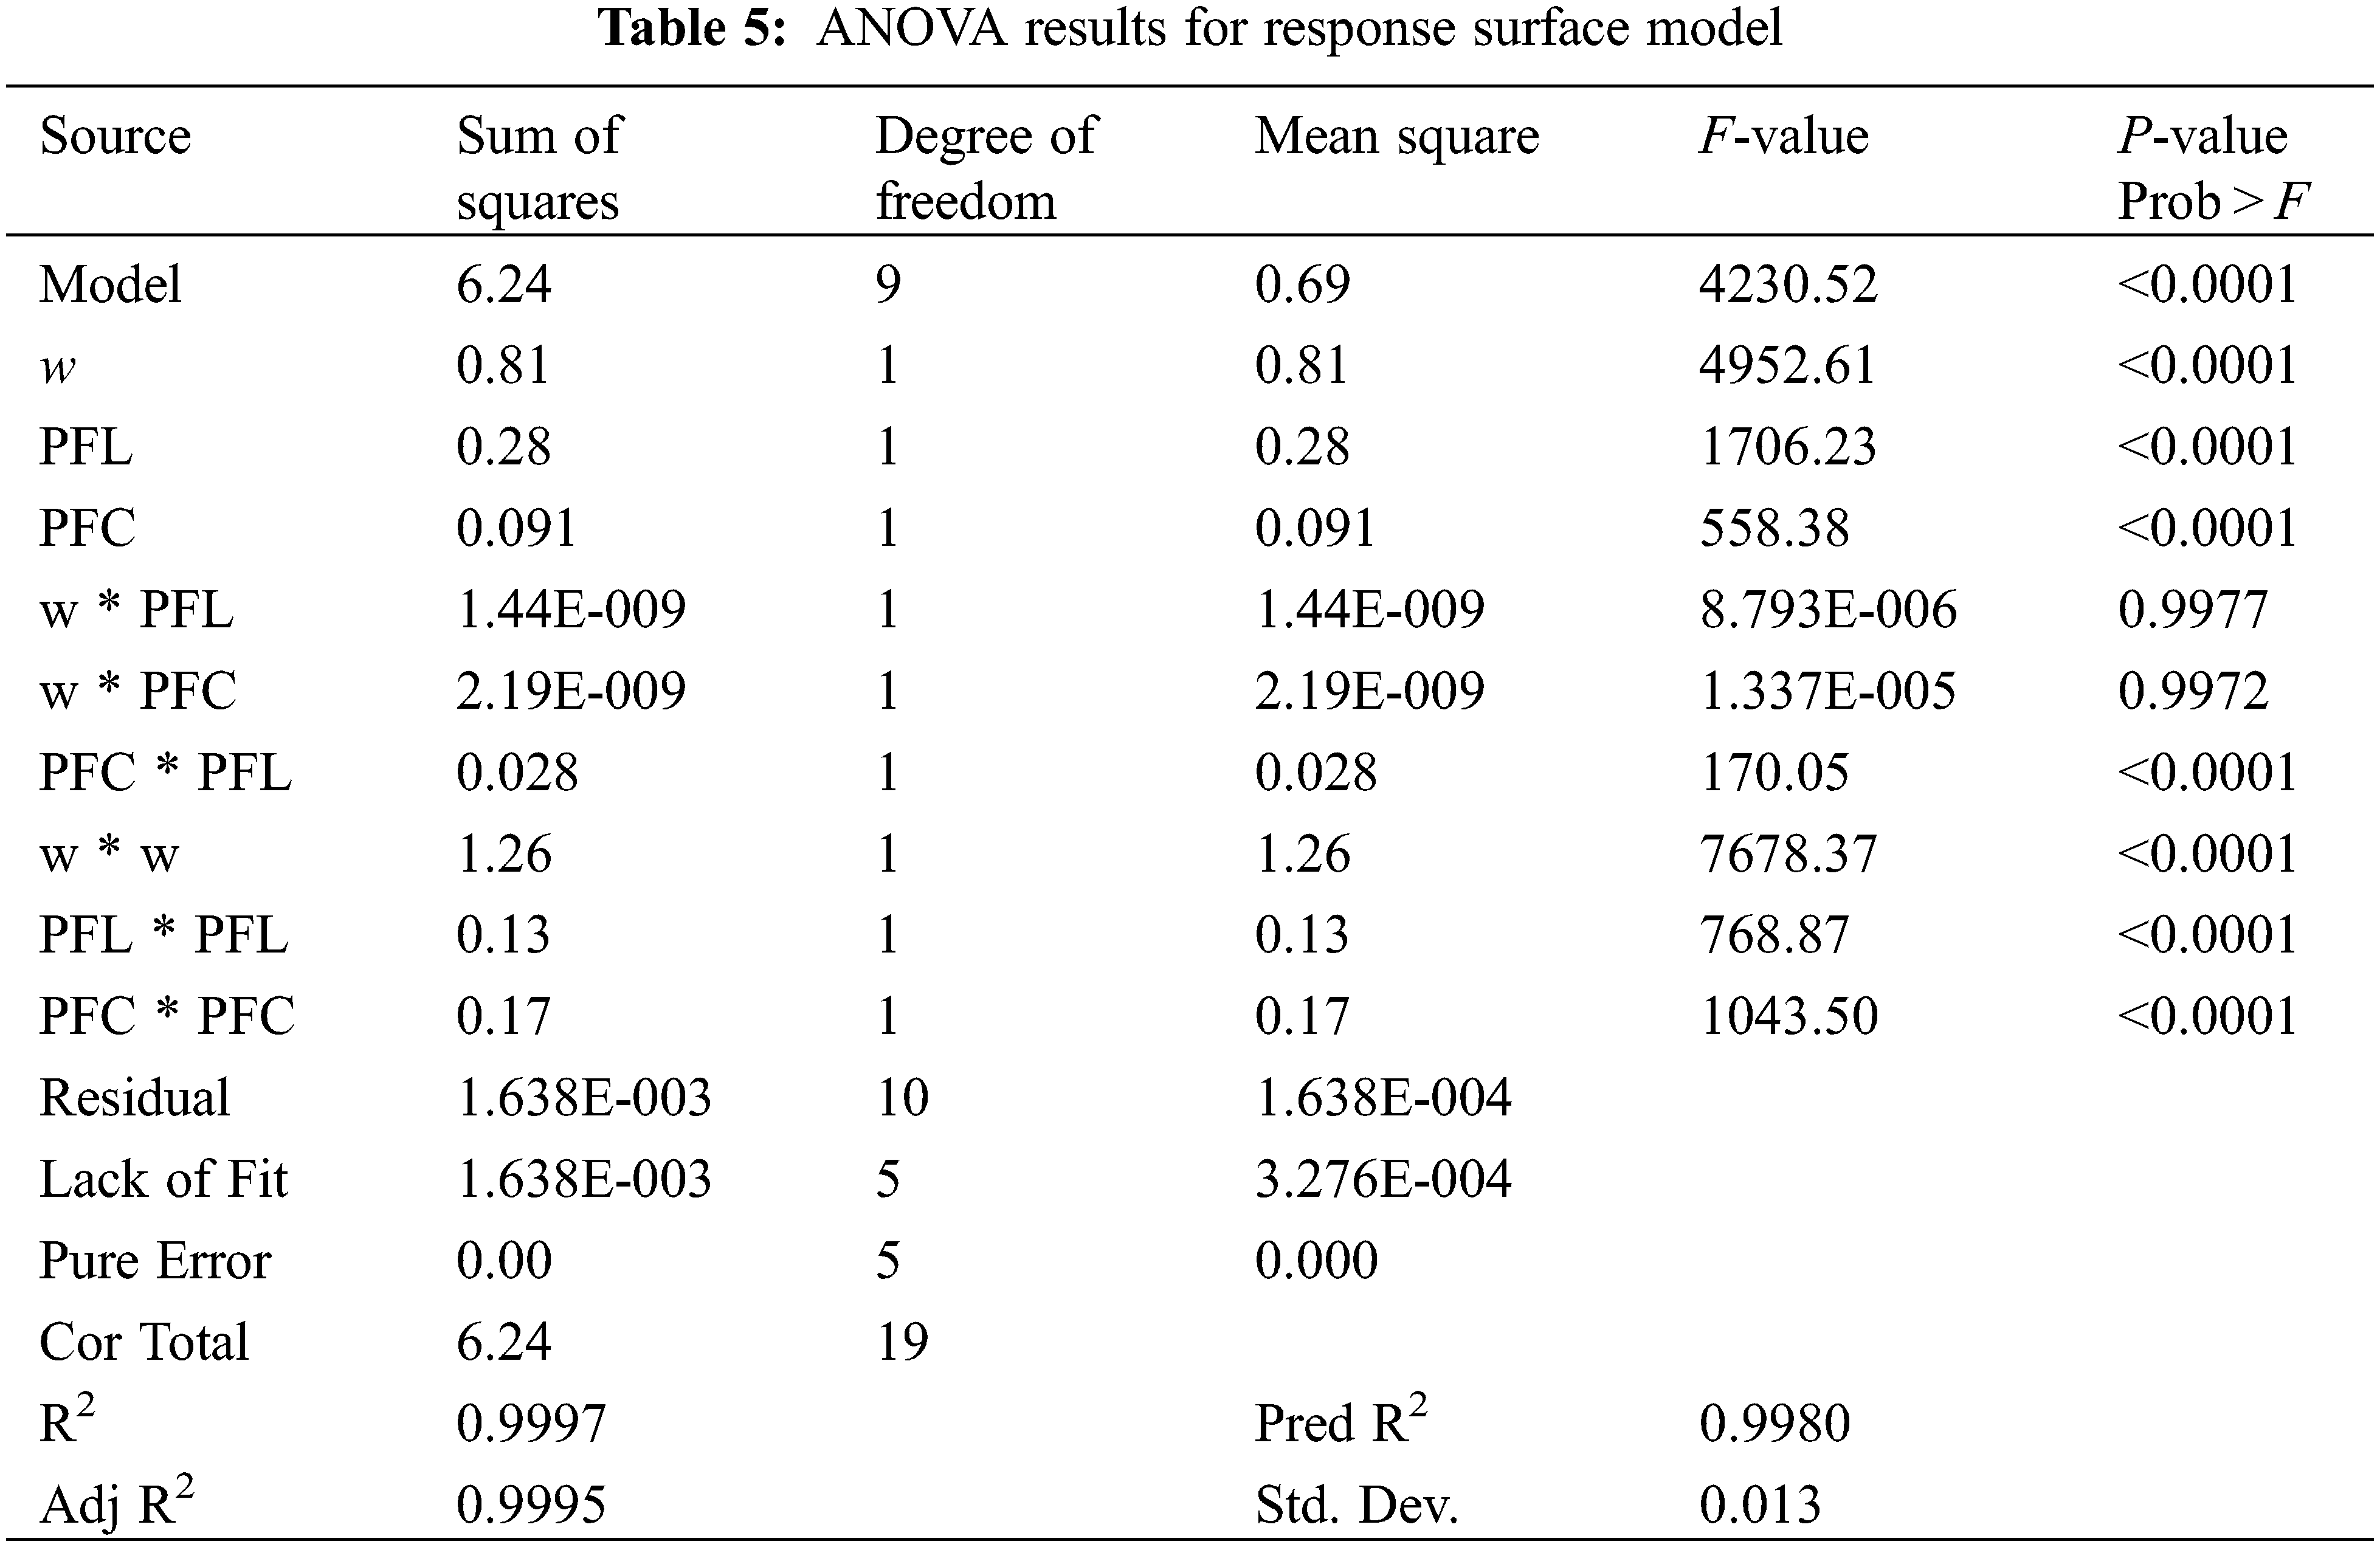
The determination coefficient (R2) describes how much variation there is around the mean defined by the fitted model. Table 5 shows that the model’s R2 is 0.9997, which is close to 1. Although the R2 value of a model is high, it does not necessarily mean the model is great because any additional variable, regardless of its statistical significance, increases the R2 value [12,20]. In general, adjusted R2 (Adj R2) will not always increase when variables are added to a built model, since it measures the variation in the mean explained by the model, adjusted for the number of terms. In addition, Adj R2 values typically decrease as unnecessary terms are added to the model. The value of Adj R2 is 0.9995. R2 and Adj R2 are similar, indicating a good agreement between predicted and measured UCS values. In addition, predicted R2 (Pred R2) is another assessment criterion used in this study to measure the change in new data, which is explained by the built-in RSM model. In Table 5, the Pred R2 of the RSM model is found to be 0.9980, which indicates that the RSM model can explain approximately 99.80% of the variability in new response values, in contrast to approximately 99.97% in the original data. Additionally, since the difference between Pred R2 and Adj R2 is less than 0.20, it can be said that these statistics fit very well in the developed model [32].
Generally, the smaller the P-value, the greater the significance of the contribution to the response. The model is significant if the P-value is less than 0.05. The parameter marginally affects the response if the P-value is between 0.05 and 0.15. If the P-value for a parameter is greater than 0.15, it must be ignored. Consequently, the w*PFL and w*PFC passages ought to be erased here. The developed RSM’s P-value was less than 0.05 (Table 5), suggesting that it was statistically significant and that there was only a 0.01 percent chance that it would have been higher owing to noise creation. By dividing the mean squares of the components and residuals, the F-value in the ANOVA table is determined. Then, they were compared with the F-value of the Fisher distribution (significant level of 0.05). The correlation coefficient, the residuals’ degrees of freedom, and the significance (or probability) level are used to calculate the F-value in the Fisher distribution. By dividing each parameter’s F-value by the total of all parameters’ F-values and multiplying the result by 100, the contribution of each parameter to the UCS in the created RSM model was calculated (Fig. 3).

Figure 3: Contributions of each parameter in the built RSM model to UCS results
The water content, the fiber length, and the fiber content are the three parameters that have the greatest influence, as shown by the contribution values in Fig. 3. Only PFC*PFL significantly affects the UCS performance (P < 0.05) among the interaction terms of the complete quadratic RSM model (w*PFC, w*PFL, and PFC*PFL). The most significant secondary parameter, according to the study’s analytical findings, is w*w. The RSM model constructed to predict the response variable (UCS) may be discovered as stated in Eq. (2) as a consequence of mathematical modeling of the experimental design of the RSM method.
The developed RSM model is shown in Eq. (2). Fig. 4 shows that there is high agreement between the predicted and measured values. The adequacy check of the developed RSM model (Eq. (2)) needs to be tested from the least-squares hypothesis perspective through residual analysis. Normality and equal (constant) variance are the two assumptions underlying the residual analysis. To determine if the assumption of normality was met, the normal probability was plotted against the internally generated t-student residuals. The normality assumption is now met if the residuals within the t-student are generally plotted along a straight line.

Figure 4: Normal probability plot of internally t-student residuals
On the other hand, the conversion of the response (dependent variable) is frequently done once the graph demonstrates that the normalcy assumption is broken. Fig. 4 depicts the normal probability curve of the RSM model built for this investigation. The residuals are roughly displayed along a straight line, demonstrating that the developed RSM model satisfies the normality assumption.
By showing the connection between the t-student internal residuals and the predicted response variable, the assumption of equal variances (UCS) is examined. The graph will frequently display a funnel-shaped pattern if the response variance is dependent on the average of the measured responses, suggesting that the response variable has to be shifted. The internal t-student residuals are randomly distributed in the plot, as shown in the overall representation of Fig. 5, which implies that the variance of the initial measurements is constant for all measured (actual) response values. The assumption of equal (constant) variance that satisfies the least-squares method implies that the constructed RSM model approximates the actual response surface well.
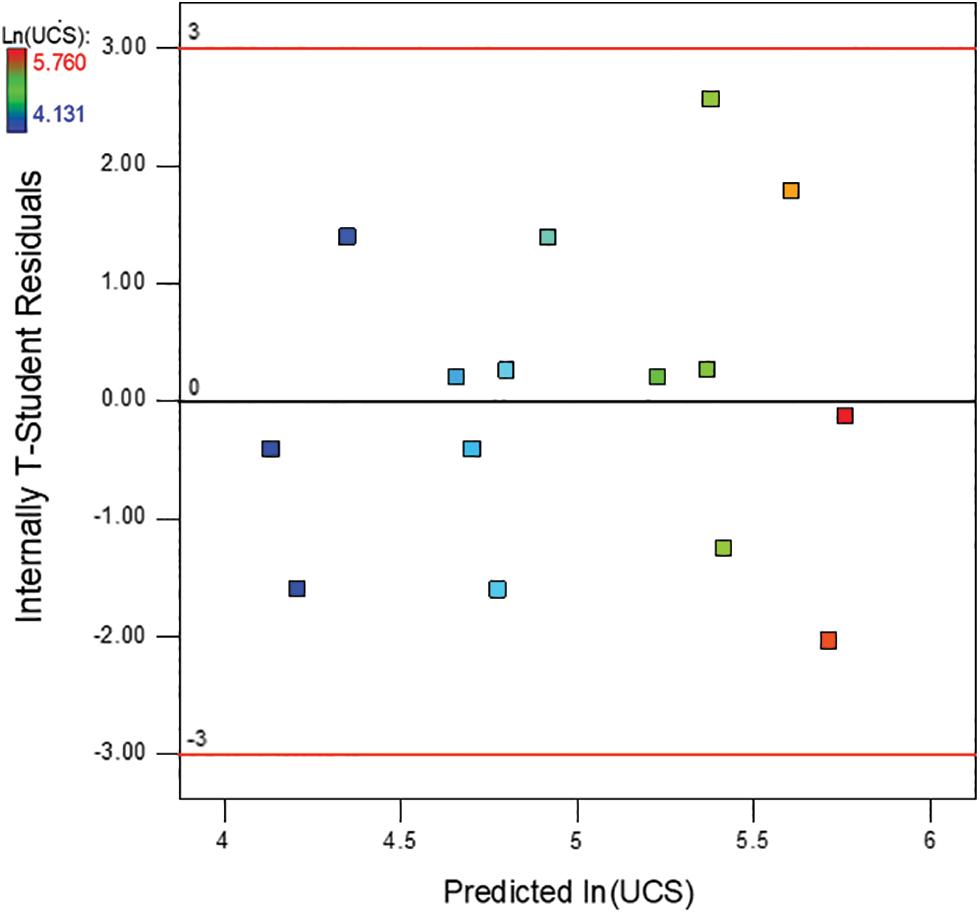
Figure 5: The plot of the internally t-student residuals vs. predicted response
3.2 Effect of Polypropylene Fiber and Water Content on Unconfined Compressive Strength
Fig. 6 shows three-dimensional response surfaces and contour plots to examine how the independent variable affects the dependent variable. The addition of polypropylene fibers significantly affected the specimens’ unconfined compressive strength, but the UCS did not always increase with the increase in fiber content. The fiber length showed the same pattern when the content of polypropylene fibers was fixed. The unconfined compressive strength increases and then decreases with increasing fiber length. A moderate increase in the water content of the fiber-reinforced soil can increase the specimen’s strength, but a significant increase in water content can have the opposite effect [34]. The strength of the specimen increases and then decreases with water content, fiber content, and fiber length, so there is an optimal ratio to maximize the strength of the fiber-reinforced loess.
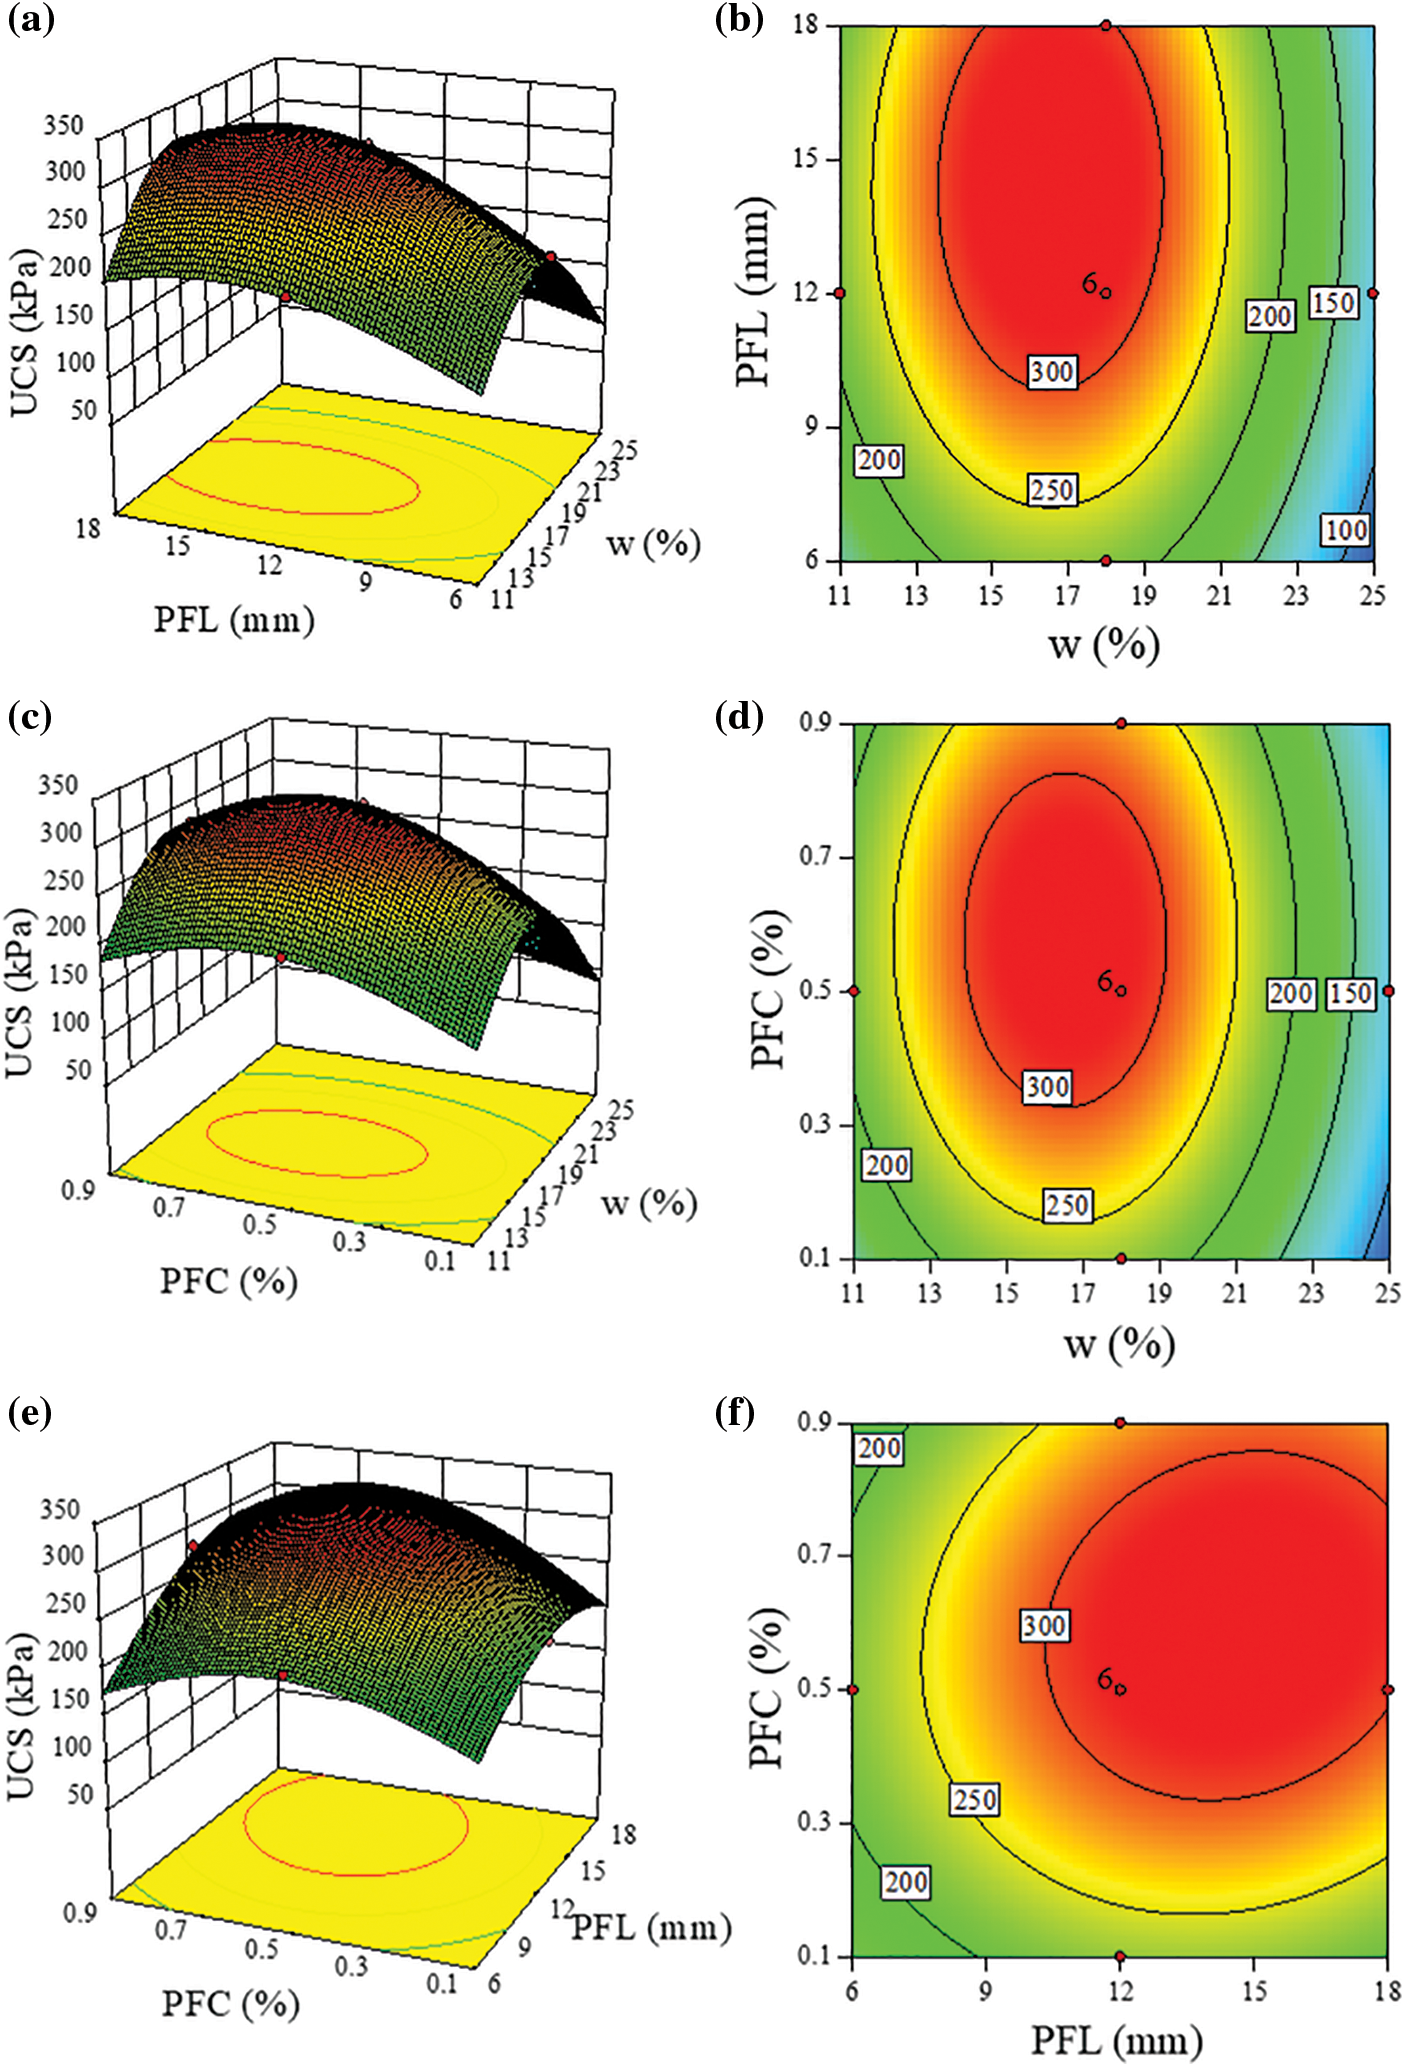
Figure 6: Three-dimensional surface and contour of unconfined compressive strength with water content, fiber length, and fiber content
Expert software was designed to determine the reinforced soil’s maximum unconfined compressive strength. The optimum ratio is 16.41% water content, 0.579% polypropylene fiber content, and 14.90 mm polypropylene fiber length. The unconfined compressive strength of reinforced soil is 342.757 kPa at the optimum ratio, and the unconfined compressive strength of plain soil is 54.74 kPa. Compared with the unconfined compressive strength of plain soil, the unconfined compressive strength is increased by 288.017 kPa at the optimum ratio.
3.3 Influence Mechanism of Polypropylene Fiber and Water Content
During the unconfined compression strength test, the inconsistent modulus of elasticity of the fiber and soil must cause the fiber and soil surfaces to misalign with each other and generate interfacial forces. Interfacial forces depend mainly on friction and cohesion [23,35]. The anchorage length can influence the contact area between the fiber and the soil, directly affecting interfacial friction and cohesion. The contact area between the fiber surface and the soil is smaller for shorter fibers, and the fibers tend to slide or pull out relatively in the specimen. Thus, the soil loses its reinforcing effect (Fig. 7). As the fiber length increases, the interfacial friction between fiber and soil also gradually increases, and it is difficult for the fiber to slip or pull out, which is macroscopically expressed as an increase in the unconfined compressive strength. As the fiber mass is fixed, the increase in fiber length will inevitably decrease the number of fibers. In addition, too long fiber length tends to cause fiber aggregation and knotting. Therefore, when the fiber length exceeds 14.9 mm, it will cause a reduction of the unconfined compressive strength.
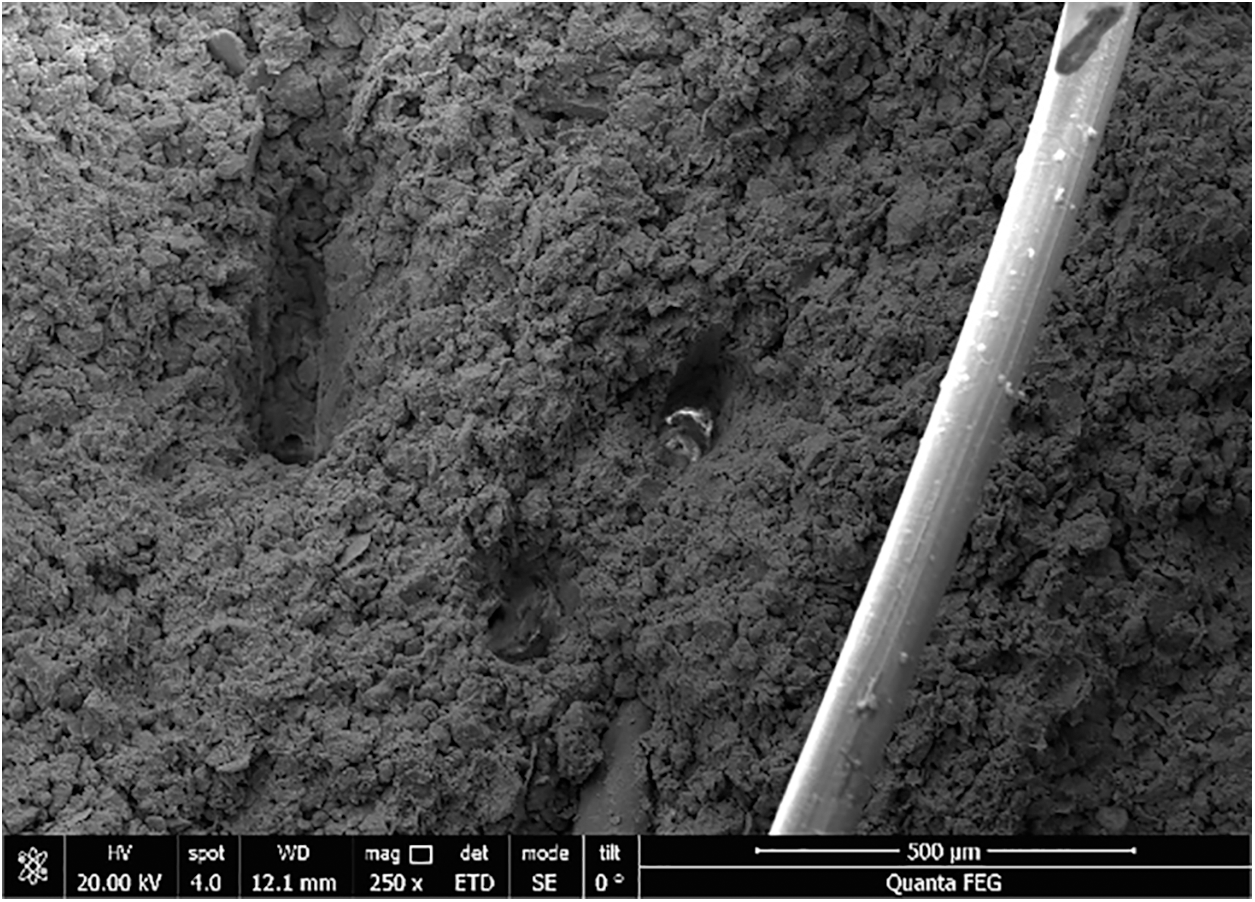
Figure 7: The sample with a fiber length of 6 mm and a water content of 11%
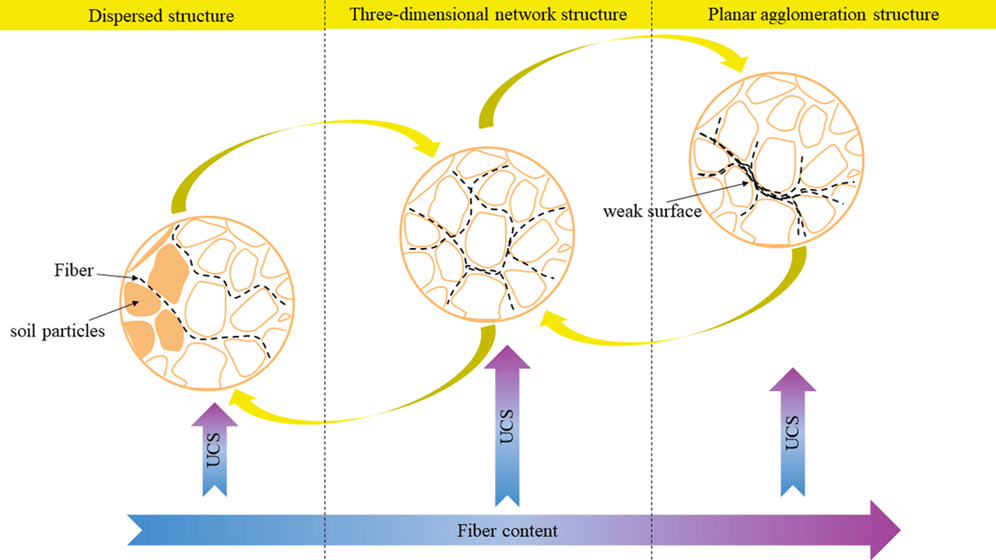
The polypropylene fibers incorporated in the soil are randomly distributed, and the fibers do not form a good linkage when the fiber content is small and are mainly single fibers under tension (Fig. 8a). Therefore, when the fiber content was low, the damage mode of fiber reinforced loess was brittle damage [36]. With the increase of fiber content, the fibers interweave into a three-dimensional mesh structure in the soil (Fig. 8b). When a single fiber is pulled out, it then causes the other fibers in the mesh to be stressed at the same time so that the stress is distributed to a broader area and the force is more uniform, and to a certain extent, it acts as a spatial constraint on the soil. Therefore, when the fiber content was moderate, the damage mode of fiber reinforced loess was ductile damage [30,36]. When the fiber content is large, the fiber cannot form a three-dimensional mesh structure and will form a flat agglomerated structure, making the soil a soft surface [37]. The fibers are not subjected to pull-out force when the specimen is stressed. The specimen breaks from the contact plane between the fibers and the soil, and many fibers are exposed in planar form (Fig. 8c). Therefore, the unconfined compressive strength of the specimens increased gradually with the increase of fiber admixture, but the strength decreased when the fiber content exceeded 0.579%.
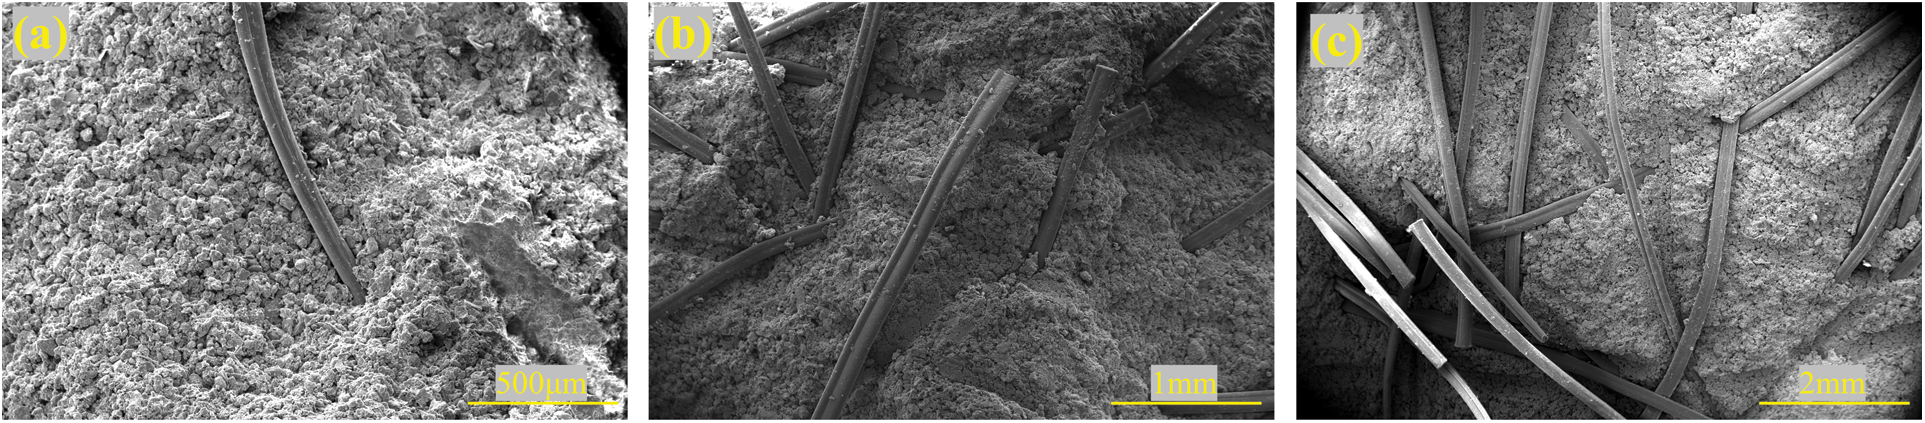
Figure 8: The distribution form of fiber (a) dispersed structure (b) Three-dimensional network structure (c) planar agglomeration structure
The fiber surface of the specimen with 18% water content clearly showed scratches along the longitudinal direction of the fiber (Fig. 9), while the fiber surface of the specimen with 11% water content was smoother (Fig. 7). The scratches may be due to the insertion of hard soil particles into the fiber body during the compaction of the specimen and the fiber pull-out [38]. The scratches confirm the interlocking forces between the soil particles and the fiber surface. Some soil particles adhered to the fiber surface (Fig. 9), indicating that the fiber pull-out disrupted the interfacial soil structure. Thus, when the fibers are pulled out, the interfacial friction strongly depends on the resistance to rotation and rearrangement of the interfacial soil particles [39]. The less the possibility of rearrangement of interfacial soil particles during stretching, the higher the interfacial friction [40]. Soil particle rotation occurs when the resistance provided by mineral friction and mechanical interlocking between adjacent soil particles is less than the resistance between the particles and the fiber surface [38].
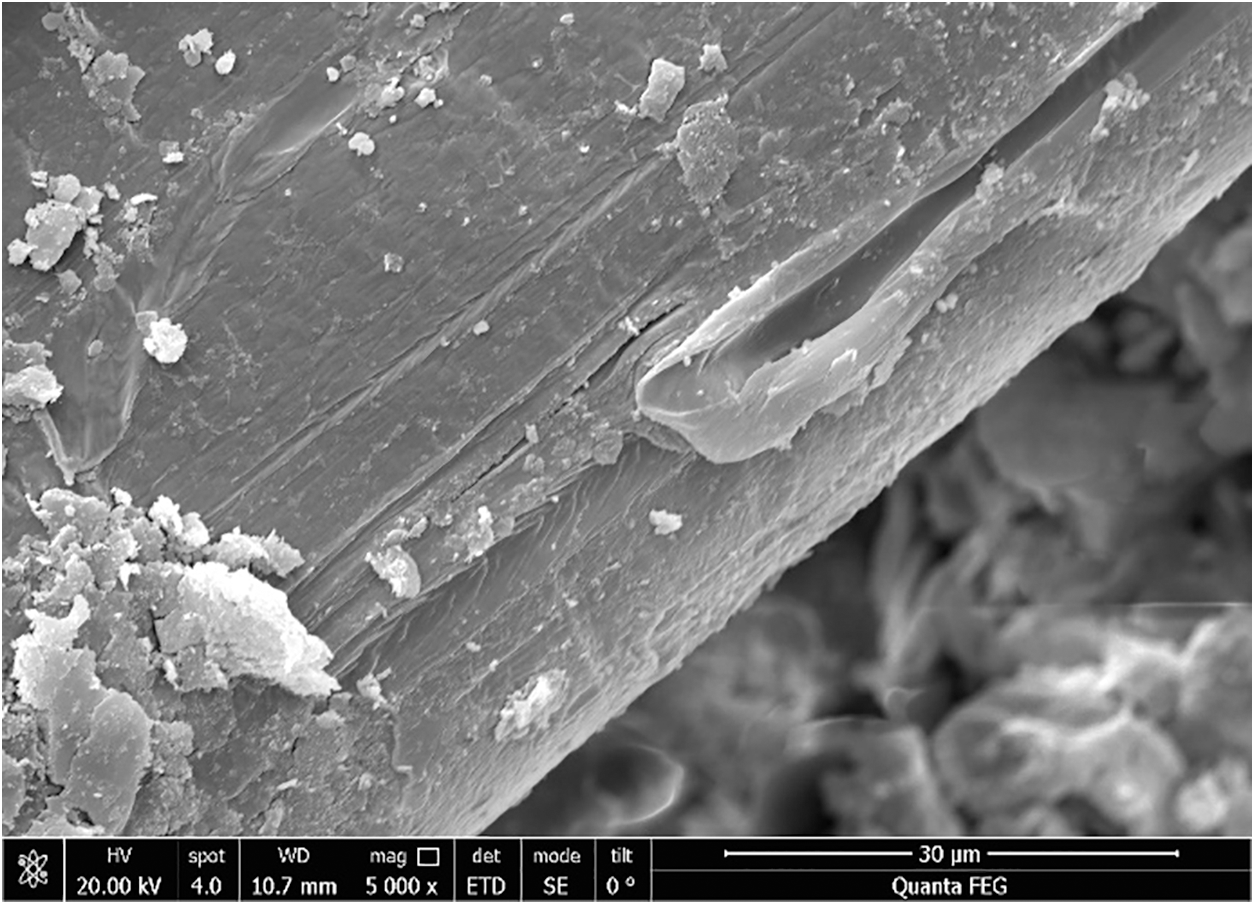
Figure 9: Sample with a water content of 18%
The SEM images of the specimens with 11% and 18% water content are shown in Fig. 10. The SEM images were converted into black and white binary images using PCAS software developed by Nanjing University, with white pixels indicating pores and black colored pixels indicating particles, and finally, pores and particles were identified (Fig. 10) [41]. Therefore, the surface porosity
where
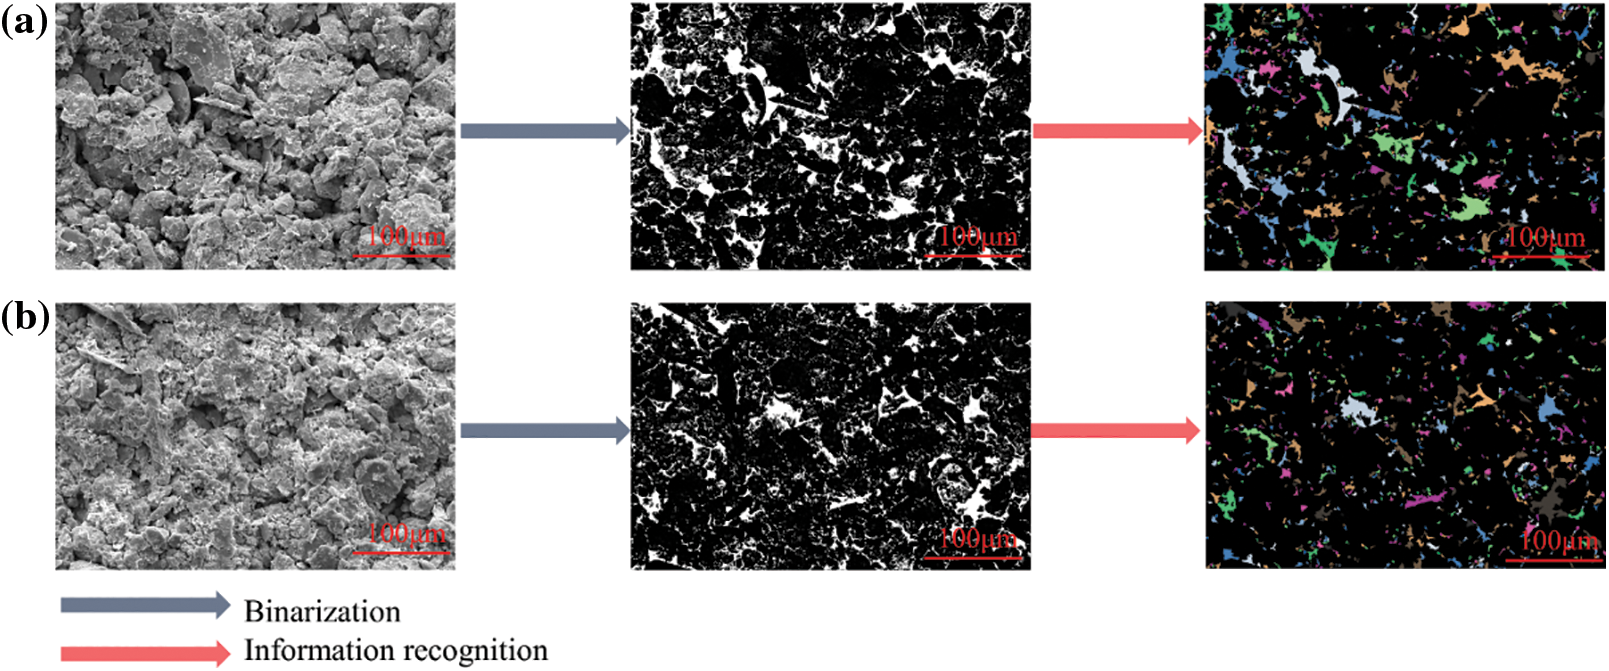
Figure 10: PCAS information recognition process (a) water content of 11%, (b) water content of 18%
The mean area of the particle aggregates S is the mean area of the equivalent circle of the particle aggregates and can be expressed as:
where Si is the area of the equivalent circle of the particle aggregates, and n is the number of set particles.
The surface porosity of the specimens with 11% and 18% water content was 18.33% and 11.35%, respectively, indicating that the 18% water content specimens were denser. The average particle areas of the specimens with 11% and 18% water content were 1434.27 μm2 and 3292.52 μm2, respectively, indicating that the water film bonded the soil particles together, increasing the area of the particles. Therefore, the unconfined compressive strength of the sample with 18% water content is increased compared with the 11% sample due to the following reasons: i) The water film thickness of the sample with 18% water content is moderate compared with the 11% sample. Because the water film is too thin, it will affect the compaction of the sample, resulting in large pores in the sample; The increase in water content makes the soil more compact, thereby increasing the effective contact area between the fiber and the soil; ii) An appropriate amount of water film binds the soil particles together, and the aggregate volume of the particles increases, thereby restricting the rearrangement of the soil particles on the interface; iii) The increase in sample density creates an interlocking force, making it more difficult to pull out the fiber. For the 25% water content sample, due to the large water film thickness inside the sample, it plays a role in lubrication, and the strength is reduced to a certain extent. Therefore, the specimens’ unconfined compressive strength increased with the water content, but when the water content exceeded 16.41%, the high-water content caused the unconfined compressive strength to decrease.
About one-third of the geological disasters in China occur on the Loess Plateau [42,43]. The strength of the loess controls geological hazards [44,45]. The addition of appropriate number of polypropylene fibers in loess can form a three-dimensional fiber-soil composite, which greatly increases the strength of the loess. In this case the probability of damage to artificial slopes and foundations in loess areas is greatly reduced. Therefore, this study investigates the change of fiber reinforced soil strength and its mechanism, which can provide reference for the prevention and control of engineering geological disasters on the Loess Plateau.
This paper investigates the optimization problem of loess improvement based on the performance of UCS using response surface methodology. Based on the UCS values, an RSM model was developed to study the input variables’ optimal ratios (w, PFC, PFL). The following main conclusions were obtained:
(1) Water content, polypropylene fiber length, and polypropylene fiber content significantly affect the fiber reinforced loess strength. The unconfined compressive strength shows an increasing trend and then decreases with the abovementioned factors.
(2) Water content is the most important factor influencing the strength of fiber-reinforced loess, followed by the fiber length and content.
(3) There is an optimal ratio to maximize the unconfined compressive strength, which is 16.41% water content, 0.579% polypropylene fiber content, and 14.90 mm polypropylene fiber length. The unconfined compressive strength of reinforced soil under the optimal ratio is 342.757 kPa. The unconfined compressive strength under the optimal ratio is increased by 288.017 kPa.
(4) As a result of mathematical modeling of the experimental design of the RSM method, the formula for the RSM model used to predict the response variable (UCS) was constructed, and the established model was determined to be statistically significant by analysis of variance.
Author Contributions: Wankui Ni and Haiman Wang designed the research; Haiman Wang performed all experiments and analyzed the data. Jiaxin Zhong calculated the surface area and gave suggestions. Haiman Wang wrote the paper. All authors read and approved the final manuscript.
Acknowledgement: This study was financially supported by the National Nature Science Foundation of China (Grant No. 1931285) and the Key Research and Development Program of Shaanxi Province (Grant No. 2020SF-436).
Data Availability: The data used to support the findings of this study are available from the corresponding author upon request.
Funding Statement: The authors received no specific funding for this study.
Conflicts of Interest: The authors declare that they have no conflicts of interest to report regarding the present study.
References
1. Wang, H., Ni, W., Liu, H., Huang, M., Yuan, K. et al. (2021). Study of the repeated collapsibility of undisturbed loess in Guyuan, China. Bulletin of Engineering Geology and the Environment, 80(8), 6321–6330. DOI 10.1007/s10064-021-02304-4. [Google Scholar] [CrossRef]
2. Wang, H., Ni, W., Yuan, K., Li, L., Nie, Y. et al. (2021). Microstructure evolution of loess under multiple collapsibility based on nuclear magnetic resonance and scanning electron microscopy. Journal of Mountain Science, 18(10), 2612–2625. DOI 10.1007/s11629-021-6838-8. [Google Scholar] [CrossRef]
3. Liang, C., Cao, C., Wu, S. (2018). Hydraulic-mechanical properties of loess and its behavior when subjected to infiltration-induced wetting. Bulletin of Engineering Geology and the Environment, 77(1), 385–397. DOI 10.1007/s10064-016-0943-x. [Google Scholar] [CrossRef]
4. Mei, Y., Li, Y., Wang, X., Wang, J., Hu, C. (2019). Statistical analysis of deformation laws of deep foundation pits in collapsible loess. Arabian Journal for Science and Engineering, 44(10), 8347–8360. DOI 10.1007/s13369-019-03931-6. [Google Scholar] [CrossRef]
5. Güllü, H. (2015). Unconfined compressive strength and freeze–thaw resistance of fine-grained soil stabilised with bottom ash, lime and superplasticiser. Road Materials and Pavement Design, 16(3), 608–634. DOI 10.1080/14680629.2015.1021369. [Google Scholar] [CrossRef]
6. Güllü, H., Fedakar, Hİ (2017). Response surface methodology for optimization of stabilizer dosage rates of marginal sand stabilized with sludge Ash and fiber based on UCS performances. KSCE Journal of Civil Engineering, 21(5), 1717–1727. DOI 10.1007/s12205-016-0724-x. [Google Scholar] [CrossRef]
7. Abbey, S. J., Eyo, E. U., Oti, J., Amakye, S. Y., Ngambi, S. (2020). Mechanical properties and microstructure of fibre-reinforced clay blended with by-product cementitious materials. Geosciences, 10(6), 241. DOI 10.3390/geosciences10060241. [Google Scholar] [CrossRef]
8. Abbey, S., Ngambi, S., Ganjian, E. (2017). Development of strength models for prediction of unconfined compressive strength of cement/byproduct material improved soils. Geotechnical Testing Journal, 40(6), 928–935. DOI 10.1520/GTJ20160138. [Google Scholar] [CrossRef]
9. Eyo, E. U., Ng’ambi, S., Abbey, S. J. (2020). Performance of clay stabilized by cementitious materials and inclusion of zeolite/alkaline metals-based additive. Transportation Geotechnics, 23, 100330. DOI 10.1016/j.trgeo.2020.100330. [Google Scholar] [CrossRef]
10. Falorca, I. M. C. F. G., Pinto, M. I. M. (2011). Effect of short, randomly distributed polypropylene microfibres on shear strength behaviour of soils. Geosynthetics International, 18(1), 2–11. DOI 10.1680/gein.2011.18.1.2. [Google Scholar] [CrossRef]
11. Maher Mohamad, H., Gray Donald, H. (1990). Static response of sands reinforced with randomly distributed fibers. Journal of Geotechnical Engineering, 116(11), 1661–1677. DOI 10.1061/(ASCE)0733-9410(1990)116:11(1661). [Google Scholar] [CrossRef]
12. Gowthaman, S., Nakashima, K., Kawasaki, S. (2018). A state-of-the-art review on soil reinforcement technology using natural plant fiber materials: Past findings, present trends and future directions. Materials, 11(4), 553. DOI 10.3390/ma11040553. [Google Scholar] [CrossRef]
13. Azzam, W. R. (2014). Utilization of polymer stabilization for improvement of clay microstructures. Applied Clay Science, 93–94, 94–101. DOI 10.1016/j.clay.2014.03.006. [Google Scholar] [CrossRef]
14. Correia, A. A. S., Venda Oliveira, P. J., Custódio, D. G. (2015). Effect of polypropylene fibres on the compressive and tensile strength of a soft soil, artificially stabilised with binders. Geotextiles and Geomembranes, 43(2), 97–106. DOI 10.1016/j.geotexmem.2014.11.008. [Google Scholar] [CrossRef]
15. Haase, H., Schanz, T. (2016). Compressibility and saturated hydraulic permeability of clay-polymer composites—experimental and theoretical analysis. Applied Clay Science, 130, 62–75. DOI 10.1016/j.clay.2016.01.020. [Google Scholar] [CrossRef]
16. Soltani, A., Taheri, A., Khatibi, M., Estabragh, A. R. (2017). Swelling potential of a stabilized expansive soil: A comparative experimental study. Geotechnical and Geological Engineering, 35(4), 1717–1744. DOI 10.1007/s10706-017-0204-1. [Google Scholar] [CrossRef]
17. Park, T., Tan, S. A. (2005). Enhanced performance of reinforced soil walls by the inclusion of short fiber. Geotextiles and Geomembranes, 23(4), 348–361. DOI 10.1016/j.geotexmem.2004.12.002. [Google Scholar] [CrossRef]
18. Yetimoglu, T., Salbas, O. (2003). A study on shear strength of sands reinforced with randomly distributed discrete fibers. Geotextiles and Geomembranes, 21(2), 103–110. DOI 10.1016/S0266-1144(03)00003-7. [Google Scholar] [CrossRef]
19. Akbulut, S., Arasan, S., Kalkan, E. (2007). Modification of clayey soils using scrap tire rubber and synthetic fibers. Applied Clay Science, 38(1), 23–32. DOI 10.1016/j.clay.2007.02.001. [Google Scholar] [CrossRef]
20. Venda Oliveira Paulo, J., Anunciação Guilherme, R., Correia António, A. S. (2022). Effect of cyclic loading frequency on the behavior of a stabilized sand reinforced with polypropylene and sisal fibers. Journal of Materials in Civil Engineering, 34(1), 06021008. DOI 10.1061/(ASCE)MT.1943-5533.0004012. [Google Scholar] [CrossRef]
21. Harianto, T., Hayashi, S., Du, Y. J., Suetsugu, D. (2008). Effects of fiber additives on the desiccation crack behavior of the compacted akaboku soil as a material for landfill cover barrier. Water, Air, and Soil Pollution, 194(1), 141–149. DOI 10.1007/s11270-008-9703-2. [Google Scholar] [CrossRef]
22. Miller, C. J., Rifai, S. (2004). Fiber reinforcement for waste containment soil liners. Journal of Environmental Engineering, 130(8), 891–895. DOI 10.1061/(ASCE)0733-9372(2004)130:8(891). [Google Scholar] [CrossRef]
23. Tang, C., Shi, B., Gao, W., Chen, F., Cai, Y. (2007). Strength and mechanical behavior of short polypropylene fiber reinforced and cement stabilized clayey soil. Geotextiles and Geomembranes, 25(3), 194–202. DOI 10.1016/j.geotexmem.2006.11.002. [Google Scholar] [CrossRef]
24. Yan, C., An, N., Wang, Y., Sun, W. (2021). Effect of dry-wet cycles and freeze-thaw cycles on the antierosion ability of fiber-reinforced loess. Advances in Materials Science and Engineering, 2021, 8834598. DOI 10.1155/2021/8834598. [Google Scholar] [CrossRef]
25. Wang, W., Cao, G., Li, Y., Zhou, Y., Lu, T. et al. (2022). Effects of freeze & ndash; thaw cycles on strength and wave velocity of lime-stabilized basalt fiber-reinforced loess. Polymers, 14(7), 1465. DOI 10.3390/polym14071465. [Google Scholar] [CrossRef]
26. Xu, J., Wu, Z., Chen, H., Shao, L., Zhou, X. et al. (2021). Study on strength behavior of basalt fiber-reinforced loess by digital image technology (DIT) and scanning electron microscope (SEM). Arabian Journal for Science and Engineering, 46(11), 11319–11338. DOI 10.1007/s13369-021-05787-1. [Google Scholar] [CrossRef]
27. Yang, B. H., Weng, X. Z., Liu, J. Z., Kou, Y. N., Jiang, L. et al. (2017). Strength characteristics of modified polypropylene fiber and cement-reinforced loess. Journal of Central South University, 24(3), 560–568. DOI 10.1007/s11771-017-3458-0. [Google Scholar] [CrossRef]
28. Lian, B., Peng, J., Zhan, H., Cui, X. (2020). Effect of randomly distributed fibre on triaxial shear behavior of loess. Bulletin of Engineering Geology and the Environment, 79(3), 1555–1563. DOI 10.1007/s10064-019-01666-0. [Google Scholar] [CrossRef]
29. Wu, Z., Xu, J., Chen, H., Shao, L., Zhou, X. et al. (2022). Shear strength and mesoscopic characteristics of basalt fiber–Reinforced loess after dry–wet cycles. Journal of Materials in Civil Engineering, 34(6), 04022083. DOI 10.1061/(ASCE)MT.1943-5533.0004225. [Google Scholar] [CrossRef]
30. Xu, J., Wu, Z., Chen, H., Shao, L., Zhou, X. et al. (2022). Influence of dry-wet cycles on the strength behavior of basalt-fiber reinforced loess. Engineering Geology, 302, 106645. DOI 10.1016/j.enggeo.2022.106645. [Google Scholar] [CrossRef]
31. ASTM (2006). Annual book of ASTM standards. ASTM International, West Conshohocken, Pennsylvania. [Google Scholar]
32. Gunst, R. F. (1996). Response surface methodology: Process and product optimization using designed experiments. Technometrics, 38(3), 284–286. DOI 10.1080/00401706.1996.10484509. [Google Scholar] [CrossRef]
33. Fletcher, C. S., Humphries, W. K. (1991). California bearing ratio improvement of remolded soils by the addition of polypropylene fiber reinforcement. Transportation Research Record, 1295, 80–86. [Google Scholar]
34. Shouxi, C., Qian, S. (2013). Effect of dry density and water content on the strength and deformation of saline soil reinforced with rice straw. Coal Geology & Exploration, 41(1), 46–49. [Google Scholar]
35. Racana, N., Grédiac, M., Gourvès, R. (2003). Pull-out response of corrugated geotextile strips. Geotextiles and Geomembranes, 21(5), 265–288. DOI 10.1016/S0266-1144(03)00031-1. [Google Scholar] [CrossRef]
36. Kou, H. L., Liu, J. H., Guo, W., Hua, S. D., Pan, Y. T. (2021). Effect of freeze–thaw cycles on strength and ductility and microstructure of cement-treated silt with polypropylene fiber. Acta Geotechnica, 16(11), 3555–3572. DOI 10.1007/s11440-021-01325-3. [Google Scholar] [CrossRef]
37. Lu, H., Yan, C. G., Jia, Z. L., Lan, H. X., Shi, Y. L. et al. (2021). Shear strength and disintegration properties of polypropylene fiber-reinforced loess. Journal of Traffic and Transportation Engineering, 21(2), 82–92. [Google Scholar]
38. Dove, J. E., Bents, D. D., Wang, J., Gao, B. (2006). Particle-scale surface interactions of non-dilative interface systems. Geotextiles and Geomembranes, 24(3), 156–168. DOI 10.1016/j.geotexmem.2006.01.002. [Google Scholar] [CrossRef]
39. Tang, C. S., Shi, B., Zhao, L. Z. (2010). Interfacial shear strength of fiber reinforced soil. Geotextiles and Geomembranes, 28(1), 54–62. DOI 10.1016/j.geotexmem.2009.10.001. [Google Scholar] [CrossRef]
40. Frost, J. D., Han, J. (1999). Behavior of interfaces between fiber-reinforced polymers and sands. Journal of Geotechnical and Geoenvironmental Engineering, 125(8), 633–640. DOI 10.1061/(ASCE)1090-0241(1999)125:8(633). [Google Scholar] [CrossRef]
41. Liu, C., Shi, B., Zhou, J., Tang, C. (2011). Quantification and characterization of microporosity by image processing, geometric measurement and statistical methods: Application on SEM images of clay materials. Applied Clay Science, 54(1), 97–106. DOI 10.1016/j.clay.2011.07.022. [Google Scholar] [CrossRef]
42. Wang, H., Qian, H., Gao, Y., Li, Y. (2020). Classification and physical characteristics of bound water in loess and its main clay minerals. Engineering Geology, 265, 105394. DOI 10.1016/j.enggeo.2019.105394. [Google Scholar] [CrossRef]
43. Zhuang, J., Peng, J., Wang, G., Javed, I., Wang, Y. et al. (2018). Distribution and characteristics of landslide in Loess Plateau: A case study in Shaanxi Province. Engineering Geology, 236, 89–96. DOI 10.1016/j.enggeo.2017.03.001. [Google Scholar] [CrossRef]
44. Leng, Y., Peng, J., Wang, Q., Meng, Z., Huang, W. (2018). A fluidized landslide occurred in the loess plateau: A study on loess landslide in South Jingyang tableland. Engineering Geology, 236, 129–136. DOI 10.1016/j.enggeo.2017.05.006. [Google Scholar] [CrossRef]
45. Wang, W., Wang, Y., Sun, Q., Zhang, M., Qiang, Y. et al. (2018). Spatial variation of saturated hydraulic conductivity of a loess slope in the South Jingyang Plateau, China. Engineering Geology, 236, 70–78. DOI 10.1016/j.enggeo.2017.08.002. [Google Scholar] [CrossRef]
Cite This Article
 Copyright © 2023 The Author(s). Published by Tech Science Press.
This work is licensed under a Creative Commons Attribution 4.0 International License , which permits unrestricted use, distribution, and reproduction in any medium, provided the original work is properly cited.
 Downloads
 Citation Tools