
 Submit a Paper
 Propose a Special lssue
 Open Access
ARTICLE

Materials Selection of Thermoplastic Matrices of Natural Fibre Composites for Cyclist Helmet Using an Integration of DMAIC Approach in Six Sigma Method Together with Grey Relational Analysis Approach
1 Department of Mechanical and Manufacturing, Universiti Putra Malaysia, Selangor, Malaysia
2 Department of Manufacturing Engineering Technology, Faculty of Mechanical and Manufacturing Engineering Technology, Universiti Teknikal Malaysia Melaka, Melaka, Malaysia
* Corresponding Author: S. M. Sapuan. Email:
(This article belongs to the Special Issue: Natural Fibre Composites: Design, Materials Selection and Fabrication)
Journal of Renewable Materials 2023, 11(5), 2381-2397. https://doi.org/10.32604/jrm.2023.026549
Received 12 September 2022; Accepted 03 November 2022; Issue published 13 February 2023
 View Full Text
 Download PDF
Abstract
Natural fibre reinforced polymer composite (NFRPC) materials are gaining popularity in the modern world due to their eco-friendliness, lightweight nature, life-cycle superiority, biodegradability, low cost, and noble mechanical properties. Due to the wide variety of materials available that have comparable attributes and satisfy the requirements of the product design specification, material selection has become a crucial component of design for engineers. This paper discusses the study’s findings in choosing the suitable thermoplastic matrices of Natural Fibre Composites for Cyclist Helmet utilising the DMAIC, and GRA approaches. The results are based on integrating two decision methods implemented utilising two distinct decision-making approaches: qualitative and quantitative. This study suggested thermoplastic polyethylene as a particularly ideal matrix in composite cyclist helmets during the selection process for the best thermoplastic matrices material using the 6σ technique, with the decision based on the highest performance, the lightest weight, and the most environmentally friendly criteria. The DMAIC and GRA approach significantly influenced the material selection process by offering different tools for each phase. In the future study, selection technique may have been more exhaustive if more information from other factors had been added.Keywords
Synthetic composites (to replace conventional/petroleum-based plastics) have been used to make bicycle helmets, but very lease attempts have been made to employ natural fibre composites for the same purpose. The automotive, aerospace, construction, furniture, and marine industries have all used natural fibre composites. In particular, environmentally friendly products are suitable substitute materials [1]. Because natural fibre composites are lighter and more cost-effective than traditional composite materials and biodegradable and non-abrasive, they have become increasingly popular as a primary material for new product development [2]. Because of their numerous advantages, several natural fibres have been examined as possible reinforcements for polymer composites. Polymer materials, when used as matrices in natural fibre composites, may improve the qualities of natural fibres and expand the range of applications for which they can be used [3]. Natural fibre polymer-reinforced composites often use thermoplastic as a matrix material. There are several advantages to using a polymer made of thermoplastic rather than a thermoset polymer as the composite matrix, including cheaper processing costs, more flexibility, and the ability to mould complicated components [4]. Furthermore, thermoplastic-based composites are attracting the interest of researchers due to their potential to be recycled and burned [5]. Composites made of natural fibres can be made using thermoplastic polymers such as Polyethylene (PE), Polypropylene (PP), Polyamide (PA), polycarbonate (PC), and polyurethane (PU) as the matrix [6]. Thermoplastic composites have a lot to offer as a potential substitute in the construction, aerospace, and automotive industries. Numerous scientists from various backgrounds and cultures have investigated thermoplastic composite applications in product development, from studying material characterisation in material science to manufacturing thermoplastic composite-based goods. Developing thermoplastic composite-based goods necessitates careful consideration of both the materials and the design process. For saving time and money on product design progress, it is required to connect the design processes with the whole design restrictions using comparable control parameters [7]. For more than two decades, experts have focused on the material selection importance in the design process [8]. An assembly’s performance can be significantly impacted if the materials used are improperly chosen. Because it has been demonstrated that choosing the option with the lowest price may not always be the most favorable path to obtaining the best material, multi-criteria decision-making (MCDM) methodologies have gained popularity in this market. Researchers have presented novel methods for selecting materials based on reachable and available data. Because of the readily available information on the qualities of conventional/petroleum-based plastics materials, choosing a suitable material from this group is more accessible than choosing one from a composite-based materials group. However, in the case of composite-based materials, it is necessary to rely on information that is both ambiguous and vague. Researchers have come up with new methods for selecting materials that are more systematic and less subjective.
The optimal material for developing a cycling helmet (CH) was selected using a process known as Six-Sigma (6σ). Presently, 6σ is being used in manufacturing and product development to improve the quality or productivity of the process or the product [9]. A process with a higher sigma quality level is less prone to errors. There are only 3.4 mistakes per million possibilities or 99.9997% success in the 6σ approaches, defined as a statistical thought [10]. In addition to raising customer satisfaction and decreasing manufacturing costs, the 6σ approaches can also improve product quality, speed up processing, and lower capital expenditures [11,12]. There are five primary phases in the DMAIC (Define-Measure-Analyze-Improve-Control) method [13]. The DMAIC approach has been used in several studies by engineering researchers to enhance manufacturing processes or increase product quality. Tong utilised the DMAIC method in 2004 to strengthen the standard for printed circuit boards [14]. In an SMT (surface-mount technology) solder printing, Li used the DMAIC technique in 2008 [15]. Sharma et al. improved engine crankshaft manufacturing in 2013 using the DMAIC approach [16]. For the selection of “green” natural fibres in the polymer composite car crash box in 2020, Yusof utilised the DMAIC approach [17], and in 2009, Chen et al. employed the Lean Six-Sigma approach [18].
From this assessment, it can be concluded that the 6σ technique is a very effective and robust method for enhancing the continuous methodology improvement for reducing faults in a product or process. There are numerous advantages to using composites in everyday life [19]. Lightweights, strength, corrosion resistance, long-term usability, and design adaptability are all essential considerations [20–22]. Natural fibres for polymer composite CHs have never been selected utilising the 6σ techniques by researchers up until this point. In addition, no one has used the 6σ technique to help with material selection [23]. There are several reasons why DMAIC (Define-Measure-Analyse-Improve-Control) is a good fit for material selection. For various reasons, the DMAIC method proved an excellent tool for making material selection decisions [24,25]. It is critical for engineers to analyse the manufacturing process to select appropriate materials and avoid product failure or a decrease in product quality. Using a five-step method known as DMAIC, engineers may better control the selection of materials before manufacturing. Instead of merely focusing on the final result, the DMAIC method studies the complete production process from the beginning phase to the end product [26].
1.1 Description of the Cyclist Helmet (CH)
A bicycle helmet is designed to lessen impacts on a cyclist’s head in the case of a fall, as well as other negative effects like blurred vision [27]. Ongoing scientific research is being conducted to determine the protection level provided by bicycle helmets in the case of an accident and the impacts of wearing helmets on cyclists’ and motor vehicle drivers’ behaviour.
2 Methodology of Materials Selection of Thermoplastic Matrices of Natural Fibre Composites for CH
The general structure of a 6σ process of selecting materials is depicted in Fig. 1. The most important methods of selecting materials are demonstrated here. Within this approach, the five most important parameters are known as “define”, “measure”, “analyse”, “improve”, and “control”, respectively (DMAIC). The DMAIC methodology served as a foundation for the existing materials selection procedure that was carried out. The selection process was carried out using a unique instrument for each procedure step. The word “define” was the first step with the purpose to establish both the problem and the desired outcome. At this point in the process, the mind mapping technique was put to use to compile all relevant data into a chart that detailed the critical considerations that went into the material selection. The produced chart was then used to recognise the criteria and alternatives for selecting materials. This was done following the significant elements in the chart. In the second step, “measure,” hierarchical frameworks and GRA were utilised to assess the sigma performance level. This was done to acquire accurate and precise results. Based on the data collected in the “define” step, this stage consisted of assigning priority criteria for material selection to each level of the hierarchy. The word “analyse” refers to the third step in the procedure. At this step, the properties table indicates the material features required to build CH and the material properties of thermoplastic matrices that may be used. These material characteristics are included. The fourth stage is referred to as “improve,” after evaluation and the final solution have been finished. This stage is characterised by the application of the qualitative method known as the Pugh method [28], which is employed to rank the multidimensional possibilities of an option set. In addition to the qualitative approach, the Pugh method was selected since it can produce a solution based on the most advantageous qualities of several different possibilities. As a result, it can satisfy the requirements of a voice-of-the-customer approach for a material selection process [29]. The last stage of this process is called “control,” Its purpose is to observe and check the accuracy of the outcomes from the previous stage, called “improve.” Therefore, GRA was applied at this point. Deng developed the grey system theory, which has many applications across different domains [30]. It has been demonstrated that this theory can assist in processing information that is uncertain, incomplete, and flawed. According to Morán et al. [31], grey relational analysis is a subfield of grey system theory that can be utilised to address problems including complicated interrelations between several different variables and elements. The grey relational analysis is a technique for conducting impact assessments using the grade of relation to determining the sequences of comparability and reference similarity [32–35]. For the calculations, the software version Microsoft Excel 2016 was used.
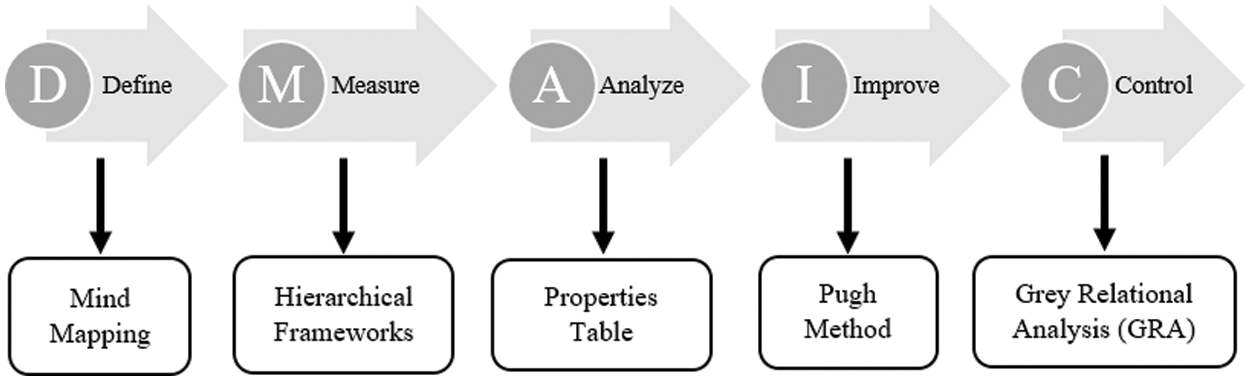
Figure 1: Process flow material selection using the DMAIC method
Materials selection is critical to a project’s success from an engineering, environmental, and economic standpoint. As illustrated in Fig. 2, it is essential to understand the factors influencing materials selection before beginning the selection process. “Mechanical-environmental performance integration” is what Giudice et al. [36] advocated. However, this strategy necessitates that designers thoroughly understand their surroundings. Materials selection must consider both mechanical and environmental factors concurrently, necessitating a more straightforward method. Incorporating environmental considerations into the design process from the outset is critical if you want to move toward greener products. Because Sapuan et al. [37] recommends beginning conceptual design by selecting materials, it is appropriate to incorporate environmental considerations for green design and sustainability. As a result, various methodologies have been offered for green design, and environmental concerns should be addressed at the outset of the conceptual design process. Due to economic constraints, the cost is an important consideration when selecting materials for particular products. Costs are constantly subject to change due to market forces such as competition and the scarcity of a specific product. The selection process also considered the product’s biodegradability, recyclability, and reuse capabilities.
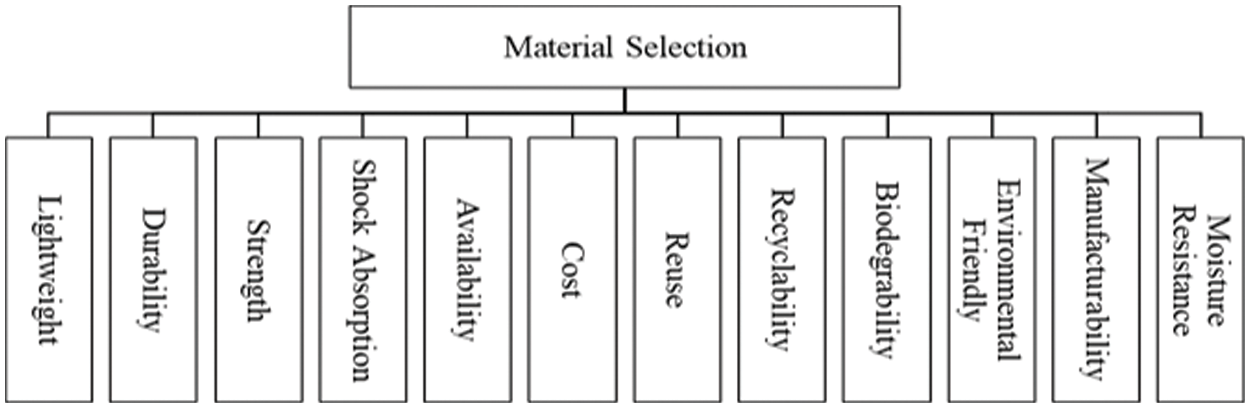
Figure 2: Mind mapping of material criteria needed for CH
To produce high-performance CHs, bicycle helmet manufacturing businesses constantly look for ways to minimise the product’s weight. Toughness is the most critical factor for cyclists’ overall performance, as more excellent toughness allows greater energy absorption [38]. Stability of strength and ductility is required for toughness qualities [39]. To achieve good toughness, materials must withstand mechanical distortion per unit volume up to the point of failure, which means they must be able to absorb kinetic energy. In addition, the product design specification (PDS) tabulated in Table 1 summarises various other specifications in materials selection to identify the most suitable thermoplastic matrices in CH. The PDS, a specification document on the product (CH) developed at the beginning of the research, was employed as the basis for the material selection procedure. The material must have a high elongation at break value to have more excellent toughness qualities. A readily available (no scarcity of resources), low moisture content to prevent fibre cracking, and high tensile properties for long-term use are among the other material requirements.
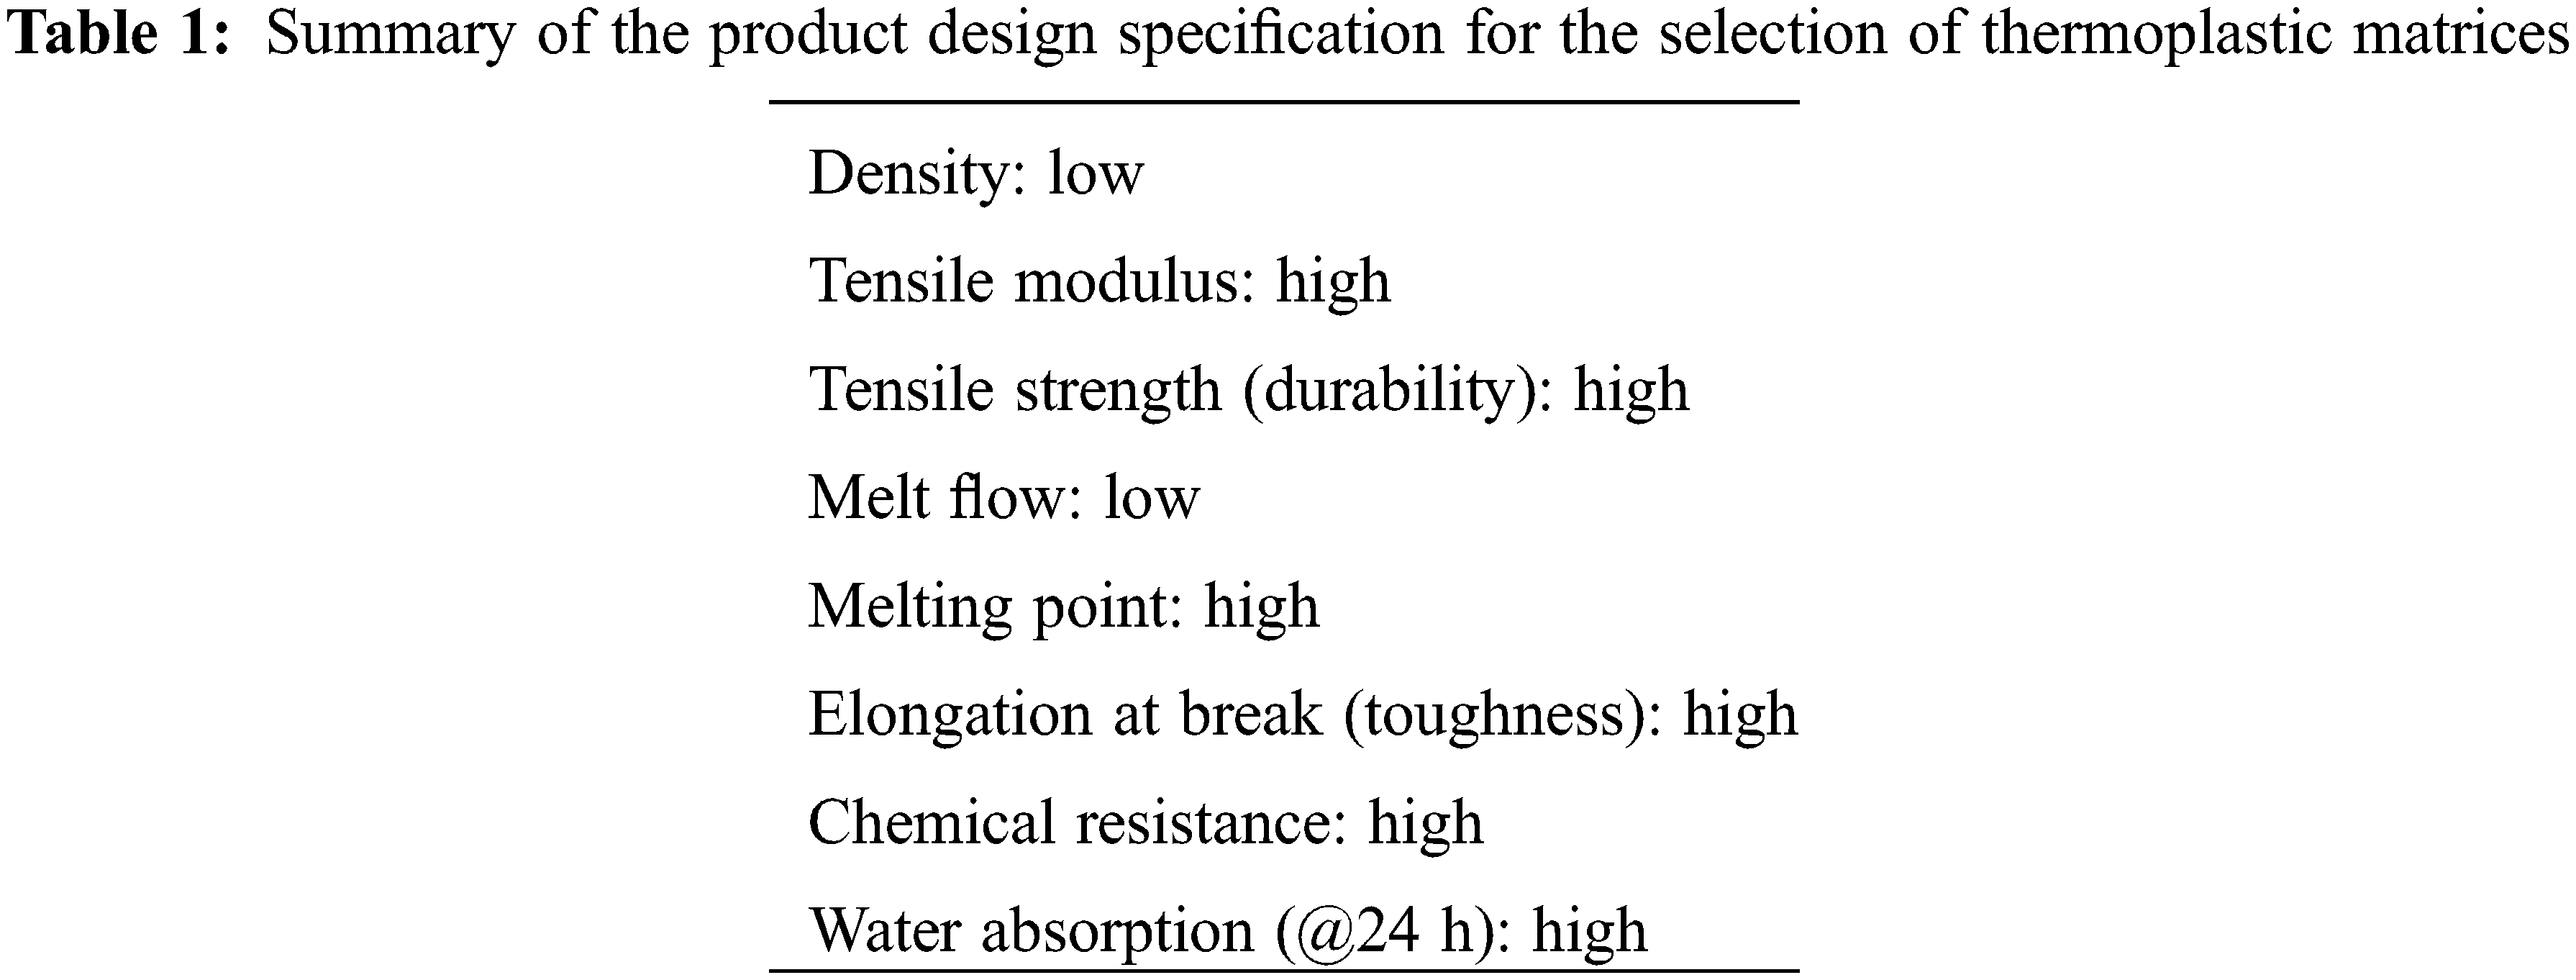
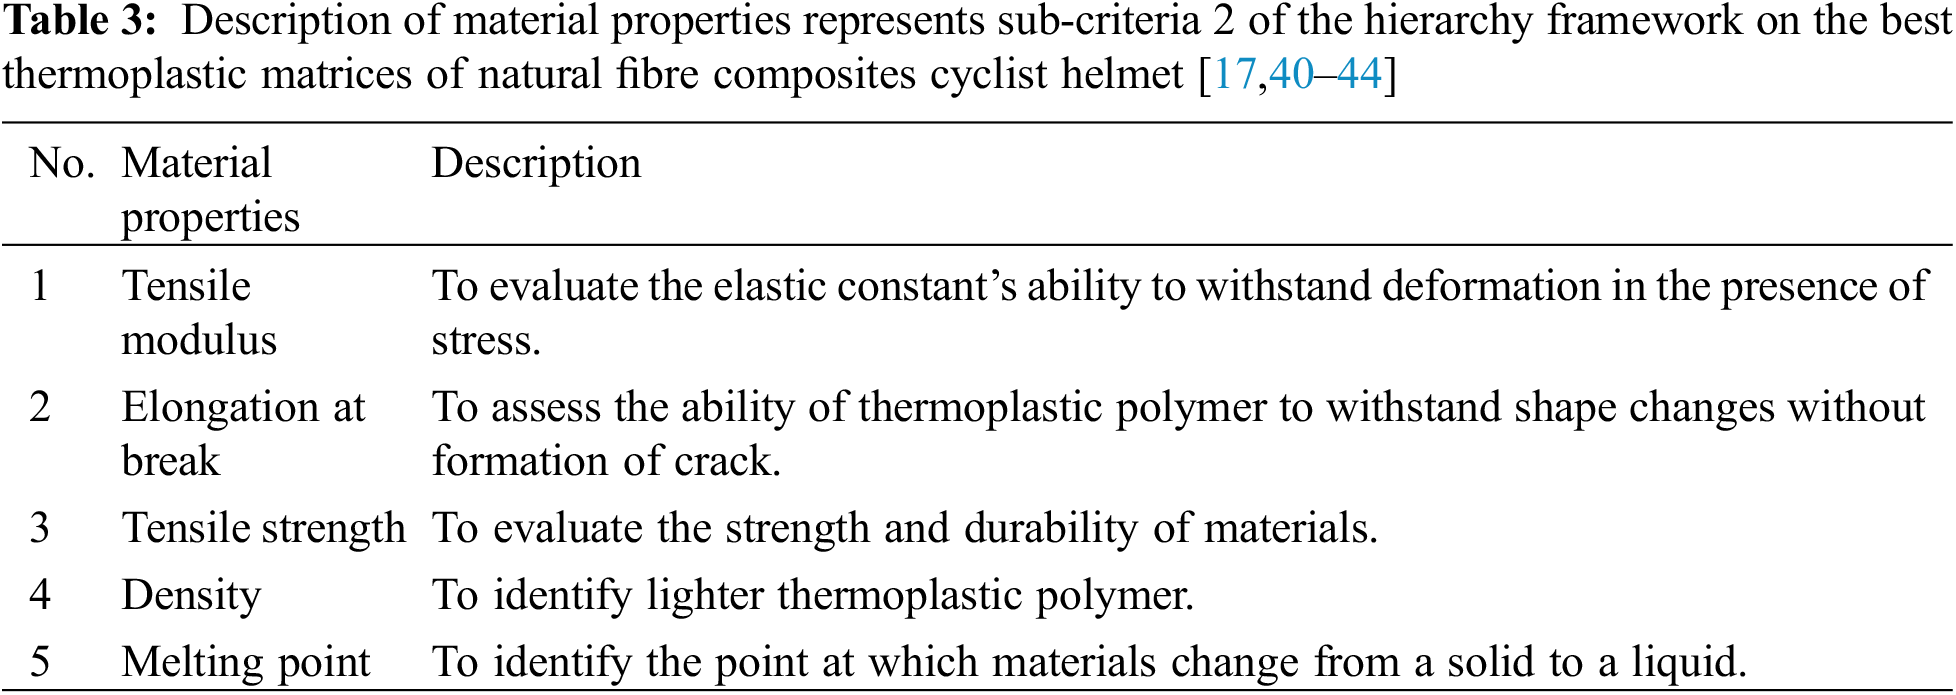
Fig. 3 depicts the five levels of the hierarchical framework used in the “measure” stage, with the descending order reflecting how the rank criteria were derived from Table 1 and Fig. 2. The top hierarchical level outlined serves as the overarching goal to select the most suitable natural fiber composite thermoplastic matrix for use in safety equipment (Cycling Helmets). The second level outlined the primary criteria or factors that would impact the established objective, such as the material’s high performance, lightweight, and sustainability to safeguard the health and the environment, with definitions for each criterion supplied in Table 2. Sub-criterion 1 represented the third level of the hierarchy and included the most stringent requirements for success. Sub-criterion 2 was the fourth tier of the order, and it contained a list of all the constraints for thermoplastic matrices that had been determined by evaluating criteria 1. Prioritisation of these constraints was achieved through the GRA method’s use of grey relational sequence generation (see Fig. 4). There were primarily four stages to the GRA procedure. Generating a grey relational sequence, which included building a sequence comparison based on qualities for all alternatives, was the first stage. An ideal target or reference sequence, identical to the made grey relational sequence, was well-defined once all performance qualities were transformed into a single comparability sequence. After that, the grey relationship coefficient was calculated throughout the board. The final step was calculating the coefficients and weights allocated to the performance attributes and determining their grey relational grade (GRG). The options were ranked using the GRG [32–35]. The fifth tier was a group of prospects that recognised potential answers and were used when deciding which thermoplastic matrices would be best for the job. The features of thermoplastic matrices were outlined in a hierarchy framework and described in Table 3. The description is a compilation of customer and environmental voices, summarised by Mastura et al. [40] and Lau et al. [41]. Describing such features helps researchers see the significance of thermoplastic matrices’ attributes in forming a judgement.
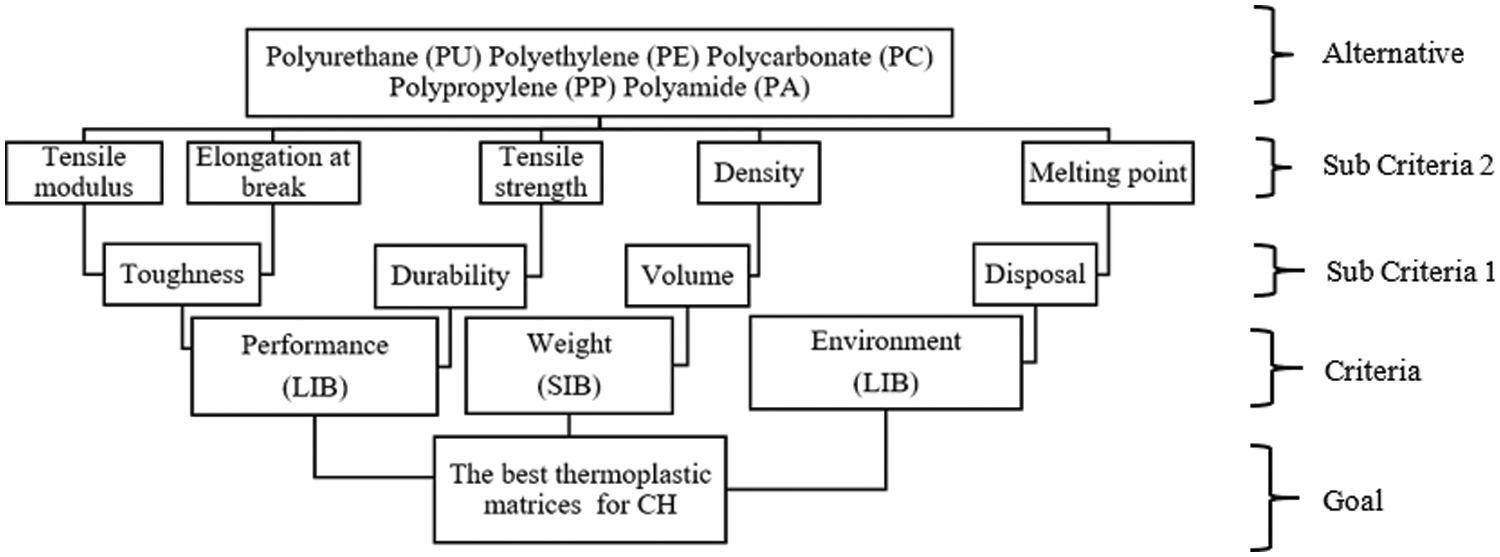
Figure 3: The hierarchy framework for the selection of the materials of thermoplastic matrices for CH
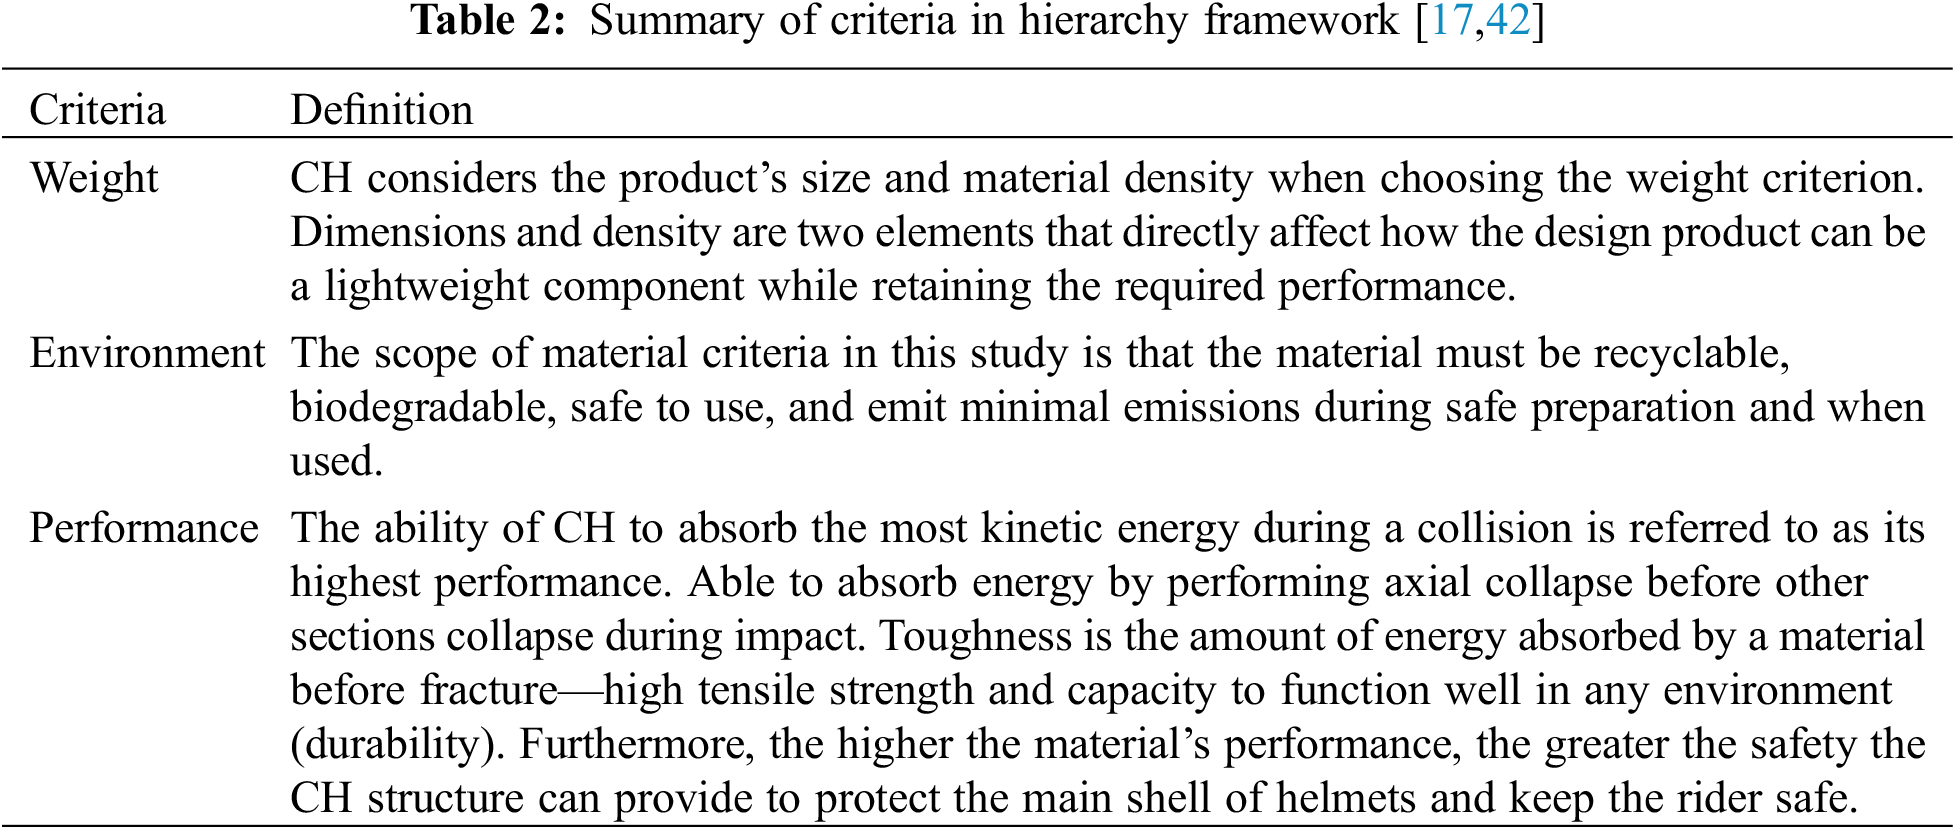
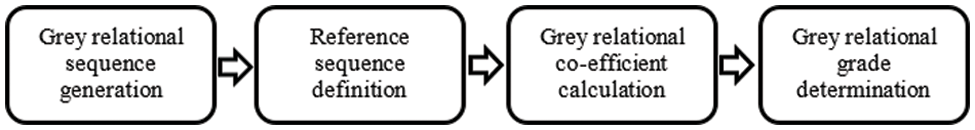
Figure 4: GRA procedure [32–35]
Step 1. Grey relational sequence generation
The decision matrix in the multi-criteria problem was written in terms of sets of alternatives and the performance values of the attributes. The grey relational sequence is created by normalising the decision matrix and constructing the comparability sequence of characteristics [32–35]. For example, the performance value was defined using the formula below if the decision matrix contained m choices and n attributes,
where yij is the performance values of attribute j of alternative i.
The comparability sequence Xi = (xi1, xi2, … xij,…, xin) can normalise the term Yi into a using the following equations:
If the intended value for the performance attribute was greater, Eq. (1) was used; if it was less desirable, Eq. (2) was applied.
Step 2. Derivation of the reference sequence
After the grey relational sequence was generated, the values of the comparability sequence, Xi, were scaled into the [0, 1] range. The alternative with the higher value of Xi (equal to unity), a circumstance that is typically absent, performed better. As a result, a reference sequence, X0, with values equal to 1, was established and compared with the generated sequence. The option with the higher similarity degree was the better choice. The reference sequence can be expressed as:
Step 3. Calculation of grey relational coefficient
The grey relational coefficient assessed the similarity degree between
where
Various differentiating coefficients provided different GRA findings. The distinguishing coefficient in this investigation was 0.5.
Step 4. Calculation of GRG
Using the GRG and Eq. (4), the degree of correlation between the reference and comparability sequences was calculated,
where wj is the weight given to the attribute j.
The total weight given to the attributes is unity, i.e.,
The comparison sequence with the highest GRG will be comparable to the reference sequence. The one that corresponds to the comparability sequence will perform the best among all the options.
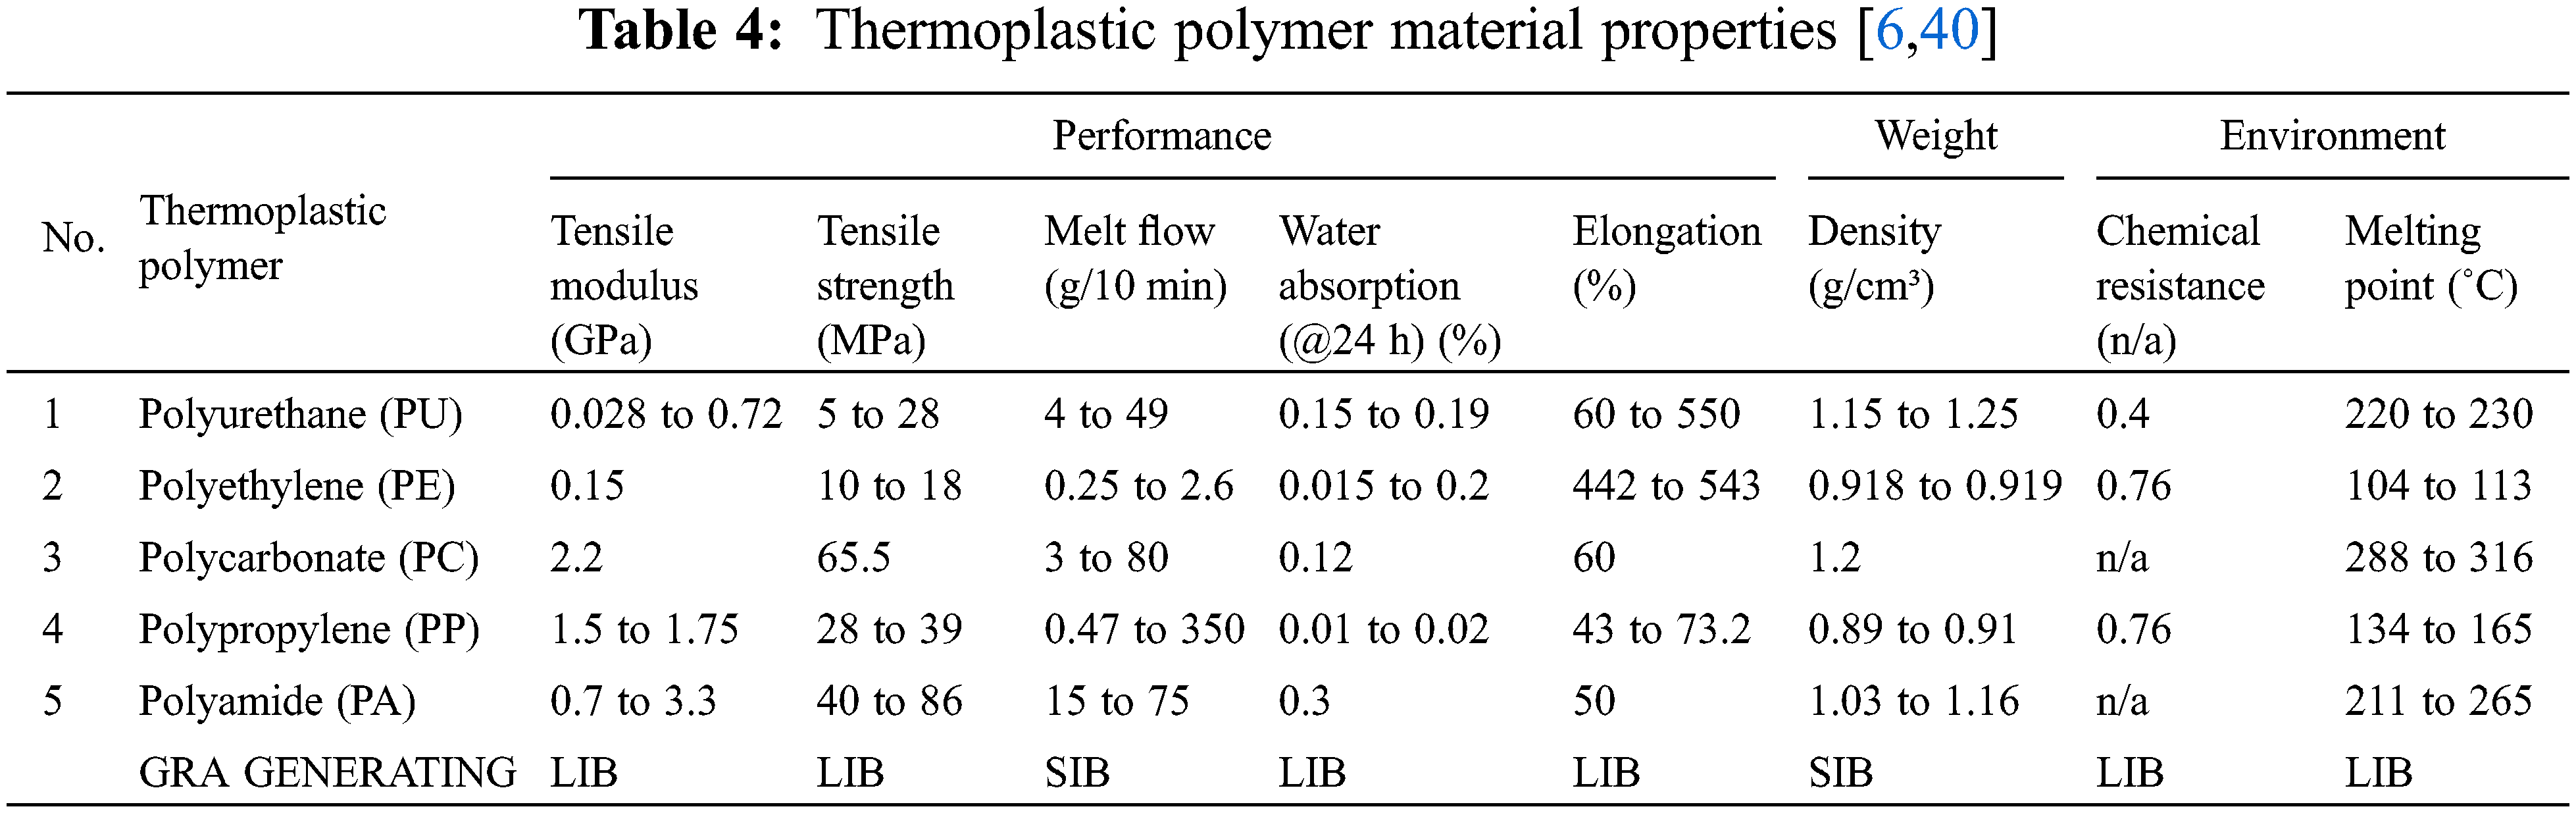
Before proceeding to the material selection, the “analyse” phase identified the capability of thermoplastic matrices material properties candidates as given in Table 4. The benefits and drawbacks of particular material qualities and potential production issues can be identified at this stage. The tensile modulus, density, elongation at break, tensile strength, and melting point were among the other material parameters of five different thermoplastic matrices chosen for investigation.
The “improve” step assessed four thermoplastic polymer materials, using Polycarbonate (PC) as a reference. As a datum, polycarbonate (PC), one of the existing materials used for outer shell CH design, development, and manufacture, was chosen. The final results of the Pugh method qualitative methodology in Table 5 reveal that polyethylene (PE) should be selected as the best material to build CH. When compared to other thermoplastic polymer materials such as polypropylene (PP), polycarbonate (PC), polyamide (PA), and polyurethane, polyethylene (PE) obtained the highest total number of 7+. (PU). Polyurethane (PU) tied for second place with 5+. The Pugh technique is based on a series of pairwise similarities between material candidates and a set of common CH materials. As specified in step 2, eight material properties were given in Table 5 to compare with material properties data, along with one pertinent selection criteria of recyclability.
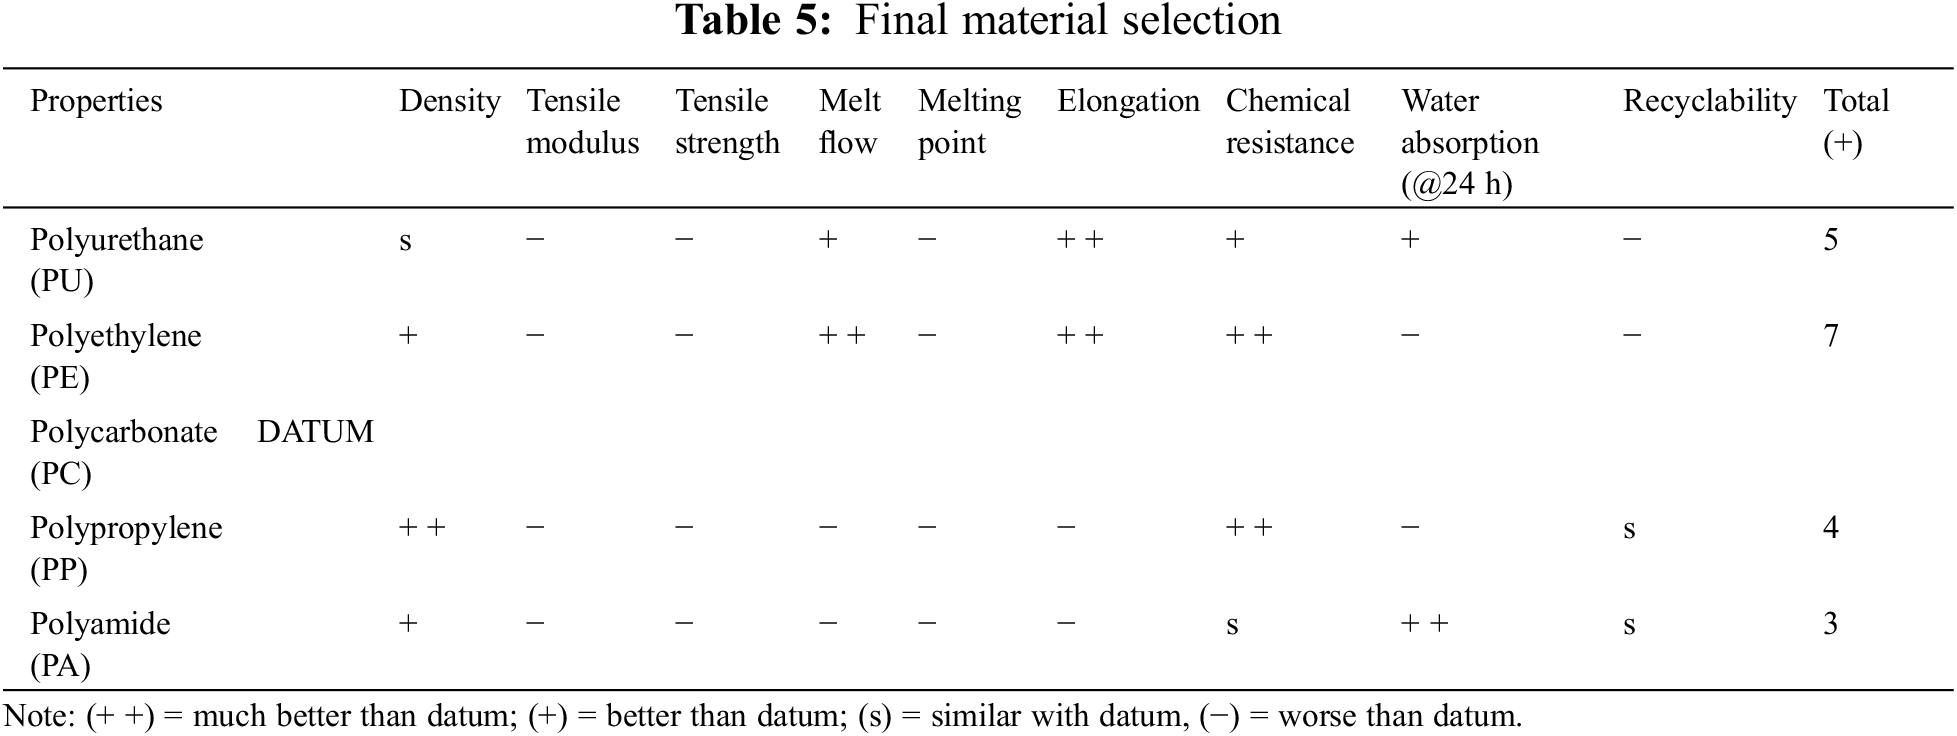
From the findings of the “improve” phase, polyethylene (PE) was proposed as the best candidate material for CH. The Pugh method methodology has an advantage over other decision-making tools because it can manage numerous decision criteria. Nevertheless, the “quality” of the selection criteria is essentially related to the “quality” of the result using the Pugh technique. This attribute has three dimensions: First, faulty selection criteria may result in an inaccurate judgement [45]. Using opinions to identify the criteria may naturally result in inaccurate criteria. Next, incomplete selection criteria refer to situations with an incomplete list of selection criteria. Third, insufficient selection criteria are inadequately defined and can have numerous interpretations. As a result, GRA was employed in this control stage to monitor and confirm the accuracy of the results from the “improve” phase. The data acquired from the measurement and analysis procedures were simulated in this stage to validate the results from the “improve” phase and select the most suitable thermoplastic matrix material for the CH. It is difficult to identify a pattern or relationship between the input components and the intended outcomes in this study because grey systems lack complete information. Instead of dealing with vast amounts of data, GRA is a real-time modelling strategy that uses minimum data using a statistical model. It is used to identify GRG by establishing the links between the elements and recognising the important factors that significantly affect the intended findings. In that it involves competing criteria with unclear cumulative impact on the result, the material selection issue is identical to the grey system. The GRA process is based on the data in Table 4.
Grey relational sequence generation
Grey relational generation primarily aims to turn raw data into matching sequences. Using Eq. (1), the target values of the performance attributes were greater for tensile modulus, tensile strength, melting temperature, elongation to break, chemical resistance, and water absorption (@24 h) (LIB). Meanwhile, for density and melt flow attributes, the grey relational generation procedure was used in Eq. (2) for the smaller intended value of the attribute (SIB). In the instance of the density characteristic, for example, 1.2 was the maximum value from choices 1 and 3, and 0.9 was the minimum value from alternative 4. Using Eq. (2), the grey relational obtained by alternative No. 1 equaled (1.2–1.2)/(1.2–0.9) = 0. Table 6 displays all grey relationship-producing findings.

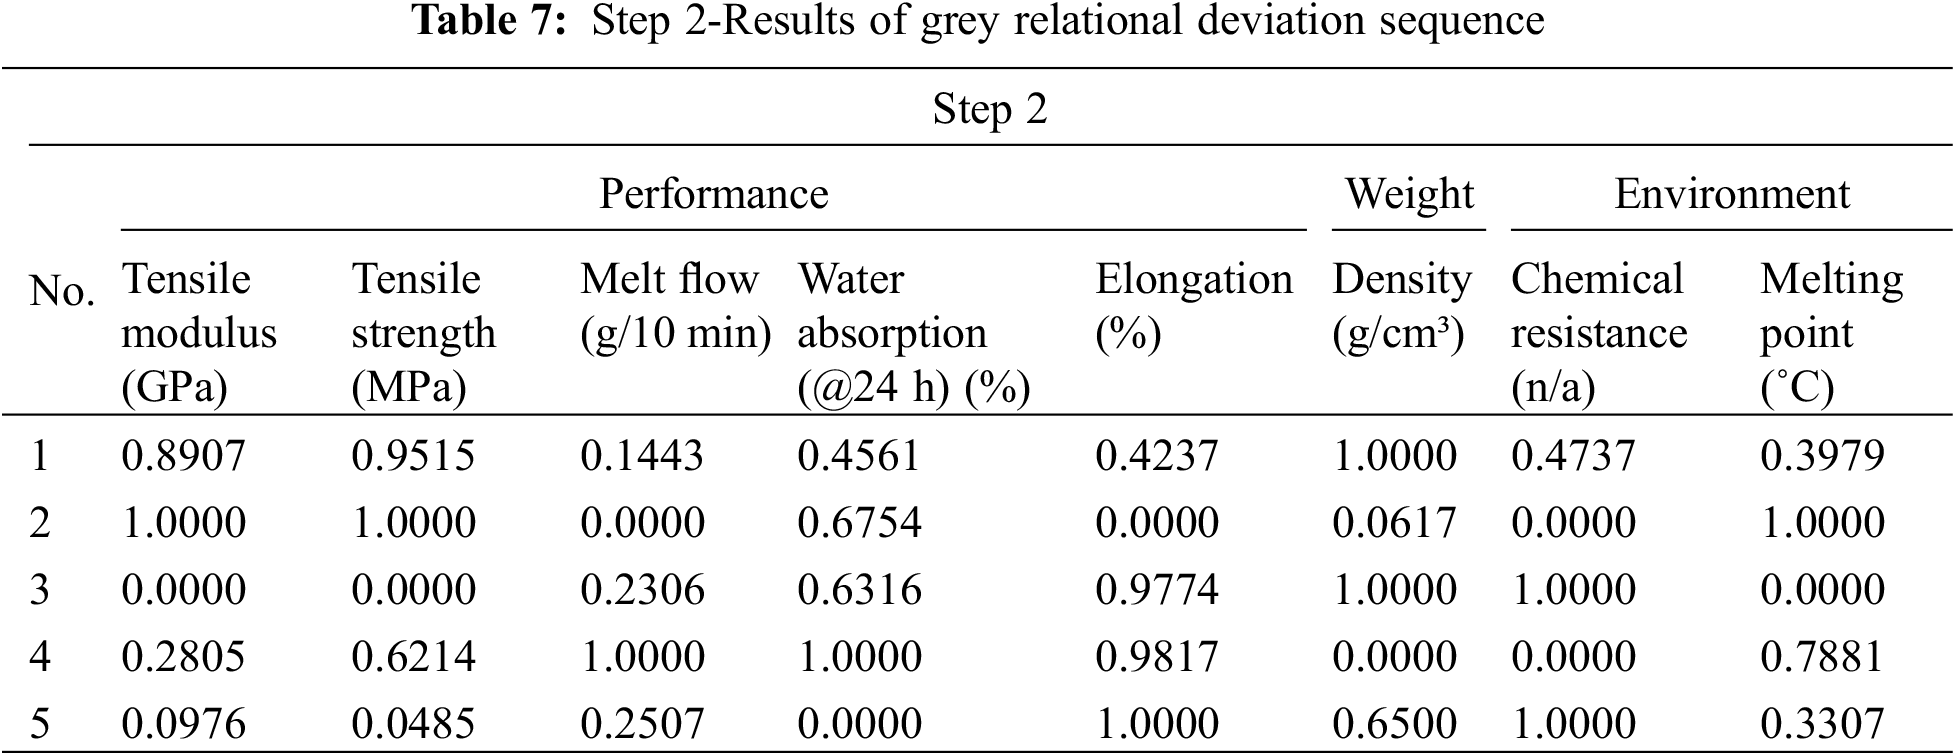
Derivation of reference sequence
X0 is the reference sequence presented in Table 4. The comparability sequence values, Xi were ranged into [0, 1] after the grey relational sequence was generated. The option with the larger X i value (equal to unity) outperformed the others. Nevertheless, this particular type of performance criterion was unusual. This resulted in a defined reference sequence X0, with values equal to 1 that was compared to the generated sequence. The option with the highest degree of similarity between the two sequences was picked as the superior option. All findings of the grey relational derivation sequence are shown in Table 7. The reference sequence was expressed as:
Calculation of grey relational coefficient
After calculating
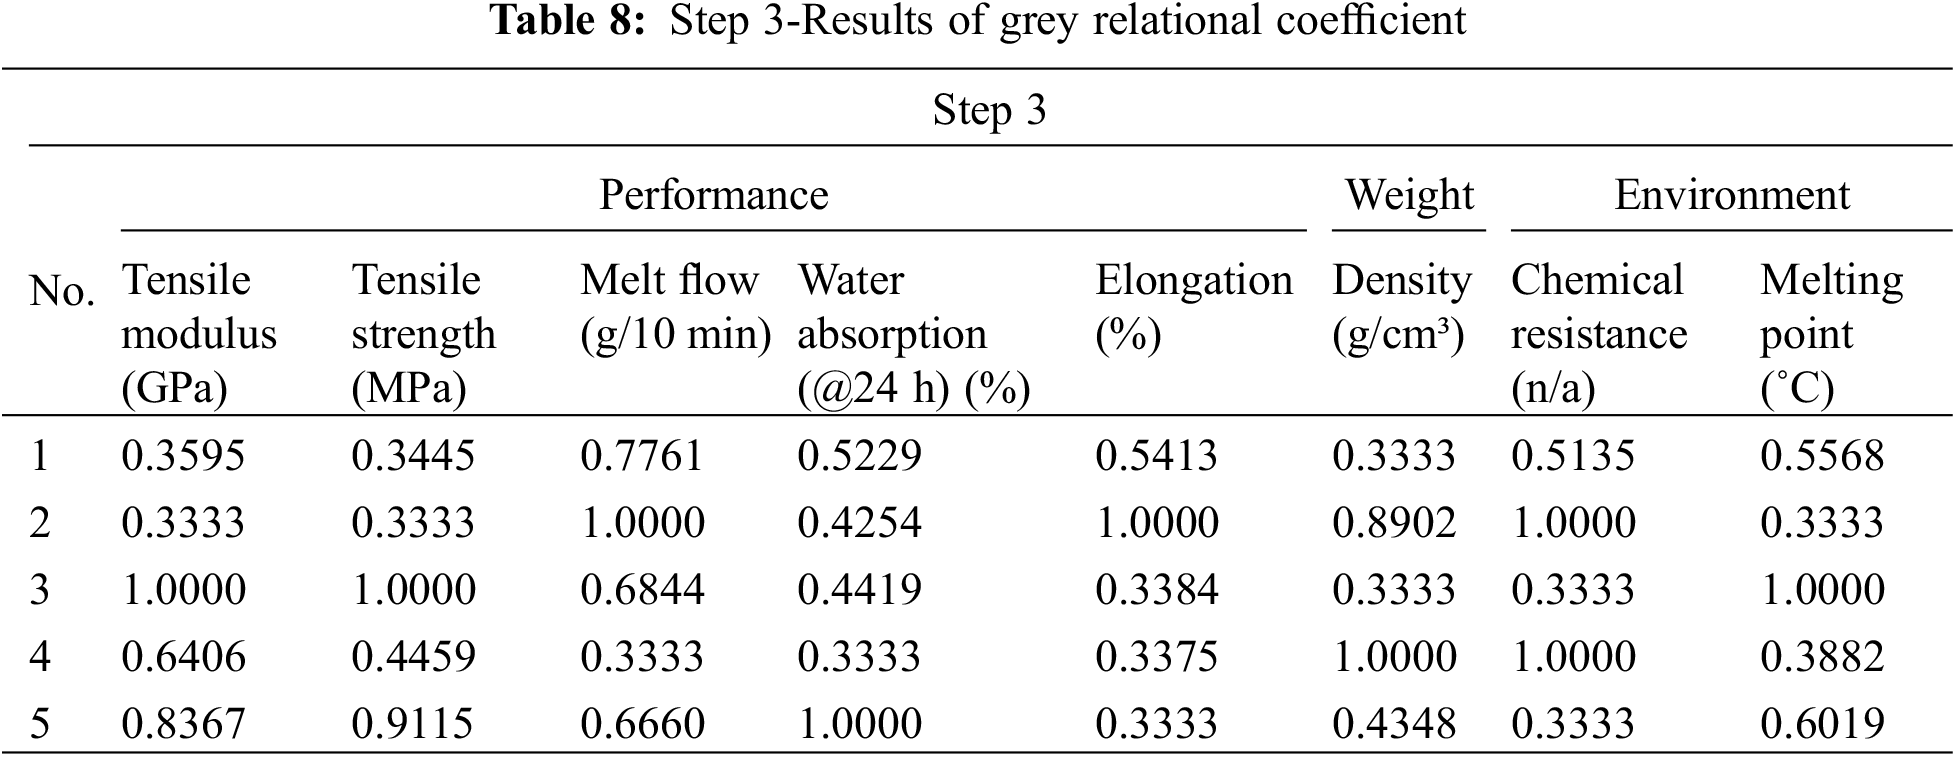
Calculation of GRG
In this phenomenon, it was considered that all performance attributes possessed equal relevance. As a result, an equal weight (1/10) was assigned to each of the five performance indicators. The GRG was calculated using Eq. (4), shown in Column 2 of Table 9. In Table 9, Column 3 displays the GRA’s ranking results. Table 10 shows the grey relational grade and rank tables for performance, weight, and environment to make Fig. 5 easier to understand. Five alternatives of thermoplastic polymer were ranked following their GRA grade scores computed by Microsoft Excel 2016 using the corresponding formula based on the synthesised primary criteria results. Fig. 6 illustrates the results. With a score of 0.6644, Polyethylene (PE) received the highest grade and ranked first. Polycarbonate (PC) had the second-highest grade with a score of 0.6414, followed by Polyamide (PA) and Polypropylene (PP) with scores of 0.6397 and 0.5598, respectively. With grades of 0.4935, polyurethane (PU) was at the bottom of the list.
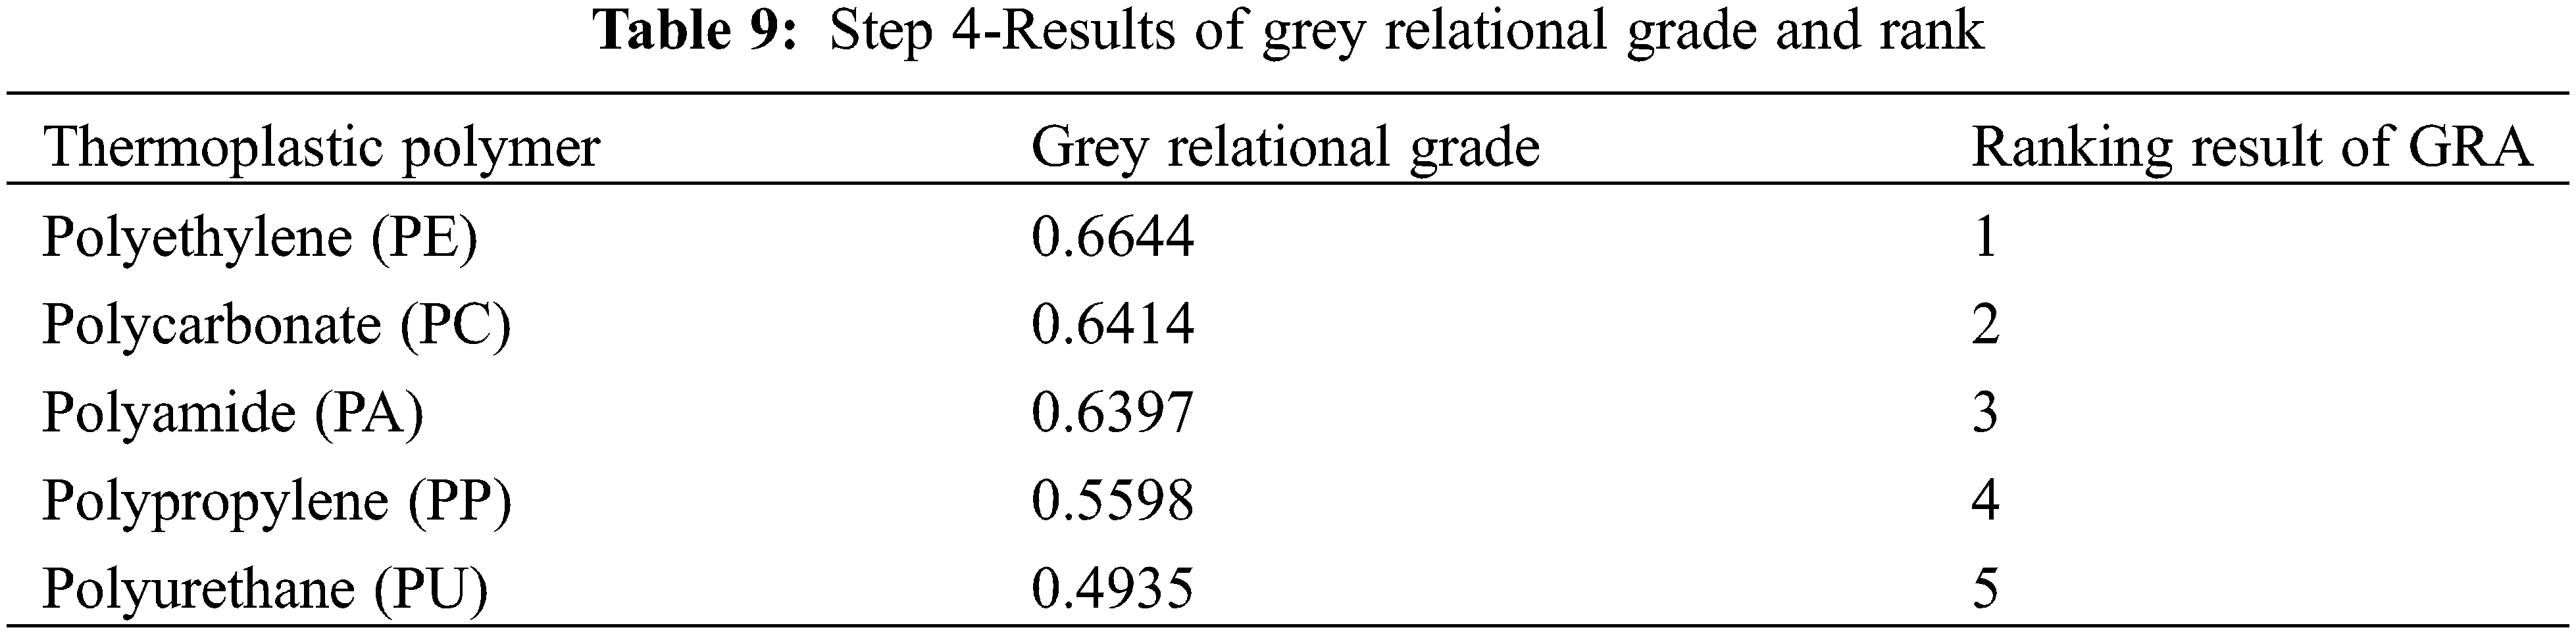
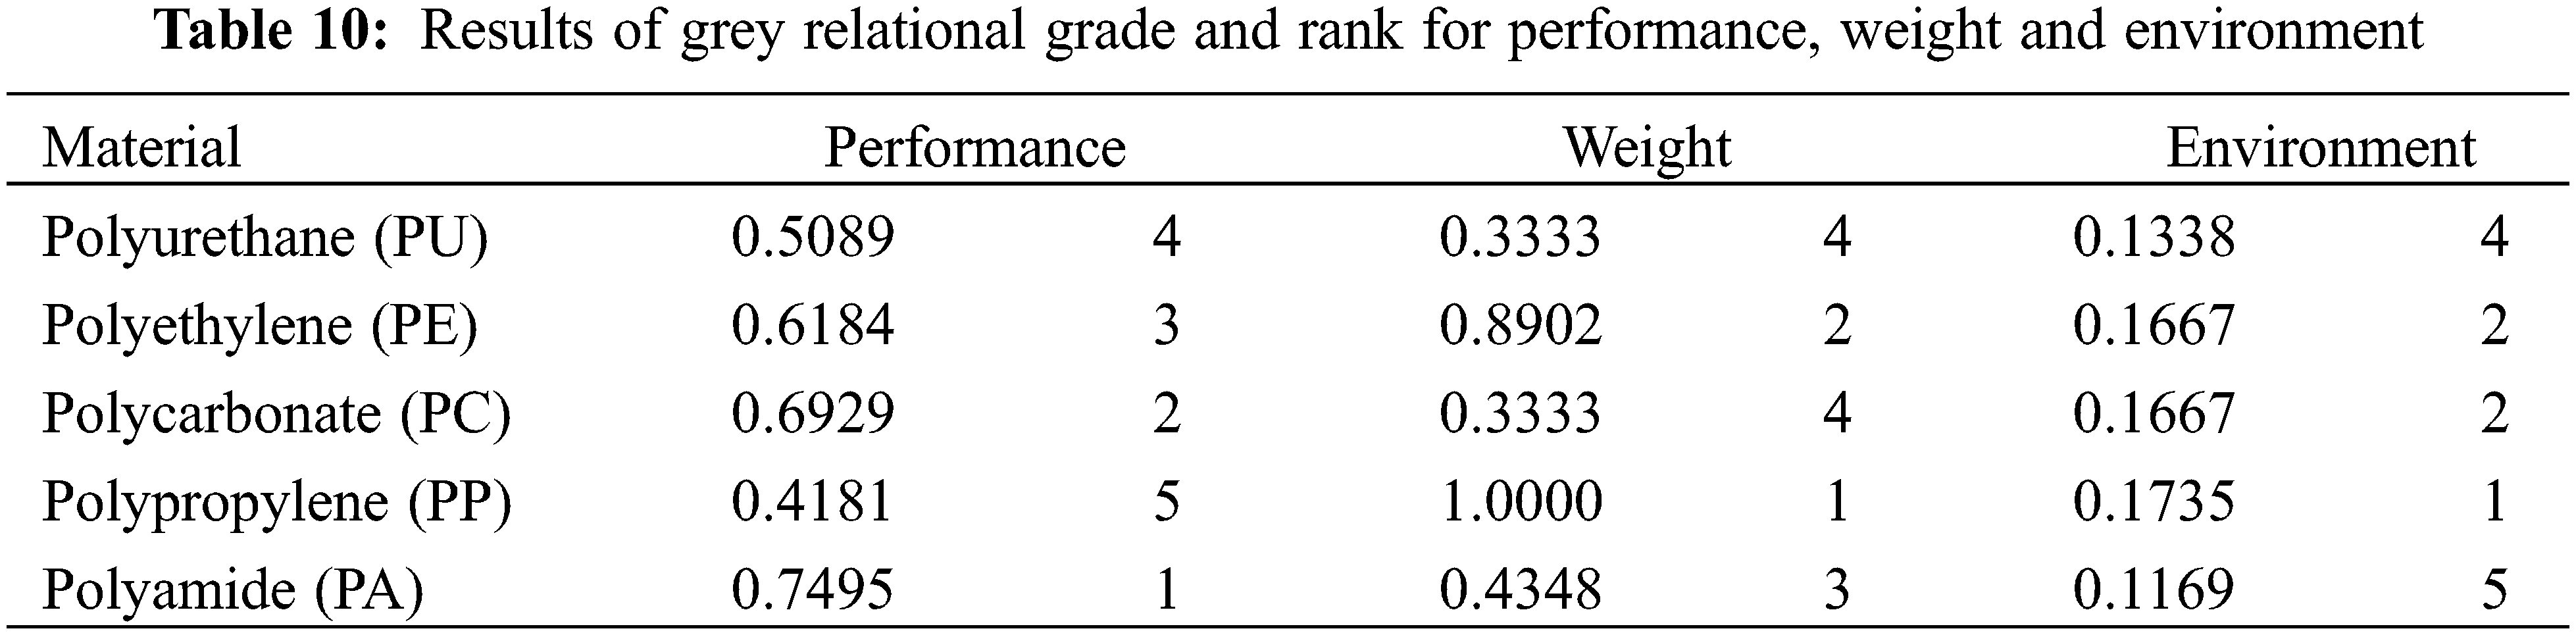
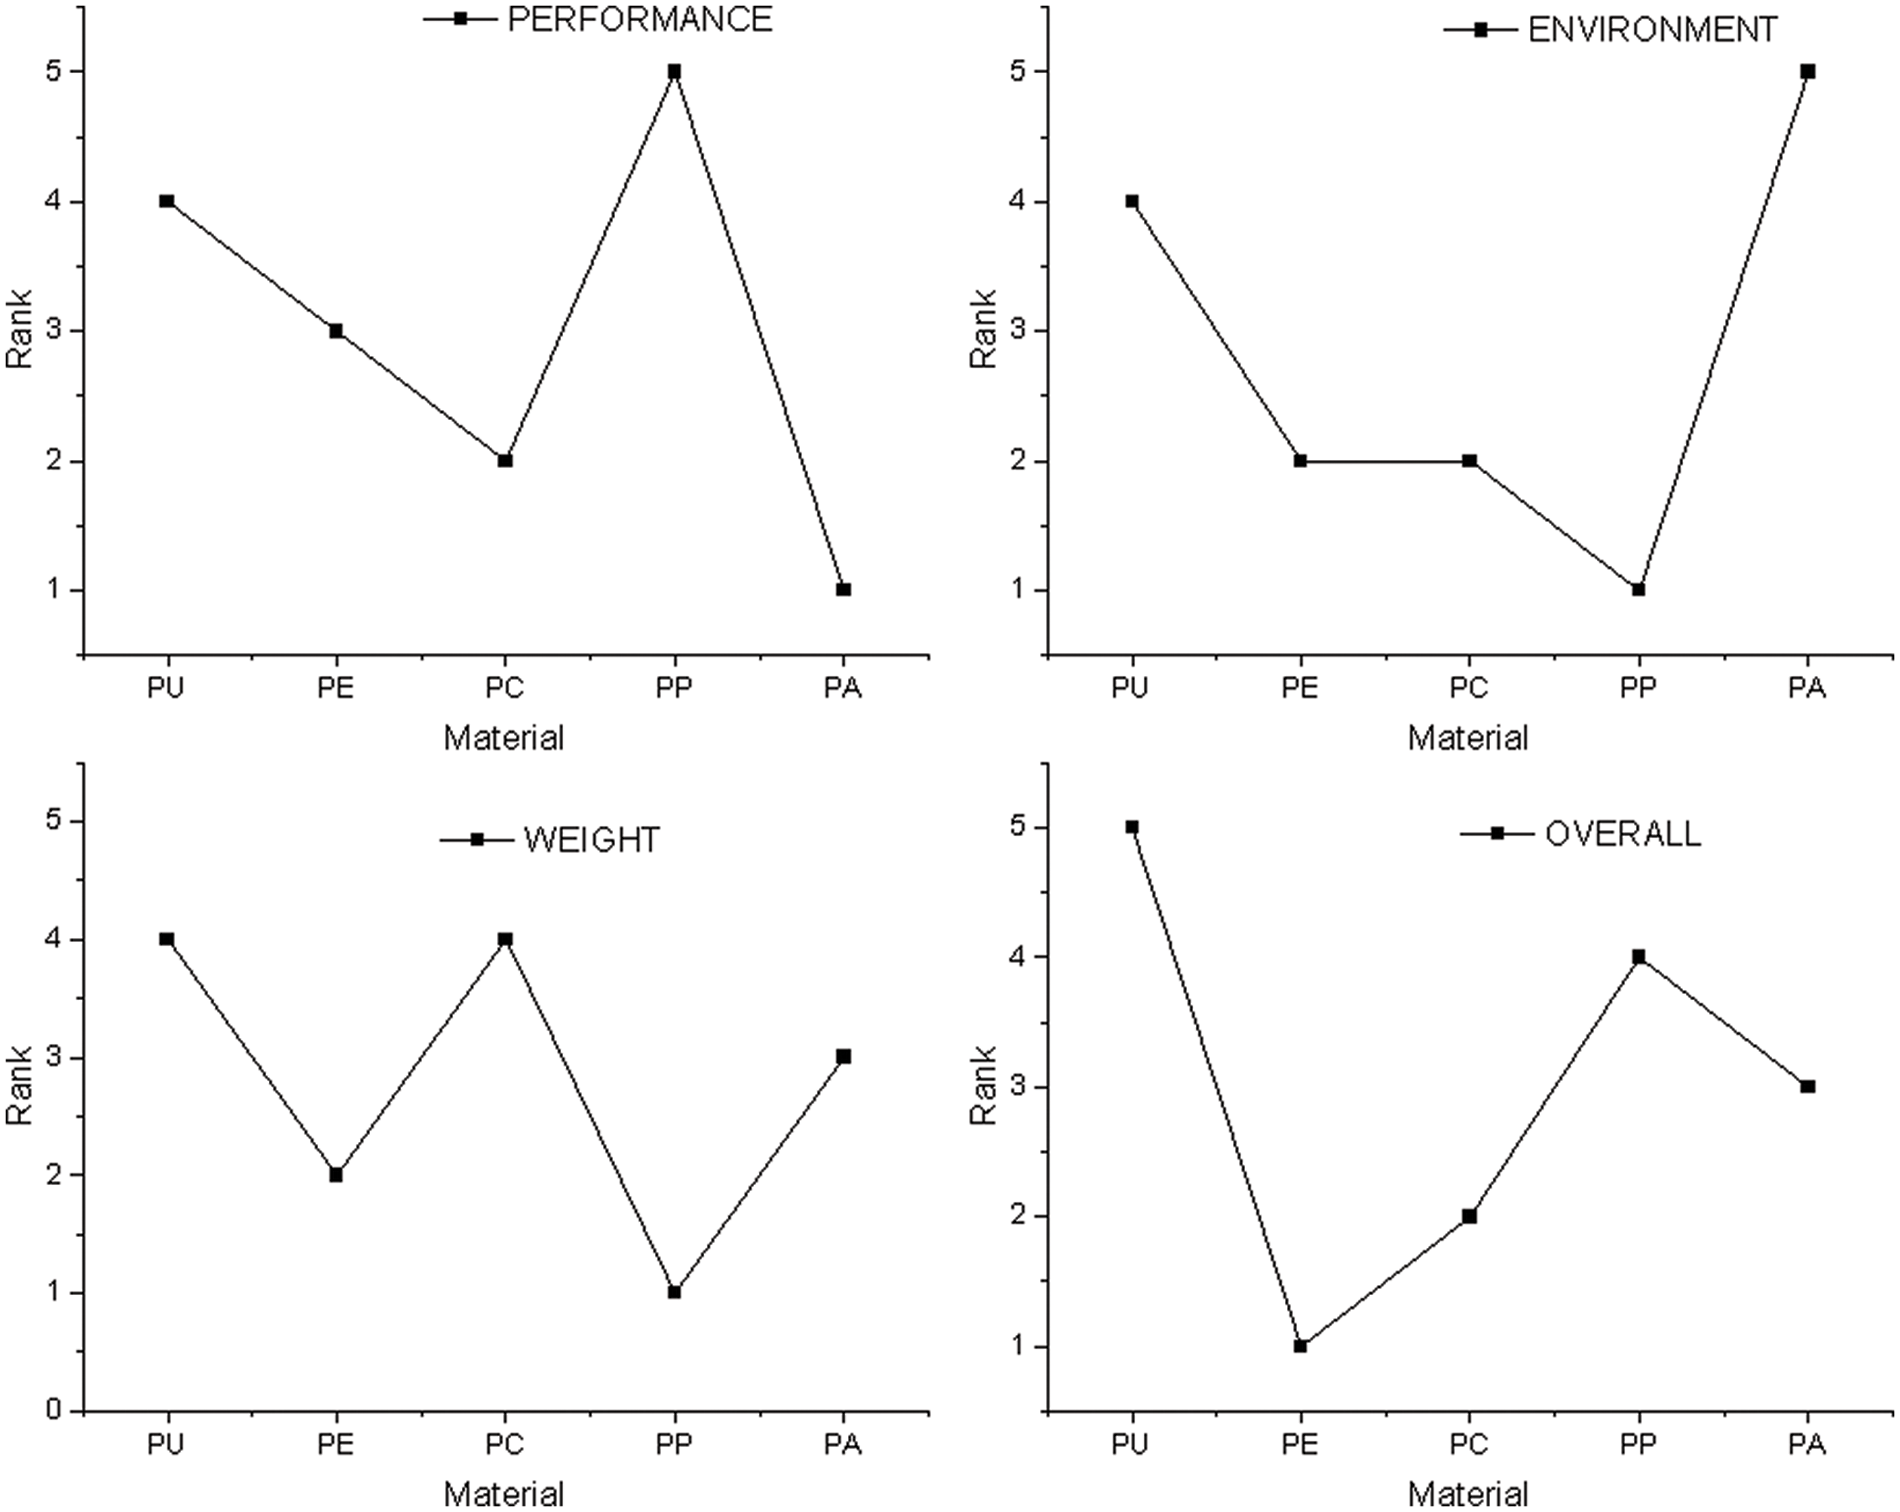
Figure 5: The GRA final synthesis results with respect to all criteria
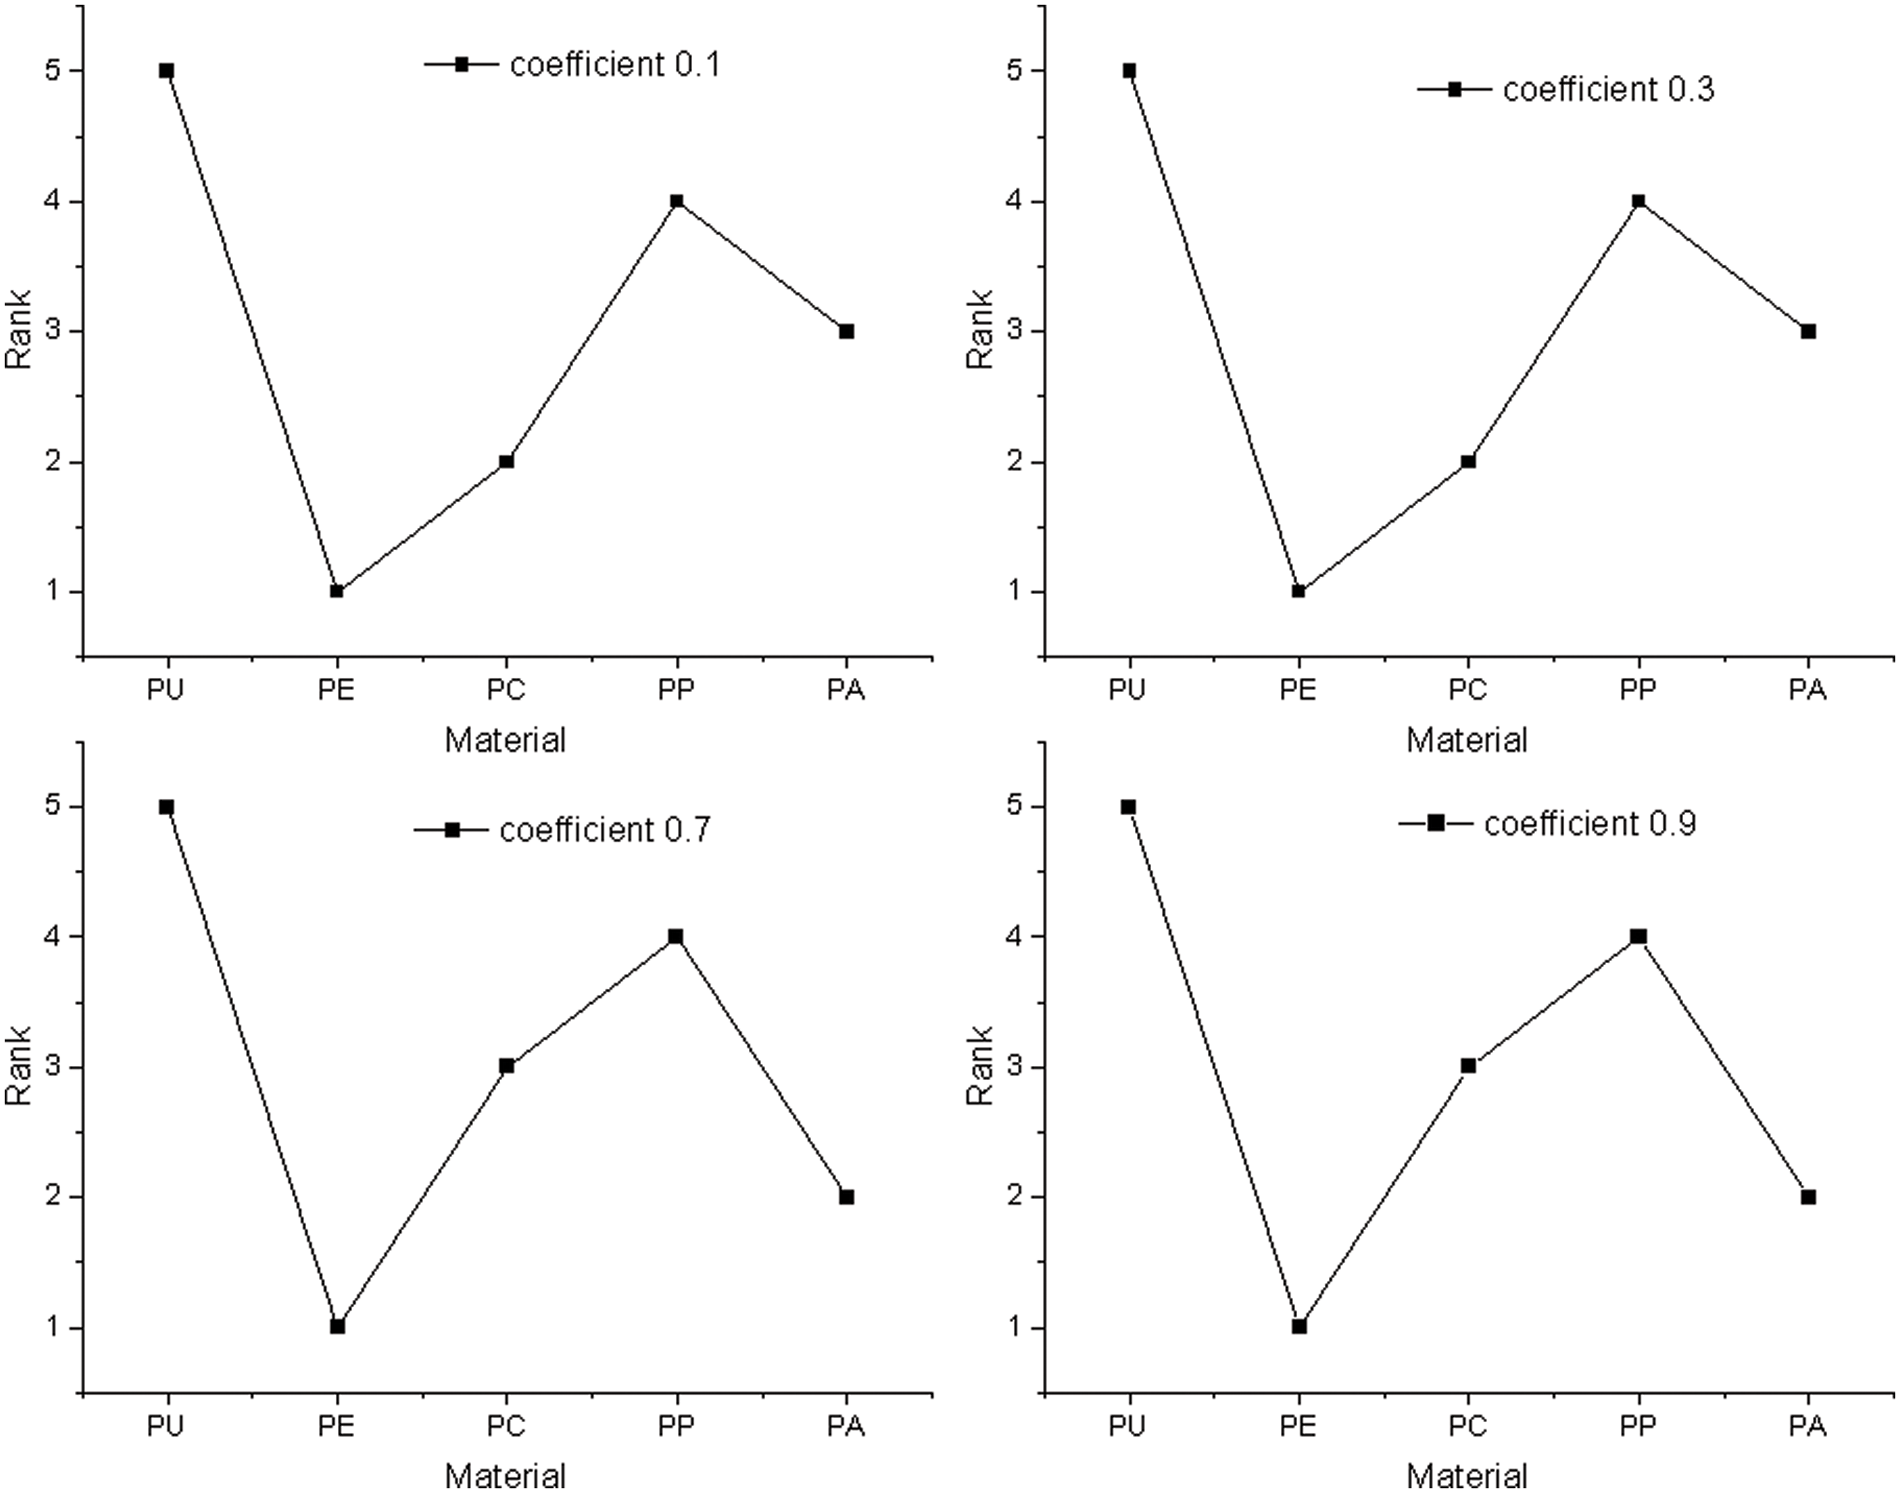
Figure 6: The impact of distinguishing coefficient on the results of GRA to find the best thermoplastic matrices of natural fibre composites for safety gear application (Cyclist Helmet)
It is vital to recognise that each thermoplastic polymer has unique qualities based on its fundamental characteristics [20–22]. Along with the general conclusions, each alternative criterion’s scores were recorded and transformed into a graph (Fig. 5). The grade of polyamide (PA) scored the highest on the “Performance” criterion, whereas polypropylene (PP) scored the lowest. Polypropylene (PP) scored highly in the “Weight” category, while polycarbonate (PC) and polyurethane (PU) scored poorly. Surprisingly, polypropylene (PP) received the highest rating for “Environment,” followed by polyethylene (PE) with a slight grade difference. The ‘overall’ line in the graph represents the combined outcome of all three criteria (performance, weight, and environment). The data indicate that the polyethylene (PE) trend is nearly consistent across all criteria. According to Grover et al. [45], polyethylene usage is expanding daily, and it is now evident that polyethylene is employed in virtually every aspect of daily life. Thermoplastic matrix composites provide different benefits regarding recyclability, weight reduction, corrosion resistance, specific strength, design versatility, and cost-effectiveness [46].
The Distinguishing Coefficient (δ) is a crucial component of GRA, a top multi-criteria decision making (MCDM) model of grey system theory, which was created by Chinese researchers in the 1980s. But, generally, researchers assume δ = 0.5, whereas the present study investigated this practice [35]. According to other researchers, the values δ variance has little impact on the components’ GRA rankings. The study, however, showed that difference in δ may impact the order [47]. The goal of the distinguishing coefficient is to reduce or increase the range of the grey relational coefficient, for instance, in the case where three alternatives exist, a, b, and c. If Δaj = 0.1, Δbj = 0.4, and Δcj = 0.9, for attribute j, alternative a is the closest to the reference sequence. The results from the grey relational generation using Eq. (1) through 4, Δmax will be equal to 1 and Δmin will be equal to 0, respectively. Fig. 6 depicts the results for grey relational coefficients when various distinguishing coefficients were utilised. Primarily, the distinguishing coefficient in this investigation was set at 0.5 and the result is shown in Fig. 7. In addition, as part of error analysis, this work assessed the effect on GRA results when the distinguishing coefficients were adjusted to 0.1, 0.3, 0.7, and 0.9, respectively. Table 11 summarises the findings.
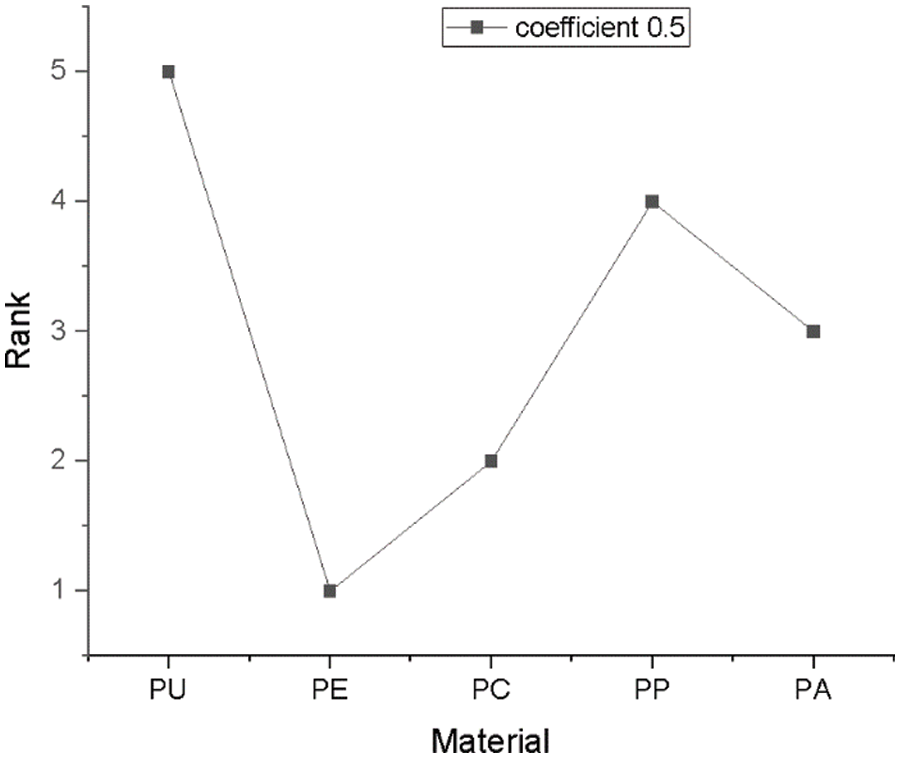
Figure 7: The distinguishing coefficient 0.5
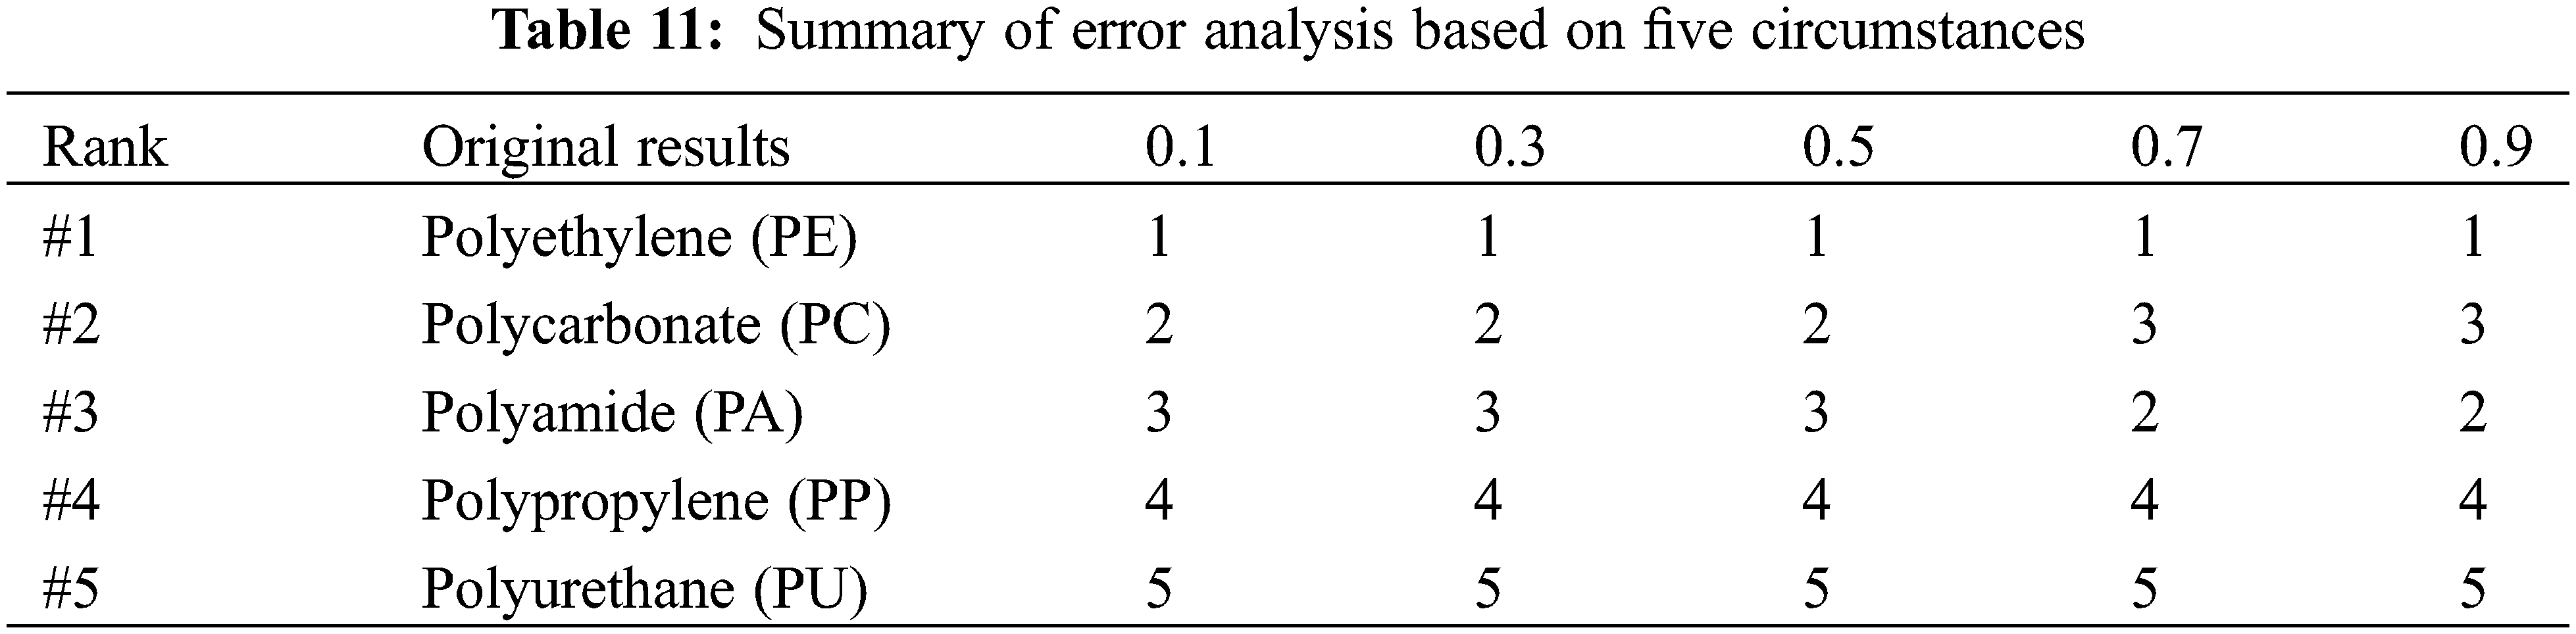
The best thermoplastic matrices of natural fibre composites for bicycle helmets were determined to be polyethylene (PE). In addition, Polycarbonate (PC) and polyamide (PA) are typically ranked among the top three. In contrast, polyurethane (PU) and polypropylene (PP) consistently ranked last in all circumstances. For the particular design goal, polyurethane (PU) and polypropylene (PP) were determined to be the least desirable natural fibre composite thermoplastic matrix. The authors suggest that the thermoplastic matrices selection technique may have been more exhaustive if more information from other factors had been added. Several elements must be considered when determining the required criteria formulation. Consequently, in the thermoplastic matrices selection process, decision-makers must create selection criteria that are as specific as possible to the particular demand, which will impact the election outcomes.
Thermoplastic polyethylene was suggested as a particularly ideal matrix in composite cyclist helmets during the selection process for the best thermoplastic matrices material using the 6σ technique, with the decision based on the highest performance, the lightest weight, and the most environmentally friendly criteria. Using a 6σ method in material selection, if polyethylene (PE) is recommended as the best material choice, then the twofold decision-making procedures must give consistent findings. In addition, the Pugh method’s use of qualitative methodologies and the GRA statistical analysis yielded more realistic data while comparing and selecting the best material. The decision was made using a set of established criteria and limitations connected to the desired component’s requirements, which could be seen from both a qualitative and quantitative angle. As a result, the evaluation data and the customer’s voice were translated from a qualitative consumer statement into actionable quantitative data from the GRA evaluation results. Due to the fulfilment of all selection criteria and the consistency of the results, thermoplastic polyethylene is selected as the most suitable polymer matrix for natural fibre composites for cyclist helmets. On the other hand, this study has shown that 6σ and GRA technique assists engineers in selecting materials quickly where a simple approach is required driven by customers and the environment. This approach also exhibits a better understanding of the environmental and renewable perspective in material selection, which applies to any material.
Acknowledgement: The authors would like to thank Universiti Putra Malaysia (Serdang, Malaysia) and as Universiti Teknikal Malaysia Melaka (Durian Tunggal, Malaysia) for the support and the opportunity to perform this study as well and the Ministry of Higher Education Malaysia for awarding the scholarship to the principal author to conduct this research project.
Funding Statement: The authors received no specific funding for this study.
Conflicts of Interest: The authors declare that they have no conflicts of interest to report regarding the present study.
References
1. Koronis, G., Silva, A., Fontul, M. (2013). Green composites: A review of adequate materials for automotive applications. Composites Part B: Engineering, 44(1), 120–127. DOI 10.1016/j.compositesb.2012.07.004. [Google Scholar] [CrossRef]
2. Salit, M. S. (2014). Tropical natural fibre composites: Properties, manufacture and applications. Singapore: Springer Science + Business Media. [Google Scholar]
3. Peças, P., Carvalho, H., Salman, H., Leite, M. (2018). Natural fibre composites and their applications: A review. Journal of Composites Science, 2(4), 1–20. DOI 10.3390/jcs2040066. [Google Scholar] [CrossRef]
4. Pucci, A. (2018). Smart and modern thermoplastic polymer materials. Polymers, 10(11). DOI 10.3390/POLYM10111211. [Google Scholar] [CrossRef]
5. Kim, J. W., Lee, D. G. (2014). Study on the fiber orientation during compression molding of reinforced thermoplastic composites. International Journal of Precision Engineering and Manufacturing-Green Technology, 1(4), 335–339. DOI 10.1007/s40684-014-0042-z. [Google Scholar] [CrossRef]
6. Vaidya, U. K., Chawla, K. K. (2008). Processing of fibre reinforced thermoplastic composites. International Materials Reviews, 53(4), 185–218. DOI 10.1179/174328008X325223. [Google Scholar] [CrossRef]
7. Gascons, M., Blanco, N., Mayugo, J. A., Matthys, K. (2012). A strategy to support design processes for fibre reinforced thermoset composite materials. Applied Composite Materials, 19(3–4), 297–314. DOI 10.1007/s10443-011-9203-1. [Google Scholar] [CrossRef]
8. Sandström, R. (1985). An approach to systematic materials selection. Materials & Design, 6(6), 328–338. DOI 10.1016/0261-3069(85)90018-4. [Google Scholar] [CrossRef]
9. Araci, Z. C., Al-Ashaab, A., Garcia Almeida, C. (2022). Physics-based trade-off curves to develop a control access product in set-based concurrent engineering environment. International Journal of Lean Six Sigma, 13(4), 824–846. DOI 10.1108/IJLSS-10-2016-0061/FULL/XML. [Google Scholar] [CrossRef]
10. Pyzdek, T., Keller, P. (2010). The Six Sigma handbook. 4th edition. New York: McGraw-Hill. [Google Scholar]
11. Sharma, S., Bhardwaj, D., Kumar, V. (2013). Six Sigma approach: Application, benefits and scope. International Journal of Mechanical Engineering and Robotics Research, 2(3), 365–370. [Google Scholar]
12. Pakdil, F. (2022). Six Sigma project prioritization and selection methods: A systematic literature review. International Journal of Lean Six Sigma, 13(2), 382–407. DOI 10.1108/IJLSS-01-2021-0001/FULL/XML. [Google Scholar] [CrossRef]
13. Chakraborty, A., Tan, K. C. (2012). Total quality management Six Sigma. London: InTech. [Google Scholar]
14. Tong, J. P. C., Tsung, F., Yen, B. P. C. (2004). A DMAIC approach to printed circuit board quality improvement. The International Journal of Advanced Manufacturing Technology, 23(7–8), 523–531. DOI 10.1007/s00170-003-1721-z. [Google Scholar] [CrossRef]
15. Li, M. H. C., Al-Refaie, A., Yang, C. Y. (2008). DMAIC approach to improve the capability of SMT solder printing process. IEEE Transactions on Electronics Packaging Manufacturing, 31(2), 126–133. DOI 10.1109/TEPM.2008.919342. [Google Scholar] [CrossRef]
16. Sharma, G. V. S. S., Rao, P. S. (2014). A DMAIC approach for process capability improvement an engine crankshaft manufacturing process. Journal of Industrial Engineering International, 10(2), 1–11. DOI 10.1007/s40092-014-0065-7. [Google Scholar] [CrossRef]
17. Yusof, N. S. B., Sapuan, S. M., Sultan, M. T. H., Jawaid, M. (2018). Concept generation of sugar palm/glass fiber reinforced thermoplastic polyurethane hybrid composite automotive crash box. Journal of Advanced Research in Materials Science, 49(1), 10–17. [Google Scholar]
18. Chen, M., Lyu, J. (2009). A lean Six-Sigma approach to touch panel quality improvement. Production Planning & Control, 20(5), 445–454. DOI 10.1080/09537280902946343. [Google Scholar] [CrossRef]
19. Norizan, M. N., Abdan, K., Ilyas, R. A. (2020). Effect of fiber orientation and fiber loading on the mechanical and thermal properties of sugar palm yarn fiber reinforced unsaturated polyester resin composites. Polimery, 65(2), 34–43. [Google Scholar]
20. Azammi, A. M. N., Ilyas, R. A., Aiqah, A. (2020). Characterization studies of biopolymeric matrix and cellulose fibres based composites related to functionalized fibre-matrix interface. In: Goh, K. L., Thomas, S., de Silva, R. T. et al. (Eds.Interfaces in particle and fibre reinforced composites, 1st edition, pp. 29–93. London: Elsevier. [Google Scholar]
21. Abral, H., Atmajaya, A., Mahardika, M. (2020). Effect of ultrasonication duration of polyvinyl alcohol (PVA) gel on characterizations of PVA film. Journal of Materials Research and Technology, 9, 2477–2486. DOI 10.1016/j.jmrt.2019.12.078. [Google Scholar] [CrossRef]
22. Jumaidin, R. (2019). Characteristics of cogon grass fibre reinforced thermoplastic cassava starch biocomposite: Water absorption and physical properties. Journal of Advanced Research in Fluid Mechanics and Thermal Sciences, 62(1), 43–52. [Google Scholar]
23. Tohidi, H. (2012). Six Sigma methodology and its relationship with lean manufacturing system. Advances in Environmental Biology, 6(2), 895–906. [Google Scholar]
24. Escobar, C. A., Macias, D., McGovern, M., Hernandez-de-Menendez, M., Morales-Menendez, R. (2022). Quality 4.0–an evolution of Six Sigma DMAIC. International Journal of Lean Six Sigma, 13(6), 1200–1238. DOI 10.1108/IJLSS-05-2021-0091. [Google Scholar] [CrossRef]
25. Hollingshed, M. (2022). Standardizing Six Sigma Green Belt training: Identification of the most frequently used measure phase DMAIC tools. International Journal of Lean Six Sigma, 13(2), 276–294. DOI 10.1108/IJLSS-12-2020-0220. [Google Scholar] [CrossRef]
26. Lobo Mesquita, L., Lizarelli, F. L., Duarte, S., Oprime, P. C. (2022). Exploring relationships for integrating lean, environmental sustainability and industry 4.0. International Journal of Lean Six Sigma, 13(4), 863–896. DOI 10.1108/IJLSS-09-2020-0145/FULL/XML. [Google Scholar] [CrossRef]
27. Consumer Product Safety Commission. https://www.cpsc.gov/PageFiles/105554/helmets.pdf. [Google Scholar]
28. Frey, D. D., Herder, P. M., Wijnia, Y. (2007). An evaluation of the pugh controlled convergence method. ASME 2007 International Design Engineering Technical Conferences and Computers and Information in Engineering Conference, pp. 193–203. Las Vegas, Nevada, USA: ASME. [Google Scholar]
29. Sreejith, S. S., Mathirajan, M. (2022). A modified pugh matrix method for continuous performance evaluation of employees. South Asian Journal of Human Resources Management, 9(1), 149–163. DOI 10.1177/23220937221081946. [Google Scholar] [CrossRef]
30. Deng, J. L. (1989). Grey information space. The Journal of Grey System, 1(2), 103–117. DOI 10.1007/978-3-642-13938-3_39. [Google Scholar] [CrossRef]
31. Morán, J., Granada, E., Míguez, J. L., Porteiro, J. (2006). Use of grey relational analysis to assess and optimize small biomass boilers. Fuel Processing Technology, 87, 123–127. DOI 10.1016/j.fuproc.2005.08.008. [Google Scholar] [CrossRef]
32. Kanchana, J., Prasath, V., Krishnaraj, V., Geetha Priyadharshini, B. (2019). Multi response optimization of process parameters using grey relational analysis for milling of hardened custom 465 steel. Procedia Manufacturing, 30, 451–458. DOI 10.1016/J.PROMFG.2019.02.064. [Google Scholar] [CrossRef]
33. Gerus-Gościewska, M., Gościewski, D. (2022). Grey relational analysis (GRA) as an effective method of research into social preferences in urban space planning. Land, 11, 102. DOI 10.3390/LAND11010102. [Google Scholar] [CrossRef]
34. Jayakrishna, K., Vinodh, S. (2017). Application of grey relational analysis for material and end of life strategy selection with multiple criteria. International Journal of Materials Engineering Innovation, 8(3–4), 250–272. DOI 10.1504/IJMATEI.2017.090241. [Google Scholar] [CrossRef]
35. Maidin, N. A., Sapuan, S. M., Taha, M. M., Yusoff, M. Z. M. (2021). Material selection of natural fibre using a grey relational analysis (GRA) approach. BioResources, 17(1), 109–131. DOI 10.15376/BIORES.17.1.109-131. [Google Scholar] [CrossRef]
36. Giudice, F., La Rosa, G., Risitano, A. (2005). Materials selection in the life-cycle design process: A method to integrate mechanical and environmental performances in optimal choice. Materials & Design, 26(1), 9–20. DOI 10.1016/j.matdes.2004.04.006. [Google Scholar] [CrossRef]
37. Sapuan, S., Kho, J., Zainudin, E., Leman, Z., Ali, B. (2011). Materials selection for natural fiber reinforced polymer composites using analytical hierarchy process. Indian Journal of Engineering and Materials Sciences, 18, 255–267. [Google Scholar]
38. Monteiro, S. N., Lopes, F. P. D., Ferreira, A. S. (2009). Natural-fiber polymer-matrix composites: Cheaper, tougher, and environmentally friendly. JOM, 61(1), 17–22. DOI 10.1007/s11837-009-0004-z. [Google Scholar] [CrossRef]
39. Sjoblom, P. O., Hartness, J. T., Cordell, T. M. (1988). On low-velocity impact testing of composite materials. Journal of Composite Materials, 22(1), 30–52. DOI 10.1177/002199838802200103. [Google Scholar] [CrossRef]
40. Mastura, M. T., Sapuan, S. M., Mansor, M. R., Nuraini, A. A. (2018). Materials selection of thermoplastic matrices for ‘green’ natural fibre composites for automotive anti-roll bar with particular emphasis on the environment. International Journal of Precision Engineering and Manufacturing-Green Technology, 5(1), 111–119. DOI 10.1007/s40684-018-0012-y. [Google Scholar] [CrossRef]
41. Lau, K., Hung, P., Zhu, M. H., Hui, D. (2018). Properties of natural fibre composites for structural engineering applications. Composites Part B: Engineering, 136, 222–233. DOI 10.1016/j.compositesb.2017.10.038. [Google Scholar] [CrossRef]
42. Mastura, M. T., Sapuan, S. M., Mansor, M. R. (2017). Environmentally conscious hybrid bio-composite material selection for automotive anti-roll bar. The International Journal of Advanced Manufacturing Technology, 89(5–8), 2203–2219. DOI 10.1007/s00170-016-9217-9. [Google Scholar] [CrossRef]
43. Asrofi, M., Syafri, E. (2019). Moisture resistance of sugarcane bagasse cellulose filled tapioca starch biocomposites: Effect of cellulose loading. International Journal of Progressive Sciences and Technologies, 18(1), 01–04. [Google Scholar]
44. Li, M., Pu, Y., Thomas, V. M., Yoo, C. G., Ozcan, S. et al. (2020). Recent advancements of plant-based natural fiber–reinforced composites and their applications. Composites Part B: Engineering, 200. DOI 10.1016/j.compositesb.2020.108254. [Google Scholar] [CrossRef]
45. Grover, A., Akanksha, S., Khurana, S. M. (2015). Polythene and environment. International Journal of Environmental Sciences, 5, 1091–1105. [Google Scholar]
46. Awais, H., Nawab, Y., Amjad, A., Anjang, A., Md Akil, H. et al. (2021). Environmental benign natural fibre reinforced thermoplastic composites: A review. Composites Part C: Open Access, 4, 100082. DOI 10.1016/J.JCOMC.2020.100082. [Google Scholar] [CrossRef]
47. Mahmoudi, A., Javed, S., Liu, S., Deng, X. (2020). Distinguishing coefficient driven sensitivity analysis of GRA model for intelligent decisions: Application in project management. Technological and Economic Development of Economy, 26(3), 621–641. DOI 10.3846/tede.2019.11890. [Google Scholar] [CrossRef]
Cite This Article
 Copyright © 2023 The Author(s). Published by Tech Science Press.
This work is licensed under a Creative Commons Attribution 4.0 International License , which permits unrestricted use, distribution, and reproduction in any medium, provided the original work is properly cited.
 Downloads
 Citation Tools