
 Submit a Paper
 Propose a Special lssue
 Open Access
ARTICLE

Experimental Study for the Cementation Effect of Dust Soil by Using Soybean Urease
1
School of Civil Engineering and Architecture, Henan University, Kaifeng, 475004, China
2
College of Civil and Transportation Engineering, Hohai University, Nanjing, 210024, China
3
State Key Laboratory of Subtropical Building Science, South China University of Technology, Guangzhou, 510640, China
4
School of Civil and Mechanical Engineering, Curtin University, Bentley, 6102, Australia
* Corresponding Author: Mi Zhou. Email:
Journal of Renewable Materials 2023, 11(6), 2893-2911. https://doi.org/10.32604/jrm.2023.025436
Received 12 July 2022; Accepted 20 September 2022; Issue published 10 April 2023
 View Full Text
 Download PDF
Abstract
Dust is an environmental and health hazard. In this study, a new technology for dust suppressant is introduced using soybean urease with an optimal cementing solution. Calcium carbonate is produced by soybean urease and cementing solution, which bonds the soil particles towards a dust suppressant. A laboratory wind tunnel test is carried out to examine its effectiveness and discover possible optimization solutions. Several factors, including soybean meal concentration, cementing solution concentration, and volume of solution per unit area, are examined to quantify their influences on soil transport mass, evaporation ratio, evaporation rate, surface strength, water retention ratio, and infiltration rate of soil treated by different dust suppressants. Field tests are conducted to explore the performance of this method in the natural environment. The results show that compared with other dust suppressants, the optimized soybean urease has the smallest evaporation rate, a moderate infiltration rate, the largest water retention ratio and surface strength. The indexes of soybean urease for dust suppressant are found to be better than traditional materials. In the natural environment, soybean urease has a stronger anti-disturbance ability. This study concludes that soybean urease dust suppressant has great application potential as a cheap and green method.Keywords
The dust has become a serious problem for human beings [1,2], which impacts climate, building integrity, and human health [3–5]. Dusting is a process where surface particles are suspended and drift under the disturbance of wind, during which the ground surface material is migrated and lost. The original ecological environment is destroyed, and the land could be degraded into the desert in the long run [6,7]. Dust particles may also contain toxic chemicals, and inhalation of these particles may cause chronic or acute diseases, such as bronchitis and lung cancer, which threaten human health [8]. Dust is also an important cause of poor atmospheric visibility and extreme weather. When the dusting is serious, buildings and landscaping could also be covered with dust, which affects the urban environment [9]. Large-scale dusting can also reduce road visibility and therefore results in more traffic accidents [10] (Fig. 1).
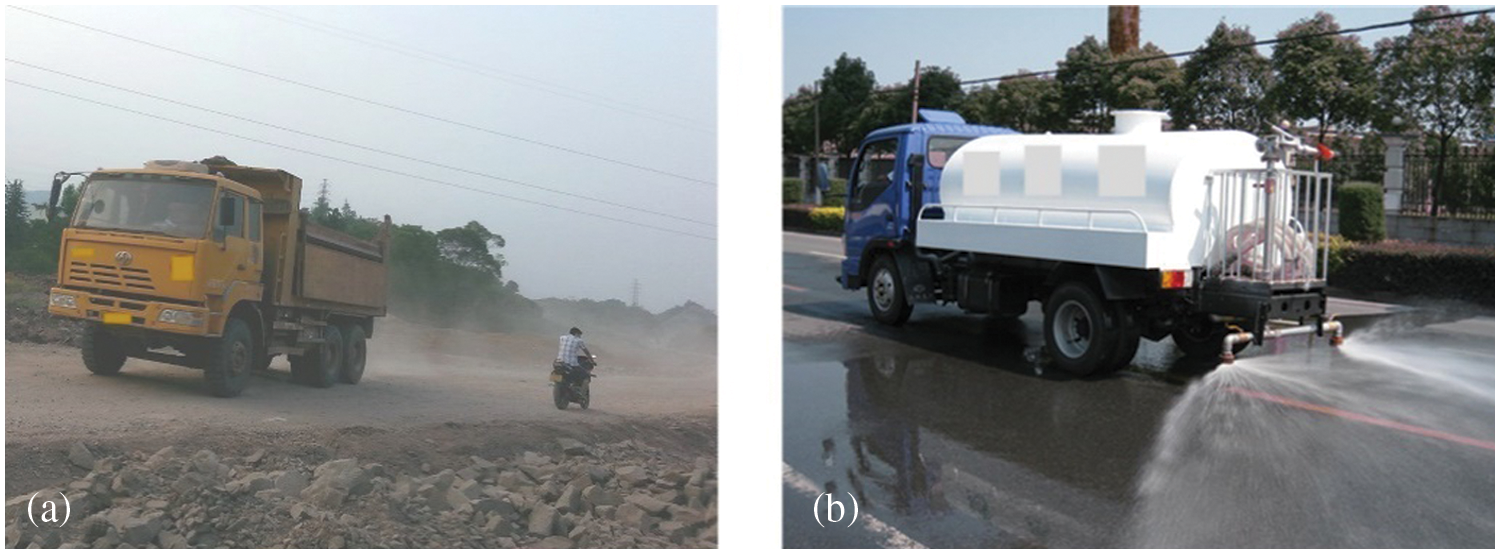
Figure 1: Dusting caused by traffic and urban sprinkling for dust suppression: (a) dust caused by traffic; (b) water sprinkling for dust suppression
Dust suppression methods can be categorized into physical, chemical, and biological methods [11–14]. In practice, physical methods are commonly expensive, whose effect decreases over time [15]. Chemical methods often only last for a short period, which could bring secondary pollution to the environment [16]. Biological methods are often involved with a lot of manpower and materials for growing plants, which may not be suitable for all areas due to environmental limitations [17–19]. Recently, the techniques of microbially induced carbonate precipitation (MICP) and enzyme-induced carbonate precipitation (EICP), using urea as the substrate, have been employed for soil solidification and dust control [20–22]. In the solidifying process using the MICP method, urea is hydrolyzed to generate carbonate ions under the action of urease produced by microbial metabolism and then combined with Ca2+ in the cementing solution to generate CaCO3 precipitation, which binds loose soil particles together and solidifies the surface to resist wind erosion [23,24]. By spraying microorganisms, the MICP method is effective and environmentally friendly [25]. On the other hand, urease for calcium carbonate precipitation not only can be produced by microorganisms but widely exists in living plants [26], which can also be extracted and mixed with cementing solutions to produce calcium carbonate precipitation. Application of plant urease is simple, direct, and environmentally friendly [27–29]. The EICP method has been applied in soil reinforcement, anti-seepage of rock and soil, and anti-erosion of civil engineering structures [19,30–32]. Overall, there is no essential difference between the MICP and EICP methods. Moreover, the induced carbonate precipitation technology was used for dust control and resolving desertification problems. Numerous laboratory tests and field tests have been conducted to explore the feasibility of applying this technique for dust suppression [22]. Potential influences of different factors on the dust suppression effect have been studied. Naeimi et al. [20] studied the effect of MICP technology on dust suppression through wind tunnel tests and found that the biological dust suppressant is more economical than the traditional methods [33]. Almajed et al. [19] treated a sand surface with MICP technology and studied the influences of bacterial concentration, ambient temperature, and humidity on the effectiveness of the dust suppression effect. Optimized calcium carbonate precipitation was obtained for dust suppression. It was found that this method can form a hard crust on the sand surface, which can be used to resist sand surface erosion [19].
In the meanwhile, many tests have also been conducted to study the feasibility of MICP technology for dust suppression. For example, Gomez et al. [34] conducted field tests to study the variation of soil surface strength with time and depth during the outdoor application of MICP technology. Li et al. [35] used an in-situ desert Staphylococcus, to carry out surface solidification treatment in the Ulan Buh Desert, Inner Mongolia, China, which confirmed the effectiveness of this technology in the desert environment. Zhan et al. [36] performed a large-scale outdoor test covering 900 m2. Under the enzymatic action of Bacillus glia, CO2 was absorbed, converted, and carbonate ions were produced, which were then mineralized with calcium ions existing in the environment to consolidate the surface soil. The testing results showed that the surface treatment using MICP technology has a remarkable dust suppression effect, which is both economical and environmentally friendly.
In this study, both laboratory tests and field tests are carried out to examine the behavior of soybean urease applying for dust suppressant. The effectiveness is evaluated by comparing soybean urease with three traditional dust suppressants. The microscopic mechanism is also studied. Testing results provide theoretical guidance for the application of soybean urease as a dust suppressant.
2.1.1 Preparation of Soybean Urease Solution and Cementing Solution
The preparation process and reaction mechanism of soybean urease dust suppressant is presented in Fig. 2. Firstly, the soybean is dried and ground into powder, which is dissolved into deionized water (the soybean meal concentration is the ratio of soybean meal mass to deionized water volume). Then, the soybean meal solution is placed in a blender to stir for 30 min, which is placed in a refrigerator afterward and held for 24 h at a temperature of 4°C. After standing, the solution is centrifuged for 15 min, and the supernatant is crude soybean urease solution. Subsequently, it is stored under 4°C before testing [22]. The soybean urease dust suppressant in this study consisted of cementing solution (a mixture of urea and calcium chloride solution [37]) and a urease solution [38].
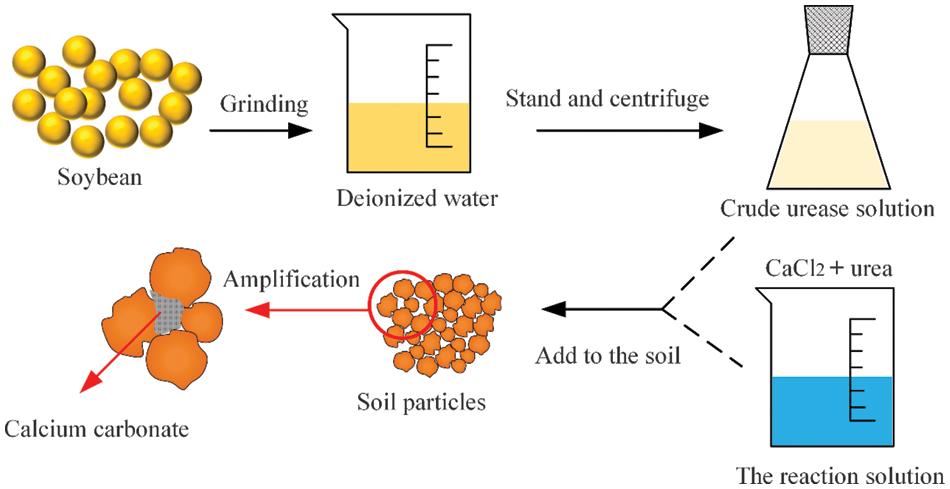
Figure 2: Preparation process and reaction mechanism of soybean urease dust suppressant
The test soil is silt obtained from the Yellow River alluvial area in the north of Kaifeng, Henan, China. The soil sample is grayish yellow, loose and dry, which is difficult to compact but easy to form dusting. The liquid limit, plastic limit, and plasticity indexes are 26.5, 16.8, and 9.7, respectively. The maximum dry density is 1.67 g/cm3, which is the maximum density at optimal moisture content. The optimal moisture content and the natural moisture content are 15.6% and 9.8%. The test method of these indexes is determined following ASTM D1557 [39]. Fig. 3 shows the grain gradation curve of the soil.
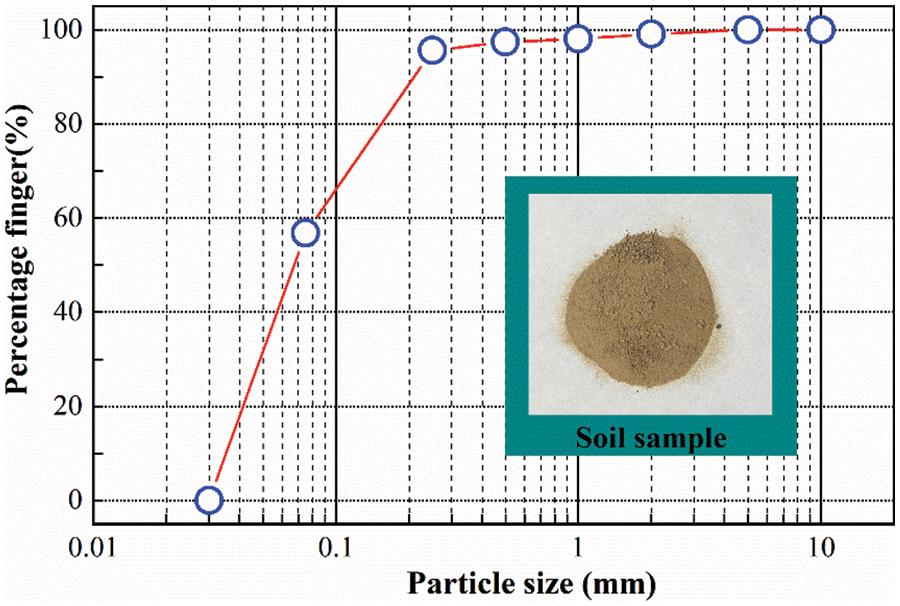
Figure 3: The soil sample and its grain gradation curve
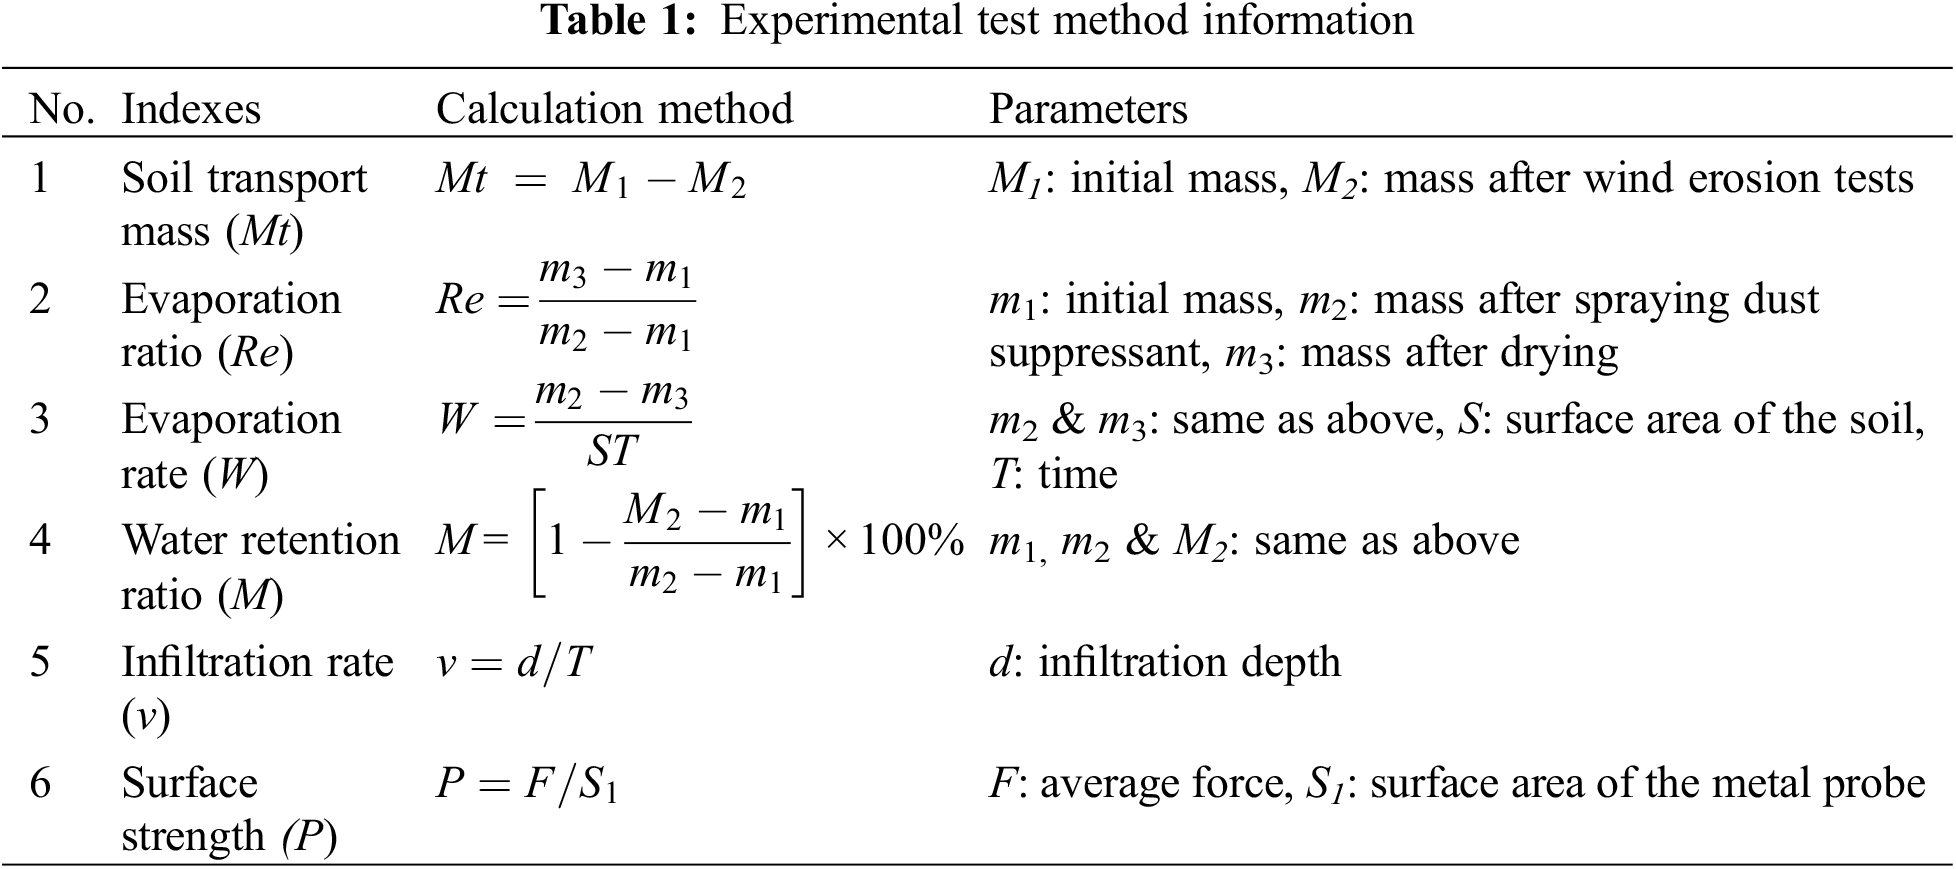
In this study, the soil transport mass and evaporation ratio of soil is measured first. The soil is treated with soybean urease dust suppressant with different soybean meal concentrations, cementing solution concentrations, and volume of solution per unit area. Then, the evaporation rate, water retention ratio, infiltration rate, and surface strength of the soil treated with soybean urease, TY (a commonly used dust suppressant made in China), YHC (another commonly used dust suppressant made in China), and pure water are compared. The experimental test method is summarized in Table 1. The surface strength and settlement of soil treated with different dust suppressants are measured in field tests. X-ray diffraction (XRD) and scanning electron microscopy (SEM) experiments are carried out to examine the microscopic mechanism.
2.2.1 Test Soil Optimization of Soybean Urease Dust Suppressant
The soil transport mass (Mt) is calculated using the formula (1) in Table 1. Soil transport mass is obtained by measuring the initial mass and the mass of soil after wind erosion tests [18]. The soil samples are subjected to a wind speed of 14 m/s lasting 10 min. The soil sample (2700 g) is dried and stored, and then full filled in a rectangular container (L × B × H = 25 cm × 18.7 cm × 6 cm). The prepared soybean urease dust suppressant is uniformly sprayed on the surface of the soil sample in the container. After curing for 3 days, the sample is dried at 60°C, and the mas (M2) is measured. The evaporation ratio (Re) is calculated using the formula (2) in Table 1. The sprayed amount of each sample is 5.051 L/m2 in this group of cases.
2.2.2 Effectiveness of Different Dust Suppressants
Soybean urease dust suppressant with the optimal ratio is employed for the soil sample, and TY dust suppressant, YHC dust suppressant, and water are set for comparison. The optimal ratio of TY of 4% and the optimal dilution ratio of 1:100 are conducted. Pure water is commonly used as one dust suppression method, which is also tested for comparison [40]. The evaporation rate (W) is calculated using formula (3) in Table 1. It represents the evaporation of soil samples per unit of time and area. The water retention ratio (M) can be calculated by formula (4) in Table 1. The infiltration rate (
Based on the laboratory testing results, the soybean urease dust suppressant with the optimized ratio is used in field tests to further assess its effectiveness. The other three dust suppressants are used for comparison.
The test site is located at the Henan University of China without the influence of traffic and human activities. The soil sample is paved and dried and then screened by the sieve with a 2 mm mesh size and filled into 200 cm × 300 cm × 28 cm clay pavers. The sample is naturally settled for 16 days, and the average measured height is 16.1 cm, which is divided into six 100 cm × 100 cm areas (S1∼S6). The test site is laid out first, and the surface of the sample is then sprayed after 16 days of natural settlement. S1 is sprayed on the first, second, and third days with soybean urease dust suppressant, while S2 is sprayed on the second and third days with soybean urease dust suppressant. S3, S4, S5, and S6 are treated with TY, soybean urease, YHC, and pure water on the third day, respectively. The surface strength is also measured by the pull and push dynamometer.
The field tests last for 30 days after spraying the suppressants. Each test area is covered with a steel plate during the spraying process to prevent other test areas from being affected. After spraying the dust suppressant, a steel ruler is inserted into each piece of testing soil; the initial height and the height at the end of the experiment are recorded to measure the settlement of soil in the field.
The topsoil samples treated with soybean urease dust suppressant are ground and crushed and screened by a 0.2 mm sieve. Then, an X-ray test is performed using an X-ray diffraction analyzer [19]. In this experiment, the case with raw soil was used as a comparison case. Scanning electron microscopy (SEM) analysis is also carried out on the surface hard crust of the dry soil samples. Before scanning, the sample is made flat and the loose soil particles are blown away by ear-washing balls. It is then glued to a conductive paper and sprayed with gold for scanning with a magnification of 2000 times. The soil treated with pure water and soybean urease dust suppressants is also examined in the XRD and SEM tests.
Laboratory and field-testing results are presented in this section. The effects of the cementing solution concentration, soybean meal concentration, and volume of solution per unit area on the soil transport mass and surface strength of the soil after treatment are presented. The dust suppression indexes of the soil after treatment with soybean urease dust suppressant and the reference suppressants are also compared and analyzed. The microscopic mechanism of the soil treated with the suppressant is analyzed.
The controlled analysis is firstly conducted by varying the cementing solution concentration, soybean meal concentration, and volume of solution per unit area individually to examine their effects on the soil transport mass and surface strength of the soil after treatment. Previous studies show that the soil transport mass is inversely proportional to CaCO3 content, while soil surface strength is directly proportional to CaCO3 content [20]. Fig. 4 shows the effect of key factors on soil transport mass, surface strength, and CaCO3 content. The default testing parameters are as follows: the cementing solution concentration of 0.08 M, soybean meal concentration of 40 g/L, and volume of solution per unit area of 4 L/m2. To examine their influences, the cementing solution concentration varies 0.01, 0.03, 0.05, 0.06, 0.07, 0.08, 0.1, and 0.12 M, the mass concentration of soybean meal 10, 20, 25, 33, 40, 50, 67, 100, and 200 g/L, and the volume of solution per unit area 1, 2, 3, 4, 5, and 6 L/m2, respectively.
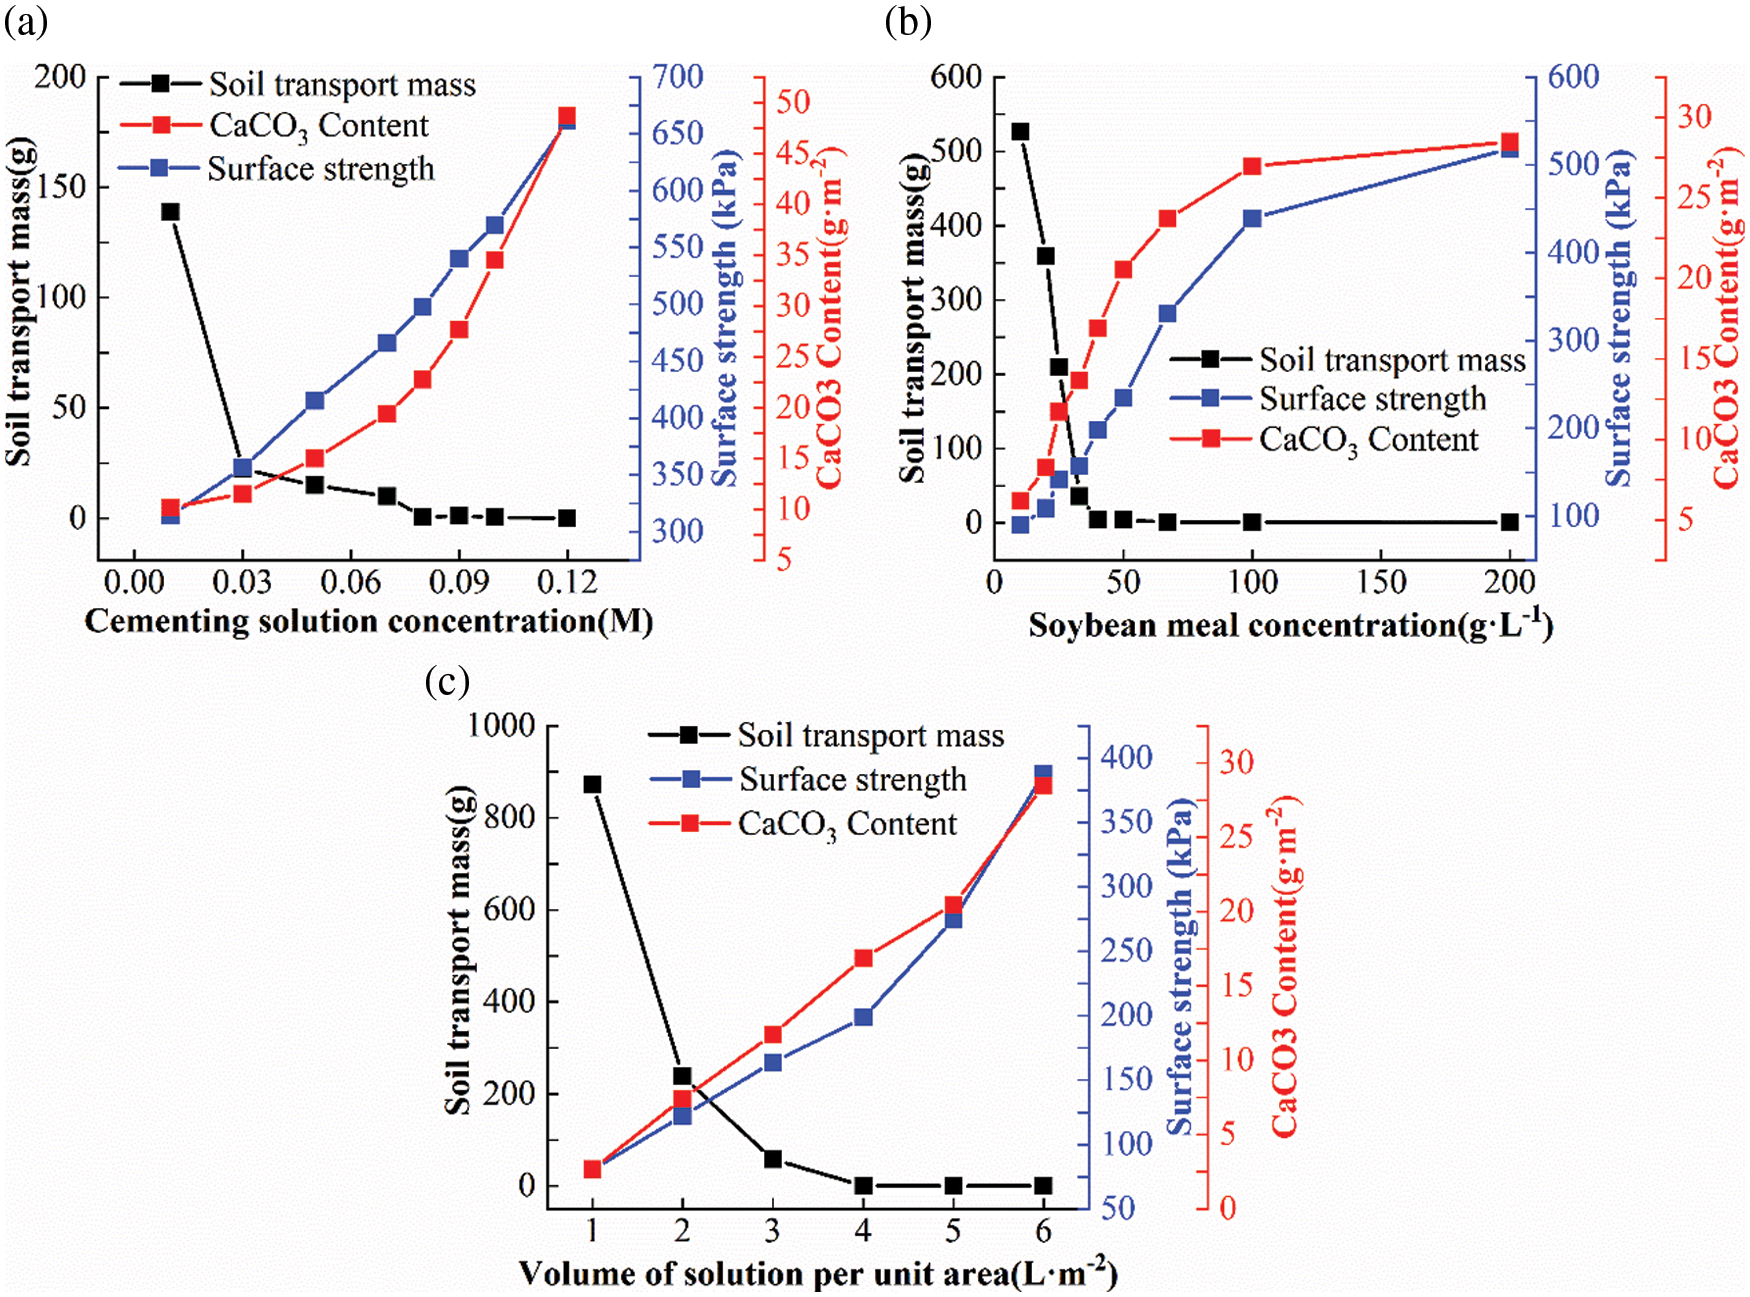
Figure 4: Effect of key factors on soil transport mass (g), surface strength, and CaCO3 content: (a) cementing solution concentration; (b) soybean meal concentration; (c) volume of solution per unit area
Fig. 4a shows the effect of cementing solution concentration on soil transport mass, surface strength, and CaCO3 content. When the cementing solution concentration is 0.01 M, the soil transport mass is 41.38 g, and the soil transport ratio (soil transport mass takes a percentage of total mass) decreases from 70.35% to 1.5% compared with plain soil. In the process of increasing the cementing solution concentration to 0.05 M, the soil transport mass of the soil continues to decrease. When the cementing solution concentration reaches 0.05 M, the soil transport mass becomes 1.1 g, indicating that soil erosion is effectively controlled. Notably, when the cementing solution concentration reaches 0.08 M, the soil loss reduces to nearly 0. With the increase of cementing solution concentration, the surface strength of soil samples and the content of CaCO3 formation increase. When the cementing solution concentration increases to 0.1 M, the surface strength of the soil increases by nearly 300 kPa as compared with plain soil. The cementing solution is the material source of calcium carbonate [19,20,42]. Therefore, as the cementing solution concentration increases, the content of calcium carbonate on the soil surface would also increases. With the increase of calcium carbonate content, the surface cementing effect and surface strength increase, which further decreases wind erosion.
Fig. 4b shows the effect of soybean meal concentration on soil transport mass, surface strength, and CaCO3 content. When the mass concentration of soybean meal is 10 g/L, the soil transport mass is over 500 g. But when the concentration reaches 40 g/L, the soil loss decreases to almost 0. The CaCO3 content increases but the growth rate decreases when the soybean meal concentration increases. Moreover, the soil surface strength increases with the increase in soybean meal concentration. When the soybean meal concentration is 10 g/L, the surface strength of the sample is found to be 89.776 kPa. The surface strength and CaCO3 contents are 330.523 kPa and 23.675 g/m2, respectively, where the soybean meal concentration increases to 67 g/L. The increase of soybean meal concentration is therefore found to be able to increase the urease concentration. With the increase of soybean meal, the calcium source in the cementing solution becomes insufficient, where the formation of calcium carbonate is also close to its peak. Thus, the increase rate of soil surface strength gradually decreases.
Fig. 4c shows the effect of the volume of solution per unit area on soil transport mass, surface strength, and CaCO3 content. As shown, when 1 L/m2 is sprayed, a soil transport mass of 872.95 g is measured. Soil transport mass decreases gradually with the increase of solution volume. When the volume of solution per unit area reaches 4 L/m2, the wind erosion is eliminated. With the increase in the volume of solution per unit area, the surface strength and calcium carbonate formation increase almost linearly. The more solution used, the more calcium carbonate would be formed on the soil surface. Hence the increase in the volume of solution per unit area would lead to the continuous increase of soil surface strength. A similar observation was reported by Xiao et al. [43] on sandy soil, which verified that calcium carbonate could improve the strength of quartz sand columns through the solidifying experiment using EICP technology.
3.2 Influence of Multivariable
3.2.1 Level Design and Results
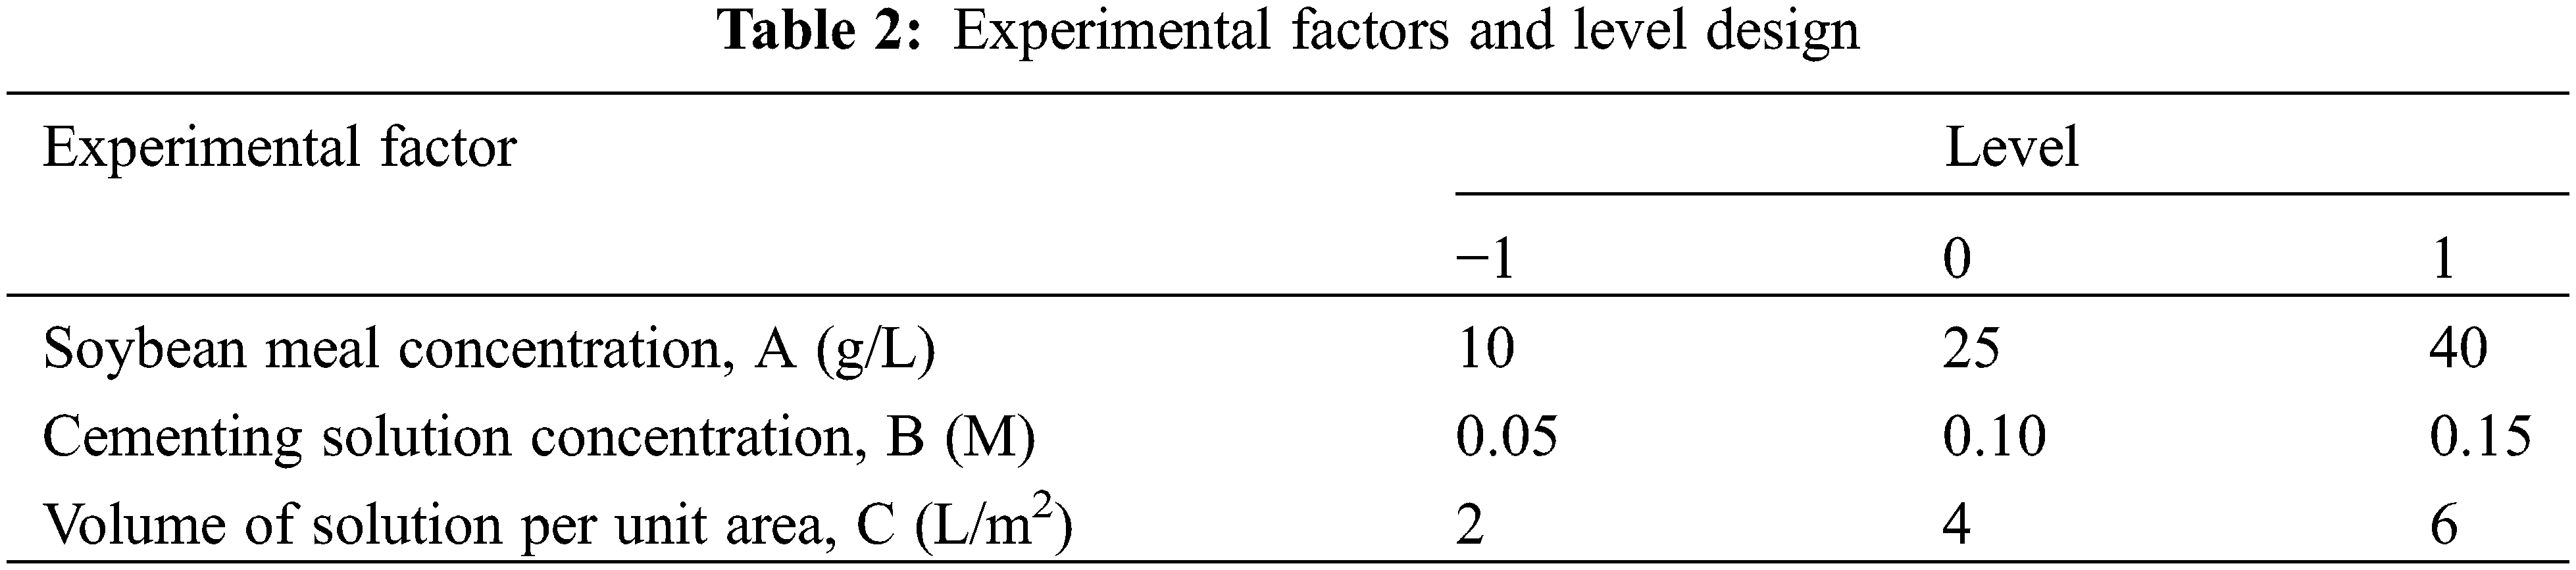
Following the Box-Behnken sampling principle, three factors that would potentially influence the soil transport mass and evaporation rate are selected for analysis, namely (A) soybean meal concentration, (B) cementing solution concentration, and (C) volume of solution per unit area. Similar parameters were studied by other researchers [22]. Multi-objective response surface analysis tests are carried out. The response surface test factor levels and results are shown in Tables 2 and 3.
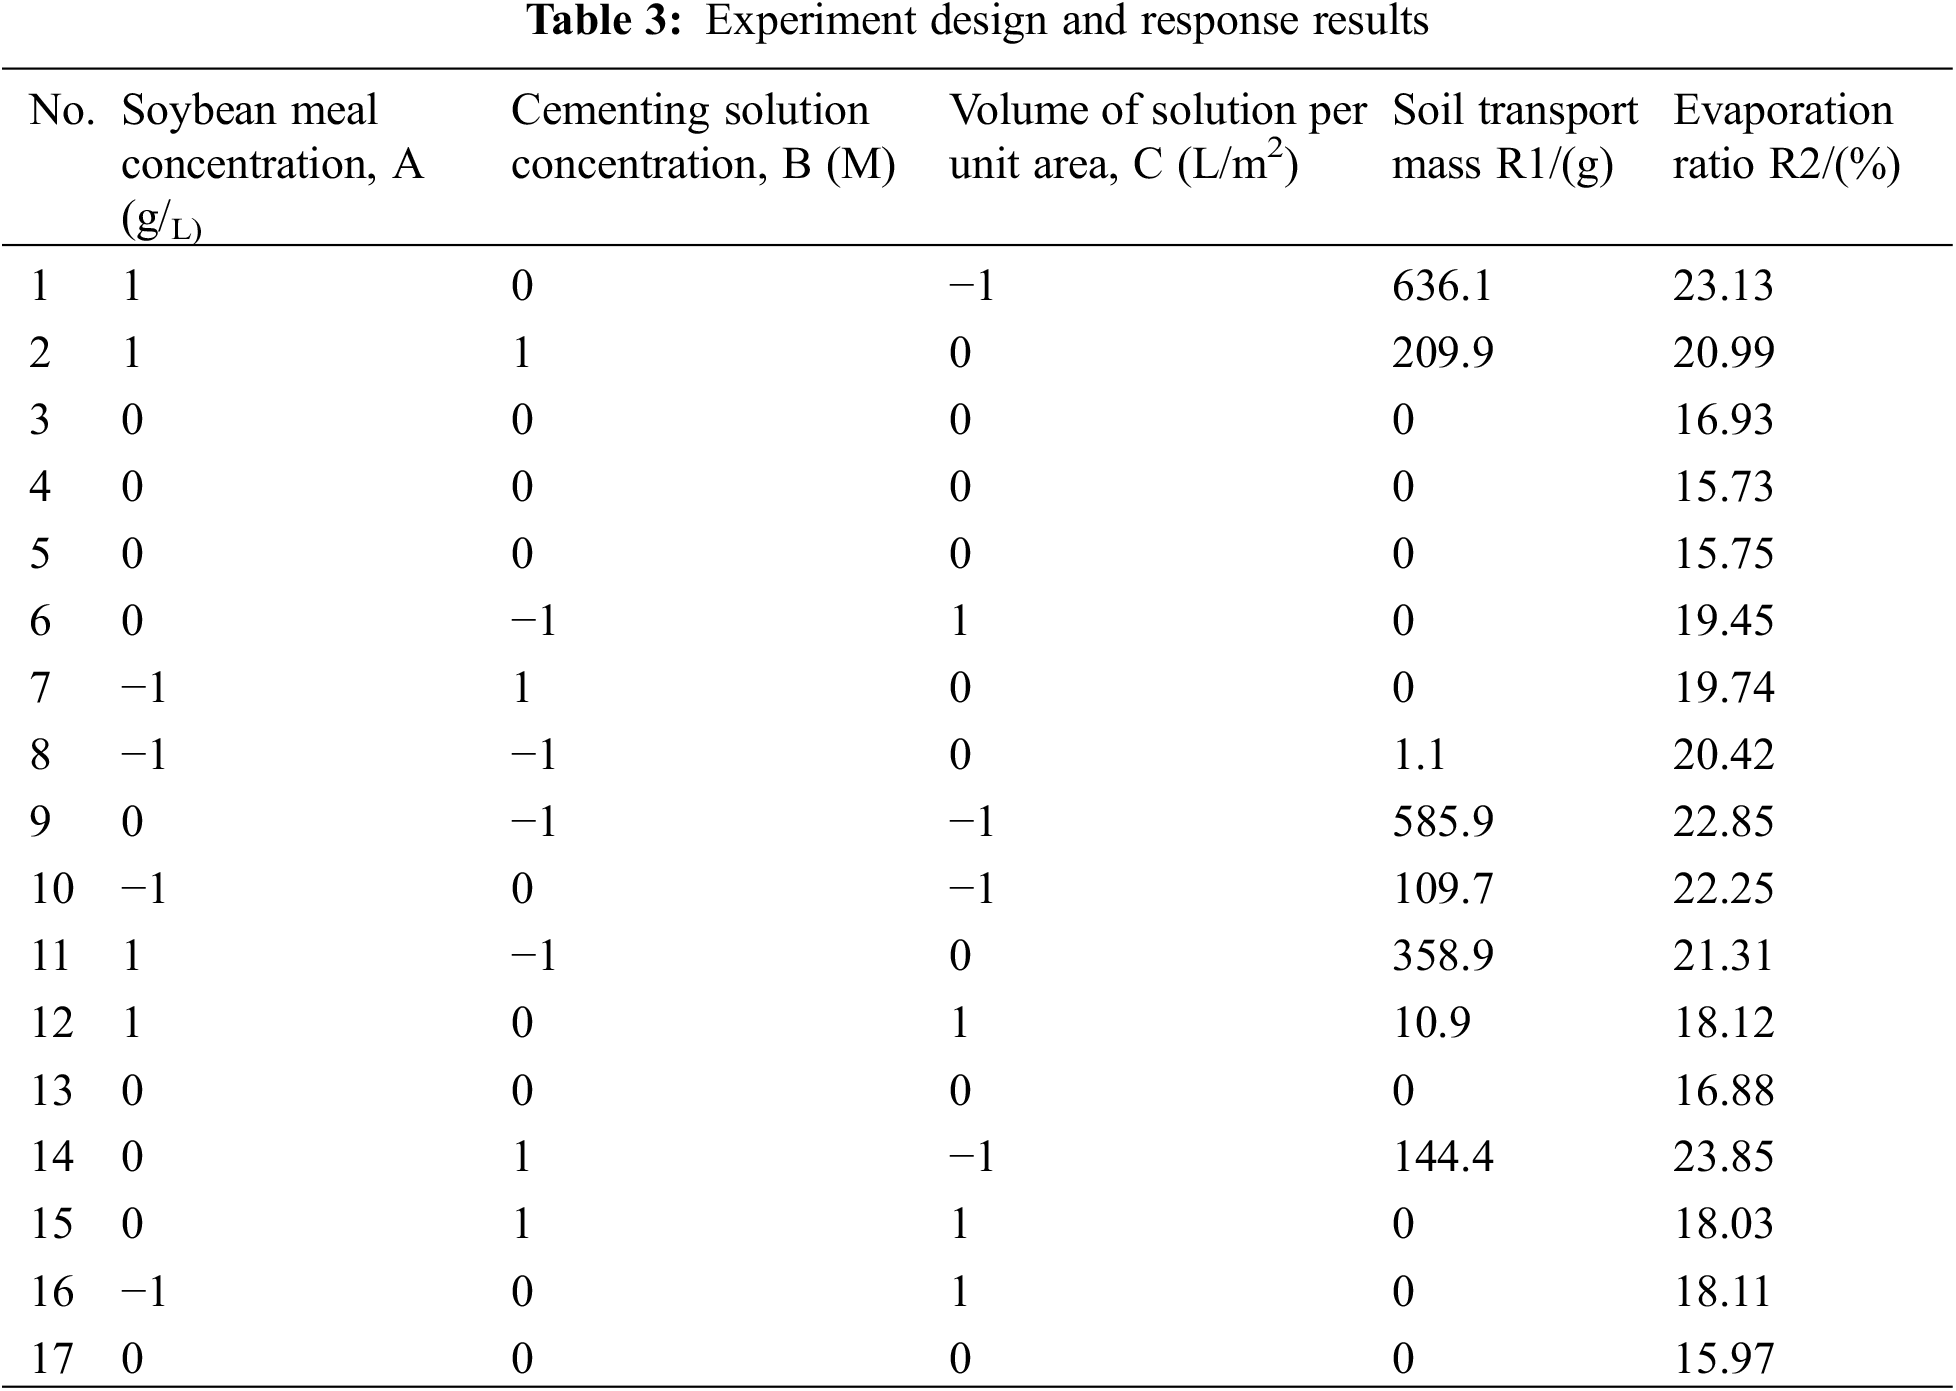
Numerical analysis is performed to statistically analyze the experimental data, and the coding value of the quadratic multinomial regression equation is obtained using Eqs. (1) and (2). The coefficient of determination R2 of the models is 0.9848 and 0.9881, respectively.
Soil transport mass:
Evaporation ratio:
The results of ANOVA (analysis of variance) are shown in Tables 4 and 5. F value can be used to test the significance of the influence of each variable on the response value. The larger F is, the higher the significance of the corresponding variable. When the model significance test is p < 0.05, it indicates that the model is statistically significant. As can be seen from Table 4, the order of influence of process conditions on soil transport mass is C > A > B. Soil transport mass analysis R2adj = 0.9652, which means that 96.52% of the experimental response value is close to the predicted correlation coefficient R2. This shows that the experimental model fits the real data well and has practical guiding significance. Similarly, according to Table 5, the order of influence of process conditions on evaporation ratio is as follows: C > A > B, R2 = 0.9881, R2Adj = 0.9728, Pred R2 = 0.8792, which indicates the model has high accuracy. Therefore, the model can be used to analyze and predict the optimal extraction process for wind erosion resistance and evaporation rate.


3.2.2 Response Surface Analysis
Fig. 5 shows the influences of soybean meal concentration (Cs), cementing solution concentration (Cc), and volume of solution per unit area (Vs) on the soil transport mass (Mt) and evaporation ratio (Re). It can be seen that the interaction of soybean meal concentration and cementing solution concentration has an oblique surface distribution on the soil transport mass. For a certain soybean meal concentration, the soil transport mass increases with the increase of cementing solution concentration. For a controlled cementing solution concentration, the soil transport mass increases with the increase of soybean meal concentration. To obtain a low soil transport mass, it can be found from the interaction level area that soybean meal concentration lower than 21 g/L and cementing solution concentration higher than 0.10 M is an optimized mixture. The interaction surface of soybean meal concentration and cementing solution concentration presents a downward opening paraboloid, as shown in Fig. 5b. The evaporation ratio firstly decreases and then increases with the rise of cementing solution concentration and soybean meal concentration. Therefore, the central level combination of these two factors appears to be beneficial in reducing the evaporation ratio. Thus, the soybean meal concentration and cementing solution concentration of 26 g/L and 0.10 M are chosen.
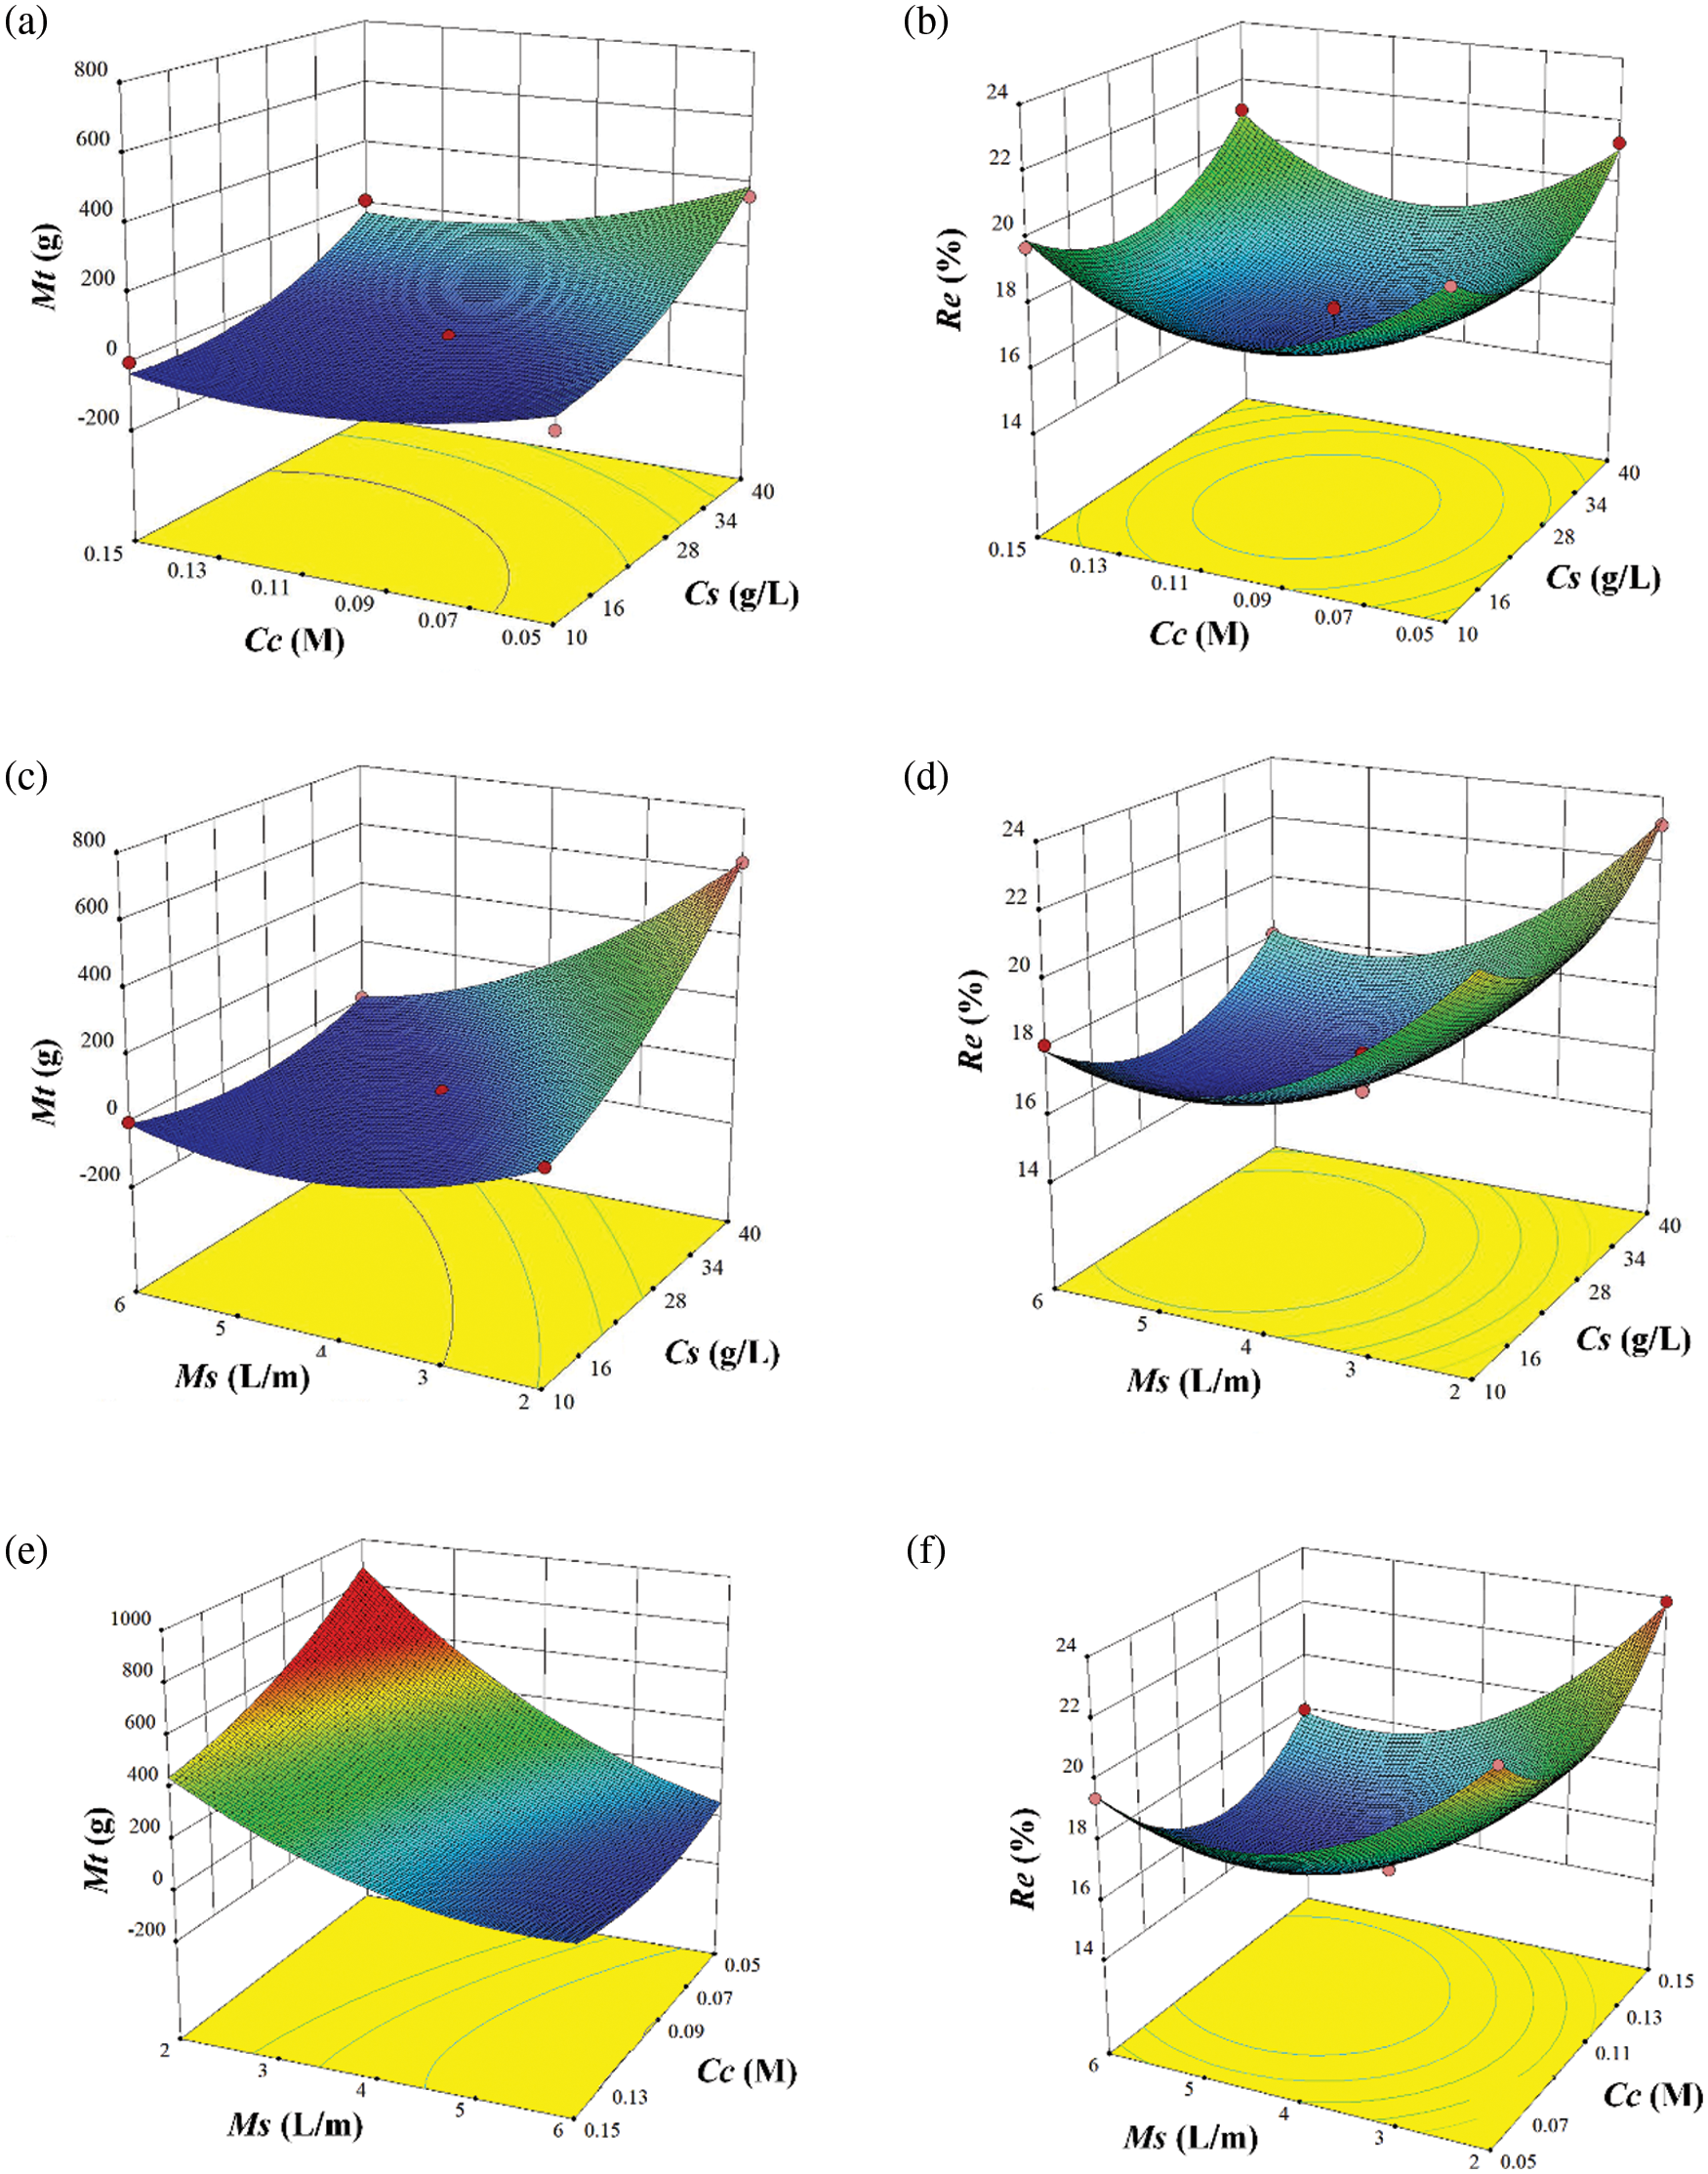
Figure 5: Effects of cementing solution concentration (Cc) and soybean meal concentration (Cs) on (a) soil transport mass (Mt) and (b) evaporation ratio (Re); Effects of cementing solution concentration (Cc) and volume of solution per unit area (Vs) on (c) soil transport mass (Mt) and (d) evaporation ratio (Re); Effects of soybean meal concentration (Cs) and volume of solution per unit area (Vs) on (e) soil transport mass (Mt) and (f) evaporation ratio (Re)
As shown in Fig. 5c, the variations in soybean meal concentration and volume of solution per unit area could influence the soil transport mass. The longitudinal fluctuation range of the surface is larger, which indicates that the solution volume has a greater contribution to the soil transport mass level. When the solution volume is 4–6 L/m2, the soil transport mass is the lowest. Therefore, in practical application, it is most beneficial to comply with this condition. The influence trend of the interaction of the soybean meal concentration and volume of solution per unit area on the evaporation ratio presents an arched surface, as shown in Fig. 5d. With the increase of the soybean meal concentration and solution volume, the evaporation ratio increases to a peak value and then decreases. The surface fluctuation range caused by solution volume is larger. When the soybean meal concentration and volume of solution per unit area are 23–27 g/L and 4.5–5.5 L/m2, respectively, the evaporation ratio achieves the minimum value.
In Fig. 5e, the interaction surface is inclined, while solution volume induces a greater variation on soil transport mass, indicating its large contribution. In practical application, more attention should be paid. The optimal solution volume is 4–6 L/m2. The longitudinal span of the interaction surface between the cementing solution concentration and volume of solution per unit area is large, as shown in Fig. 5f. It indicates that the interaction of the two factors has a significant effect on the evaporation ratio. It can be seen that the evaporation ratio firstly decreases and then increases with the rise of cementing solution concentration and solution volume. There is a kink on the surface when the cementing solution concentration of 0.10 M and volume of solution per unit area of 5.0 L/m2.
To further determine the optimal parameters for achieving the minimum soil transport mass and evaporation ratio, numerical analysis is carried out using commercial software Design-Expert. According to the results, the optimal soybean meal concentration, cementing solution concentration, and volume of solution per unit area are 21.068 g/L, 0.106 M, and 5.051 L/m2, respectively. In this case, soil transport mass is 0, and the evaporation ratio is 15.71%.
3.3 Effectiveness of Different Dust Suppressants
The laboratory wind tunnel test is conducted to evaluate the performance of soybean urease for dust suppression. The evaporation rate, water retention ratio, infiltration rate, and surface strength of the soil treated with soybean urease dust suppressant and other three dust suppressants are tested and compared.
Fig. 6a compares the evaporation rate of the four dust suppressants. From low to high ranks soybean urease dust suppressant (S) (12.73 g⋅m−2⋅s−1), TY (14.32–16.52 g⋅m−2⋅s−1), YHC (14.32–16.52 g⋅m−2⋅s−1), and water (W) (20.84 g⋅m−2⋅s−1). A higher evaporation rate leads to faster water loss at high temperatures and a shorter water retention time [44]. After water evaporates, those dry and loose soil particles are prone to wind erosion. Therefore, the lower the evaporation rate of a dust suppressant, the longer the effective time it can achieve. Among the four dust suppressants, soybean urease dust suppressant has the best evaporation resistance and the longest effective time for dust suppression, while the evaporation resistance of water is the worst with the shortest effective time. Additionally, soybean urease dust suppressant has good high-temperature resistance and maintains soil moisture for a long time at high temperatures in summer.
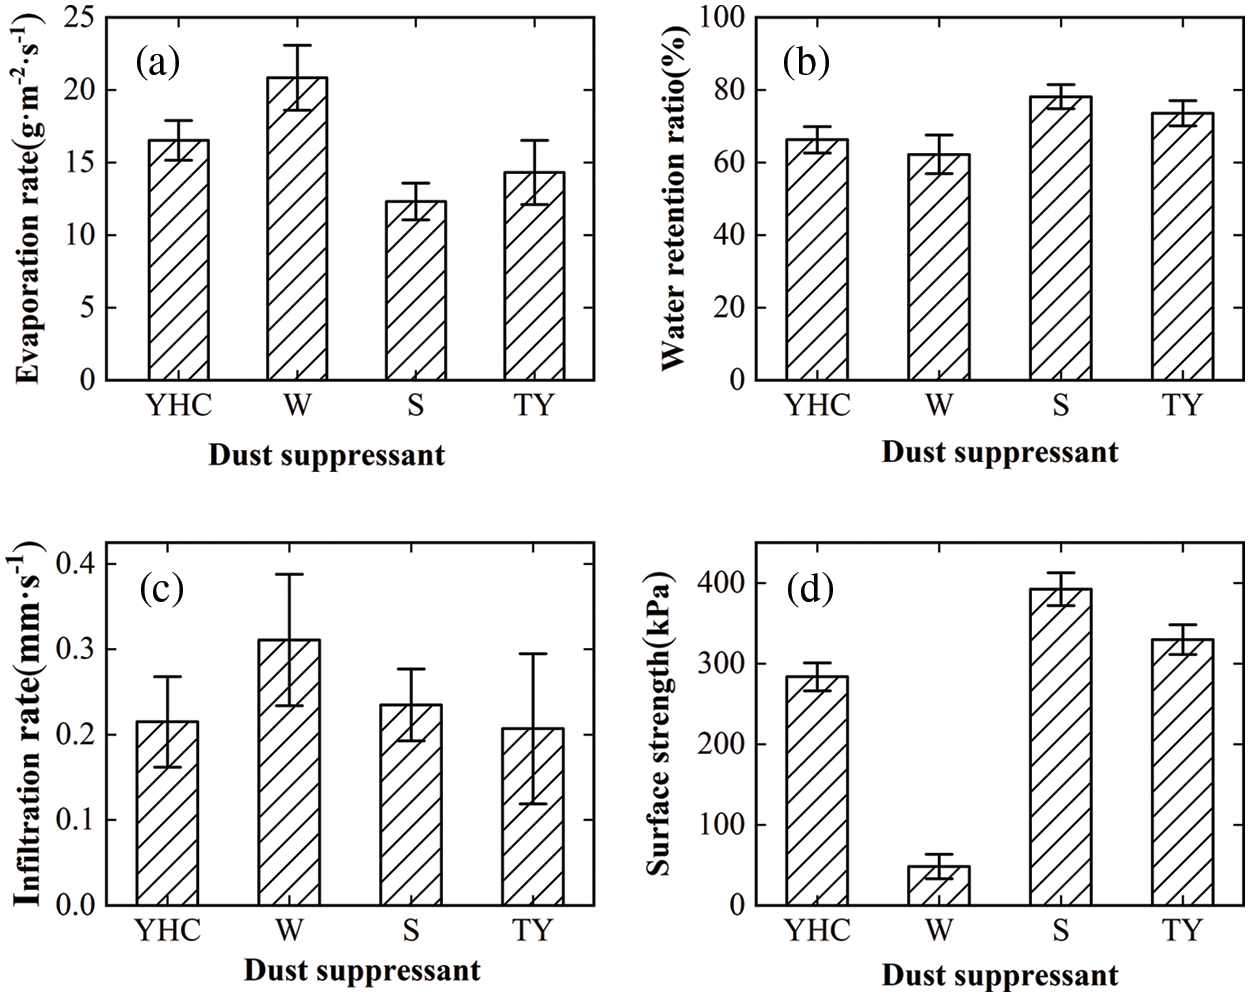
Figure 6: Effects of the four dust suppressants on the four kinds of evaluation indexes of the soil: (a) evaporation rate; (b) water retention ratio; (c) infiltration rate; (d) surface strength
Fig. 6b shows the water retention ratio of the four dust suppressants after being exposed to the wind at 14 m/s. The soil treated with soybean urease dust suppressant has the highest water retention ratio of 78.12%, which is followed by TY, YHC, and water. The greater the water retention ratio is, the stronger the water retention ability of the soil under strong winds after the dust suppressant is sprayed. Compared with the other three dust suppressants, soybean urease dust suppressant has the best water retention performance, and consequently, the least water evaporation and longest effective time are expected in windy conditions.
The infiltration rate of the four dust suppressants is shown in Fig. 6c. The infiltration rate of pure water is found to be the highest, which could quickly wet the dust surface. But its dosage is also greater than the other dust suppressants. For YHC and TY, their infiltration rates are very low and thus require a long time to wet the soil effectively. Moreover, the thickness of the hardened soil crusts is relatively thin, which therefore is more fragile. In comparison, the soybean urease dust suppressant shows a balanced infiltration rate.
The surface strength of the hardened soil crust treated with the four dust suppressants is shown in Fig. 6d. The surface strength of the soil treated with soybean urease dust suppressant is the largest (392.15 kPa). Compared with the soil treated with pure water, the surface strength increases by 340 kPa. The soil surface treated with pure water returns to the granular form after drying. The strength of the soil treated with pure water is low and close to the surface strength of the untreated soil through the dynamometer test. The soil treated with soybean urease dust suppressant forms a hard crust on the surface after the water evaporates. Due to the low cementing solution concentration, the calcium carbonate generated is scarce and only exists in the upper layer, so its strength is secondary. However, TY and YHC merely cement loose soil particles, and the surface strengths of the soil after water evaporation are not high.
Through the comparison, it can be seen that the soybean urease dust suppressant is superior to the other three dust suppressants. A large amount of calcium carbonate precipitates can be formed in the pores of soil after treatment with soybean urease dust suppressant. It fills the pores between the soil particles and cements them together, which effectively prevents the evaporation and loss of pore water inside the soil. It also reduces the infiltration rate of the soil to a certain extent. At the same time, the filling and cementation of calcium carbonate crystals also greatly enhance soil surface strength.
3.4 Field Testing Results and Analysis
To study the effects of different reinforcement schemes on the soil surface strength, the following six groups of field tests are performed. Fig. 7 shows the variation of soil surface strength in 30 days after spraying different dust suppressants. As can be seen, the surface strength in groups S1–S5 continues to increase within 0–5 days. The surface strength reaches its peak on the 5th day. Among them, the strength of group S1 treated with soybean urease dust suppressant reaches about 894 kPa on the 5th day, and that of group S2 treated with soybean urease dust suppressant reaches 623 kPa. The strengths of group S3, S4, and S5 areas treated with TY, soybean urease, and YHC dust suppressant only reached 355, 393, and 308 kPa on the 5th day, respectively. However, the surface strength of group S6 treated with water reaches a peak of 108 kPa after the 1st day. In comparison, the soil surface strength treated with soybean urease dust suppressant is 786 kPa reflecting an increase of 726%. The surface strength of the soil treated with soybean urease dust suppressant is also higher than that of soil treated with the other three dust suppressants, i.e., 38 kPa higher than that of TY, which has the best effect among the tested dust suppressants.
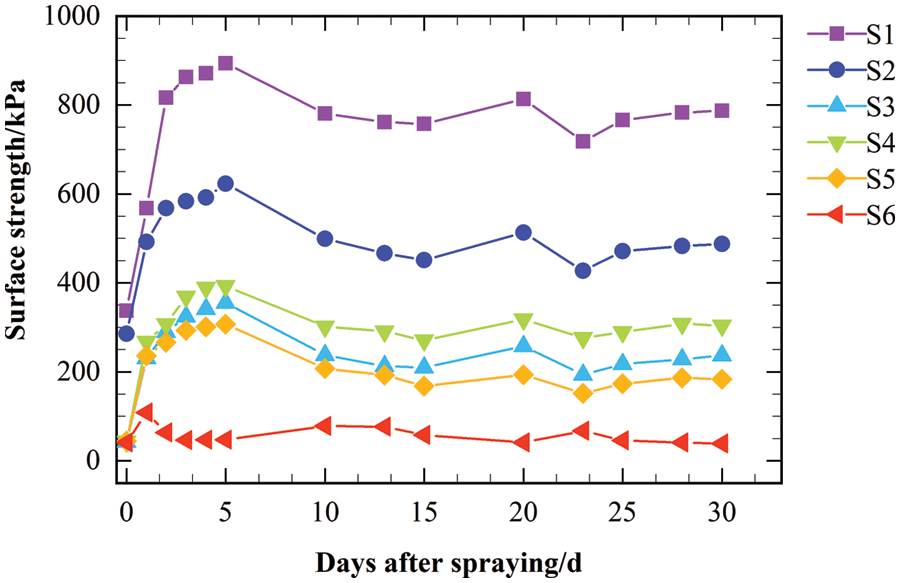
Figure 7: The variations of surface strength with time
After 5 days of sun exposure, the surface moisture evaporates, and the strength continues to decrease. After rainfall, the surface strength of group S6 increases again, which turns out to be similar to the effect of the initial water spraying treatment. The relationship curves of areas treated using other dust suppressants after rainfall and sun exposure are similar. In other words, the surface strength decreases after rainfall and increases after sun exposure, but they both could not return to the peak strengths as found on Day 5. The regional surface strength decreases in the order of S1 > S2 > S4 > S3 > S5 > S6. The surface strength of the soil treated with soybean urease dust suppressant is greater than the others, which increases with treatment times. The surface strength of the soil treated three times using soybean urease dust suppressant increases by 501 kPa as compared with that treated once only. Studies exist on the improvement of soil strength by enzyme-induced calcium carbonate precipitation. Carmona et al. [45] applied the EICP method to solidify poorly graded inorganic soil mainly composed of sand particles. Their results also showed that the formation of calcium carbonate and the unconfined compressive strength in the soil increased with the increase of curing time, urease concentration, and cementing solution concentration within a certain range. This is consistent with the results of this study.
The microscopic mechanism of the soil surface is also examined to explain the above observation and results. Firstly, XRD analysis is carried out to explore the formation of substances. Figs. 8a and 8b display the XRD patterns and the corresponding substance content of the raw soil and the soil treated by soybean urease dust suppressant, respectively. For non-treated soil, there is no crystalline form of calcium carbonate present. However, the formation of calcium carbonate on the soil surface is confirmed by the X-ray diffractometer after spraying 4 L/m2 soybean urease dust suppressant with 0.08 M cementing solution concentration and 40 g/L mass concentration of soybean meal. Calcite is dominant in the generated minerals.
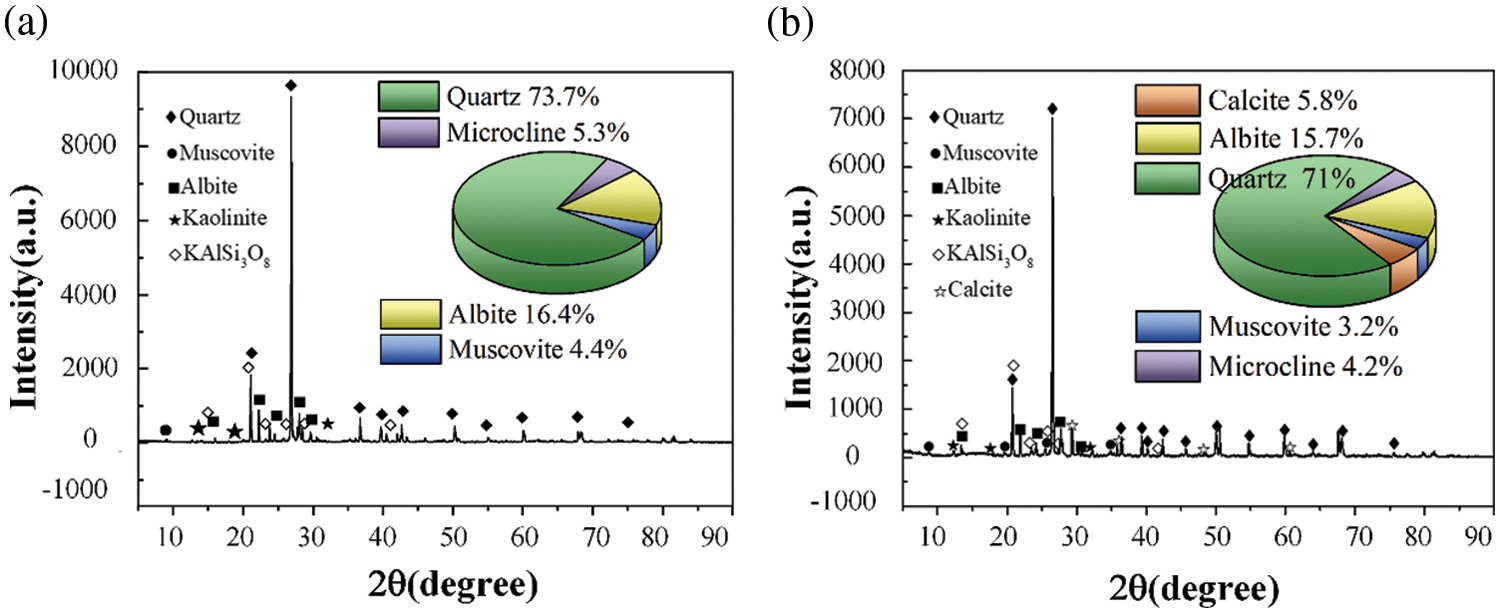
Figure 8: The XRD pattern and the corresponding substance content: (a) raw soil; (b) soil treated by soybean urease dust suppressant
According to the XRD analysis results, 5.8% of CaCO3 is found in the soil sample. The small particles in the soil can be cemented into larger particles by CaCO3 [24]. Calcium carbonate crystal types generally include calcite and vaterite [13,36]. Among them, vaterite is the crystal with the stronger cementation, while its physical and chemical properties are unstable. Studies have shown that vaterite may be converted to calcite when the ambient temperature is higher than 60°C [19,22]. This process is accompanied by a change in the properties of calcium carbonate [46]. However, calcite can maintain strong cementation and have more stable physical and chemical properties [28,31,45].
To further explore the microscopic mechanism of the soil surface, SEM analysis is conducted to observe the soil’s internal microscopic changes. Fig. 9a shows the sample treated using pure water. The magnification is 2000 times. Fig. 9b shows the SEM images of the treated soil samples with the optimal ratio of soybean urease dust suppressant. Through comparison, it can be seen that the pores of the surface soil treated with soybean urease dust suppressant are reduced, and the soil particles are compacted. In the microscopic test, a large amount of CaCO3 is formed in the soil particles, which fills the space between the soil particles and thus improves the soil properties. This is the possible reason why the surface settlement amount using soybean urease dust suppressant is less than that of other dust suppressants. Moreover, the formed CaCO3 in the soil could bond soil particles together, which connects the soil surface tightly and improves the wind erosion resistance. Furthermore, due to the reduction of soil pores, it is difficult for the water in the soil to evaporate but be preserved, which further improves the water retention performance.
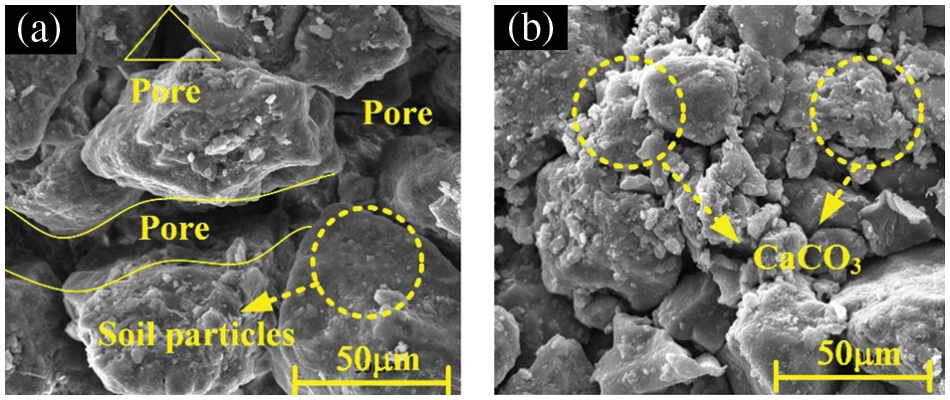
Figure 9: The SEM images of the soil treated with pure water and soybean urease dust suppressant: (a) case of pure water; (b) case of soybean urease dust suppressant
The influence of soybean urease dust suppressant on soil settlement is the key to evaluating the effect of soybean urease dust suppressant on the environment [30]. According to the data recorded in each area before and after the test, the soil settlement in different spraying areas can be determined, and the surface appearance images are recorded, as shown in Fig. 10. After 30 days, the settlement decreases in the order of S6 > S3 = S5 > S1 > S4 > S2. The settlements of the three areas treated with soybean urease dust suppressant are all lower than 2 mm. The area treated after spraying soybean urease dust suppressant twice has the smallest settlement of 1 mm. The settlements of the three areas treated with soybean urease dust suppressant are all smaller than that treated with other dust suppressants. The settlement of the area treated with pure water is more than 4 mm. The formation of a new substance (calcium carbonate crystal) in the pores of soil during the treatment with soybean urease dust suppressant can be observed. Calcium carbonate crystals fill the pores of the soil. Thus, the settlement of the soil treated with soybean urease dust suppressant is generally smaller than that treated with other dust suppressants. The amount of calcium carbonate generated in the soil pores increases with the rise of the spraying time of soybean urease dust suppressant. Hence the settlement of soil treated twice is less than that treated once. However, when the soil is treated more than twice, small particles in the surface soil pores would be washed away by the excess solution as the treatment time increases. This effect is similar to that when treated with water. Therefore, the settlement of the soil treated three or more times increases.
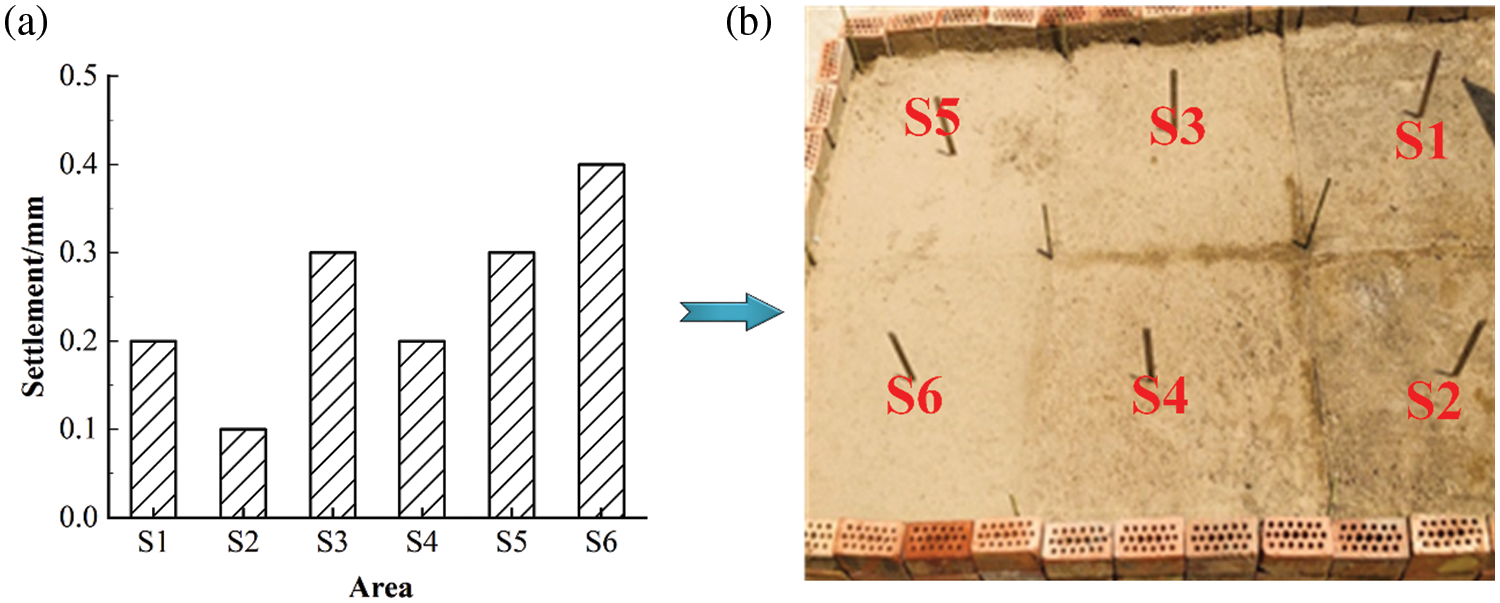
Figure 10: Settlement and surface appearance images of six areas: (a) settlement; (b) surface appearance images
As shown in Fig. 10b, the soil surfaces of the six areas are all close to dry, and there are still obviously hardened crusts on the surface of the three areas sprayed using soybean urease dust suppressant. After 9 times of rainfall within 30 days, these three areas still maintain good integrity. According to the surface appearance color, S1 is superior to S2 and S4, indicating that the area treated with soybean urease dust suppressant three times has the best performance. There is little difference in the surface appearance morphology of S3, S5, and S6. In the S5 area treated with YHC and the S3 treated with TY, their dust suppression effects are weakened. The S6 has a slightly powdered surface after evaporation. Although the color of S5 is similar to that of S6, there is a thin but hardened crust on the surface protecting it from dust. The dust suppression of pure water mainly depends on the matric suction of capillary water to soil particles. When the water evaporates, the pore water decreases gradually, and the dust suppression effect also decreases correspondingly. The fundamental mechanism of dust suppression by TY and YHC dust suppressants does not change the microstructure of the surface soil, and the dust suppression effect would also decrease over time. However, calcium carbonate crystals with relatively stable physical and chemical properties are formed in the soil treated with soybean urease dust suppressant, which changes the material composition and microstructure. Therefore, the dust suppression effect of the soil treated with soybean urease dust suppressant is significant and could maintain for a long time.
In this study, a new technology using soybean urease for dust suppressant in the city is proposed, and the optimal preparation process of soybean urease dust suppressant is evaluated through a series of laboratory and field tests. The dust suppression effectiveness of soybean urease, TY, YHC, and water are compared. The conclusions are drawn as follows:
1. For the key parameters of soybean urease dust suppressant, the optimum values of soybean meal concentration, cementing solution concentration, and solution volume are determined by quantitative analysis and response surface analysis.
2. In the laboratory tests, the comprehensive order of the soil treated with the four dust suppressants is as follows: soybean urease < TY < YHC < water (evaporation rate and surface strength), water < YHC < TY < soybean urease (water retention ratio), TY < YHC < soybean urease < water (infiltration rate). Soybean urease is proven to have the best dust suppression effect.
3. In the field tests, the surface strength and settlement of soil treated with four kinds of dust suppressants are ranked as follows: soybean urease > TY > YHC > water, water > TY = YHC > soybean urease, respectively. Soybean urease has the strongest anti-disturbance ability.
4. The microscopic analysis results show that CaCO3 is formed between soil particles, and the soil particles are cemented together, which inhibits the formation of dust.
Funding Statement: The first four authors would like to acknowledge the National Natural Science Foundation of China (No. 51508163), the Postgraduate Education Reform and Quality Improvement Project of Henan Province (No. YJS2021JD13), the Training Program for Young Scholar in Colleges and Universities of Henan Province (No. 2019GGJS041), the Key-Area Research and Development Program of Guangdong Province (No. 2020B0101130009), and the Guangdong Enterprise Key Laboratory for Urban Sensing, Monitoring and Early Warning (No. 2020B121202019).
Conflicts of Interest: The authors declare that they have no conflicts of interest to report regarding the present study.
References
1. Yang, F. B., Lu, C. H. (2016). Assessing changes in wind erosion climatic erosivity in China’s dryland region during 1961–2012. Journal of Geographical Sciences, 26(9), 1263–1276. https://doi.org/10.1007/s11442-016-1325-9 [Google Scholar] [CrossRef]
2. Lo, C. Y., Tirkolaei, H. K., Hua, M., de Rosa, I. M., Carlson, L. et al. (2020). Durable and ductile double-network material for dust control. Geoderma, 361(11), 1–11. https://doi.org/10.1016/j.geoderma.2019.114090 [Google Scholar] [CrossRef]
3. Jin, Q. J., Wei, J. F., Lau, W. K. M., Pu, B., Wang, C. (2021). Interactions of asian mineral dust with Indian summer monsoon: Recent advances and challenges. Earth-Science Reviews, 215(2), 103562. https://doi.org/10.1016/j.earscirev.2021.103562 [Google Scholar] [CrossRef]
4. Parvej, S., Naik, D. L., Sajid, H. U., Kiran, R., Huang, Y. et al. (2021). Fugitive dust suppression in unpaved roads: State of the art research review. Sustainability, 13(2), 2339. https://doi.org/10.3390/su13042399 [Google Scholar] [CrossRef]
5. Schepanski, K. (2018). Transport of mineral dust and its impact on climate. Geosciences, 8(5), 151. https://doi.org/10.3390/geosciences8050151 [Google Scholar] [CrossRef]
6. Griffin, D. W. (2007). Atmospheric movement of microorganisms in clouds of desert dust and implications for human health. Clinical Microbiology Reviews, 20(3), 459–77. https://doi.org/10.1128/CMR.00039-06 [Google Scholar] [PubMed] [CrossRef]
7. Liu, J., Wu, D., Wang, T., Ji, M., Wang, X. (2021). Interannual variability of dust height and the dynamics of its formation over East Asia. Science of the Total Environment, 751(9), 142288. https://doi.org/10.1016/j.scitotenv.2020.142288 [Google Scholar] [PubMed] [CrossRef]
8. Srimuruganandam, B., Shiva, N. S. M. (2011). Chemical characterization of PM10 and PM2.5 mass concentrations emitted by heterogeneous traffic. Science of the Total Environment, 409(6), 3144–3157. https://doi.org/10.1016/j.scitotenv.2011.04.042 [Google Scholar] [PubMed] [CrossRef]
9. Amato, F., Querol, X., Johansson, C., Nagl, C., Alastuey, A. (2010). A review on the effectiveness of street sweeping, washing and dust suppressants as urban PM control methods. Science of the Total Environment, 408(5), 3070–3084. https://doi.org/10.1016/j.scitotenv.2010.04.025 [Google Scholar] [PubMed] [CrossRef]
10. Jones, D. (2003). Toward fit-for-purpose certification of road additives. Transportation Research Record Journal of the Transportation Research Board, 1819(1), 208–217. https://doi.org/10.3141/1819b-27 [Google Scholar] [CrossRef]
11. Tsai, Y. T., Yang, Y., Huang, H. C., Shu, C. M. (2020). Inhibitory effects of three chemical dust suppressants on nitrocellulose dust cloud explosion. AIChE Journal, 66(5), 16888. https://doi.org/10.1002/aic.16888 [Google Scholar] [CrossRef]
12. Zhou, L., Yang, S., Yuan, Z., Yang, L., Wu, H. (2018). Inhibition of fine particles fugitive emission from the open-pit lignite mines by polymer aqueous solutions. Colloids and Surfaces A: Physicochemical and Engineering Aspects, 555(7), 14. https://doi.org/10.1016/j.colsurfa.07.014 [Google Scholar] [CrossRef]
13. Zhu, S., Zhao, Y., Hu, X., Wu, M., Cheng, W. et al. (2021). Study on preparation and properties of mineral surfactant–Microbial dust suppressant. Powder Technology, 383(1), 233–243. https://doi.org/10.1016/j.powtec.01.053 [Google Scholar] [CrossRef]
14. Zhang, J. W., Han, Y., Wang, X. J., Bian, H. L. (2021). Experimental investigation of the dynamic characteristics of treated silt using lignin: Case study of Yellow River flood basin. International Journal of Geomechanics, 21(5), 04021056. https://doi.org/10.1061/(asce)gm.1943-5622.0002018 [Google Scholar] [CrossRef]
15. Kok, J. F., Adebiyi, A. A., Albani, S., Balkanski, Y., Checa, G. R. et al. (2021). Contribution of the World’s main dust source regions to the global cycle of Desert dust. Atmospheric Chemistry and Physics, 21(10), 8169–8193. https://doi.org/10.5194/acp-21-8169-2021 [Google Scholar] [CrossRef]
16. Fussell, J. C., Kelly, F. J. (2021). Mechanisms underlying the health effects of desert sand dust. Environment International, 157(3), 106790. https://doi.org/10.1016/j.envint.2021.106790 [Google Scholar] [PubMed] [CrossRef]
17. Xiao, Y., Chen, H., Stuedlein, A. W., Evans, T. M., Chu, J. et al. (2020). Aboel-Naga, H.M. restraint of particle breakage by biotreatment method. Journal of Geotechnical and Geoenvironmental Engineering, 146(11), 04020123. https://doi.org/10.1061/(asce)gt.1943-5606.0002384 [Google Scholar] [CrossRef]
18. Zhao, G., Mu, X., Wen, Z., Wang, F., Gao, P. (2013). Soil erosion, conservation, and eco-environment changes in the loess plateau of China. Land Degradation and Development, 24, 499–510. https://doi.org/10.1002/ldr.2246 [Google Scholar] [CrossRef]
19. Almajed, A., Tirkolaei, H. K., Kavazanjian, E., Hamdan, N. (2019). Enzyme induced biocementated sand with high strength at Low carbonate content. Scientific Reports, 9(1), 38361. https://doi.org/10.1038/s41598-018-38361-1 [Google Scholar] [PubMed] [CrossRef]
20. Naeimi, M., Chu, J. (2017). Comparison of conventional and bio-treated methods as dust suppressants. Environmental Science and Pollution Research, 24(29), 23341–23350. https://doi.org/10.1007/s11356-017-9889-1 [Google Scholar] [PubMed] [CrossRef]
21. He, J., Chu, J., Gao, Y., Liu, H. (2018). Research advances and challenges in biogeotechnologies. Geotechnical Research, 6(2), 1–47. https://doi.org/10.1680/jgere.18.00035 [Google Scholar] [CrossRef]
22. Sun, X., Miao, L., Yuan, J., Wang, H., Wu, L. (2021). Application of enzymatic calcification for dust control and rainfall erosion resistance improvement. Science of the Total Environment, 759(14), 143468. https://doi.org/10.1016/j.scitotenv.2020.143468 [Google Scholar] [PubMed] [CrossRef]
23. Xiao, Y., Stuedlein, A. W., Pan, Z., Liu, H., Matthew, E. T. et al. (2020). Toe-bearing capacity of precast concrete piles through biogrouting improvement. Journal of Geotechnical and Geoenvironmental Engineering, 146(12), 06020026. https://doi.org/10.1061/(asce)gt.1943-5606.0002404 [Google Scholar] [CrossRef]
24. Chu, J., Ivanov, V., He, J., Naeimi, M., Li, B. et al. (2011). Development of microbial geotechnology in Singapore. In: Geo-Frontiers 2011, pp. 4070–4078. New York, USA: ASCE (American Society of Civil Engineers). https://doi.org/10.1061/41165(397)416 [Google Scholar] [CrossRef]
25. Wu, S., Li, B., Chu, J. (2021). Stress-dilatancy behavior of MICP-treated sand. International Journal of Geomechanics, 21(3), 04020264. https://doi.org/10.1061/(asce)gm.1943-5622.0001923 [Google Scholar] [CrossRef]
26. Almajed, A., Lemboye, K., Arab, M. G., Alnuaim, A. (2020). Mitigating wind erosion of sand using biopolymer-assisted EICP technique. Soils and Foundations, 60(2), 356–371. https://doi.org/10.1016/j.sandf.2020.02.011 [Google Scholar] [CrossRef]
27. Hamdan, N., Kavazanjian, J. E., O’Donnell, S. (2021). Carbonate cementation via plant derived urease. 18th International Conference on Soil Mechanics and Geotechnical Engineering: Challenges and Innovations in Geotechnics, pp. 1–11. Paris, France. [Google Scholar]
28. He, J., Chu, J. (2017). Cementation of sand due to salt precipitation in drying process. Marine Georesources and Geotechnology, 35(2), 441–445. https://doi.org/10.1080/1064119X.2016.1168498 [Google Scholar] [CrossRef]
29. Dilrukshi, R. A. N., Nakashima, K., Kawasaki, S. (2018). Soil improvement using plant-derived urease-induced calcium carbonate precipitation. Soils and Foundations, 58(12), 894–910. https://doi.org/10.1016/j.sandf.2018.04.003 [Google Scholar] [CrossRef]
30. Dhami, N. K., Reddy, M. S., Mukherjee, M. S. (2013). Biomineralization of calcium carbonates and their engineered applications: A review. Frontiers in Microbiology, 4(314), 314. https://doi.org/10.3389/fmicb.2013.00314 [Google Scholar] [PubMed] [CrossRef]
31. Ivanov, V., Chu, J. (2018). Applications of microorganisms to geotechnical engineering for bioclogging and biocementation of soil in situ. Reviews in Environmental Science and Bio/Technology, 7(2), 139–153. https://doi.org/10.1007/s11157-007-9126-3 [Google Scholar] [CrossRef]
32. Jiang, N. J., Soga, K. (2019). Erosional behavior of gravel-sand mixtures stabilized by microbially induced calcite precipitation (MICP). Soils and Foundations, 59(12), 699–709. https://doi.org/10.1016/j.sandf.2019.02.003 [Google Scholar] [CrossRef]
33. Gao, Y., Tang, X., Chu, J., He, J. (2019). Microbially induced calcite precipitation for seepage control in sandy soil. Geomicrobiology, 36(10), 1–10. https://doi.org/10.1080/01490451.2018.1556750 [Google Scholar] [CrossRef]
34. Gomez, M. G., Martinez, B. C., Dejong, J. T., Hunt, C. E., Devlaming, L. A. et al. (2019). Field-scale bio-cementation tests to improve sands. Proceedings of the Institution of Civil Engineers Ground Improvement, 168(3), 206–216. https://doi.org/10.1680/grim.13.00052 [Google Scholar] [CrossRef]
35. Li, C., Wang, S., Wang, Y. X., Gao, Y., Bai, S. (2019). Field experimental study on stability of bio-mineralization crust in the desert. Rock and Soil Mechanics, 40(4), 1291–1298. https://doi.org/10.16285/j.rsm.2018.0677 [Google Scholar] [CrossRef]
36. Zhan, Q., Qian, C., Yi, H. (2016). Microbial-induced mineralization and cementation of fugitive dust and engineering application. Fourth International Conference on Sustainable Construction Materials and Technologies, pp. 437–444. Beijing, China. https://doi.org/10.1016/j.conbuildmat.2016.06.016 [Google Scholar] [CrossRef]
37. Neupane, D., Yasuhara, H., Kinoshita, N., Unno, T. (2013). Applicability of enzymatic calcium carbonate precipitation as a soil-strengthening technique. Journal of Geotechnical and Geoenvironmental Engineering, 139(2), 2201–2211. https://doi.org/10.1061/(asce)gt.1943-5606.0000959 [Google Scholar] [CrossRef]
38. Blakeley, R. L., Zerner, B. (1983). Jack bean urease: The first nickel enzyme. Inorganica Chimica Acta, 23(2–3), 263–291. https://doi.org/10.1016/s0020-1693(00)95029-1 [Google Scholar] [CrossRef]
39. ASTM D1557 (2003). Standard test methods for laboratory compaction characteristics of soil using modified effort. West Conshohocken: ASTM. [Google Scholar]
40. Ulusay, R., Erguler, Z. A. (2012). Needle penetration test: Evaluation of its performance and possible uses in predicting strength of weak and soft rocks. Engineering Geology, 149(8), 149–150. https://doi.org/10.1016/j.enggeo.2012.08.007 [Google Scholar] [CrossRef]
41. Miao, L., Wu, L., Sun, X. (2020). Enzyme-catalysed mineralisation experiment study to solidify desert sands. Scientific Reports, 10(1), 1–12. https://doi.org/10.1038/s41598-020-67566-6 [Google Scholar] [PubMed] [CrossRef]
42. Hamdan, N., Kavazanjian, E. (2016). Enzyme-induced carbonate mineral precipitation for fugitive dust control. Geotechnique, 66(7), 546–555. https://doi.org/10.1680/jgeot.15.P.168 [Google Scholar] [CrossRef]
43. Xiao, Y., He, X., Evans, T. M., Stuedlein, A. W., Liu, H. (2019). Unconfined compressive and splitting tensile strength of basalt fiber–reinforced biocemented sand. Journal of Geotechnical and Geoenvironmental Engineering, 145(9), 04019048. https://doi.org/10.1061/(asce)gt.1943-5606.0002108 [Google Scholar] [CrossRef]
44. Wen, T. D., Shao, L. T., Guo, X. X. (2018). Permeability function for unsaturated soil. European Journal of Environmental and Civil Engineering, 25(1), 1–13. https://doi.org/10.1080/19648189.2018.1515666 [Google Scholar] [CrossRef]
45. Carmona, J. P. S., Oliveira, P. J., Lemos, L., Pedro, A. M. G. (2017). Improvement of a sandy soil by enzymatic calcium carbonate precipitation. ICE Proceedings Geotechnical Engineering, 171(1), 1–13. https://doi.org/10.1680/jgeen.16.0013845 [Google Scholar] [CrossRef]
46. Dejong, J. T., Soga, K., Kavazanjian, E., Burns, S., van Paassen, L. A. et al. (2013). Biogeochemical processes and geotechnical applications: Progress, opportunities and challenges. Géotechnique, 63(4), 287–301. https://doi.org/10.1680/bcmpge.60531.014.46 [Google Scholar] [CrossRef]
Cite This Article
 Copyright © 2023 The Author(s). Published by Tech Science Press.
This work is licensed under a Creative Commons Attribution 4.0 International License , which permits unrestricted use, distribution, and reproduction in any medium, provided the original work is properly cited.
 Downloads
 Citation Tools