
 Submit a Paper
 Propose a Special lssue
 Open Access
ARTICLE

Three-Dimensional Simulation of Hydrodynamic Mechanism of Fluidized Bed Methanation
1 Key Laboratory of Energy Thermal Conversion and Control of Ministry of Education, School of Energy & Environment, Southeast University, Nanjing, 210096, China
2 State Key Laboratory of Clean and Efficient Coal-Fired Power Generation and Pollutant Control, China Energy Science and Technology Research Institute Co., Ltd., Nanjing, 210023, China
* Corresponding Author: Xiaojia Wang. Email:
Journal of Renewable Materials 2023, 11(7), 3155-3175. https://doi.org/10.32604/jrm.2023.027535
Received 03 November 2022; Accepted 15 December 2022; Issue published 05 June 2023
 View Full Text
 Download PDF
Abstract
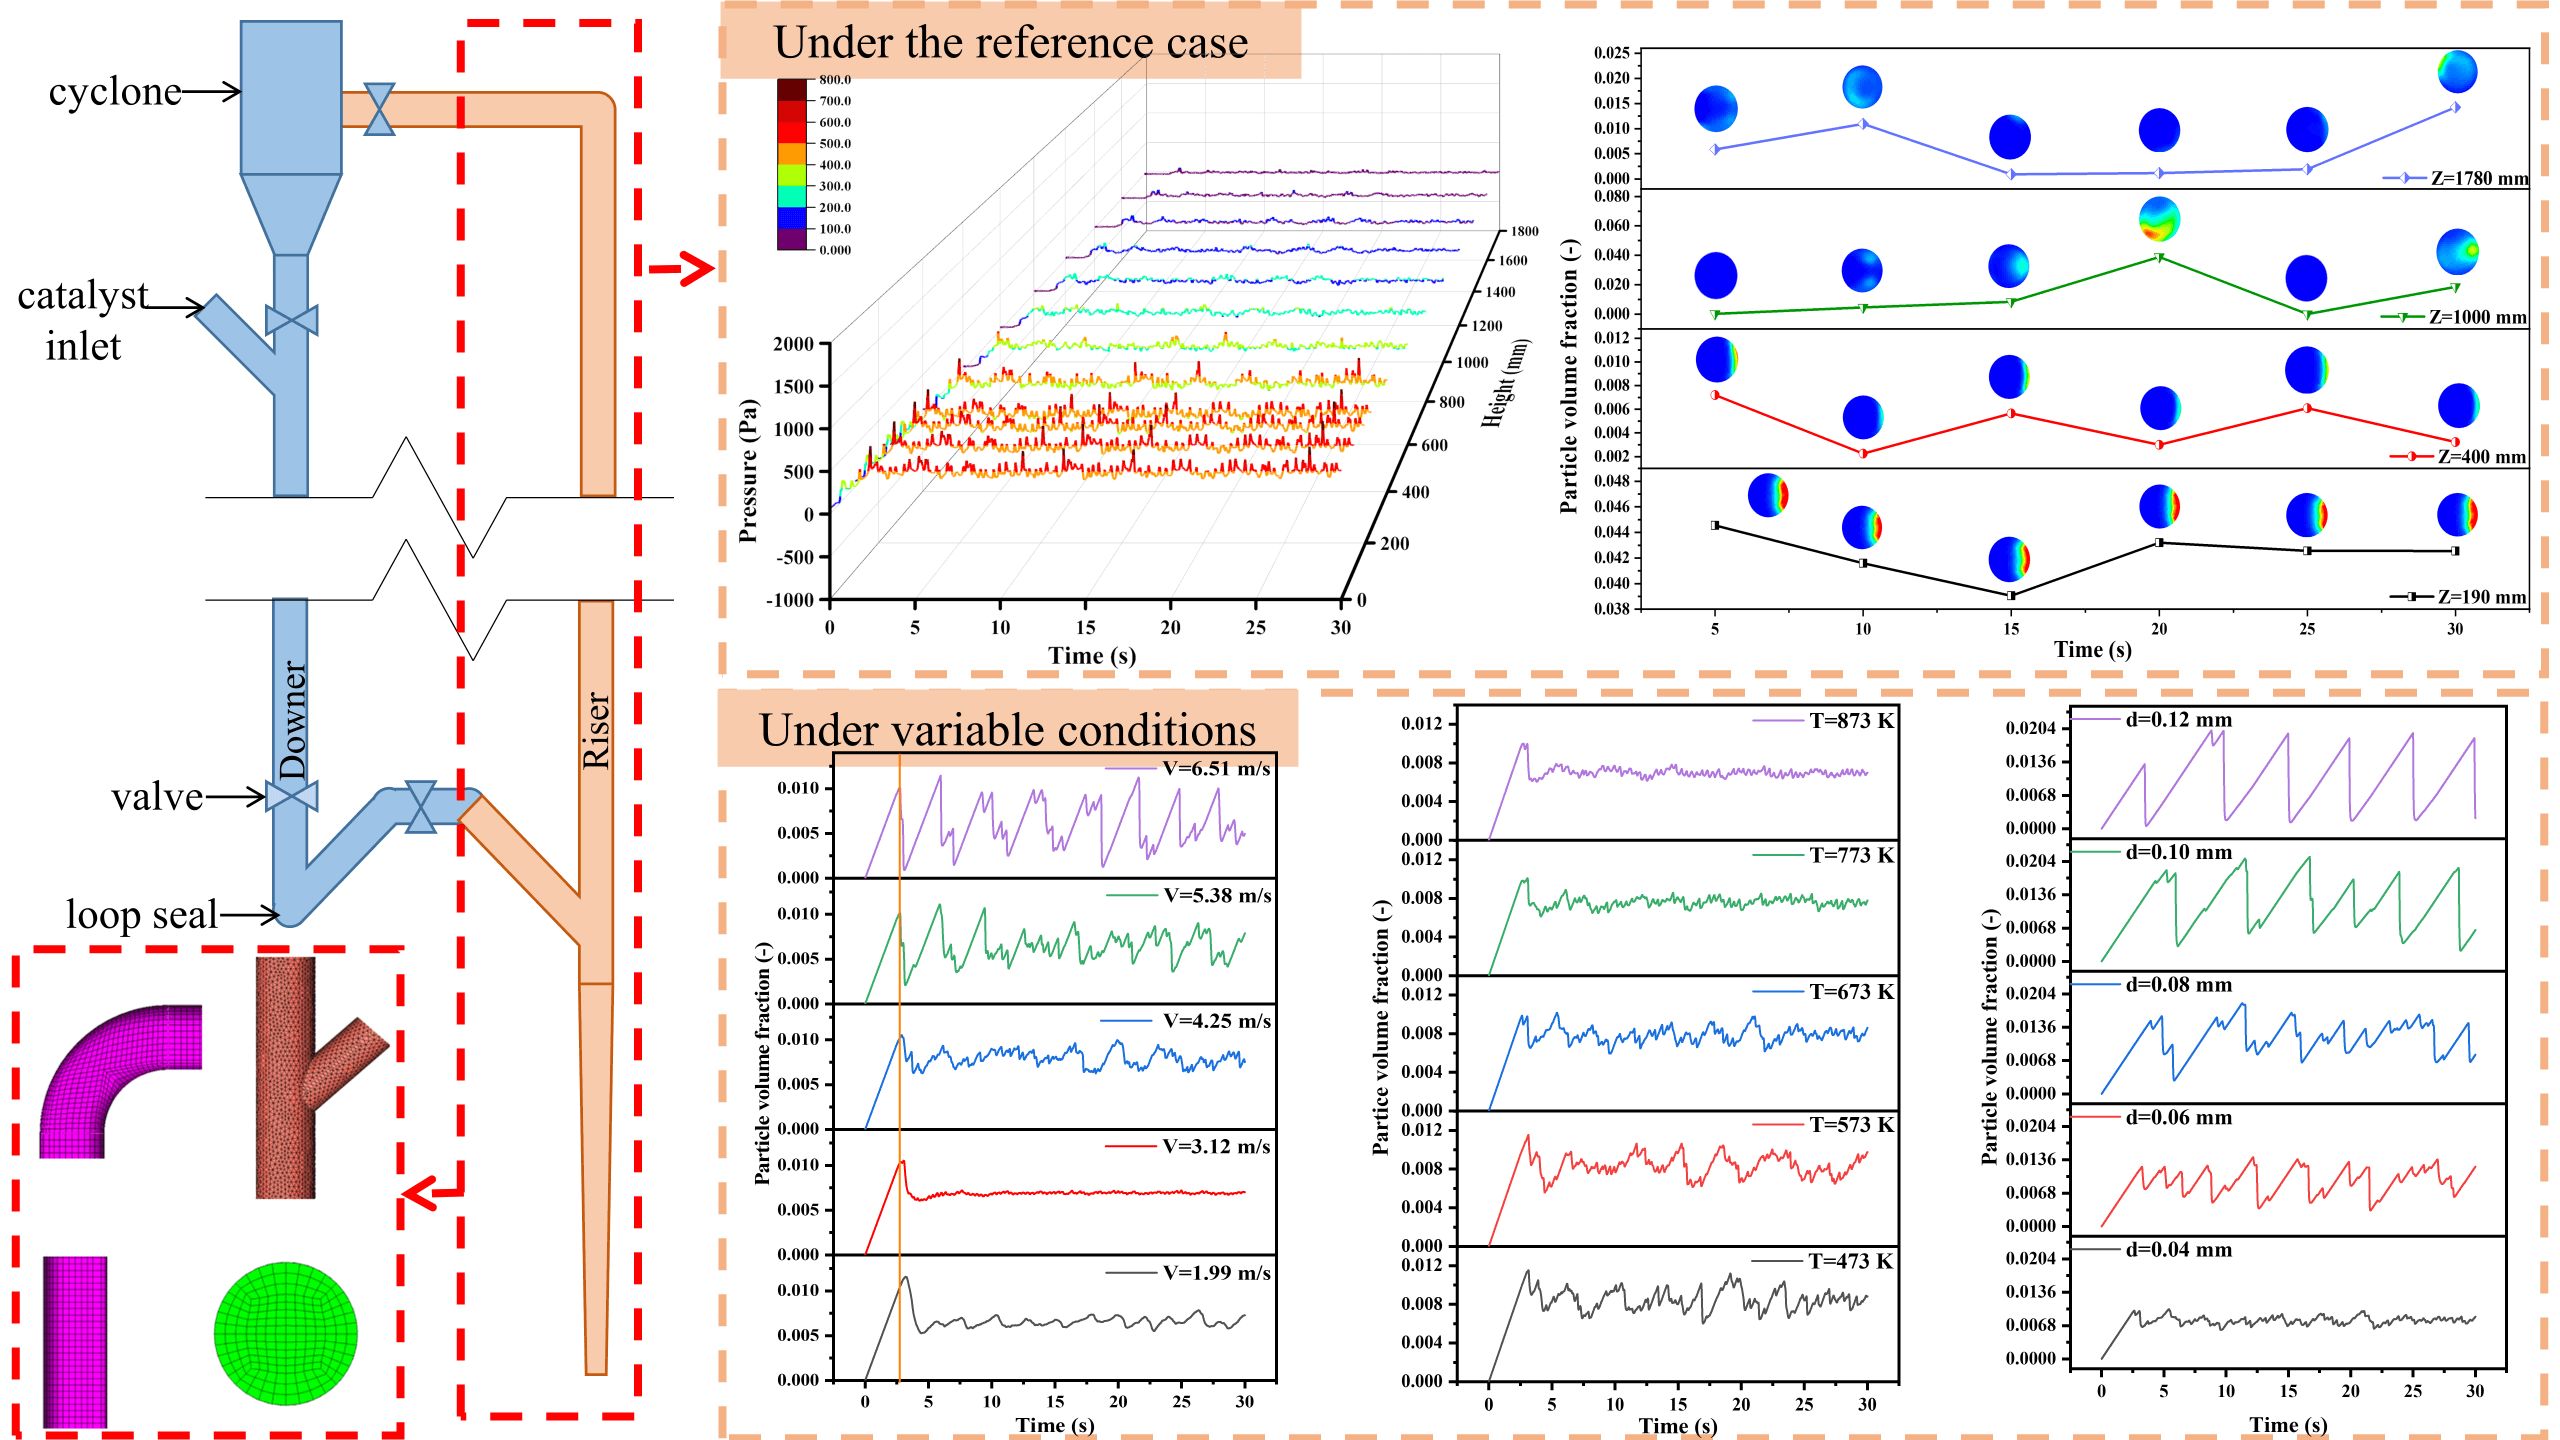
Organic solid waste (OSW) contains many renewable materials. The pyrolysis and gasification of OSW can realize resource utilization, and its products can be used for methanation reaction to produce synthetic natural gas in the specific reactor. In order to understand the dynamic characteristics of the reactor, a three-dimensional numerical model has been established by the method of Computational Fluid Dynamics (CFD). Along the height of the reactor, the particle distribution in the bed becomes thinner and the mean solid volume fraction decreases from 4.18% to 0.37%. Meanwhile, the pressure fluctuation range decreased from 398.76 Pa at the entrance to a much lower value of 74.47 Pa at the exit. In this simulation, three parameters of gas inlet velocity, operating temperature and solid particle diameter are changed to explore their influences on gas-solid multiphase flow. The results show that gas velocity has a great influence on particle distribution. When the gas inlet velocity decreases from 6.51 to 1.98 m/s, the minimum height that particles can reach decreases from 169 to 100 mm. Additionally, as the operating temperature increases, the particle holdup inside the reactor changes from 0.843% to 0.700%. This indicates that the particle residence time reduces, which is not conducive to the follow-up reaction. Moreover, with the increase of particle size, the fluctuation range of the pressure at the bottom of the reactor increases, and its standard deviation increases from 55.34 to 1266.37 Pa.Graphic Abstract
Keywords
Nomenclature
| | Drag coefficient [-] |
| | Diameter of particles [mm] |
| | Gravity [m/s2] |
| | Radial distribution function [-] |
| | Stress tensor invariant [-] |
| i | Pressure, particle volume fraction |
| | Conductivity of granular temperature [W/(m·K)] |
| | Mean value of physical quantity i, [Pa] or [m/s] |
| | Instantaneous value of the physical quantity i, [Pa] or [m/s] |
| | Number of values in the range of [a, b] [-] |
| | Total number of values of parameters [-] |
| | Pressure [Pa] |
| | Probability [-] |
| | Pressure of solid phase [Pa] |
| | Reynolds number [-] |
| | Time [s] |
| | Temperature [K] |
| | Gas velocity [m/s] |
| | Solid velocity [m/s] |
| Greek symbols | |
| | Volume fraction of gas phase [-] |
| | Volume fraction of solid phase [-] |
| | Momentum exchange coefficient between gas and solid [-] |
| | Density of gas phase [kg/m3] |
| | Density of solid phase [kg/m3] |
| | Stress tensor of gas phase [Pa] |
| | Stress tensor of solid phase [Pa] |
| | Shear viscosity of gas phase [Pa·s] |
| | Shear viscosity of solid phase [Pa·s] |
| | Bulk viscosity of particles [Pa·s] |
| | Collision dissipation of energy [kg/(m·s3)] |
| | Interphase energy exchange [kg/(m·s3)] |
| | Constant |
| | Granular temperature [m2/s2] |
With the rapid development of the economy, people’s living standards have improved significantly. However, the amount of solid waste in the process of life and production is also increasing. It is estimated that by the end of the 21st Century, the daily output of global solid waste will exceed 11 million tons. Among them, the proportion of organic solid waste can reach 46% [1]. As things stand, only 20–30 percent of solid waste is collected and utilized. Most of them are treated indiscriminately, so renewable substances are not fully utilized. And environmental problems, such as the blockage of canals, drainage channels and the pollution of water bodies, occur. Therefore, it is necessary to decrease its quantity, reduce its harm, and make it an available resource [2].
There are many ways to deal with the OSW, including traditional methods such as sanitary landfill, incineration and composting. Some researches have also proposed some new technologies to treat the OSW and produce renewable materials and high-value-added chemicals. For example, the OSW can be converted into inert materials to make insulating plates [3]. Pyrolysis and gasification technology has become an important research direction with its outstanding advantage of generating products with high calorific value [4]. These products, rich in gaseous hydrocarbons, hydrogen and carbon monoxide, have a good potential to replace natural gas and can even be used as raw materials for chemical products [5]. In 1970, the United States took the lead in research on waste gasification technology. Purox system developed by Union Carbide Corp and torrax system developed by Carborundun Company were once popular [6,7]. And then the plasma gasification technology was developed because it can decompose toxic compounds into harmless chemical elements at high temperatures [8]. Recently, rotary kiln technology and fluidized bed technology have shown good reliability in solid waste pyrolysis and gasification [9,10].
The demand for natural gas in the Asian market continues to grow strongly, which will inevitably require a large increase in imports [11,12]. Therefore, methanation technology has attracted much attention. Methanation reaction equipment includes fixed bed reactors and fluidized bed reactors [11]. The fixed bed reactor is the most widely used device in gas-solid catalytic reactions [13]. The catalyst remains stationary in the reactor, so the catalyst is not easy to wear and the required reactor is very small. At present, companies with relatively mature methanation technology include Topsoe in Denmark, Lurgi in Germany, Davy in the UK, Great Point Energy in the United States and others [12]. However, the reaction heat of the fixed bed reactor cannot be removed in time, which would often lead to problems such as bed ultra-temperature and catalyst structural damage, even contributing to the reduction of reaction rate. Recently, a growing number of people pay attention to fluidized bed reactor technology [14–16].
Compared with the fixed bed reactor, the fluidized bed reactor can strengthen the catalytic reaction, mass transfer and heat transfer, bringing about higher CH4 output and lower bed temperature [17]. It is one of the most promising technologies for strong exothermic methanation reactions [18]. With the fluidized bed experiments, the effects of particle size, inlet gas velocity, H2/CO ratio of inlet gas, operating pressure and temperature on fluidization quality and CO conversion were studied [19–21]. Meanwhile, there have been many improvement measures to ameliorate the operation of reactors. Coppola et al. [22] proposed to use the natural limestone CaO to absorb H2O generated in the methanation process, in order to shift the balance to the direction of methane generation. Liu et al. [23] proved the feasibility and superiority of fluidized bed methanation in the reduction of reactor size and catalyst consumption. Reinking et al. [24] found that compared with the conventional cyclone separator, the disengager had a better separation efficiency while it consumed similar raw materials.
During experimental researches, it is time-consuming and expensive to establish a reaction device composed of reaction systems, measurement systems and control systems. Moreover, the addition of temperature and pressure measuring devices is likely to destroy the flow field in the reactor, which makes it difficult to observe the multiphase flow characteristics. The details of temperature and concentration distribution in the reactor can be obtained by the Computational Fluid Dynamics (CFD) simulation, which is conducive to process simplification, optimization and amplification [25–27]. By establishing the 3D model of the circulating fluidized bed reactor, Sun et al. [28,29] found that the increases in solid stock and circulation rate in the reactor were helpful for the complete conversion of reactants and the high selectivity of methane. Furthermore, with the temperature rising, the reversible reaction and water gas shift reaction (WGS) played an important role in the final product. They also developed a methanation reaction model to investigate the influences of different parameters on the production of CH4 [18]. So far, numerical simulation technology has become an effective way to predict the gas-solid hydrodynamics in reactors with its advantages of vivid display, flexible use and low cost [30]. Luo et al. [31] found that radial and axial non-uniformity of solid holdup occurred by simulating the liquid-solid circulating fluidized bed. Sun et al. [32] extracted the shape, size, velocity, distribution and other dynamic characteristics of cluster clouds composed of solid particles in circulating fluidized bed risers with different densities. Although there have been many in-depth studies on the methanation process, the gas-solid flow phenomenon in the reactor riser is unique and complex, which is still worth further study.
In order to facilitate the exploration of complex gas-solid flow and mass transfer mechanisms in the fluidized bed reactor, CFD technology has been used in this study. The spatiotemporal statistical results of particle distribution and pressure change under different operating conditions have been obtained. The main contributions of this simulation are (a) the successful construction of a comprehensive model of a three-dimensional fluidized bed reactor to simulate the gas-solid multiphase flow behaviors during the methanation process, (b) in-depth investigation into the hydrodynamic Mechanism between pyrolysis and gasification syngas and catalyst particles, and (c) insight into the influences of important operating variables on the internal multiphase characteristics of the methanation reactor.
Fig. 1 shows the schematic diagram of a laboratory fluidized bed methanation apparatus designed by Liu et al. [23]. According to the size and structure of the reactor, gas inlet, solid inlet, outlet and riser have been modeled and simulated. The reactor has a diameter gradient section of 150 mm at the gas inlet whose diameter changes from 8 to 10 mm, and the total effective length is 1800 mm.
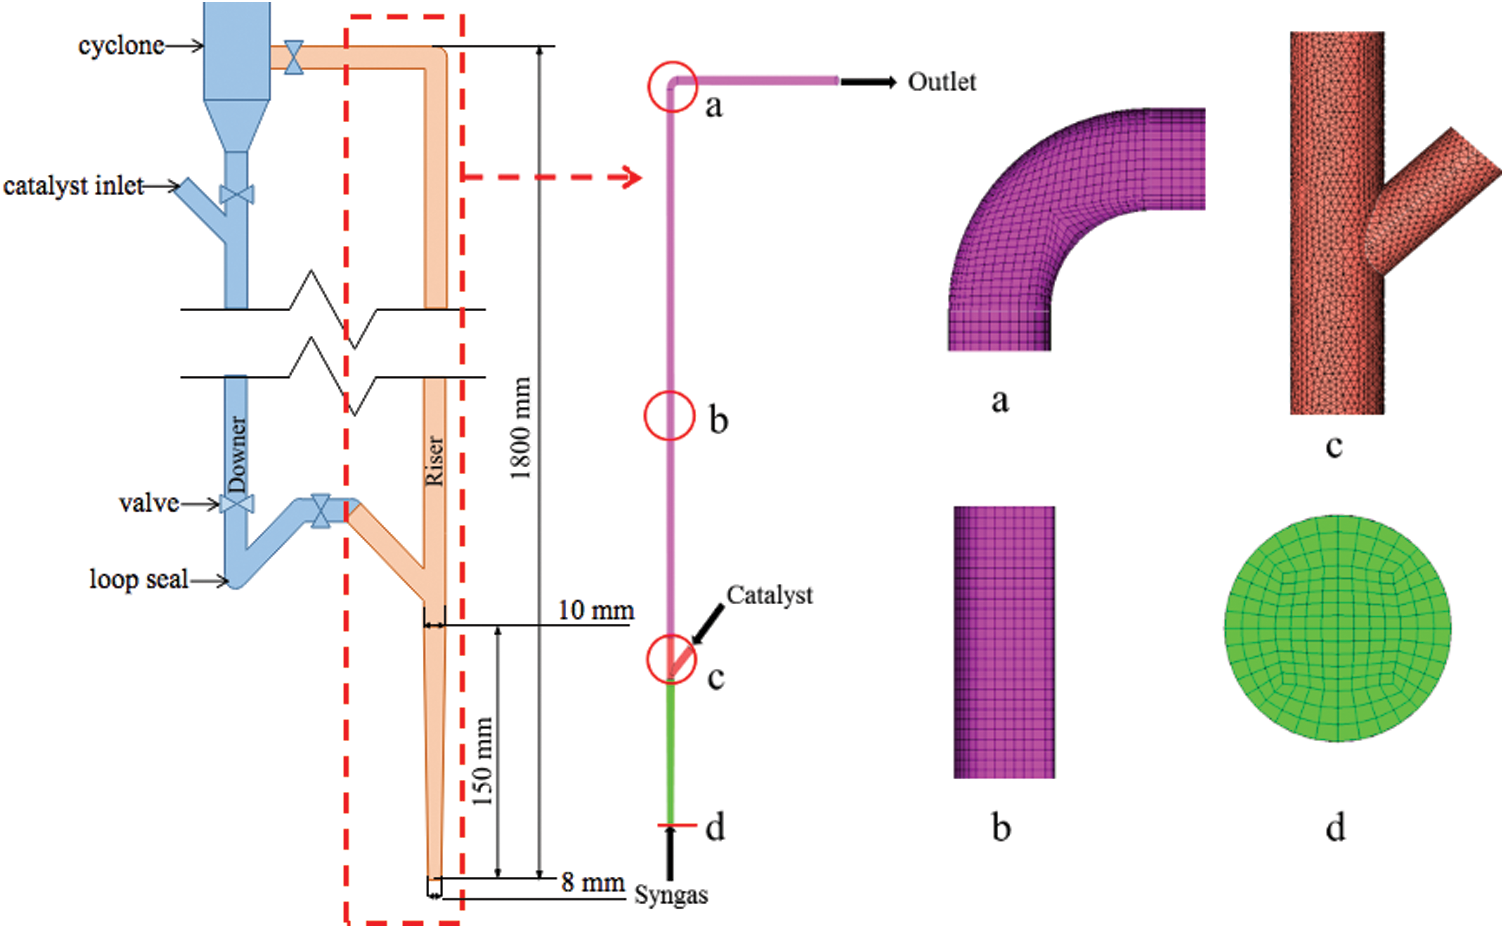
Figure 1: Schematic diagram and grid partition of the fluidized bed methanation reactor
The calculation area is divided into several parts. The regular cylindrical area adopts the hexahedral grid (such as the vertical reactor furnace and outlet of gas-solid mixed phase), and the tetrahedral grid is generated in the irregular area (such as the connecting part between the solid inlet and reactor). Using the combination of the two grid division methods cannot only simplify the division process, but also improve the grid quality. Considering the requirements of grid accuracy and subsequent calculation speed, the calculation domain of 670733 elements is finally determined for this simulation. The grid division of some computing domains is shown in Fig. 1.
The continuity equations are as follows [33]:
gas phase:
solid phase:
where
The momentum equations for the gas phase and solid phase are given by [34]:
gas phase:
where
For different solid volume fraction distribution,
where,
And
In Eq. (5),
In momentum equations, the expression of gas stress tensor
For the solid phase, the expression of its stress tensor
where
where
and
where
In Eq. (4), the pressure of solid phase
The objective of this simulation is to investigate the flow characteristics of the gas phase and solid phase in the reactor, so the Eulerian-Eulerian multiphase model is used to simulate the gas-solid two-phase flow in the reactor. Other models used in the simulation process are shown in Table 1.

In the process of simulation, the gas entering the reactor is a mixture of H2, CO and N2, with a mole fraction ratio of 6:2:2. The material of the solid inlet is granular with a density of 1000 kg/m3. The velocity of the solid inlet is 0.04 m/s, the volume fraction is 0.30 and the packing limit is 0.63. Meanwhile, the gas with a velocity of 0.04 m/s is also set at the solid inlet to transport solid particles. Under the reference case, the inlet gas velocity is equal to 4.25 m/s, the particle diameter equals 0.04 mm and the operating temperature is 673 K. Different operating parameters have been set to study the flow behavior in the methanation reactor. The variables are inlet gas velocity, operating temperature and particle diameter, as presented in Table 2. The inlet gas velocity affects the travel path of particles in the reactor. The operating temperature affects the gas density and viscosity, and then affects the ability of gas to entrain particles. The particle size determines whether it is easy to be carried and transport by gas. In general, the changes to these three parameters will influence the particle distribution in the reactor.

Both the gas inlet and solid inlet are set as the velocity inlet, the mixture outlet is set as the pressure outlet, and the reactor wall boundary condition is set as the adiabatic and no slip wall [35]. In this simulation, the pressure-based method is used to solve the control equation, and the Pressure-Velocity Coupling method is Phase Coupled SIMPLE. The First Order Upwind scheme is used for Momentum, Volume fraction, Turbulent Kinetic Energy and Turbulent Dissipation Rate, while the Second Order Upwind scheme is applied for Energy. The time step is set at 5 × 10⁻³ s while the maximum number of iterations per step is set at 5.
Because the simulation finally reaches a quasi-stable operation where the physical quantity will fluctuate up and down within a certain range. Therefore, it is necessary to calculate the mean value to observe the distribution law of pressure, volume fraction, etc. The mean value is defined as follows:
where
2.4.2 Probability Distribution
The probability is defined as:
where
3.1 Grid Independence and Model Feasibility
Grid independence verification is the basic requirement of CFD simulation, which requires the resolution of the divided grid to describe the details of the flow structure. If the quality of the grid is coarse, the local flow structure information will be lost during the particle transmission. On the contrary, the fine grid will considerably increase the time and cost of calculation. Under the cases of three different grid numbers shown in Table 3, the profiles of mean pressure on the different height sections after reaching quasi-stable state have been predicted. Fig. 2 demonstrates that the results obtained under three different grid numbers are close to each other. The results of medium grid are coincident with that of the fine grid, but there is a certain deviation with the coarse grid in the pressure distribution of the lower part. In order to balance the calculation accuracy and cost, 670733 grids are selected for this simulation.


Figure 2: Mean pressure distribution with different mesh sizes
Fig. 3 shows the comparison of mean pressure at the height of 0.05 and 1.5 m between the experimental data and predictions. According to the experiment of Liu et al. [23], the particle volume fraction at the solid inlet is 0.66 while the fluidization velocity is 0.2 m/s. The mean pressure near the outlet at 1.5 m is about 5.6 kPa, and the average pressure near the inlet at 0.5 m is about 7.1 kPa; that is, the pressure difference is 1.5 kPa, which is in good agreement with the simulated data. Taking a panoramic view of the results, the model is acceptable for this simulation.
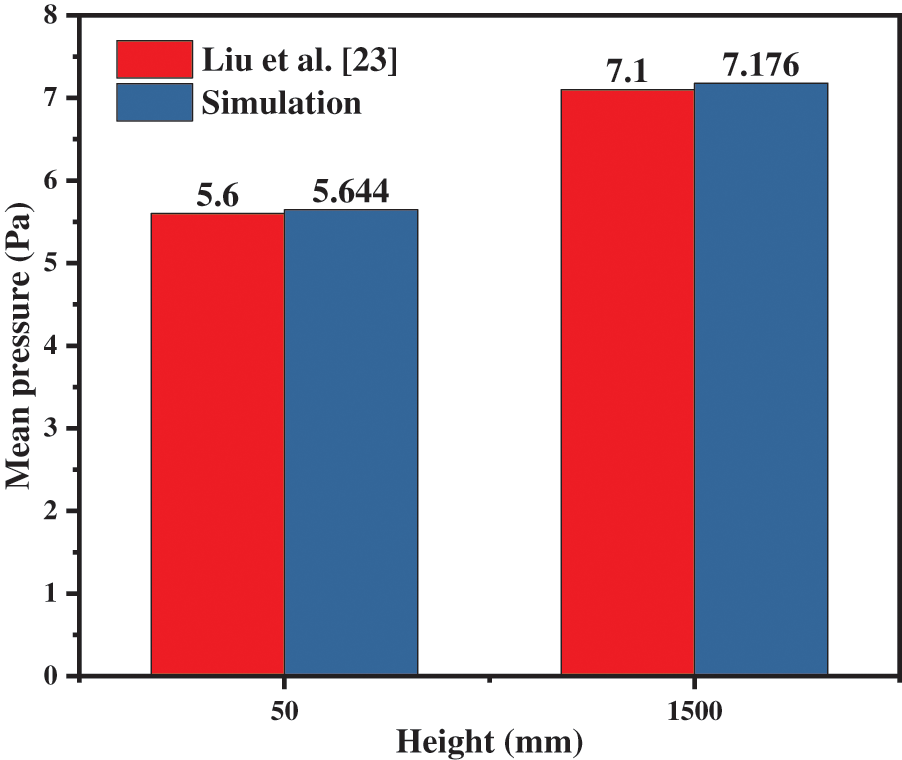
Figure 3: Model verification of fluidized bed methanation reactor
3.2 Hydrodynamic Mechanism of Methanation
The syngas enters from the gas inlet at the bottom of the reactor while the particles are continuously sent from the solid inlet which is at the side of the reactor 170 mm away from the bottom. In this study, the planes with different heights of the methanation reactor are selected as research objects.
Fig. 4 shows the variations of pressure with time in these sections at different heights. Once the solid materials are added to the reactor, the initial phenomenon is the increase of pressure. From the aspect of spatiotemporal distribution, the pressure increment near the bottom is much greater than that near the outlet, which can be obtained by comparing the pressure value at Z = 0 and Z = 1780 mm. In addition, at the higher sections, the time node when the pressure begins to increase is later.
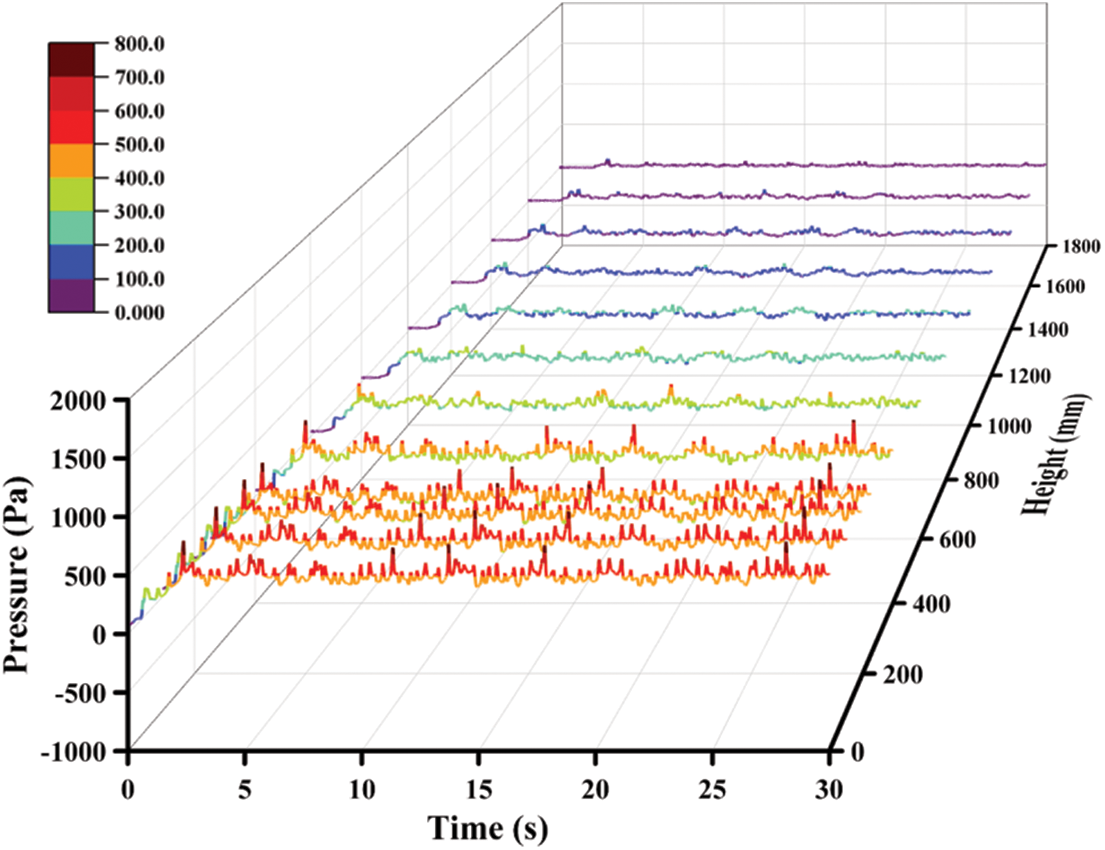
Figure 4: Pressure under the reference case
It can be concluded from the curves in Fig. 4 that the quasi-stable operation can be realized after 5 s although the whole process continues for 30 s. Comparing the fluctuation amplitude, the pressure fluctuation is very small in the area close to the outlet, which indicates that the pressure fluctuation will be eliminated slowly from the bottom to the top. Fig. 5 exhibits the pressure and pressure drop in the reactor which illustrates that the relationship between the pressure and height is basically linear. In the whole reactor, the pressure is decreasing and the corresponding pressure drop increases with an increase in height. In this area, the pressure and pressure drop are mainly affected by solid particles. In the area with dense solid particles, the pressure drop generated by the flow is large and the pressure value is low.
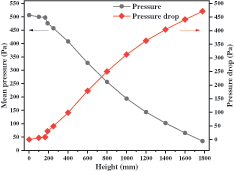
Figure 5: Distribution of mean pressure in stable condition
The volume fractions of solid particles counted on the different vertical crosses are illustrated in Fig. 6. Similar to the pressure distribution in Fig. 4, they increase at the beginning and then stabilize within the corresponding range. From the perspective of space distribution, the whole reactor can be divided into three parts including the blank bed region, dense phase region and dilute phase region. The area below the solid inlet can be identified as the blank bed region because there seem to be no particles. In the dense phase region, the cross Z = 190 mm is closest to the solid inlet, and its mean volume fraction is always maintained at a high value, and the fluctuation amplitude is very slight. These distribution laws are well verified in Fig. 7. The volume fraction distribution of solid particles at each time node is basically the same, but the final volume fraction fluctuates. At Z = 190 mm, the local particle volume fraction is large, and the particle aggregation is obvious. However, with the flow and mixing of gas and solid, the agglomeration of particles is obviously improved.
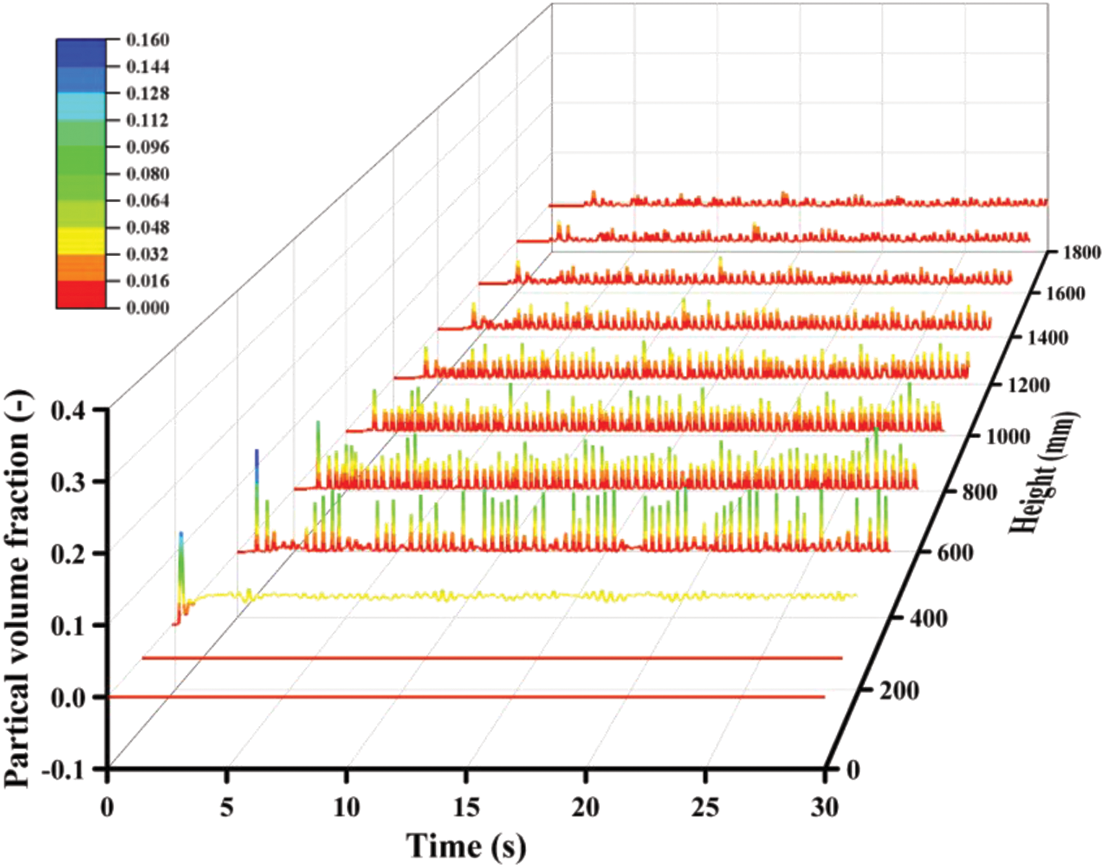
Figure 6: Particle volume fraction under the reference case
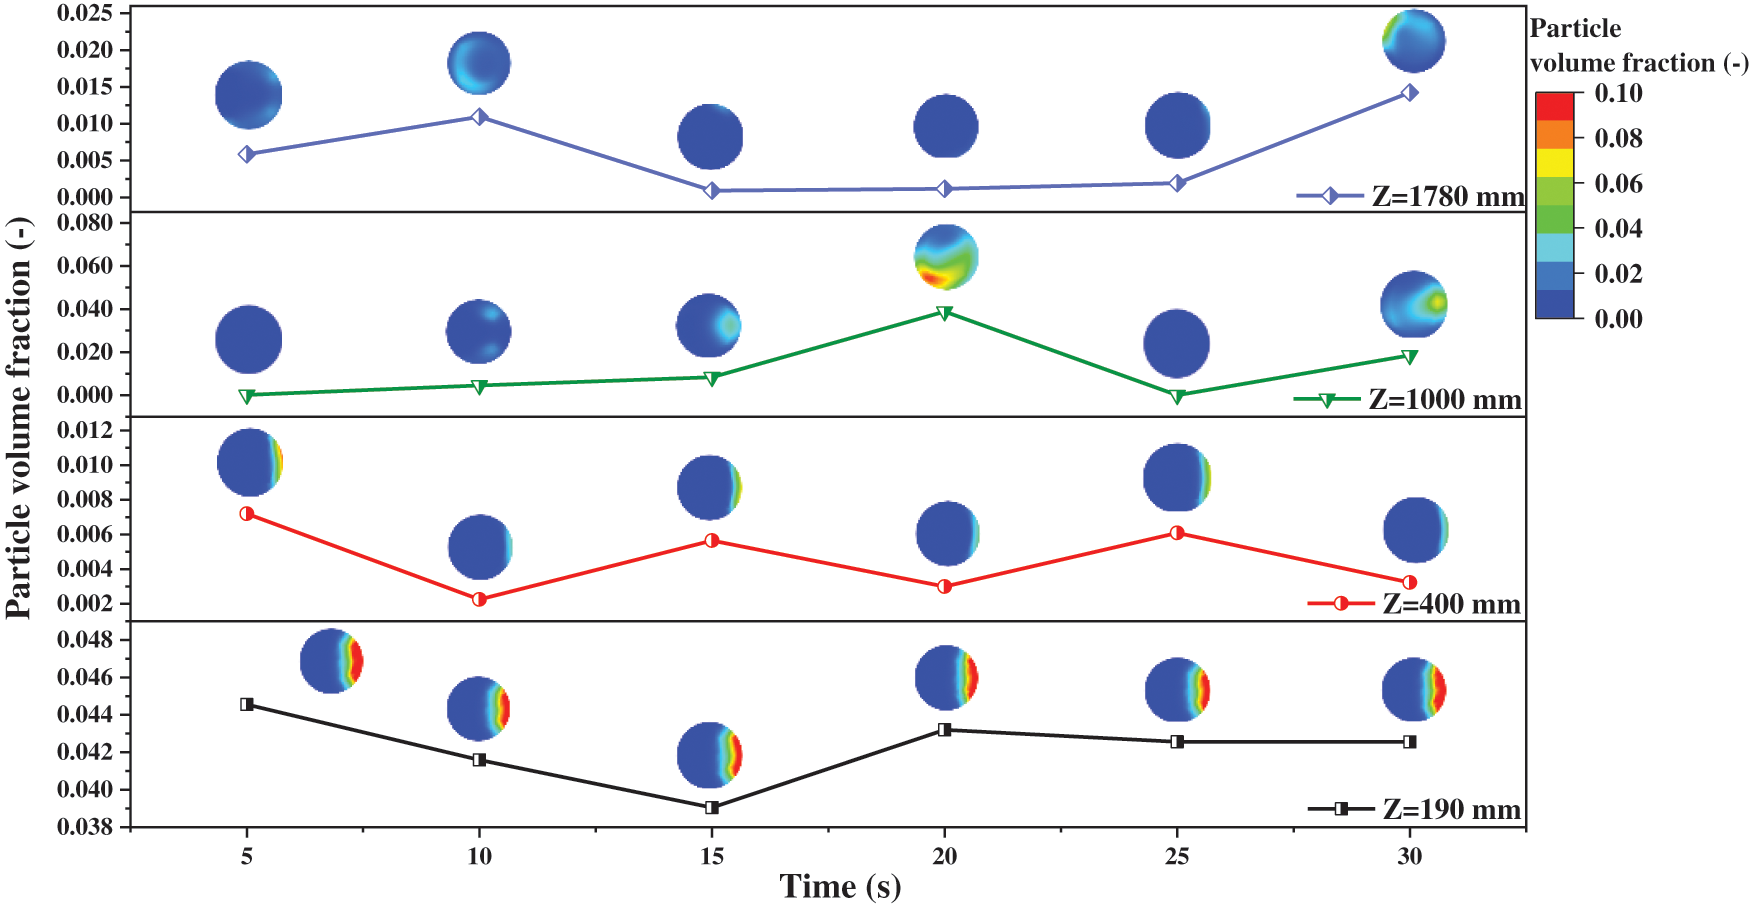
Figure 7: Distribution of particle volume fraction
Under the quasi-stable condition, the gas velocity distribution at the cross surfaces of different heights is shown in Fig. 8. In the sections whose heights are less than 150 mm, the mean gas velocity significantly decreases with the increase of height because the diameter of the riser gradually increases. In the zone above 150 mm, although the flow area of gas is affected to some extent due to the existence of solid particles, the volume share is very small. As a result of this, the mean gas velocity remains basically uniform. From the distribution of gas velocity in the crosses, it can be found that the minimum velocity is equal to zero and appears in the near wall region, which is caused by the no-slip boundary condition. The velocity distribution of each section is different. In the part with a height of less than 170 mm, maximum velocities are observed within the center of the sections with the values gradually decreasing outwards from it. Since there is no particle disturbance, the gas velocity distribution is relatively regular and presents the shape of a concentric circle. In the dense phase region, the value of velocity on the left is higher than that on the right. This is because the solid inlet on the right side has particles and the conveying gas velocity is 0.04 m/s which is much lower than the original gas velocity in the reactor. However, in the dilute phase region, the flow is fully developed, the phases of gas and solid are completely mixed, and the gas velocity distribution is gradually uniform. Due to the influence of particles, its evenness is not as good as that of the gas inlet section.
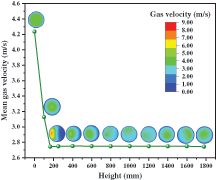
Figure 8: Gas velocity distribution under different heights
Fig. 9 shows the probability of gas velocity. In the figure, the variation range of each variable is evenly divided into 20 levels. It can be found that the variation range of gas velocity at the different height sections is different. At the gas inlet, the velocity is mostly distributed from 4 to 4.5 m/s with a probability of up to 60%, which is consistent with the given velocity at the gas inlet. In the reactor with a particle volume fraction of 0, the gas velocity distribution is quite uniform, and the probability of each level is between 5% and 15%. At Z = 185 mm, the variation range of gas velocity is wide, which is distributed between 0 and 10 m/s. However, the distribution range of the gas velocity is mainly from 0 to 2 m/s, and its probability reaches more than 50%. With the increase of reactor height, the distribution range of the gas velocity becomes narrower, and the main gas velocity increases obviously. This phenomenon indicates the gas-solid flow has been fully developed.
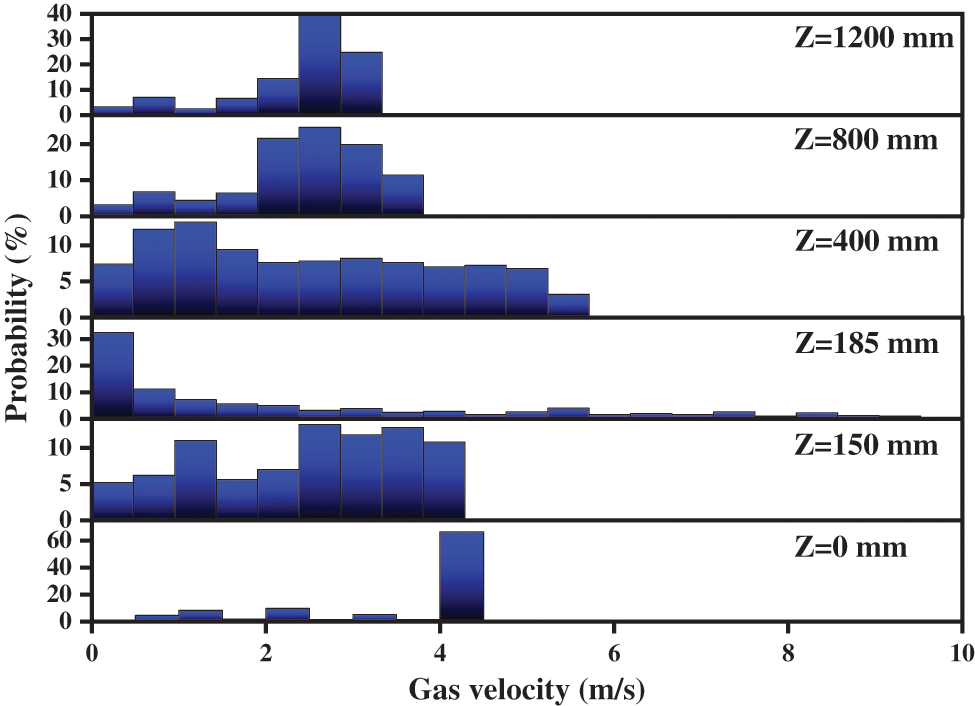
Figure 9: Probability distribution of gas velocity under different heights
3.3 Simulation under Variable Conditions
3.3.1 The Effects of Inlet Gas Velocity
Fig. 10 demonstrates the distribution of the mean pressure inside the reactor with different inlet gas velocities. Fig. 10a shows the pressure distribution when the solid particles are not added. It can be seen that the average pressure is linear with height. The higher the inlet gas velocity, the higher the overall pressure and the greater the pressure drop in the whole reactor. The reason is that the greater the gas velocity, the greater the resistance loss along the reactor and the greater the pressure drop.
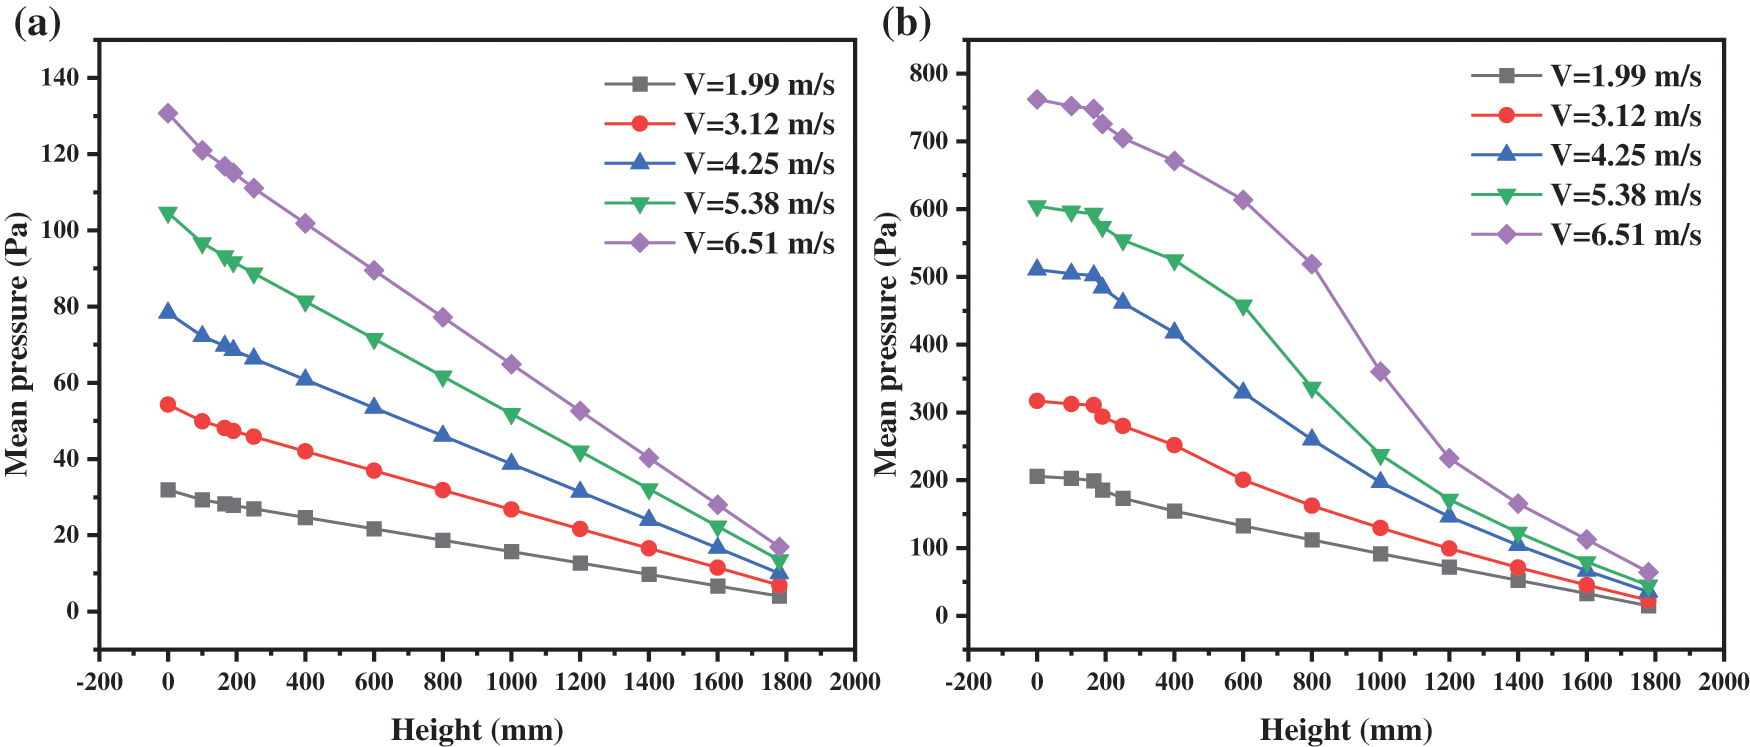
Figure 10: Pressure distribution with different inlet gas velocities: (a) Without particle; (b) With particle
Once adding the solid particles, the pressure distribution of different inlet gas velocities is exhibited in Fig. 10b. It can be seen that the pressure no longer shows a linear relationship with the change in height, but it still shows that the pressure decreases with the increase in height. When changing the gas inlet velocity, the overall pressure and pressure drop in the reactor increase with the increase in velocity. There are two causes of this phenomenon. One is the resistance loss along the way brought about by the change of the inlet gas, which leads to the increase of the gas pressure drop. The second is that the inlet gas velocity increases, the particle distribution in the reactor changes, and then affects the internal pressure. Comparing these two figures, the pressure distribution difference caused by the gas is only about 100 Pa, while the actual pressure distribution difference in Fig. 10b is up to 700 Pa. Therefore, the second factor is dominant.
In order to observe the variations of solid particles in the reactor, the curves of particle volume fraction as revealed in Fig. 11 are derived. The fluctuation amplitude of the particle volume fraction curve is different with the different inlet velocities, and the corresponding time average value under the steady state is also very different. As the inlet gas velocity increases, the value of particle volume fraction increases from 0.66% to 0.80%, and then decreases to 0.60%. The increase in solid content is bound to increase the internal pressure of the reactor. When the inlet gas velocity is large, the value of the mean particle volume fraction decreases, but the pressure fluctuates greatly, and the final mean pressure is also large.
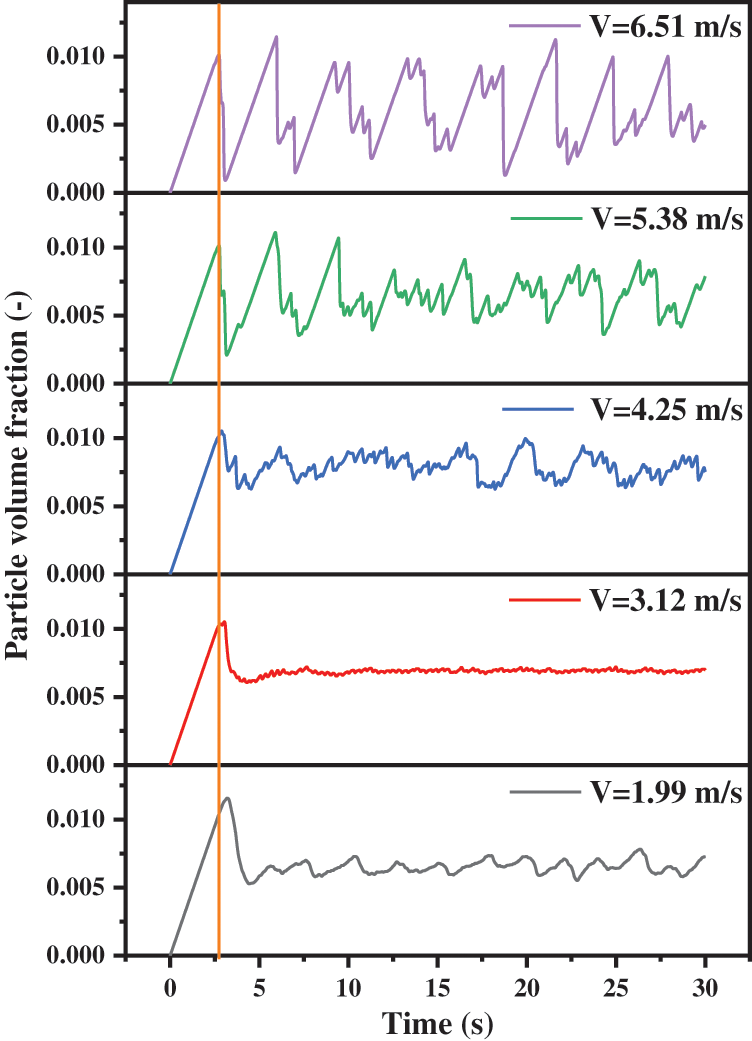
Figure 11: Particle volume fraction in the reactor with different inlet gas velocities
If the inlet gas velocity is too fast or too slow, the particle volume fraction in the reactor will fluctuate violently, and a large fluctuation means blockage. If the blockage is serious, and then the internal pressure fluctuates violently, the stable operation of the reactor will be affected. Compared with Figs. 12a and 12b, the blockage of the upper part of the reactor will occur under the condition of fast inlet gas velocity. Compared with Figs. 12c and 12d, the solid back-mixing is serious when the inlet gas velocity is slow, and the lower part of the reactor is blocked.

Figure 12: Particle volume fraction distribution: (a) V = 1.99 m/s; (b) V = 6.51 m/s; (c) V = 1.99 m/s; (d) V = 6.51 m/s
In terms of the collective trend, the particle volume fraction increases linearly with the increase of time at first, then decreases for a very short time, and follows steady fluctuations. By comparing the time nodes of the first peak at different speeds, there are some interesting discoveries. Under the conditions of high inlet gas velocities, they reach a peak at the same time. While the gas velocities are slow, the time nodes to reach the peak postpone with the velocities decreasing. From the analysis of the volume fraction value corresponding to the extreme point under each gas velocity, the smaller the gas velocity, the larger the corresponding value. In other words, there are more solid particles in the reactor. Fig. 13 presents the mean solid volume fractions of different cross surfaces below the solid inlet. After the solid particles enter the reactor, they initially fall down for a certain distance under the influence of gravity, and are carried upward by the gas. Solid particles appear on the different sections consequently. Especially when the inlet gas velocity is 1.99 m/s, the solid particles can fall to the height of 100 mm. This increases the movement distance and residence time of solid particles in the reactor. As a result, the volume fraction reaches the maximum value later and the maximum value is larger.
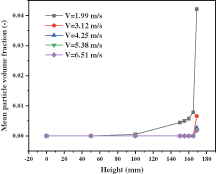
Figure 13: Particle volume fraction with different inlet gas velocities
Through the above analysis, taking the operation stability of the device and the heat and mass transfer requirements of the reaction into account, it is considered that the gas velocity of 4.25 m/s is the most appropriate.
3.3.2 The Effects of Operating Temperature
Fig. 14a shows the axial distribution of the mean pressure at different operating temperatures. Increasing the operating temperature reduces the pressure in the reactor. This trend is particularly significant in the dense phase area. According to the previous analysis, the pressure distribution in the reactor is mainly affected by the following two factors. Firstly, different temperatures lead to changes in the physical characteristics of the gas, resulting in differences in pressure distribution. Secondly, the changes in temperature affect the interphase force between the gas phase and solid phase, inducing a great impact on the distribution of solid particles, and then on the pressure distribution.
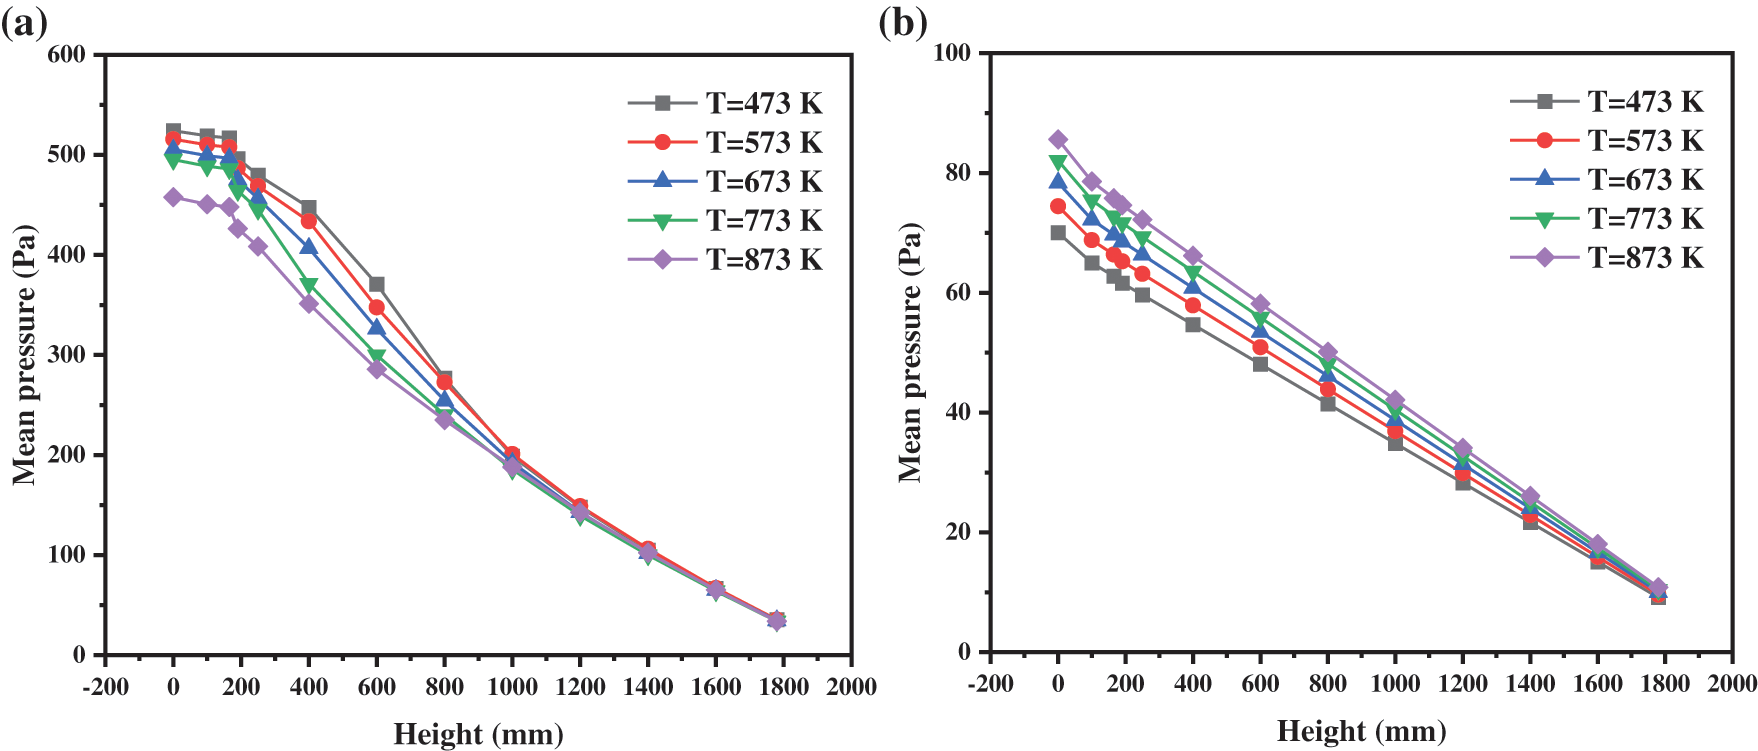
Figure 14: Pressure distribution with different operating temperatures: (a) With particles; (b) Without particles
Fig. 14b indicates the mean pressure under different heights without solid particles in the reactor. At a certain operating temperature, the pressure has a perfect linear relationship with the height. Comparing the pressure distribution curves under different operating temperatures, increasing temperature brings about increases in overall pressure in the reactor. The reasons are as follows:
According to Bernoulli equation:
where
Based on the above analysis, we further consider the second factor. In order to explore the influences of operating temperature on the particle volume fraction in the reactor, the curves in Fig. 15 are drawn. When the operating temperature increases, the gas molecules become active, the volume expands and the molecular thermal motion intensifies. So, the density of the gas decreases and the viscosity increases. The research by Che [40] illustrated that the gas density decreases and the carrying capacity of gas decreases while the gas viscosity increases and the carrying capacity increases. Therefore, the impacts of temperature changes are extremely complex.
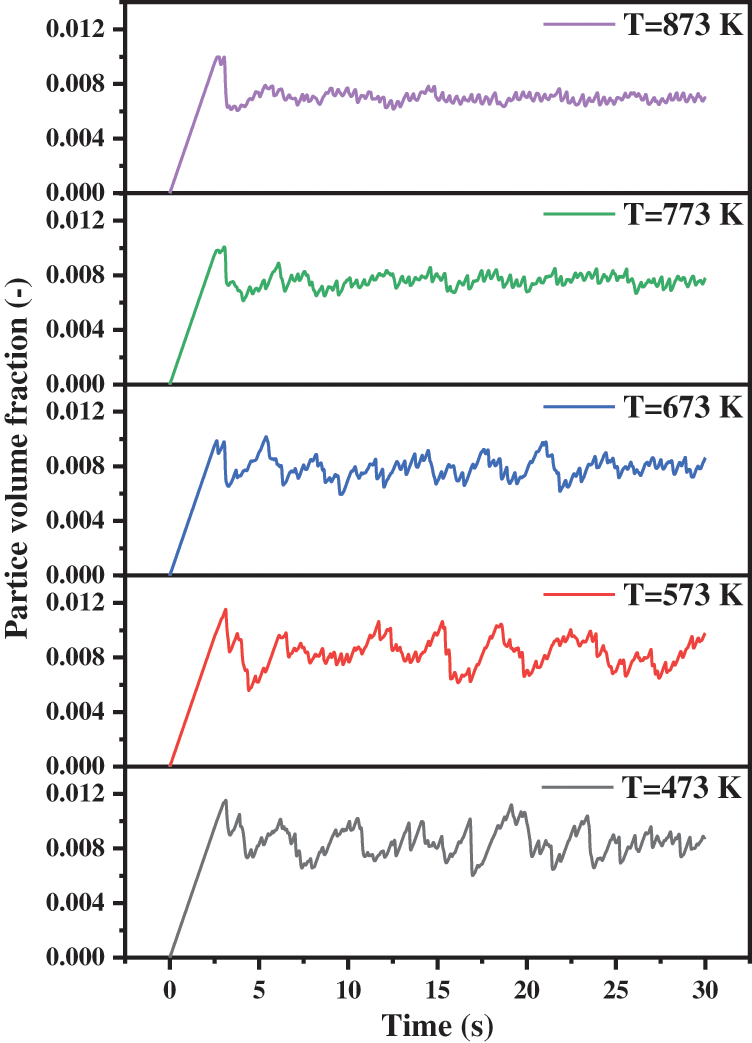
Figure 15: Particle volume fraction with different operating temperatures
When the temperature rises from 473 to 873 K, the fluctuation range of particle volume fraction decreases gradually. Under the high temperature operating conditions, this trend is more obvious. A high operating temperature will keep the reactor operating under stable condition. By calculating the volume fraction of solid particles in the reactor, we find that the increase in temperature strictly reduces the values, which are 0.843%, 0.835%, 0.786%, 0.760% and 0.700%, respectively. The above observations indicate that with the increase in temperature, the ability of gas to carry solid particles will enhance. Thus, more solid particles will be carried away from the reactor, and hence the outflow process of particles will become smooth. Considering the opposite effects of viscosity and density on the gas carrying capacity, we can conclude that viscosity is the main factor relative to density. The larger the particle volume fraction in the reactor, the more solid particles and the greater the internal pressure will be. This changing trend is consistent with that shown in Fig. 14a.
Therefore, it can be concluded that the second factor plays the dominant role in affecting the pressure distribution. In the dilute phase, there are few particles, and the influence on pressure is also very weak, which will offset the influence caused by the change in gas density. Thus, the pressure distribution in this region is almost the same. A large number of particles gather in the dense phase, and its influence on the pressure distribution is far greater than that of the gas density. For this reason, the changing trend of Fig. 14a is presented. At low operating temperatures, the gas carrying capacity decreases and the internal particle volume fraction increases, which poses a certain threat to the stability of the operation. At high operating temperatures, the device operates stably, but the following reaction cannot be entirely carried out due to the small amount of solid retention. In conclusion, it is considered that the optimal operating temperature is about 673 K.
3.3.3 The Effects of Particle Diameter
Fig. 16 shows the characteristics of the particle volume fraction distribution near the solid inlet with changes in particle diameter. These graphics are drawn according to the data at the end of the operation, and the particle sizes are 0.04, 0.06, 0.08, 0.10 and 0.12 mm, respectively. The solid inlet is on the left and the gas inlet is at the bottom, so the particles gradually become sparse from left to right and from bottom to top. Comparing these five contours, the particle distribution has an obvious downward trend. The larger the particle size is, the longer the particle moves downward. This is because when the particle density remains unchanged, its mass, which affects the inertial force, is directly proportional to the volume. Inertia will maintain the original motion trend of particles to a certain extent. As exhibited in the figure, there are apparently more areas with a volume fraction greater than 0.2 with a decrease of the particle diameter. Fine particles are easier to gather together than the coarse particles under the action of surface tension [41–43].
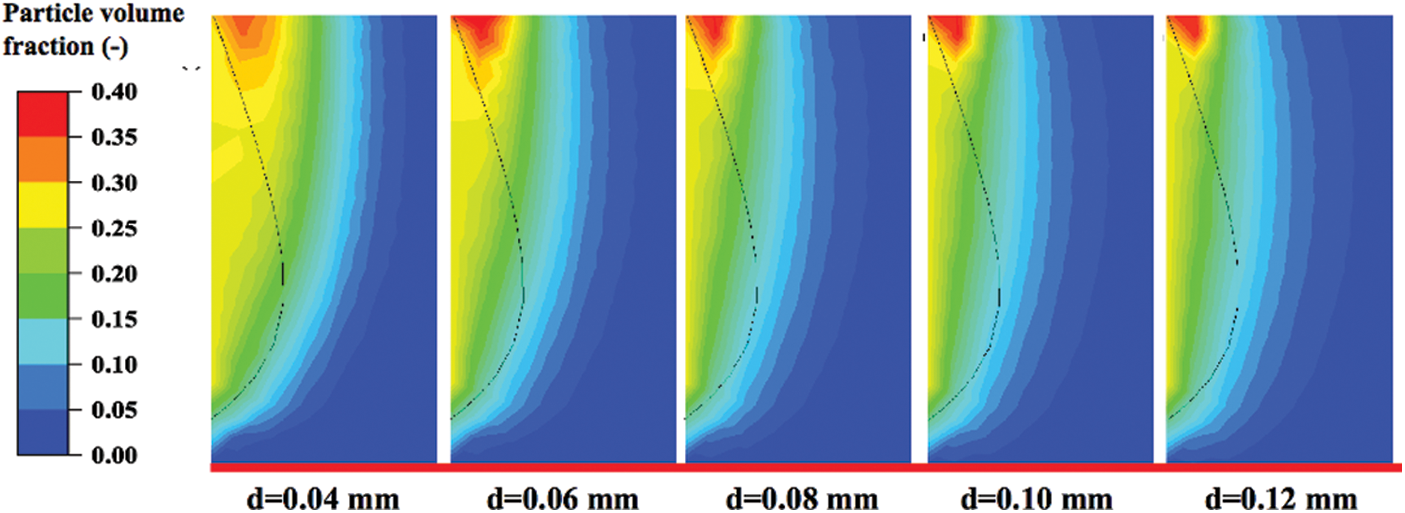
Figure 16: Particle volume fraction around the solid inlet
The effects of the particle diameter on the pressure and volume fraction are shown in Fig. 17. On the basis of previous analysis, the pressure fluctuation at the bottom of the reactor is the largest, so there is the greatest possibility of instability. Fig. 17a selects the section with Z = 0 mm as the research object and compares the pressure fluctuations under different particle sizes. With the particle diameter increasing from 0.04 to 0.12 mm, the pressure fluctuation range increases from 250 to 20000 Pa. It should be noted that when the particle diameter is greater than 0.10 mm, the pressure has a negative value, which is very unfavorable to the device. Fig. 17b reports the solid volume fraction in the whole reactor. When the particle diameter changes from 0.04 to 0.12 mm, the fluctuation amplitude of the particle volume fraction increases gradually.
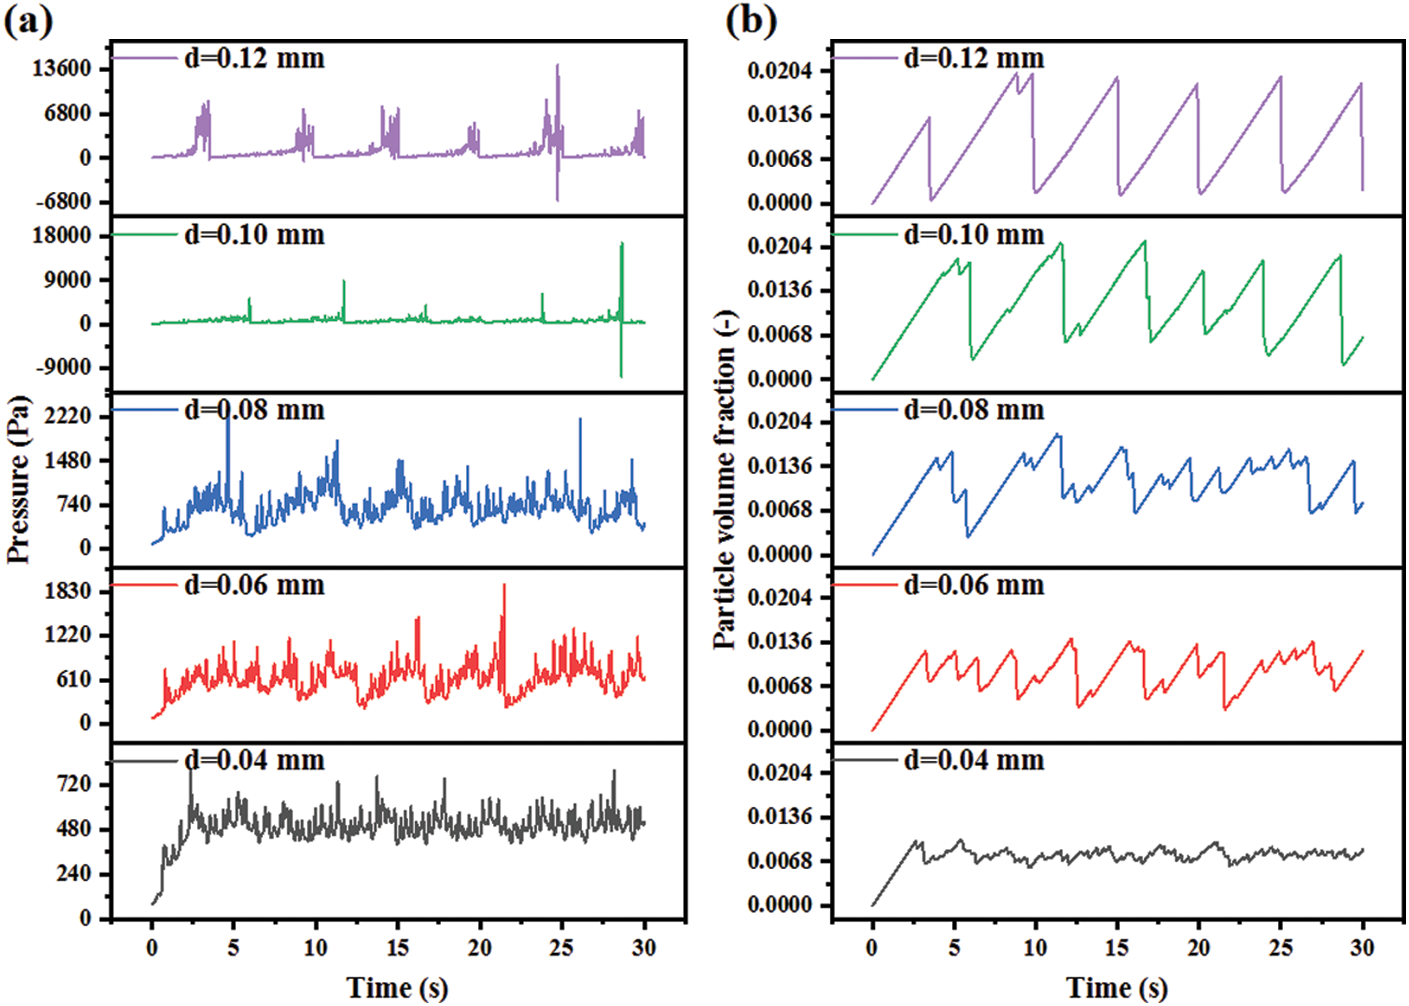
Figure 17: Parameter distribution with different particle diameters: (a) Pressure; (b) Particle volume fraction
From the previous analysis, we can know that the change in particle volume fraction indicates internal blockage to a certain extent. Under working conditions of large particle diameters, the lower straight pipe is more likely to be blocked. In addition, the particle volume fraction in the reactor under the different quasi-stable conditions is 0.786%, 0.901%, 1.211%, 1.239% and 0.989%, respectively. In other words, the mean particle volume fraction in the reactor increases at the beginning and then decreases. Under conditions of small particle diameters, the reactor operates smoothly so that the mean particle volume fractions can effectively reflect the residence time of particles. When the values of particle volume fraction are high, the CO methanation reaction is very thorough and the CH4 selectivity is very high as well [28]. Under conditions of large particle diameters, the reactor cannot operate smoothly and, which is a wrong condition.
The above analysis will draw some useful conclusions. Choosing particles with large diameters will lead to two hidden dangers. On the one hand, the solid back-flow seems to occur, which easily blocks the reactor and destroys its normal operation. On the other hand, the internal pressure fluctuation increases significantly, and sometimes negative pressure appears, which will further threaten the stability of the internal operation of the reactor. When choosing the smaller particles, they can be easy to gather together and take away from the reactor. Besides, there are a small amount of particles in the reactor, which is very unfavorable for the subsequent reaction. Considering the influences of the above factors, when the particle diameter is about 0.06 mm, it is the most suitable for the methanation reaction.
This work is conducive to achieving the full utilization of the OSW and converting it into green energy. Thus, a three-dimensional model of the fluidized bed methanation reactor is established. The comprehensive model exhibits a good prediction of the behaviors of multiphase flow under different working conditions. From the simulation results, the following conclusions can be drawn:
1) In the area above the solid inlet, the gas phase and the solid phase are fully mixed in the vertical direction. The fluctuation amplitudes of pressure and particle volume gradually decrease, from 398.76 to 74.47 Pa and from 0.08 to 0.01, alternatively. Disturbed by the solid particles, the variation range of gas velocity near the solid inlet is very wide while its range becomes narrower and narrower with the increase in height. This shows the full development of the multiphase flow.
2) The influences of the inlet gas velocity are complex in terms of the particle volume fraction, the fluctuation amplitude of pressure, the location of the blockage, and the residence time of particles. Under the conditions of high gas velocities, the turning at the upper part of the reactor is easy to be blocked, resulting in unstable operation. When the inlet gas velocity decreases, the minimum height that catalyst particles can reach decreases from 169 to 100 mm, which is easy to block the straight pipe at the lower part of the reactor.
3) The operating temperature changes the density and viscosity of the gas, which will affect the gas carrying capacity. And viscosity plays the dominant role. Under the conditions of high temperatures, the increase of the viscosity makes the particles evenly taken away from the reactor, and the particle volume fraction decreases to 0.007. On the other hand, at a lower temperature, the gas carrying capacity is too poor to keep stable operation, and hence the particle volume fraction in the reactor will become larger.
4) The particle size affects the back mixing and aggregation of particles. With the increase of particle diameter from 0.04 to 0.12 mm, the pressure fluctuation range increases from 250 to 20000 Pa. A particle diameter greater than 0.10 mm will lead to abnormal operation because of the serious back-mixing, which is unfavorable to the device. In addition, a decrease in the particle diameter contributes to the loss of particles in the reactor as a result of agglomeration.
Funding Statement: This work was supported by the National Key Research and Development Program of China [Grant No. 2019YFC1906802].
Conflicts of Interest: The authors declare that they have no conflicts of interest to report regarding the present study.
References
1. Xiao, R., Awasthi, M. K., Li, R., Park, J., Pensky, S. M. et al. (2017). Recent developments in biochar utilization as an additive in organic solid waste composting: A review. Bioresource Technology, 246, 203–213. https://doi.org/10.1016/j.biortech.2017.07.090 [Google Scholar] [PubMed] [CrossRef]
2. Kabir, S. B., Khalekuzzaman, M., Bashirul Islam, M., Refat Hossain, M. (2022). Performance optimization of organic solid waste and peat co-liquefaction mechanism for processing sustainable biocrude. Fuel Processing Technology, 231, 107234. https://doi.org/10.1016/j.fuproc.2022.107234 [Google Scholar] [CrossRef]
3. Greco, A., Ferrari, F., Striani, R., Carola, E. C. (2019). Biocompatible blends based on poly (vinyl alcohol) and solid organic waste. Journal of Renewable Materials, 7(10), 1023–1035. https://doi.org/10.32604/jrm.2019.07778 [Google Scholar] [CrossRef]
4. Wang, Y., Bu, H., Zhao, H., Liu, K. (2021). Performance evaluation of inexpensive Cu/Fe-based oxygen carriers in chemical looping gasification of coal. Energy & Fuels, 35(19), 15513–15524. https://doi.org/10.1021/acs.energyfuels.1c01800 [Google Scholar] [CrossRef]
5. Luo, J., Chen, D., Yue, X., Feng, Y., Huang, Z. (2021). Study on syngas methanation over municipal solid waste char supported Ni catalyst. Fuel, 303(8), 121222. https://doi.org/10.1016/j.fuel.2021.121222 [Google Scholar] [CrossRef]
6. Page, F. J. (1975). Torrax–A system for recovery of energy from solid waste. Nasa Sti/Recon Technical Report A, 77, 199–204. [Google Scholar]
7. Tardiff, K. (1980). Environmental assessment of a waste-to-energy process: Union carbide purox (trademark) system, vol. 9. Cambridge University Press. [Google Scholar]
8. Sanlisoy, A., Carpinlioglu, M. O. (2017). A review on plasma gasification for solid waste disposal. International Journal of Hydrogen Energy, 42(2), 1361–1365. https://doi.org/10.1016/j.ijhydene.2016.06.008 [Google Scholar] [CrossRef]
9. Freda, C., Cornacchia, G., Romanelli, A., Valerio, V., Grieco, M. (2018). Sewage sludge gasification in a bench scale rotary kiln. Fuel, 212(67), 88–94. https://doi.org/10.1016/j.fuel.2017.10.013 [Google Scholar] [CrossRef]
10. Baláš, M., Milčák, P., Elbl, P., Lisý, M., Lachman, J. et al. (2022). Gasification of fermentation residue in a fluidised-bed gasifier. Energy, 245(23), 123211. https://doi.org/10.1016/j.energy.2022.123211 [Google Scholar] [CrossRef]
11. Materazzi, M., Grimaldi, F., Foscolo, P. U., Cozens, P., Taylor, R. et al. (2017). Analysis of syngas methanation for bio-SNG production from wastes: kinetic model development and pilot scale validation. Fuel Processing Technology, 167, 292–305. [Google Scholar]
12. Rönsch, S., Schneider, J., Matthischke, S., Schlüter, M., Götz, M. et al. (2016). Review on methanation–From fundamentalsto current projects. Fuel, 166, 276. [Google Scholar]
13. Neubert, M., Treiber, P., Krier, C., Hackel, M., Hellriegel, T. et al. (2017). Influence of hydrocarbons and thiophene on catalytic fixed bed methanation. Fuel, 207, 253–261. [Google Scholar]
14. Ngo, S. I., Lim, Y., Lee, D., Go, K. S., Seo, M. W. (2020). Flow behaviors, reaction kinetics, and optimal design of fixed- and fluidized-beds for CO2 methanation. Fuel, 275, 117886. [Google Scholar]
15. Ghaib, K., Nitz, K., Ben-Fares, F. (2016). Chemical methanationof CO2: A review. ChemBioEng Reviews, 3, 266–275. [Google Scholar]
16. Scharl, V., Fischer, F., Herrmann, S., Fendt, S., Spliethoff, H. (2020). Applying reaction kinetics to pseudohomogeneous methanation modeling in fixed-bed reactors. Chemical Engineering & Technology, 43, 1224–1233. [Google Scholar]
17. Zhang, L., Li, Z., Yang, S., Duan, F. (2021). Dried sludge reburning blended with calcium magnesium acetate addition in a fluidized bed combustor. Waste Management, 123, 120–130. [Google Scholar] [PubMed]
18. Sun, L., Luo, K., Fan, J. (2017). Numerical simulation of CO methanation for the production of synthetic natural gas in a fluidized bed reactor. Energy & Fuels, 31, 10267–10273. [Google Scholar]
19. Kofu, K., Kobayashi, K., Shimada, Y., Harada, M. (2022). Promotion effect of particle fluidization with ultrasonic vibration. Powder Technology, 400, 117265. [Google Scholar]
20. Nam, H., Kim, J., Kim, H., Kim, M. J., Jeon, S. et al. (2021). CO2 methanation in a bench-scale bubbling fluidized bed reactor using Ni-based catalyst and its exothermic heat transfer analysis. Energy, 214, 118895. [Google Scholar]
21. Gao, J., Wang, Y., Ping, Y., Hu, D., Xu, G. et al. (2012). A thermodynamic analysis of methanation reactions of carbon oxides for the production of synthetic natural gas. RSC Advances, 2, 2358–2368. [Google Scholar]
22. Coppola, A., Massa, F., Salatino, P., Scala, F. (2019). Fluidized bed CaO hydration-dehydration cycles for application to sorption-enhanced methanation. Combustion Science and Technology, 191, 1724–1733. [Google Scholar]
23. Liu, J., Cui, D., Yu, J., Su, F., Xu, G. (2019). Syngas methanation over spray-granulated Ni/Al2O3 catalyst in a laboratory transport-bed reactor. Chemical Engineering & Technology, 42, 129–136. [Google Scholar]
24. Reinking, Z., Whitty, K. J., Lighty, J. S. (2022). Design of a gas-solid-solid separator to remove ash from circulating fluidized bed reactors. Powder Technology, 404, 117467. [Google Scholar]
25. Chishty, M. A., Umeki, K., Risberg, M., Wingren, A., Gebart, R. (2021). Numerical simulation of a biomass cyclone gasifier: Effects of operating conditions on gasifier performance. Fuel Processing Technology, 218, 106861. [Google Scholar]
26. Zhou, H., Xie, T., You, F. (2018). On-line simulation and optimization of a commercial-scale shell entrained-flow gasifier using a novel dynamic reduced order model. Energy, 149(1), 516–534. https://doi.org/10.1016/j.energy.2018.02.031 [Google Scholar] [CrossRef]
27. Rabinovich, O., Tsytsenka, A., Kuznetsov, V., Moseenkov, S., Krasnikov, D. (2017). A model for catalytic synthesis of carbon nanotubes in a fluidized-bed reactor: Effect of reaction heat. Chemical Engineering Journal, 329(11), 305–311. https://doi.org/10.1016/j.cej.2017.06.001 [Google Scholar] [CrossRef]
28. Sun, L., Luo, K., Fan, J. (2021). Three-dimensional simulation of the methanation process in a circulating fluidized-bed reactor. Industrial & Engineering Chemistry Research, 60(45), 16417–16429. https://doi.org/10.1021/acs.iecr.1c03107 [Google Scholar] [CrossRef]
29. Sun, L., Luo, K., Fan, J. (2018). Numerical investigation on methanation kinetic and flow behavior in full-loop fluidized bed reactor. Fuel, 231, 85–93. https://doi.org/10.1016/j.fuel.2018.05.042 [Google Scholar] [CrossRef]
30. Alobaid, F., Almohammed, N., Farid, M. M., May, J., Rößger, P. et al. (2021). Progress in CFD simulations of fluidized beds for chemical and energy process engineering. Progress in Energy and Combustion Science, 91, 100930. https://doi.org/10.1016/j.pecs.2021.100930 [Google Scholar] [CrossRef]
31. Luo, H., Zhang, C., Sun, Z., Zhu, J. (2021). Numerical investigation of hydrodynamics in liquid-solid circulating fluidized beds under different operating conditions. Advanced Powder Technology, 32(4), 1047–1059. https://doi.org/10.1016/j.apt.2021.02.001 [Google Scholar] [CrossRef]
32. Sun, Z., Zhang, C., Zhu, J. (2022). Comparisons of particle clustering phenomenon between gas-solids high-density and low-density circulating fluidized bed risers via numerical study. Powder Technology, 397(3), 117009. https://doi.org/10.1016/j.powtec.2021.11.053 [Google Scholar] [CrossRef]
33. Wang, X., Shao, Y., Jin, B. (2021). Spatiotemporal statistical characteristics of multiphase flow behaviors in fuel reactor for separated-gasification chemical looping combustion of solid fuel. Chemical Engineering Journal, 412, 128575. https://doi.org/10.1016/j.cej.2021.128575 [Google Scholar] [CrossRef]
34. Wang, X., Jin, B., Zhang, Y., Zhang, Y., Liu, X. (2013). Three dimensional modeling of a coal-fired chemical looping combustion process in the circulating fluidized bed fuel reactor. Energy & Fuels, 27(4), 2173–2184. https://doi.org/10.1021/ef302075n [Google Scholar] [CrossRef]
35. Zhang, K., Wang, S., He, Y. (2021). Bubble-induced mesoscale drag model for the simulation of gas-solid bubbling fluidization. Chemical Engineering Science, 246(4), 116990. https://doi.org/10.1016/j.ces.2021.116990 [Google Scholar] [CrossRef]
36. Wang, S., Liu, G., Lu, H., Chen, J., He, Y. et al. (2011). Fluid dynamic simulation in a chemical looping combustion with two interconnected fluidized beds. Fuel Processing Technology, 92(3), 385–393. https://doi.org/10.1016/j.fuproc.2010.09.032 [Google Scholar] [CrossRef]
37. Zhou, L. (2010). Advances in studies on two-phase turbulence in dispersed multiphase flows. International Journal of Multiphase Flow, 36(2), 100–108. https://doi.org/10.1016/j.ijmultiphaseflow.2009.02.011 [Google Scholar] [CrossRef]
38. Cai, M., Tian, Z., Liu, Z., Liu, B. (2022). A computational fluid dynamics model coupled with ethylene polymerization kinetics for fluidized bed polyethylene reactor. Powder Technology, 407, 117647. https://doi.org/10.1016/j.powtec.2022.117647 [Google Scholar] [CrossRef]
39. Lun, C. K. K., Savage, S. B., Jeffrey, D. J., Chepurniy, N. (1984). Kinetic theories for granular flow: Inelastic particles in couette flow and slightly inelastic particles in a general flowfield. Journal of Fluid Mechanics, 140, 223–256. https://doi.org/10.1017/S0022112084000586 [Google Scholar] [CrossRef]
40. Che, H. (2019). Numerical simulation of gas-solid flow characteristic and methanation process in high-flux circulating fluidized bed (Master Thesis). Xinjiang University, China. [Google Scholar]
41. Yue, Q., Hu, Z., Wu, Z., Long, H., Meng, Q. (2018). Visualization of collision and aggregation behavior of particles simulating movement of inclusions in molten steel. Journal of Iron and Steel Research International, 25(2), 173–180. https://doi.org/10.1007/s42243-018-0016-4 [Google Scholar] [CrossRef]
42. Filla, M., Massimilla, L., Vaccaro, S. (1983). Gas jets in fluidized beds: The influence of particle size, shape and density on gas and solids entrainment. International Journal of Multiphase Flow, 9(3), 259–267. https://doi.org/10.1016/0301-9322(83)90105-2 [Google Scholar] [CrossRef]
43. Mao, L., Xia, D., Wang, X., Fan, Y., He, Y. (2020). Dynamic characteristics of production pipe strings for gas storage wells. Journal of Energy Storage, 30(4), 101450. https://doi.org/10.1016/j.est.2020.101450 [Google Scholar] [CrossRef]
Cite This Article
 Copyright © 2023 The Author(s). Published by Tech Science Press.
This work is licensed under a Creative Commons Attribution 4.0 International License , which permits unrestricted use, distribution, and reproduction in any medium, provided the original work is properly cited.
 Downloads
 Citation Tools