
 Submit a Paper
 Propose a Special lssue
 Open Access
ARTICLE

Microwave-Assisted Synthesis, Characterization, and Performance Assessment of Lemongrass-Derived Activated Carbon for Removal of Fe and Mn from Acid Mine Drainage
1 Chemical Engineering Department, Engineering Faculty, Lambung Mangkurat University, Banjarbaru, 70714, Indonesia
2 Department of Chemical Engineering, Institut Teknologi Sepuluh Nopember, Surabaya, 60111, Indonesia
* Corresponding Author: Lailan Ni`mah. Email:
Journal of Renewable Materials 2025, 13(11), 2169-2190. https://doi.org/10.32604/jrm.2025.02025-0044
Received 21 February 2025; Accepted 21 April 2025; Issue published 24 November 2025
 View Full Text
 Download PDF
Abstract
This study evaluates the effectiveness of microwave technology in producing activated carbon from lemongrass waste, an underutilized agricultural byproduct. Microwave-assisted production offers faster heating, lower energy consumption, and better process control compared to conventional methods. It also enhances pore development, resulting in larger, cleaner, and more uniform pores, making the activated carbon more effective for adsorption. The microwave-assisted process significantly accelerates production, reducing the required time to just 10 min at a power of 400 W. Activated carbon derived from lemongrass waste at 400 W exhibits a water absorption capacity of 7.88%, ash content of 5.51%, volatile matter of 6.96%, fixed carbon of 75.79%, and an iodine number of 790.97 g iodine/100 g. Scanning Electron Microscopy (SEM) analysis confirms the formation of larger, cleaner, and smoother pores, contributing to increased porosity and pore size. Additionally, Energy Dispersive X-ray (EDX) analysis identifies key elements in the lemongrass waste, with carbon being the dominant component at 75.57%. The Brunauer-Emmett-Teller (BET) surface area is measured at 818 m2/g, with an average pore diameter of 1.91 nm, classifying the material as microporous. The activated carbon, meeting quality standards, is applied as an adsorbent in acid mine drainage (AMD) treatment, with varying mass concentrations introduced into wastewater samples. Adsorption tests confirm that the microparticle carbon adsorption profile follows the Langmuir model, indicating a monolayer adsorption process. Furthermore, adsorption kinetics were analyzed over different time intervals, revealing that the process aligns with both pseudo-first-order (PFO) and pseudo-second-order (PSO) models, with all cases predominantly following the PFO rate equation.Graphic Abstract
Keywords
Mining operations significantly impact the environment, leading to various hazards and ecological changes. One major issue caused by poor mining management is AMD, which occurs when sulfide minerals are exposed to air and water, triggering geochemical reactions. AMD is particularly concerning due to its low pH and high concentrations of heavy metals and sulfates. Common metals found in AMD include iron, manganese, copper, cadmium, lead, and nickel. Its excessive acidity and metal content can contaminate surface water, groundwater, and soil, posing risks to plants, wildlife, aquatic organisms, and human health. Given its severity, AMD remains a critical challenge in the mining industry, underscoring the need for effective methods to reduce dissolved heavy metals [1].
Various methods have been developed to treat wastewater contaminated with heavy metals, including precipitation, ion exchange, membrane technology, electrochemical processes, electrodialysis, biological treatment, and adsorption. Among these, adsorption is the most widely preferred due to its affordability, high efficiency, and cost-effectiveness [2].
Adsorption is a process in which specific components of a fluid solution accumulate on the surface of a solid material, known as an adsorbent, enabling the separation of different components in gaseous or liquid solutions [3]. Activated carbon is one of the most commonly used adsorbents for removing heavy metal ions from wastewater, utilizing surface chemistry, electrostatic interactions, and chelation. In surface chemistry, functional groups such as hydroxyl (-OH), carbonyl (C = O), and carboxyl (-COOH) facilitate chemical adsorption by forming covalent bonds or other attractive forces with heavy metal ions, enhancing adsorption capacity. Electrostatic interactions depend on pH; negatively charged activated carbon attracts positively charged metal ions (e.g., Pb2+, Cd2+, Hg2+), with higher pH levels further strengthening this effect by reducing the carbon’s positive charge. In chelation, specific functional groups act as ligands, forming stable complexes with metal ions, increasing their retention while reducing solubility and mobility in water. These combined mechanisms make activated carbon highly effective in removing heavy metals from water and industrial waste [4]. Additionally, it efficiently adsorbs organic compounds [5,6] and remains cost-effective, as it can be produced from biomass waste materials [7,8].
A variety of biomaterials containing cellulose or hemicellulose can be used to produce activated carbon. Cellulose, naturally found in plants, vegetables, and fruits, is primarily located in plant cell walls, particularly in stems, stalks, and woody materials [9]. Agricultural waste, such as lemongrass plant waste (Cymbopogon sp.), is a natural resource that can be converted into activated carbon.
Lemongrass waste, including its leaves, is an often-unused organic byproduct. Rich in hemicellulose, lignocellulose, cellulose, flavonoids, terpenoids, and essential oils, it serves as a viable carbon source [10]. Consequently, agricultural byproducts from lemongrass plants (Cymbopogon sp.) hold significant potential for conversion into activated carbon. Despite this, lemongrass waste remains largely underutilized, particularly in activated carbon production and the application of microwave technology in its processing. Therefore, this study aims to repurpose lemongrass waste as a raw material for activated carbon production.
Activated carbon is a processed form of carbon with a high adsorption capacity for substances in both liquid and vapor phases. It can be derived from carbon-rich materials of either organic or inorganic origin [11]. The activation process occurs through chemical or physical methods. Chemical activation involves immersing charcoal in an activating agent, while physical activation is achieved by heating it with nitrogen injection at high temperatures. This process enhances pore formation and increases porosity, thereby improving adsorption capacity [12]. Several activation methods are commonly used in activated carbon production, including:
a) Chemical Activation: Involves breaking carbon bonds in organic compounds using chemical agents.
b) Physical Activation: Utilizes heat, steam, and CO2 to break carbon bonds in organic compounds.
Microwave technology can also be employed in activated carbon production. According to Menéndez, etc. [13], microwave heating is a promising alternative to conventional high-temperature methods. Microwaves were first developed in 1952 and gained popularity as household cooking appliances in the 1980s and 1990s due to their fast cooking times and energy efficiency. Over time, their domestic use facilitated their adoption in industrial applications, including material processing, which gained traction before the 1990s [13]. Microwave heating offers several advantages over conventional methods, including faster and more controlled heating, selective energy absorption, smaller equipment size, and reduced waste. Also known as dielectric heating, this process converts electromagnetic energy into heat, allowing for deep material penetration and volumetric heating, unlike external heat sources [14]. Microwave-assisted activated carbon exhibits improved characteristics, such as a higher pore count, larger pore size, and cleaner pores compared to untreated lemongrass waste. Additionally, the uniform activation achieved through microwave heating enhances its effectiveness in adsorption process [15].
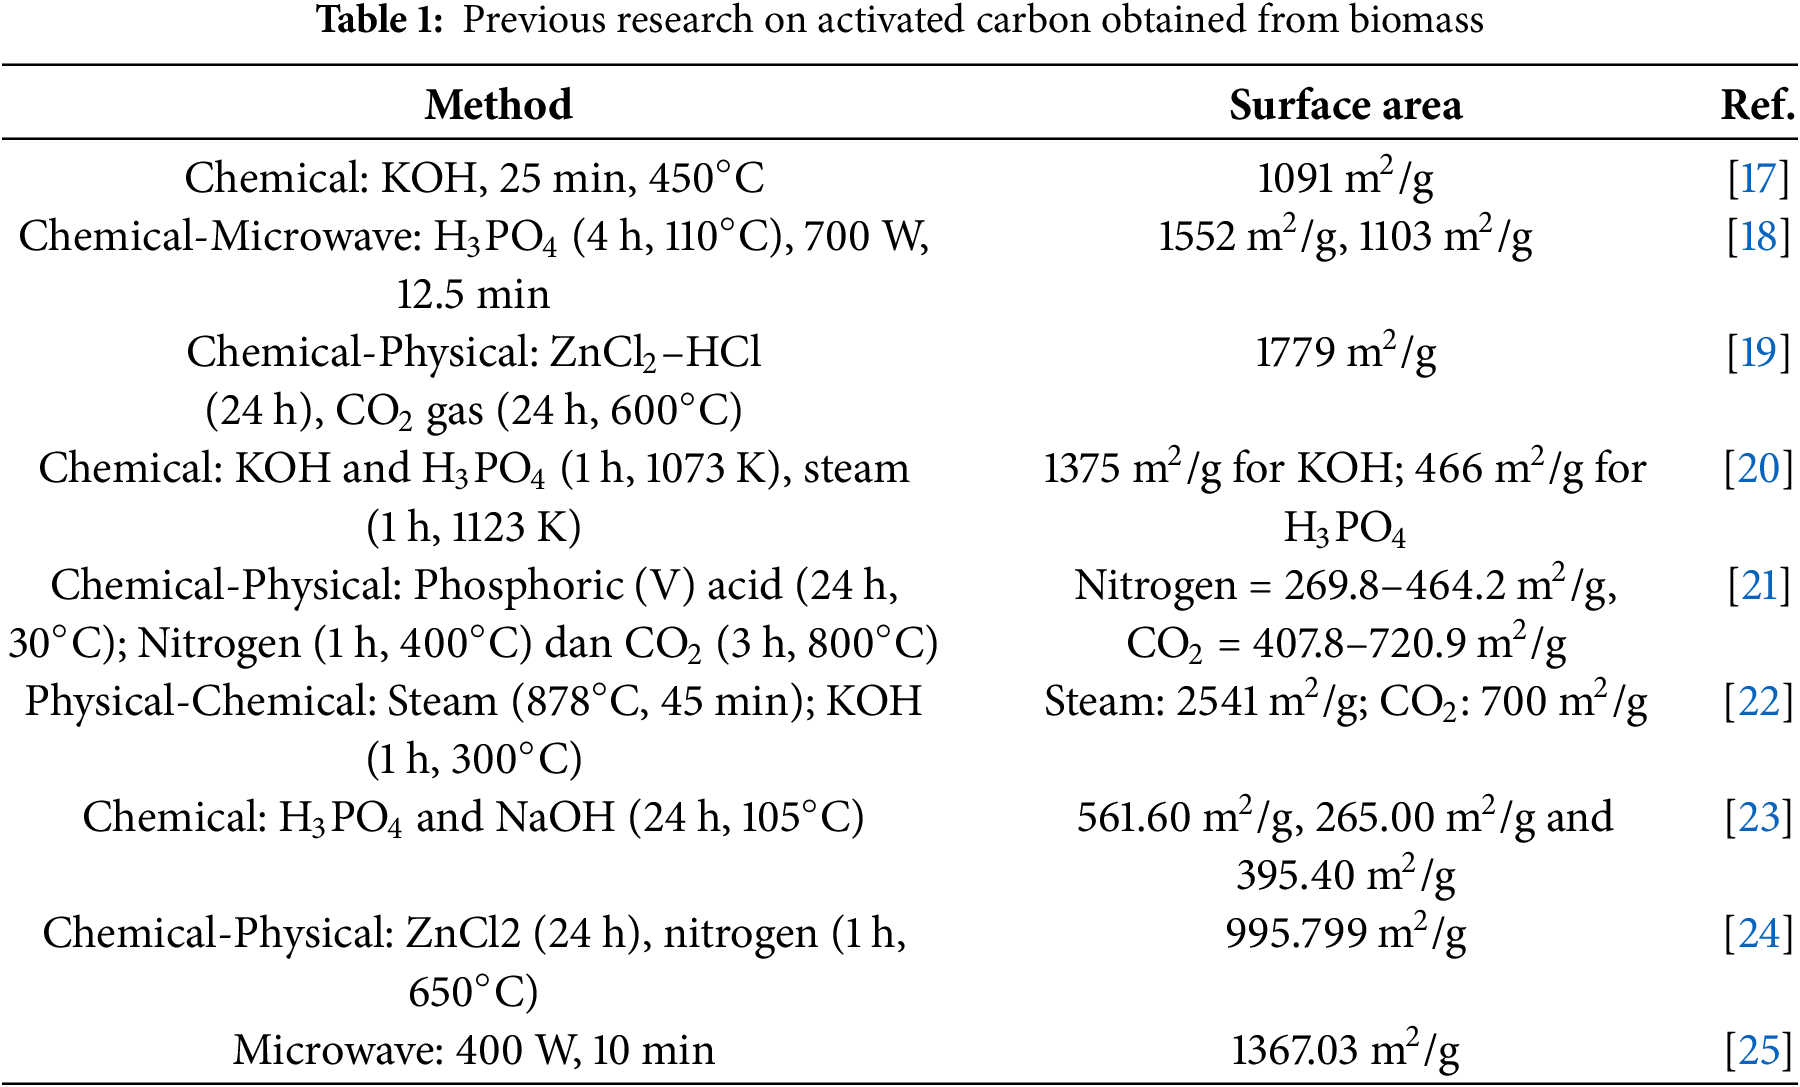
Several studies have explored the use of microwave heating in dye waste removal in Table 1. For example, activated carbon was produced from Eupatorium adenophorum using a microwave-assisted KOH activation process at 700 W for 15 min. BET-BJH characterization revealed a surface area, total pore volume, and average pore diameter of 3.918 m2/g, 2.383 mL/g, and 2.43 nm, respectively [16].
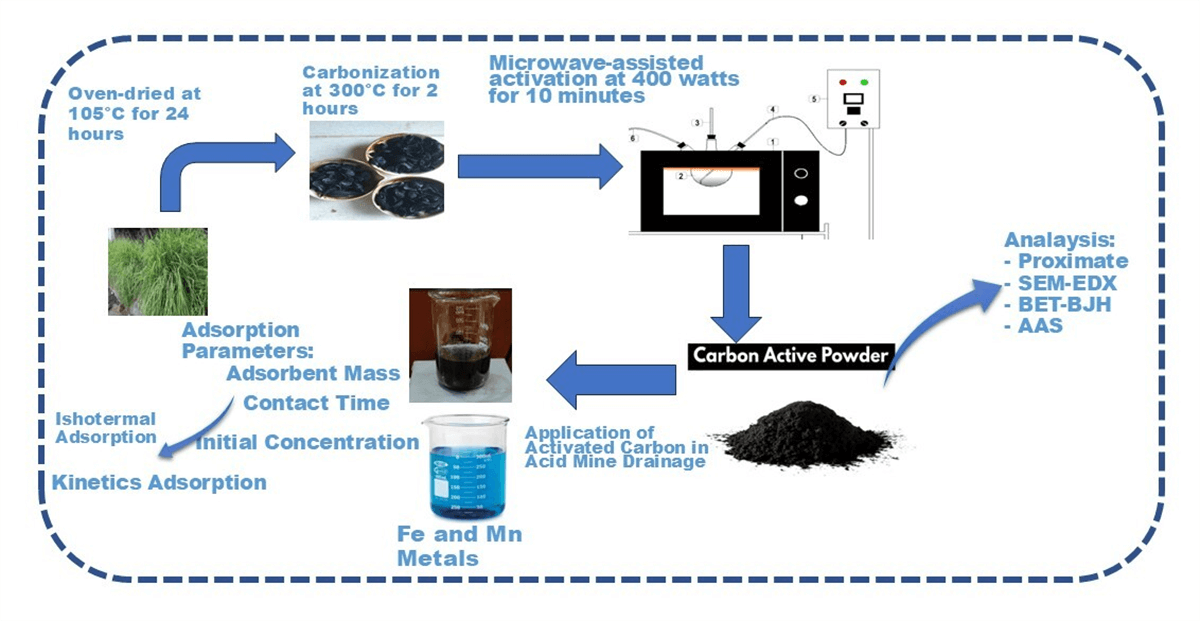
The tools utilized in this research include a crusher, an oven dryer (Memmeth DIN 12880-KI), a furnace (SX-2.8-12 Boc Huanghua Faitful Instrument Co., Ltd.), a tubular furnace, a microwave, an analytical balance (Shimadzu AW-220), and a screening system (sieve tray with an 850-micron mesh size). The device used for microwave-assisted activated carbon production is an Electrolux microwave (The Electrolux microwave model EMM20K22BA is manufactured in China by Electrolux (Hangzhou) Domestic Appliances Co., Ltd., located in Hangzhou, Zhejiang Province). The microwave activation setup is illustrated in Fig. 1.
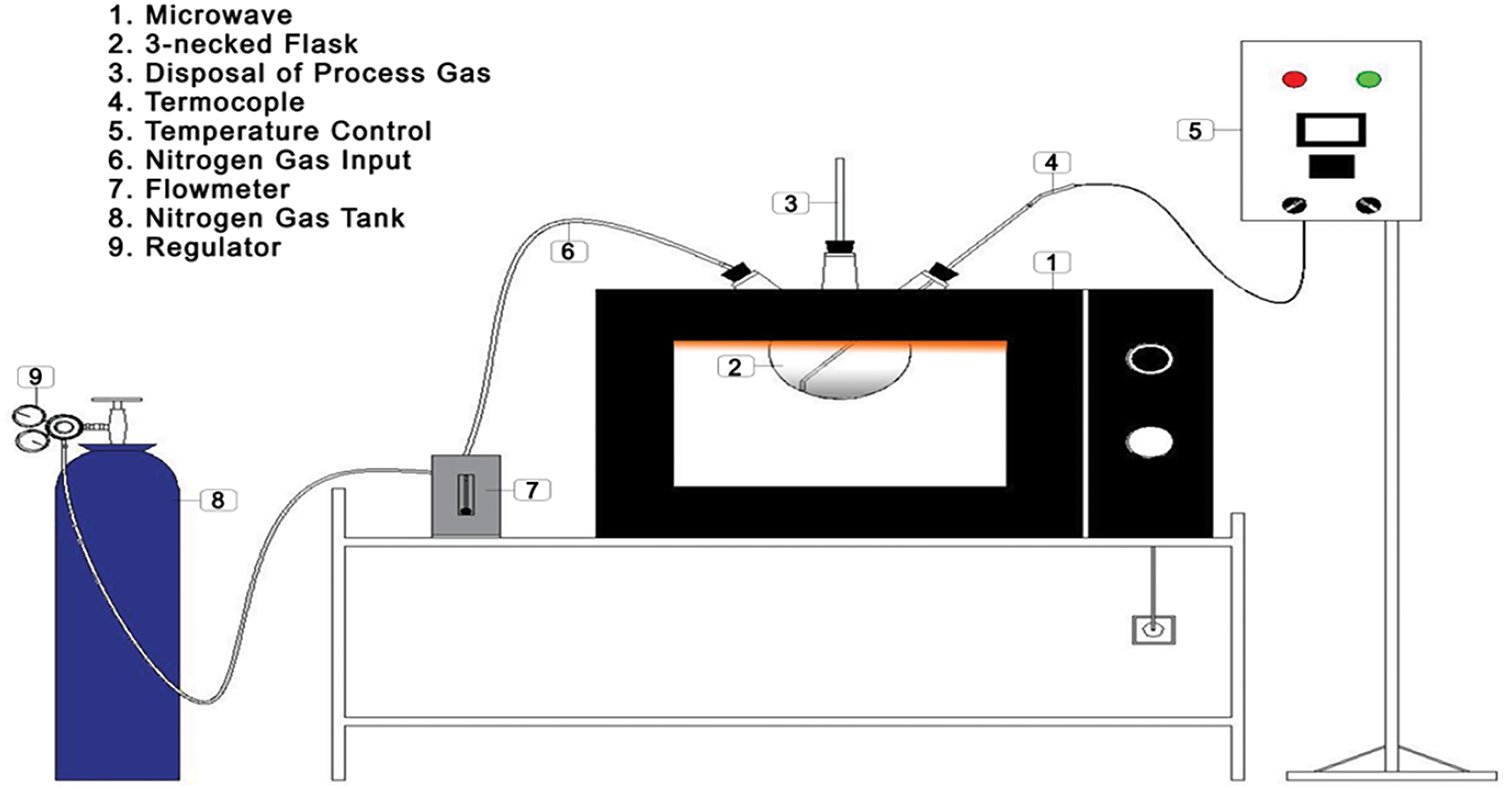
Figure 1: Microwave activation system configuration
The raw material used for producing activated carbon is lemongrass plant waste (Cymbopogon sp.) sourced from South Kalimantan. The FeSO4 and MnO2 solutions utilized in the activated carbon application were obtained from Merck.
2.2.1 Analysis of Functional Groups, Surface Morphology, Structural Patterns, and Activated Carbon Surface Area
The obtained activated carbon was analyzed for functional groups, surface morphology, structural patterns, and surface area using the following techniques:
a. Scanning Electron Microscopy-Energy Dispersive X-ray (SEM-EDX) was employed to examine the surface morphology and pore size of the activated charcoal. The procedure involved coating the sample with platinum, placing it in the SEM device, capturing surface images, and identifying the material’s elemental composition. The analysis was conducted using a JEOL JSM-6360LA.
b. BET and BJH (Barrett-Joyner-Halenda) methods were used to assess the surface area, which corresponds to the space occupied by a single adsorbate or solute molecule and is directly related to the sample’s total surface area. The total surface area, pore volume, and pore size of the material were determined using a Micromeritics TriStar II 3020 instrument.
The subsequent characterization involves proximate analysis, which evaluates moisture content, volatile matter, ash content, fixed carbon, and iodine adsorption capacity (iodine number). Further characterization is also conducted to assess these same parameters.
Water Content
A 2-g sample (dry basis) is placed in a pre-weighed porcelain crucible and heated in an oven at 105°C for 3 h. The sample is then cooled in a desiccator and repeatedly weighed until a stable weight is achieved:
Flammable Matter
A 2-g dried sample is placed in a pre-weighed porcelain crucible and heated in a furnace at 950°C for 10 min. After heating, the crucible is cooled in a desiccator for one hour before being weighed. To minimize sample loss during combustion, the crucible should be tightly sealed and, if necessary, secured with wire. If combustion occurs, the process must be repeated:
Ash Level
A 2-g sample is placed in a pre-weighed, dry porcelain crucible and heated in an electric furnace at 750°C for 6 h. After heating, the sample is cooled in a desiccator for one hour before being weighed repeatedly until a stable weight is achieved:
Fixed/Residual Carbon
In activated carbon, the carbon component is part of the solid fraction formed during pyrolysis, excluding ash (inorganic substances) and any residual essential oils trapped in the charcoal’s pores. The fixed carbon content is determined using the following formula:
Iodine Number
A 0.2-g dried sample is placed in a 250 mL Erlenmeyer flask, followed by the addition of a 0.1 N iodine solution. The mixture is shaken for 25 min at room temperature and then immediately filtered. A 10 mL portion of the filtrate is taken and titrated with a 0.1 N Na2S2O3 solution until a pale yellow color appears. A few drops of a 1% starch solution are then added as an indicator, and the titration continues until the blue color completely disappears:
Variables in the formula:
• Iodine adsorption capacity (g I2/100 g) = Also known as the iodine number, this represents the amount of iodine that can be adsorbed by activated carbon, expressed in mg per g of activated carbon.
• 10 = A constant factor used in the calculation (typically referring to the standard volume of the iodine solution).
• mL = The volume of sodium thiosulfate (Na2S2O3) solution used in the titration of the activated carbon sample (in milliliters).
• N Na2S2O3 = The normality of the sodium thiosulfate solution used in titration.
• 126.93 = The molecular weight of iodine (g/mol), used as a conversion factor in the calculation.
• fp = The dilution factor, applied if the solution undergoes dilution before titration.
Sample weight (g) = The mass of activated carbon used in the analysis (in g).
Brief Explanation of the Formula:
Iodine Adsorption by Activated Carbon:
• Activated carbon is mixed with an excess iodine solution, allowing the iodine to be adsorbed by the carbon.
Titration of Residual Iodine:
• The solution containing unadsorbed iodine is titrated with sodium thiosulfate (Na2S2O3) to determine the amount of iodine that remains unabsorbed.
• Calculation of the Iodine Number
• The expression 10 − (mL × N Na2S2O3) represents the amount of iodine adsorbed by the activated carbon.
• This value is then multiplied by 126.93 (the molecular weight of iodine) to obtain the amount of iodine in mg.
• The dilution factor fp is applied if the solution was diluted before titration.
Finally, the result is divided by the mass of activated carbon used to determine the iodine adsorption capacity in g I2/100 g.
2.3 Production Process of Activated Carbon
Agricultural waste, particularly lemongrass waste, undergoes an initial cleaning process to remove dirt and impurities. It is then cut into smaller pieces and crushed using a crusher to achieve a size of approximately 1–2 cm. The material is subsequently dried in an oven at 105°C for 24 h. After drying, the waste is placed in a furnace (SX-2.8-12 Boc Huanghua Faitful Instrument Co. Ltd.) and subjected to carbonization at 300°C for 2 h. The resulting carbon is analyzed for moisture content, ash content, volatile matter, fixed carbon, and iodine number. Its quality is then assessed by comparing it with the Indonesian National Standard (SNI 01-1682-1996) for coconut shell carbon. Next, the carbon is processed in a microwave (Electrolux model EMM20K22BA) at 400 W for 10 min. Activated carbon produced at this power level exhibits larger, cleaner, and more abundant pores than those processed at 500 and 600 W. Additionally, it has a higher carbon (C) content compared to samples treated at higher power levels. The adsorbent used consists of technical-grade activated carbon, which constitutes 10% of the total mass processed in the microwave [25]. Before activation begins, nitrogen gas flushing is performed to prevent oxidation during the process.
2.4 Application of Activated Carbon in Acid Mine Drainage Treatment, Adsorption Isotherm Analysis, and Adsorption Kinetics Study
Activated carbon that meets quality standards is used as an adsorbent for AMD treatment. The process involves incorporating activated carbon derived from agricultural waste into wastewater samples in varying amounts of 2, 3, 4, 5, 6, and 7 g. Each 100 mL wastewater sample initially contains 127.20 ppm FeSO4 and 37.00 ppm MnO2 and is placed in an Erlenmeyer flask. The mixture is agitated using a rotary shaker at 50 rpm for 60 min, a duration determined to be the equilibrium time. After shaking, the wastewater and activated carbon mixture is filtered using Whatman 42 filter paper. The filtrate is then analyzed for metal ion content using atomic absorption spectroscopy (AAS), with the initial metal ion concentration measured using the same method. The amount of adsorbed metal ions, expressed in mg/g, is calculated based on these measurements. This data is further used to evaluate adsorption isotherms and adsorption kinetics. The analysis determines the final concentrations of FeSO4 and MnO2 after adsorption, establishing a relationship between the adsorbate concentration and adsorption capacity. The results are then applied to the Langmuir and Freundlich models to characterize the isothermal adsorption behavior of the adsorbent.
The following equation was utilized to calculate the amount of Fe and Mn ions adsorbed (Qe) in each experimental trial.
Within this equation:
Qe (mg/g) represents the adsorption capacity,
C0 (mg/L) denotes the initial concentrations of Fe and Mn,
Ce (mg/L) represents the equilibrium concentrations of Fe and Mn,
V (L) refers to the volume of acid mine water, and
W (g) indicates the mass of the applied adsorbent.
Eq. (2) describes the condition of the Langmuir isotherm model.
In this equation, q (mg/g) represents the quantity of heavy metal ions adsorbed per unit mass of the adsorbents, KL the Langmuir equilibrium constant associated with the affinity of the binding sites, Ce denotes the equilibrium concentration of Ni2+ ions, and qmax signifies the theoretical maximum adsorption capacity of the monolayer [26].
The Freundlich isotherm model proposes that adsorption occurs on a heterogenous surface, leading to a distinguishable condition [26]:
In this context, qe refers to the adsorption capacity (mg/g), Ce indicates the concentration of the adsorbate in the solution (mg/L), while KF and n are empirical constants that define the adsorption capacity and the intensity of the process.
The adsorption kinetics are determined by treating AMD with 4 g of activated carbon derived from agricultural waste, added to the wastewater sample. The stock solution contains 127.20 ppm FeSO4 and 37.00 ppm MnO2 in a 100 mL volume in each Erlenmeyer flask. The mixture is then agitated using a rotary shaker at 50 rpm for time intervals of 15, 30, 45, 60, 75, and 90 min. Afterward, the mixture is filtered through Whatman 42 filter paper. The filtrate is analyzed for metal ion content using atomic absorption spectrophotometry, and the initial metal ion concentration is measured using the same method. The amount of adsorbed metal ions is then calculated and expressed in mg/g.
2.4.1 Pseudo-First Order Reaction Model
The PFO kinetic model is derived from Lagergren’s rate equation, first introduced in 1898 for liquid-solid adsorption, emphasizing the solid’s adsorption capacity. This equation is widely used to describe the adsorption of solutes from liquid solutions. The PFO model assumes that the adsorbate concentration is significantly higher than the number of available active sites on the adsorbent’s surface. It is typically represented by the following equation:
By integrating the equation above with the boundary conditions t = 0, t0 = t, and qt = 0 to qt = t, the following equations are obtained:
By plotting Eq. (12) as a straight line of log (qe − qt) vs. t, the slope of the line corresponds to the value of k1, while the intercept at log qe provides the calculated value of qe.
2.4.2 Pseudo-Second Order Reaction Model
The PSO model, introduced by [27], assumes that the adsorption capacity is directly proportional to the number of available active sites on the adsorbent. This kinetic model is influenced by the adsorption capacity of the solid phase [27]. The equation for the PSO model is expressed as follows:
where k2 represents the adsorption kinetic constant (g/mg·min). By integrating this equation with the boundary conditions t = 0 to t = t and qt = 0 to qt = qt, the following results are obtained:
Plotting t/qt vs. t results in a straight line, where the slope corresponds to 1/qe and the intercept to 1/kqe2.
The symbols qe and qt represent the quantity of adsorbed ions at equilibrium and at time t, respectively, while k1 and k2 denote the rate constants for PFO and PSO adsorption. The kinetic model that best fits the experimental data is the one with the highest R2 value, where:
qt = Adsorption capacity at time t (mg/g)
qeq = Equilibrium adsorption capacity (mg/g)
t = Time (min)
k1 = Rate constant of PFO (min−1)
k2 = Rate constant of PSO (g/(mg min))
Each variation of this experiment was conducted twice.
3.1 Properties of Activated Carbon
3.1.1 Activated Carbon Proximate Analysis
Proximate analysis is conducted to evaluate the characteristics and quality of activated carbon, following the SNI 06-3730-1995 standards for technical-grade activated carbon. The results of the proximate analysis are presented in Table 2.
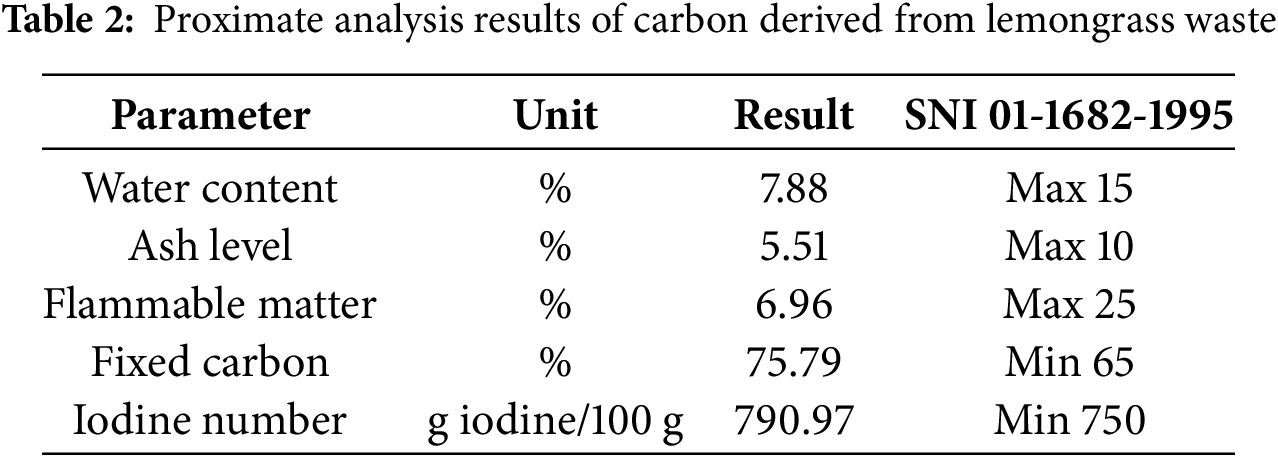
According to Table 2, activated carbon derived from lemongrass waste exhibits a water absorption capacity of 7.88%. The moisture content test evaluates its hygroscopic properties, indicating its ability to absorb and release water. The measured ash content is 5.51%, with lower ash levels signifying higher-quality activated carbon. The minimal ash content results from exposure to air during activation, which promotes further combustion and converts some carbon into ash. Excessive ash content can reduce the adsorption efficiency of activated carbon for gases and solutions, as the mineral components (metal oxides) in the ash disperse within the carbon structure, blocking its pores.
The volatile matter content is recorded at 6.96%, determining the proportion of material that evaporates when the sample is heated to a specific temperature. In activated carbon, lower volatile content facilitates the entry of other molecules (adsorbates), thereby enhancing its adsorption potential.
The fixed carbon content is 75.79%, representing the amount of pure carbon remaining after activation. A higher fixed carbon content indicates increased purity, which is likely attributed to the lower volatile matter and ash content.
The iodine number, measured at 790.97 g iodine/100 g, reflects the pore volume capacity of the activated carbon. The number of pores is directly related to the total internal surface area of the carbon particles. Since the adsorption capability for iodine is linked to surface area, a higher iodine number corresponds to a greater ability to adsorb dissolved substances or adsorbates. The iodine number test evaluates the efficiency of activated carbon in capturing small-diameter molecules, with higher values indicating superior adsorption capacity for adsorbates or solvents [28].
Additionally, this finding is supported by research [29], which reported an iodine number of 224.90 ± 0.50 for fluted activated carbon (FAC) and 200.36 ± 0.30 for commercial activated carbon (CAC). As shown in Table 2, activated carbon obtained from lemongrass waste meets all the criteria outlined in SNI 01-1682-1995 for technical activated carbon standards.
3.1.2 Surface Morphology and Elemental Content Analysis of Activated Carbon
Fig. 2 illustrates that the activated carbon contains a high number of large, clean pores. This is primarily attributed to the significant influence of microwave power on the produced activated carbon. As microwave power increases, the temperature rises, accelerating the activation process and promoting pore formation [30]. The pore structure develops progressively with increasing power; however, excessive power can lead to carbon burnout, altering the pore structure and reducing adsorption capacity, ultimately affecting the efficiency of adsorption [30].
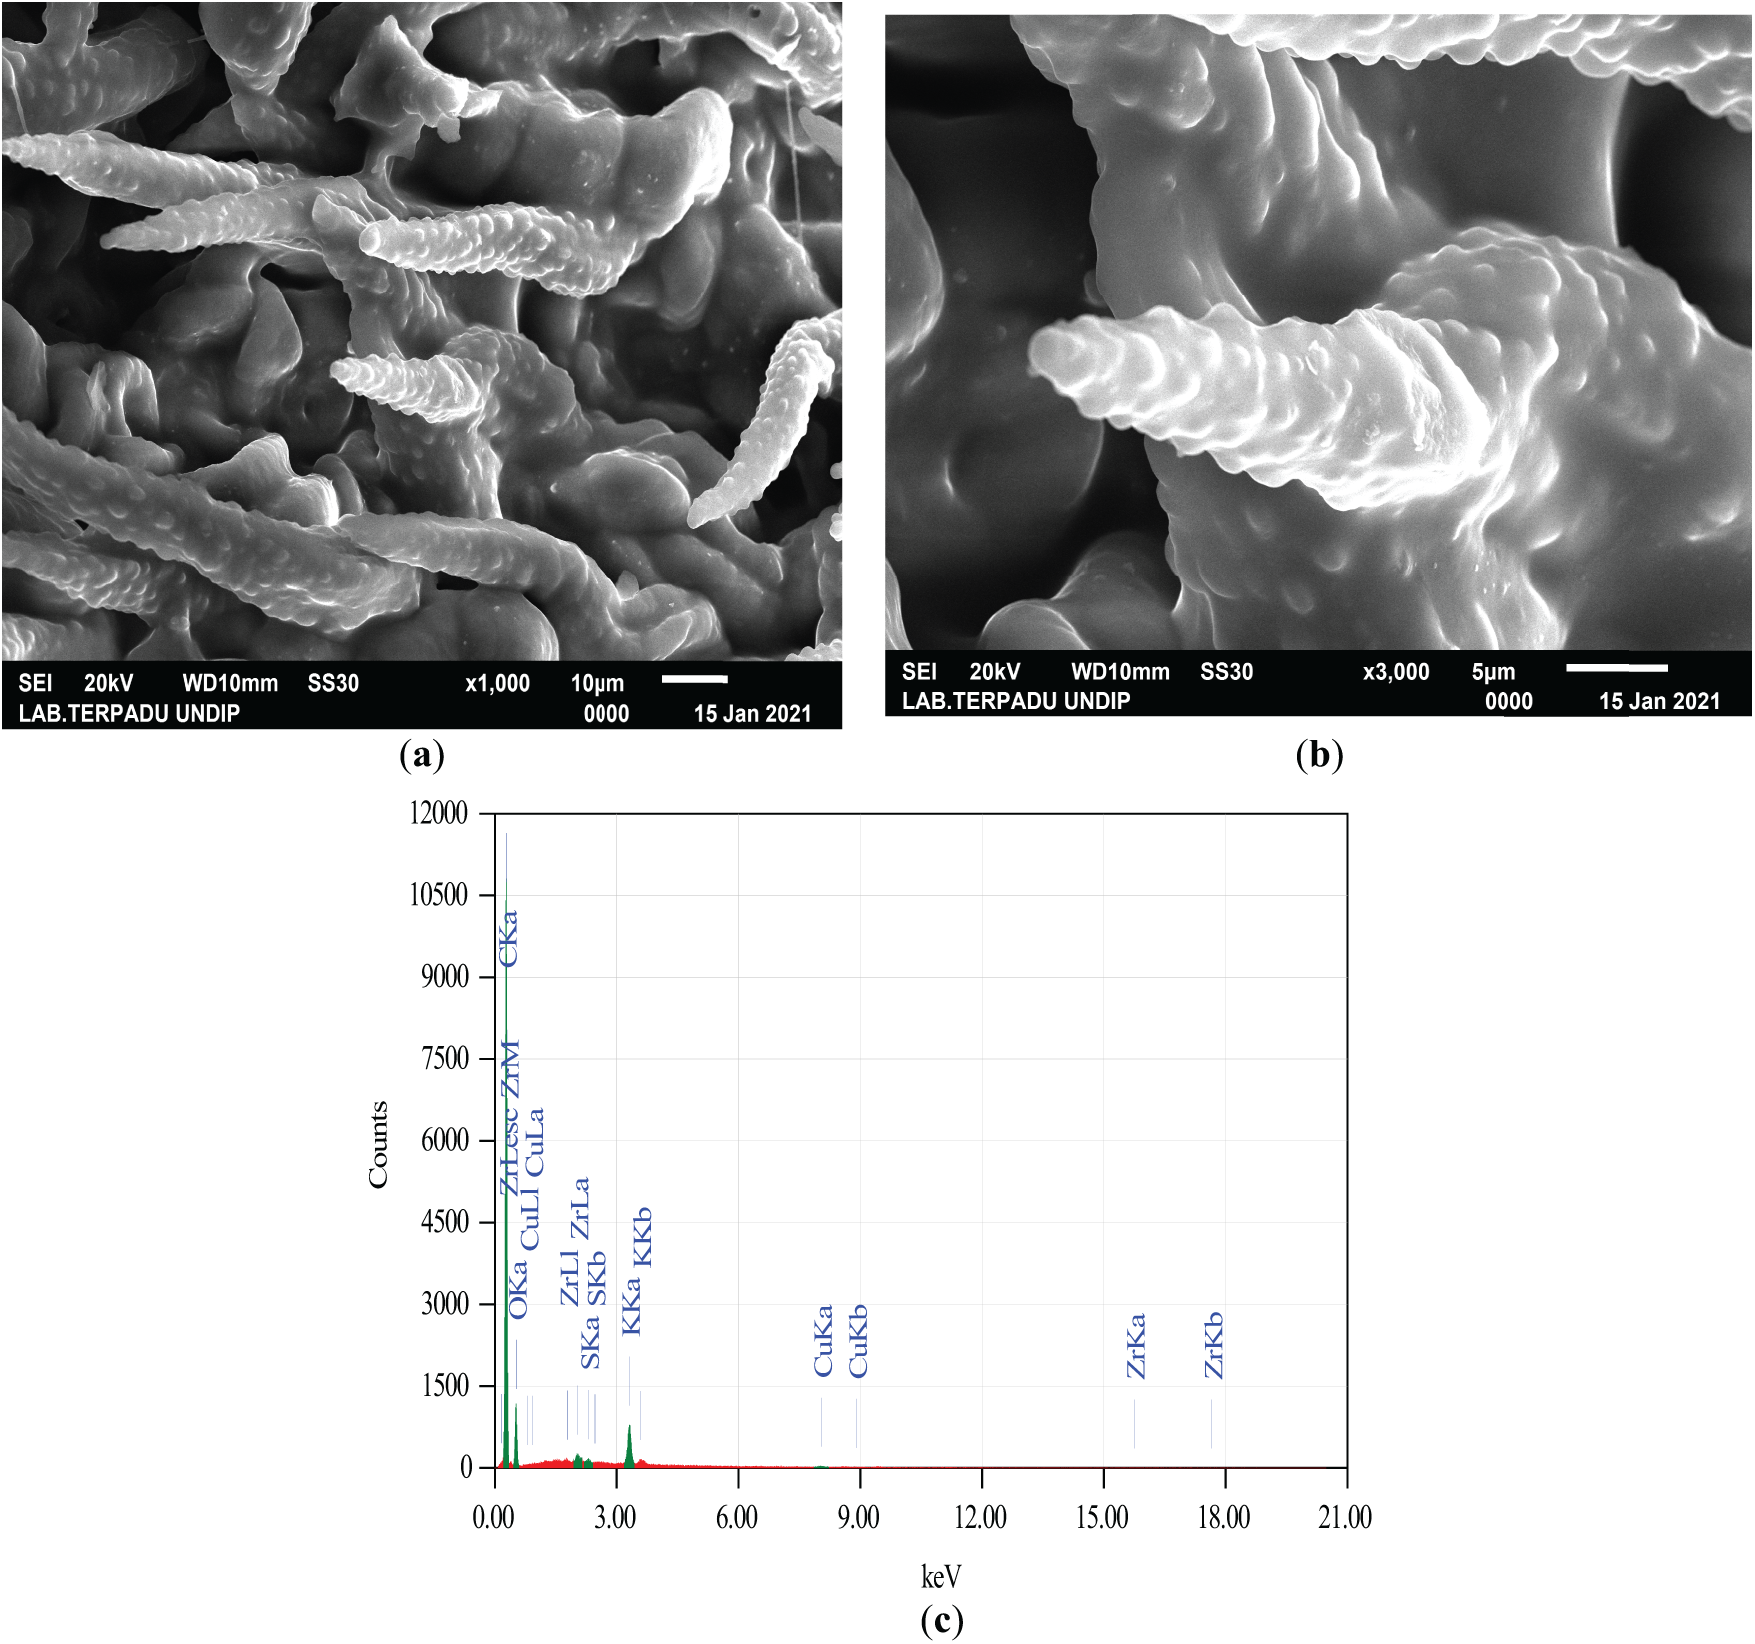
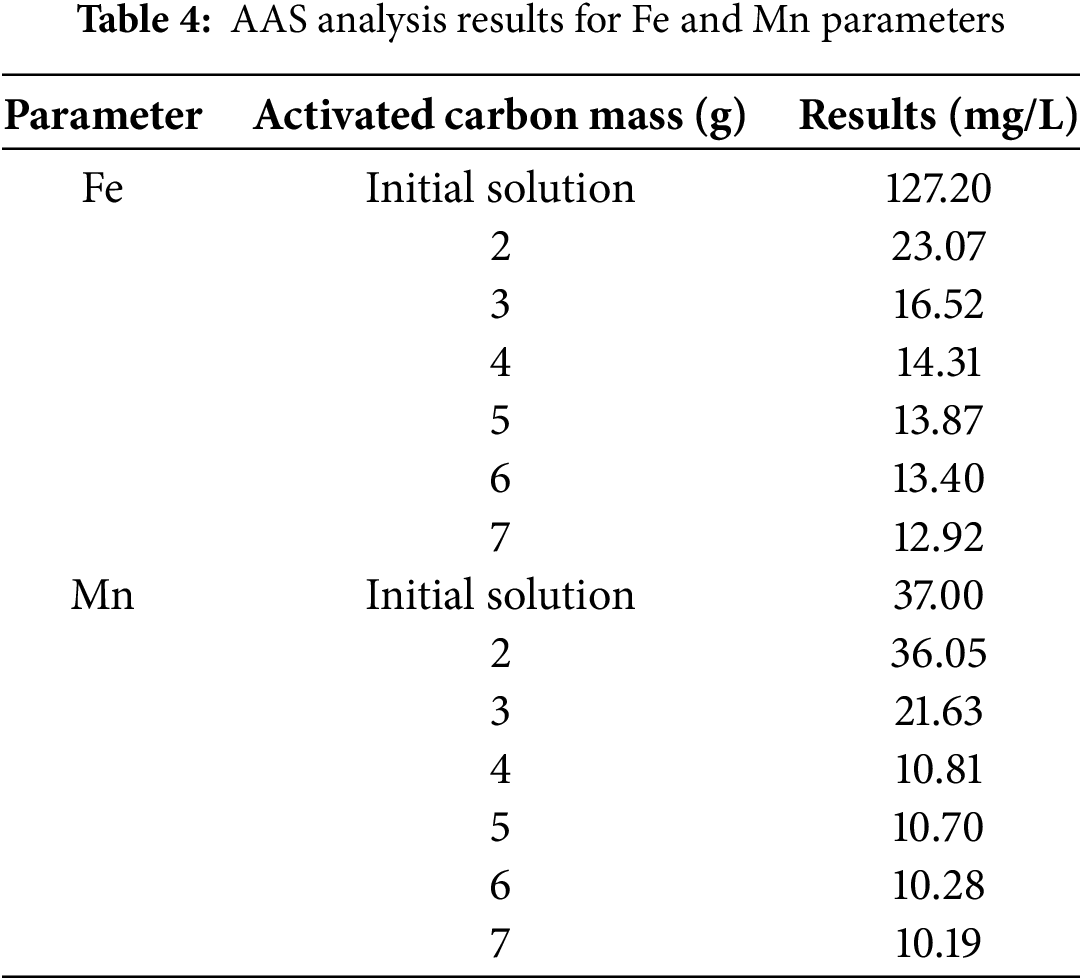
Figure 2: (a) SEM image of lemongrass waste activated at 400 W with a magnification of ×1000; (b) SEM image at a magnification of ×5000; (c) Elemental composition of activated carbon derived from lemongrass waste activated at 400 W
During microwave heating, the emitted microwaves are absorbed by the material, facilitating heat transfer through the interaction between dielectric molecules and microwave waves. The induced energy is released as heat via molecular friction, resulting in more uniform heat distribution and reducing activation energy due to the high atomic mobility within the crystal structure [31]. Unlike conventional heating methods, microwaves enable rapid, uniform, and direct heating without the limitations of heat transfer through solid walls [31].
According to Cheng et al. [32], as microwave power increases, the resulting temperature rises, causing more non-carbon materials to evaporate. Similarly, Liu et al. [31] found that the temperature of the raw material is directly influenced by microwave power—higher power leads to higher temperatures, accelerating the formation of activated carbon. Increased microwave power supplies more energy to the raw material, promoting pore formation while reducing yield percentage. However, excessive heating (overheating) can degrade the quality of activated carbon by reducing its mesopores and micropores [33]. Other studies indicate that as carbonization temperature rises, the yield of activated carbon decreases, whereas the fixed carbon content increases [34].
As shown in Fig. 2, the elemental composition of activated carbon derived from agricultural waste (lemongrass), analyzed using EDX, exhibits varied content. A more detailed breakdown is provided in Table 3:
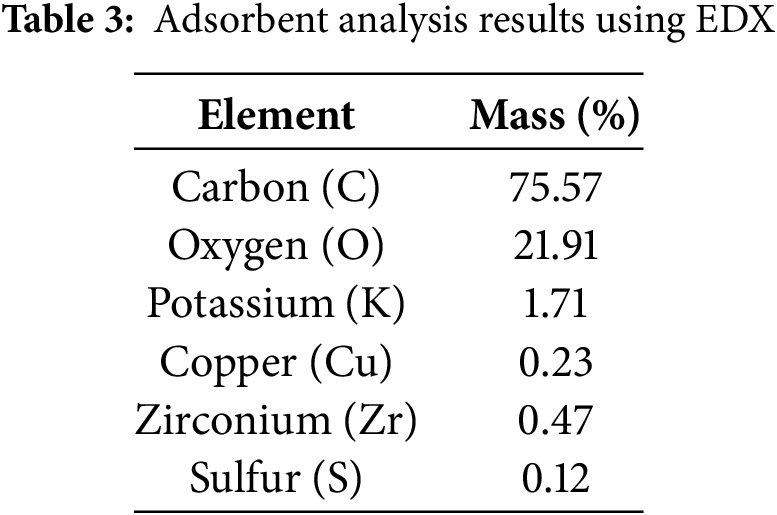
Table 3 shows that the elemental composition of lemongrass waste includes C, O, K, Cu, Zr, and S, with carbon and oxygen being the most abundant. The high carbon content of activated carbon derived from lemongrass waste confirms that materials rich in carbon are suitable for activated carbon production [35]. In this study, activated carbon is utilized for metal adsorption in AMD.
The formation of pores results from the aggregation of agricultural waste particles interacting with acid and base particles through hydrogen bonding and induced dipole-dipole interactions. This process creates pores of specific sizes. According to the International Union of Pure and Applied Chemistry (IUPAC), pores are classified into three categories: micropores (diameter < 2 nm), mesopores (2–50 nm), and macropores (>50 nm). As noted in [32], mesopores (2–50 nm) and micropores (<1 nm) cannot be detected or observed using SEM. Therefore, to accurately determine the mesopore and micropore sizes in agricultural waste-based activated carbon, the nitrogen gas adsorption method based on BET-BJH principles should be used.
The key property of activated carbon is its ability to adsorb substances, which stems from its solid structure, large surface area, and high porosity. Adsorption efficiency is closely linked to the activation level, as higher-quality activated carbon requires a larger surface area for optimal performance [36]. The surface area of activated carbon typically ranges from 300 to 3000 m2/g, depending on its pore structure. Porosity plays a crucial role in adsorption capacity, with highly porous materials exhibiting greater adsorption efficiency. Microwave heating enhances the development of activated carbon by increasing surface area and improving porosity [37]. However, excessively high heating temperatures—associated with higher power levels—can lead to the complete decomposition of cellulose and lignin, as noted by Cimò et al. [38]. Studies also indicate that as carbonization temperature increases, the yield of activated carbon decreases, while the fixed carbon content rises.
3.1.3 Results of Total Surface Area, Pore Volume, and Pore Size Characterization Using BET-BJH
The results of the BET and BJH analyses are as follows: The BET surface area (specific surface area) of activated carbon derived from lemongrass waste is 818.2 m2/g. The BJH cumulative pore volume (desorption BJH cumulative pore volume) for pores ranging from 1.70 nm to 300 nm in diameter is 0.77 cm3/g. The BJH adsorption average pore diameter (4V/A) is 1.91 nm. Before undergoing microwave activation, the BET surface area (specific surface area) of carbon from lemongrass waste was 369.7 m2/g. The cumulative pore volume obtained from BJH adsorption (desorption BJH cumulative pore volume) for pores within 1.70 to 300 nm was recorded at 0.31 cm3/g, while the BJH adsorption average pore diameter (4V/A) was 0.88 nm. These findings indicate that microwave-assisted activation significantly increases both the pore size and surface area of activated carbon. A larger surface area enhances adsorption capacity, as adsorption occurs on the surface of the adsorbent [39]. Based on these results, the activated carbon from lemongrass waste is characterized as microporous, with pore diameters of less than 2 nm, in accordance with the IUPAC classification.
3.2 Effect of Activated Carbon Mass on Removal of Fe and Mn Metals in Acid Mine Drainage
Activated carbon that meets quality standards after the improvement process is then used as an adsorbent for treating AMD (containing Fe and Mn). This is achieved by mixing activated carbon derived from agricultural waste into the wastewater. The applied activated carbon is subsequently tested using AAS to measure the concentration of metals present in the AMD after undergoing adsorption.
The results of the AAS analysis for activated carbon from lemongrass waste in the removal of Fe and Mn from AMD, at a mixing time of 60 min, are presented in Table 4 below:
The results of the analysis of Fe and Mn metal removal from AMD, when plotted in a graph, can be depicted as follows (Figs. 3 and 4):
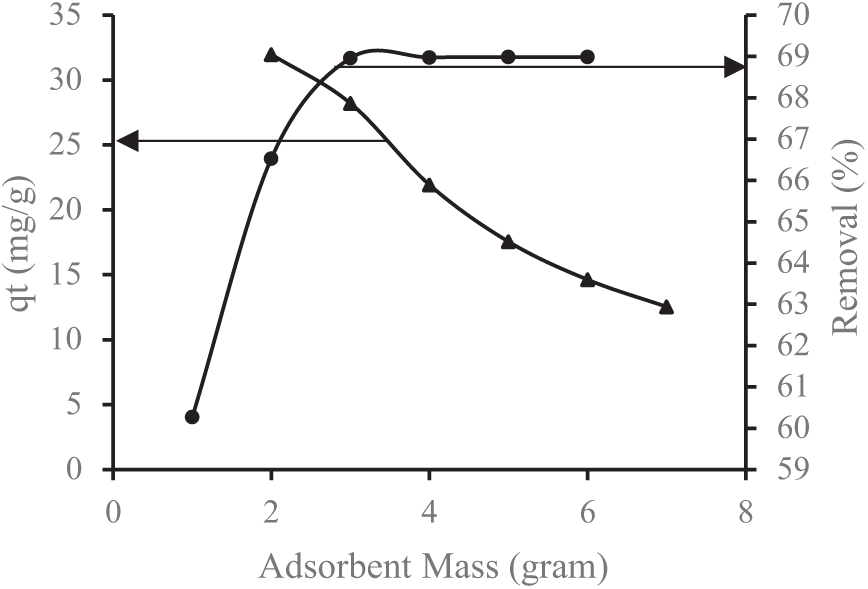
Figure 3: Impact of lemongrass waste-based activated carbon mass on Fe removal
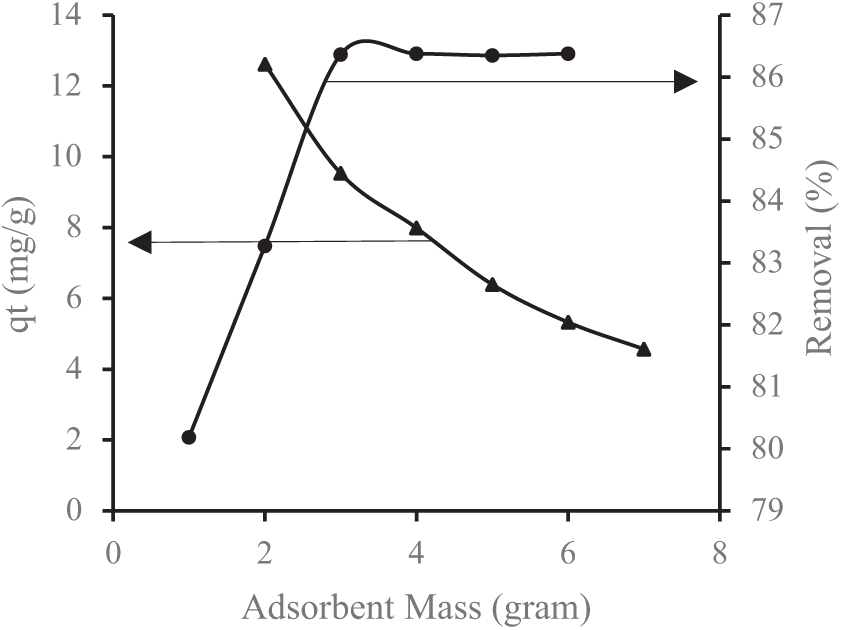
Figure 4: Impact of lemongrass waste-based activated carbon mass on Mn removal
Referring to Figs. 3 and 4, the highest removal efficiency for Fe and Mn is observed at an optimal adsorbent dose of 4 g. Beyond this point, any further increase in removal efficiency becomes minimal, stabilizing due to the inherent properties of the adsorbent [40]. Figs. 3 and 4 further illustrate that the percentage of metal removal increases with a higher adsorbent mass. This is primarily due to the expansion of adsorption sites and surface area, which enhances metal removal at higher doses. However, an excessive adsorbent dose may lead to aggregate formation, reducing the total available surface area and, consequently, the removal efficiency [32]. Additionally, a greater adsorbent mass improves the adsorption rate of heavy metals. A higher quantity of adsorbent allows for more adsorption interactions, capturing more cations in the solution. Essentially, a higher adsorbent-to-contaminant ratio increases the effectiveness of pollutant removal [25].
These results align with the BET-BJH analysis, which indicates that an increased surface area enhances adsorption by allowing more adsorbate to adhere to the carbon surface. The results of the BET and BJH tests are as follows: The BET surface area (specific surface area) of activated carbon from lemongrass waste is 818 m2/g. The BJH cumulative pore volume (desorption BJH cumulative pore volume) for pores with diameters ranging from 1.70 nm to 300 nm is 0.77 cm3/g, while the BJH adsorption average pore diameter (4V/A) is 1.91 nm. Before undergoing microwave activation, the BET surface area (specific surface area) of lemongrass waste was recorded at 369.7 m2/g. The BJH cumulative pore volume (desorption BJH cumulative pore volume) for pores within 1.70 nm to 300 nm was 0.31 cm3/g.
3.3 Impact of Contact Time with Activated Carbon on Removal of Fe and Mn from Acid Mine Drainage
Contact time is a critical factor in the adsorption process, as it affects both the reaction rate and concentration changes over time. Determining the optimal contact time in batch adsorption is essential for identifying the ideal mixing duration, allowing the adsorbent to capture the maximum amount of adsorbate before reaching saturation [41]. The results of Fe and Mn removal from AMD can be illustrated graphically as follows (Figs. 5 and 6):
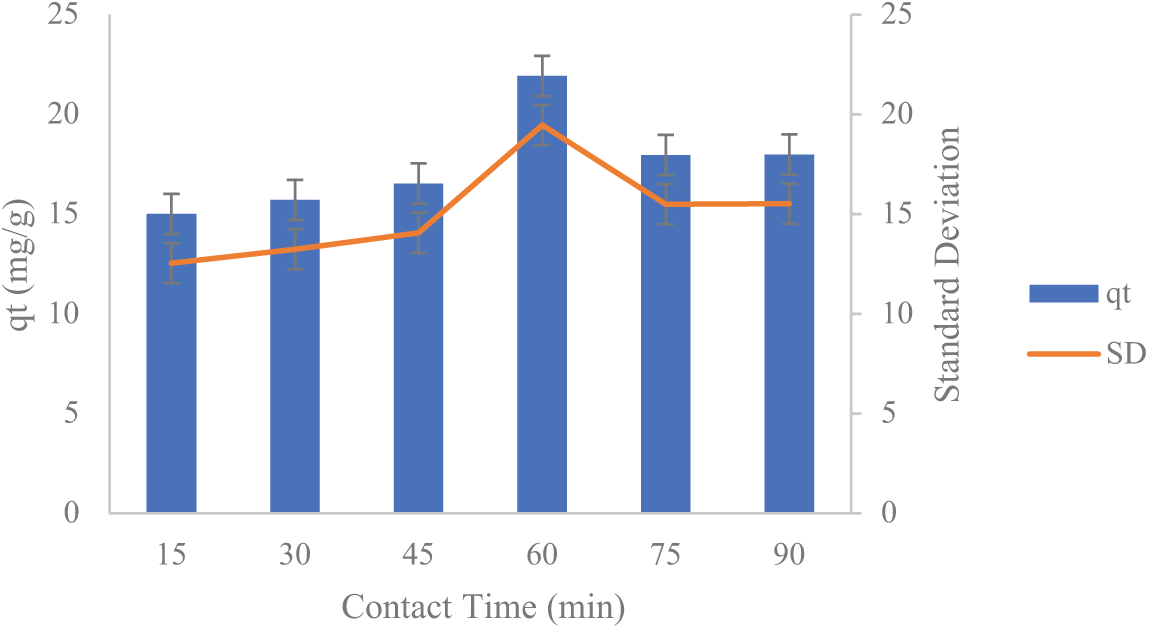
Figure 5: The influence of activated carbon mixing duration from lemongrass waste on Fe
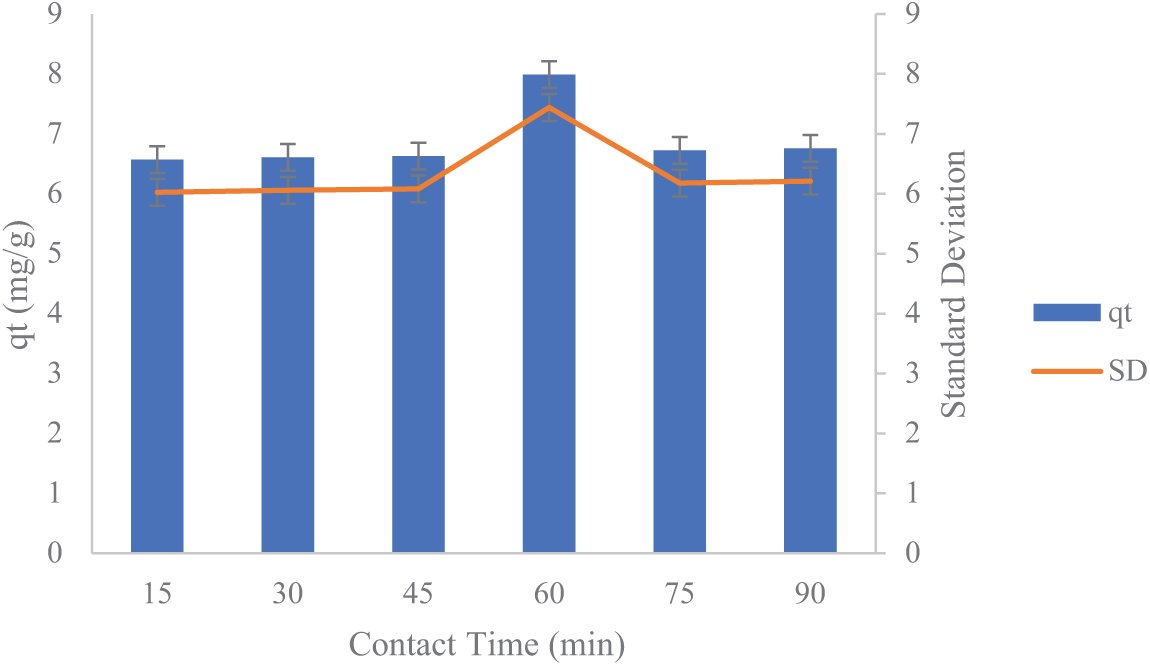
Figure 6: The influence of activated carbon mixing duration from lemongrass waste on Mn
The study findings indicate that the duration of the adsorption process significantly affects the reduction of Fe and Mn concentrations in AMD, demonstrating that a longer contact time allows more metal ions to be captured by activated carbon. In this batch adsorption process, extending the contact time enhances the transfer of Fe and Mn molecules onto the surface of activated carbon derived from lemongrass waste.
As illustrated in Figs. 5 and 6, the standard deviation values for qt in the adsorption process are approximately 2.467 for Fe and 0.5474 for Mn. The standard deviation (σ) reflects the extent of variation or dispersion in the qt values (the amount of substance adsorbed per unit mass of adsorbent) from the mean. For Fe, a standard deviation of 2.467 indicates greater variability in qt values, suggesting fluctuations in Fe adsorption capacity. These variations may result from differences in experimental conditions or the properties of the adsorbent material. For Mn, a standard deviation of 0.5474 indicates more consistent qt values with less variation around the mean, suggesting that Mn adsorption is more stable than Fe adsorption under the same conditions. In general, a smaller standard deviation signifies more consistent adsorption results, whereas a larger standard deviation suggests greater variability in the process.
As depicted in Figs. 5 and 6, adsorption increases significantly within the initial 15–60 min before stabilizing beyond 60 min. The highest adsorption of Fe and Mn occurs at the 60-min mark. This trend suggests that adsorption capacity rises substantially between 15 and 60 min before reaching equilibrium. The observed pattern occurs because, as contact time extends, the active sites of the adsorbent gradually become saturated with adsorbate. Consequently, at the longest contact time of 90 min, the adsorption rate declines due to the full occupation of active sites. Additionally, once the activated carbon reaches its saturation point, prolonged contact time may induce desorption, causing previously adsorbed metal ions to be released back into the solution [25].
Figs. 5 and 6 presents the adsorption capacity as blue bars and standard deviation as an orange line. The error bars reflect the degree of variation from the mean values, with longer bars indicating higher uncertainty or inconsistency. The largest error bar is observed at 60 min, indicating that although the adsorption capacity was highest at this point, the repeatability of the results was lower compared to other time points. This could be attributed to possible saturation effects or external influences on the adsorption process during extended contact time. Beside, the vertical error bars displayed on each bar indicate the standard deviation (SD) of the qt measurements. Standard deviation reflects how much the data points differ from the mean value at each contact time and longer error bars suggest a higher level of variation among the replicate measurements.
To evaluate whether the differences in qt values across the six contact times were statistically significant, a one-way ANOVA test was performed using simulated data based on the reported standard deviations and an assumed triplicate measurement (n = 3). The statistical results are as follows: F-statistic: 4.86 and p-value: 0.013 for Mn adsorption. Since the p-value is less than 0.05, the null hypothesis (no difference between groups) is rejected. This confirms that contact time has a statistically significant effect on Mn adsorption capacity. A post-hoc Tukey Honestly Significant Difference (HSD) test was conducted to determine which time points differed significantly. The results showed that the 60-min contact time was significantly different (p < 0.05) from all other time intervals, while no significant differences were observed among the other groups. This reinforces the conclusion that 60 min represents a distinct and optimal point for Mn adsorption under the tested conditions. Regarding Fe adsorption, the one-way ANOVA analysis yielded an F-value of 0.527 and a p-value of 0.752, indicating that no significant difference (p > 0.05) was observed in the Fe adsorption capacity (qt) across contact times ranging from 15 to 90 min. This implies that changes in contact time did not notably affect the adsorption performance under the experimental conditions. As a result, extending the contact time beyond 90 min is unlikely to lead to a meaningful improvement in adsorption efficiency. These results suggest that further increasing the contact duration would not substantially enhance the Fe adsorption process within the parameters of this study.
The isothermal adsorption values, based on the Langmuir and Freundlich equations, along with the adsorption kinetics parameters, were determined through calculations and by graphing the equations for each model to generate curves that accurately represent the research data (curve fitting). These results are presented in Table 5 below.
The removal of Fe and Mn from AMD using lemongrass waste followed the Langmuir and Freundlich isotherm models, as presented in Table 5. The Langmuir model demonstrated a better fit compared to the Freundlich isotherm. According to the Langmuir adsorption model, the maximum adsorption capacity (qmax) of activated carbon derived from lemongrass waste was 32.01 mg/g for Fe and 12.62 mg/g for Mn. This adsorption capacity is likely attributed to the saturation of the outer layer of the activated carbon with adsorbed molecules, which prevents further adsorption of additional metal ions. As the concentration of metal-laden wastewater increases, the frequency of molecular collisions and interactions with the adsorbent also rises, enhancing the adsorption process. The porosity of the adsorbent plays a crucial role in its adsorption capability, with higher-porosity adsorbents exhibiting superior adsorption performance compared to those with lower porosity [32].
The Freundlich adsorption isotherm is commonly used to fit experimental data across a broad concentration range. This model accounts for surface heterogeneity and the exponential distribution of active sites along with their energy levels [42]. Based on the calculated 1/n values, all values were found to be greater than 0 but less than 1. The condition 0 < KL < 1 signifies that the adsorption process is favorable, indicating efficient and effective adsorption. This balance between adsorbent-adsorbate interactions facilitates optimal adsorption. These findings suggest that the adsorption of activated carbon derived from agricultural waste through a chemical process aligns more closely with the Langmuir isotherm. Furthermore, the correlation coefficient (R2) values were closer to 1 [43], confirming that the removal of Fe and Mn from AMD using activated carbon from agricultural waste (lemongrass waste) via microwave-assisted activation follows a homogeneous adsorption pattern. In this process, the adsorbate forms a monolayer on the adsorbent surface. In the Freundlich model, surface heterogeneity refers to variations in the properties of the adsorbent surface, including uneven adsorption energy and the presence of diverse active sites. Unlike the Langmuir model, which assumes a uniform surface, the Freundlich model acknowledges that adsorption sites do not share the same energy level [44]. The key features illustrating surface heterogeneity in this model include [44]:
• Lack of monolayer saturation: Unlike the Langmuir model, the Freundlich model suggests that adsorption can continue indefinitely without reaching a saturation point.
• Variation in adsorption energy: Adsorption sites possess different energy levels, causing molecules to first adhere to higher-energy sites before occupying those with lower energy.
• Nonlinear adsorption equilibrium: The Freundlich isotherm equation is empirical and describes a nonlinear correlation between the amount of adsorbed substance and its concentration in solution.
Adsorption kinetics describe the changes in the concentration of an adsorbed substance over time as it interacts with the adsorbent surface. To determine the adsorption kinetics of AMD on activated carbon derived from agricultural waste, different contact times were applied. In this study, the contact time variations used were 15, 30, 45, 60, 75, and 90 min.
The variation in contact time was analyzed to assess the speed of the adsorption process. Since time is a key factor, the adsorption rate depends on the duration of adsorption. As the adsorption time increases, a larger amount of Fe and Mn metals is captured, leading to variations in adsorption rates at different time points. This study examines the kinetics of Fe and Mn adsorption using activated carbon prepared via microwave-assisted activation, applying the PFO and PSO models.
The adsorption kinetics rate and reaction order were determined using the PFO and PSO models, with variations in adsorbent mass and contact time. The adsorption kinetics parameters were derived by plotting the equations for each model, generating curves that accurately represent the research data (curve fitting), as illustrated in Figs. 7 and 8, along with Table 6 below.
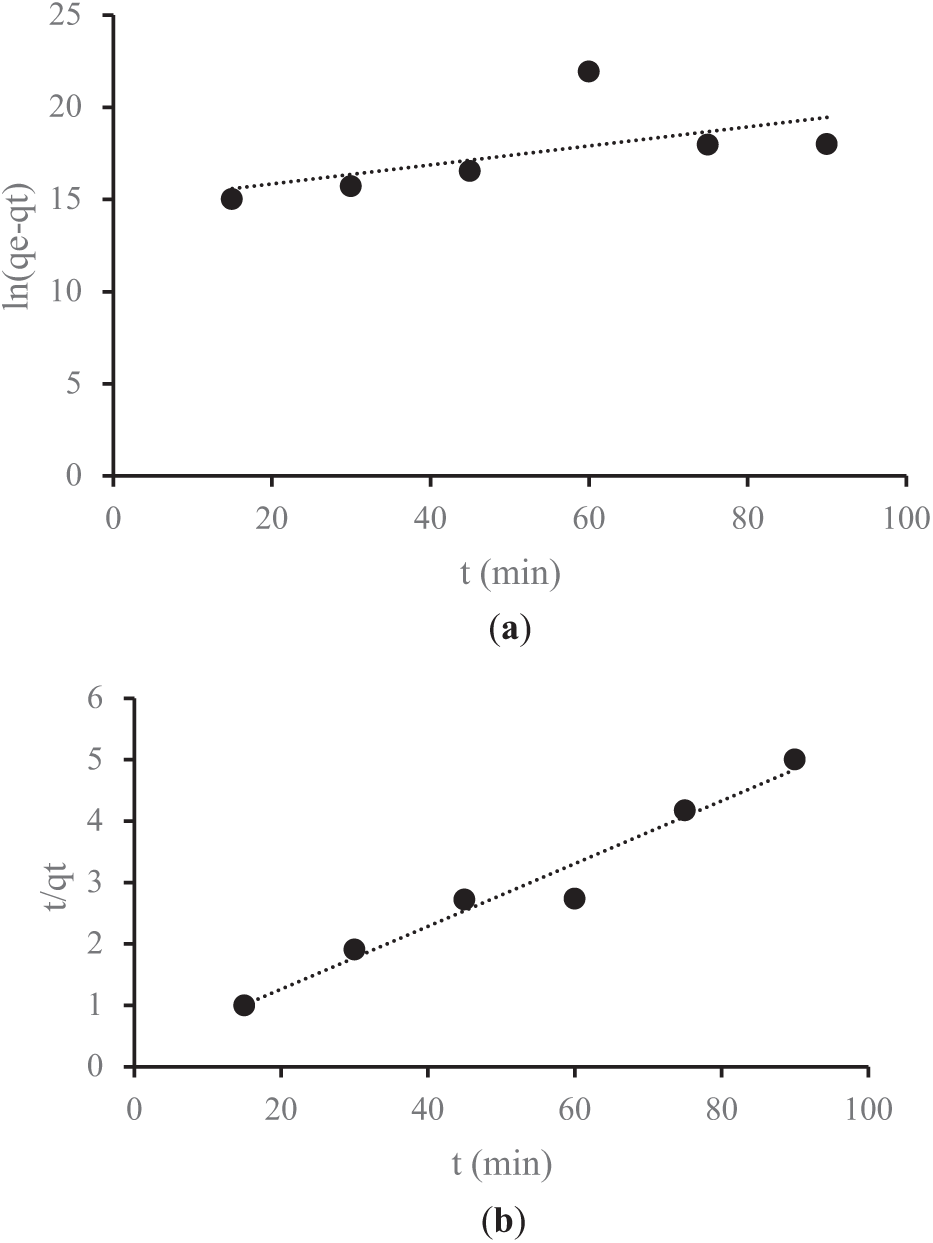
Figure 7: (a) The pseudo-first-order (PFO) adsorption process of Fe metal; (b) The pseudo-second-order (PSO) adsorption process of Fe metal
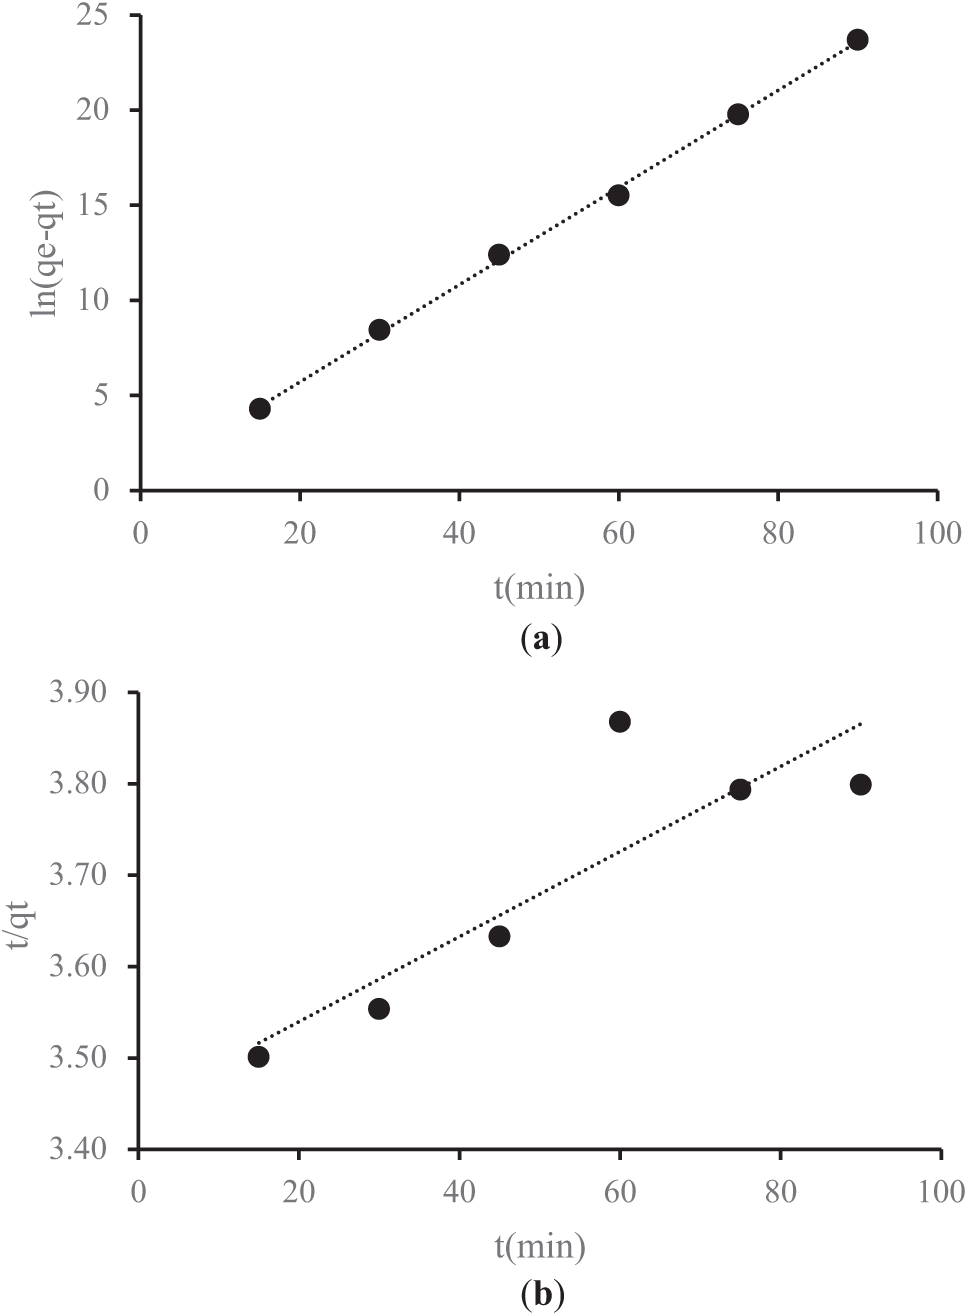
Figure 8: (a) The pseudo-first-order (PFO) adsorption process of Mn metal; (b) The pseudo-second-order (PSO) adsorption process of Mn metal
Figs. 7a and 8a illustrate the PFO kinetics plot for the adsorption of Fe and Mn ions using activated carbon derived from lemongrass waste. These graphs display key parameters, including qe and qt, which represent the amount of metal adsorbed onto the adsorbent (mg/g) at equilibrium and at a specific time t, respectively. Additionally, they present the rate constants k1 for PFO and k2 for PSO, measured in g/mg·min. Figs. 7b and 8b depict the PSO kinetics plots, demonstrating the adsorption behavior of Fe and Mn metals. Table 6 summarizes the adsorption kinetics parameters obtained for Fe and Mn ions on activated carbon derived from lemongrass waste.
The experimental data were analyzed using the PFO and PSO kinetic models, as shown in Table 6. When incorporated into the calculations, the standard deviation values for activated carbon derived from lemongrass waste in Fe adsorption are 0.0585 for the PFO model and 1.4628 for the PSO model. Similarly, for Mn adsorption, the standard deviation is 0.0326 in the PFO model and 2.0877 in the PSO model. These values indicate that the standard deviation for Fe (0.0585) and Mn (0.0326) in the PFO model is relatively low, suggesting minimal variation or dispersion in the adsorption data. This implies greater data stability and a closer alignment with the average. In contrast, the higher standard deviation values for Fe (1.4628) and Mn (2.0877) in the PSO model reflect greater fluctuations in the adsorption data compared to the PFO model. Generally, a lower standard deviation signifies more consistent and reliable data, whereas a higher standard deviation indicates greater variability in adsorption results [45]. These variations are critical in determining the most suitable model for accurately representing the adsorption behavior of Fe and Mn using activated carbon from lemongrass waste.
The obtained R2 values suggest that the results align more closely with the PFO model, which exhibits a stronger correlation coefficient (R2) than the PSO model. Consequently, metal adsorption from AMD is better described by PFO kinetics. This finding also indicates that a larger surface area enhances the adsorption rate. Additionally, key adsorbent properties affecting adsorption efficiency include particle size and surface area, as smaller adsorbent particles lead to a faster adsorption process, while a larger surface area allows for the adsorption of more adsorbate molecules [24,46]. The most crucial characteristic of activated carbon is its adsorption capacity, which is attributed to its solid structure with an extensive surface area and well-developed pores. The adsorption performance of activated carbon is directly linked to its surface properties, with high-quality activated carbon requiring a large surface area for optimal adsorption efficiency [36]. With a surface area of 818 m2/g and a pore size of 1.91 nm, the activated carbon produced is classified as microporous. Consequently, smaller pore sizes result in a larger surface area, creating more available sites for adsorbate interaction. The presence of tiny pores enhances the interaction area, thereby increasing adsorption capacity [47].
Based on the data, thermodynamic calculations yield the following values: ΔG2 = −4578.6 J/mol = −4.579 kJ/mol, ΔH = 24,719.3 J/mol = 24.72 kJ/mol, and ΔS = 0.0907 kJ/mol·K = 90.7 J/mol·K. These results indicate that [48]:
• ΔG < 0, confirming the adsorption process occurs spontaneously.
• ΔH > 0, indicating that the adsorption process is endothermic.
• ΔS > 0, suggesting an increase in system disorder after adsorption due to the positive entropy change (ΔS), a characteristic of physisorption (physical adsorption).
Benefits of physisorption include its reversibility, which allows for easy desorption of adsorbed molecules and enables repeated use. It preserves the structure of the adsorbent, such as activated carbon, which can be reused multiple times, making it ideal for gas filtration and air purification. For instance, activated carbon can absorb water vapor or toxic gases. On the other hand, physisorption has limitations, such as weak interactions (Van der Waals forces), which make the adsorbate easily detachable and unsuitable for processes requiring permanent chemical reactions [49].
This study demonstrates the potential of agricultural waste, specifically lemongrass waste, as a cost-effective adsorbent for heavy metal removal using isothermal models with microwave-assisted activation. Characterization results indicate that activated carbon produced at 400 W exhibits a water absorption capacity of 7.88%, an ash content of 5.51%, volatile matter of 6.96%, a fixed carbon content of 75.79%, and an iodine number of 790.97 g iodine/100 g. SEM analysis confirms the formation of larger, cleaner, and smoother pores, enhancing porosity and increasing pore size. EDX analysis reveals that carbon (75.57%) is the predominant element in lemongrass-derived activated carbon, alongside O, K, Cu, Zr, and S. Additionally, the BET surface area (specific surface area) reaches 818 m2/g, with an average pore diameter of 1.91 nm.
The rapid activation process (10 min) enables efficient heating, uniform heat distribution, and the development of a well-structured porous network, contributing to improved adsorption performance. The adsorption isotherm follows the Langmuir model, indicating monolayer adsorption, while the adsorption kinetics align with the PFO rate equation. These findings highlight the suitability of microwave-assisted activated carbon from lemongrass waste as a promising and sustainable adsorbent for heavy metal removal.
Future research should focus on optimizing activation parameters and evaluating the performance of this adsorbent in real wastewater treatment applications. Large-scale application for mining wastewater treatment requires further study due to high operational costs and production challenges. Additionally, its lifespan must be considered, as continuous use leads to saturation. Research on regeneration is also essential, as it may be less cost-effective than ion exchange resins and requires stability assessment in real-world applications.
Acknowledgement: The authors sincerely appreciate the financial support provided by the Ministry of Research, Technology, and Higher Education, Indonesia.
Funding Statement: This research was funded by the Ministry of Research, Technology, and Higher Education under Grant Number B/67/D.D3/KD.02.00/2019, as part of the BPPDN (Beasiswa Pendidikan Pascasarjana Dalam Negeri—Domestic Postgraduate Education Scholarship) program.
Author Contributions: Lailan Ni`mah contributed to the study’s conception and design, methodology, formal analysis, investigation, and original draft preparation. Mahfud Mahfud and Sri Rachmania Juliastuti supervised the research, secured funding, validated the data, and reviewed the manuscript. All authors reviewed the results and approved the final version of the manuscript.
Availability of Data and Materials: The datasets generated in this study are available from the corresponding author upon request.
Ethics Approval: Not applicable.
Conflicts of Interest: The authors declare no conflicts of interest to report regarding the present study.
References
1. Pereira TCB, Santos KBD, Lautert-Dutra W, Teodoro LS, de Almeida VO, Weiler J, et al. Acid mine drainage (AMD) treatment by neutralization: evaluation of physical-chemical performance and ecotoxicological effects on zebrafish (Danio rerio) development. Chemosphere. 2020;253:126665. doi:10.1016/j.chemosphere.2020.126665. [Google Scholar] [PubMed] [CrossRef]
2. Eniola JO, Sizirici B, Fseha Y, Shaheen JF, Aboulella AM. Application of conventional and emerging low-cost adsorbents as sustainable materials for removal of contaminants from water. Environ Sci Pollut Res Int. 2023;30(38):88245–71. doi:10.1007/s11356-023-28399-8. [Google Scholar] [PubMed] [CrossRef]
3. Ilham R, Rahmah FK, Said NF, Budiono MB, Suprapto S. Optimization of phosphate adsorption using activated carbon derived from Pangium edule shell. J Renew Mater. 2024;12(11):1895–909. doi:10.32604/jrm.2024.055602. [Google Scholar] [CrossRef]
4. Hoang AT, Kumar S, Lichtfouse E, Cheng CK, Varma RS, Senthilkumar N, et al. Remediation of heavy metal polluted waters using activated carbon from lignocellulosic biomass: an update of recent trends. Chemosphere. 2022;302:134825. doi:10.1016/j.chemosphere.2022.134825. [Google Scholar] [PubMed] [CrossRef]
5. Worch E. Fundamentals, processes, and modeling. Berlin, Germany: De Gruyter; 2012. p. 1–332. (In German). [Google Scholar]
6. Khalfaoui A, Laggoun Z, Derbal K, Benalia A, Ghomrani AF, Pizzi A. Experimental study of selective batch bio-adsorption for the removal of dyes in industrial textile effluents. J Renew Mater. 2025;13(1):127–46. doi:10.32604/jrm.2024.056970. [Google Scholar] [CrossRef]
7. Haryanti NH, Suarso E, Manik TN, Sari N. Activated carbon from Nipa palm fronds (Nypa fruticans) with H3PO4 and KOH activators as Fe adsorbers. J Renew Mater. 2024;12(2):203–14. doi:10.32604/jrm.2023.043549. [Google Scholar] [CrossRef]
8. Tohamy HS, El-Sakhawy M, Kamel S. Development of magnetite/graphene oxide hydrogels from agricultural wastes for water treatment. J Renew Mater. 2022;10(7):1889–909. doi:10.32604/jrm.2022.019211. [Google Scholar] [CrossRef]
9. Abou-Zeid RE, Ali KA, Gawad RMA, Kamal KH, Kamel S, Khiari R. Removal of Cu(IIPb(IIMg(IIand Fe(II) by adsorption onto alginate/nanocellulose beads as bio-sorbent. J Renew Mater. 2021;9(4):601–13. doi:10.32604/jrm.2021.014005. [Google Scholar] [CrossRef]
10. Barhoum A, Jeevanandam J, Rastogi A, Samyn P, Boluk Y, Dufresne A, et al. Plant celluloses, hemicelluloses, lignins, and volatile oils for the synthesis of nanoparticles and nanostructured materials. Nanoscale. 2020;12(45):22845–90. doi:10.1039/d0nr04795c. [Google Scholar] [PubMed] [CrossRef]
11. Mishra RK, Singh B, Acharya B. A comprehensive review on activated carbon from pyrolysis of lignocellulosic biomass: an application for energy and the environment. Carbon Resour Convers. 2024;7(4):100228. doi:10.1016/j.crcon.2024.100228. [Google Scholar] [CrossRef]
12. Zakaria R, Jamalluddin NA, Abu Bakar MZ. Effect of impregnation ratio and activation temperature on the yield and adsorption performance of mangrove based activated carbon for methylene blue removal. Results Mater. 2021;10:100183. doi:10.1016/j.rinma.2021.100183. [Google Scholar] [CrossRef]
13. Menéndez JA, Arenillas A, Fidalgo B, Fernández Y, Zubizarreta L, Calvo EG, et al. Microwave heating processes involving carbon materials. Fuel Process Technol. 2010;91(1):1–8. doi:10.1016/j.fuproc.2009.08.021. [Google Scholar] [CrossRef]
14. Motasemi F, Afzal MT. A review on the microwave-assisted pyrolysis technique. Renew Sustain Energy Rev. 2013;28:317–30. doi:10.1016/j.rser.2013.08.008. [Google Scholar] [CrossRef]
15. Yao J, Chen H, Zhang J, Zhang X, Guan W. Effects of microwave heating paths on pores and cracks in bituminous coal. ACS Omega. 2021;6(38):24493–501. doi:10.1021/acsomega.1c02922. [Google Scholar] [PubMed] [CrossRef]
16. Cheng S, Zhang S, Zhang L, Xia H, Peng J, Wang S. Microwave-assisted preparation of activated carbon from Eupatorium adenophorum: effects of preparation parameters. High Temp Mater Process. 2017;36(8):805–14. doi:10.1515/htmp-2015-0285. [Google Scholar] [CrossRef]
17. Gomaa MB, Shetawy MA, Bassoumy ELRR, Geasa MM. Possibility of using olive-seeds residues as a source of activated carbon. Al-Azhar J Agric Eng. 2022;2(1):10–6. doi:10.21608/azeng.2022.240417. [Google Scholar] [CrossRef]
18. Zhang S, Liu S, Yu D, Wang C, Li Q. Preparation and characterization of activated carbon for separation of CO2. J China Univ Min Technol. 2014;43(5):910–4. [Google Scholar]
19. Şahin Ö, Saka C. Preparation and characterization of activated carbon from acorn shell by physical activation with H2O-CO2 in two-step pretreatment. Bioresour Technol. 2013;136:163–8. doi:10.1016/j.biortech.2013.02.074. [Google Scholar] [PubMed] [CrossRef]
20. Enaime G, Ennaciri K, Ounas A, Baçaoui A, Seffen M, Selmi T, et al. Preparation & characterization of AC. J Mater Environ Sci. 2017;8(11):4125–37. [Google Scholar]
21. Zięzio M, Charmas B, Jedynak K, Hawryluk M, Kucio K. Preparation and characterization of activated carbons obtained from the waste materials impregnated with phosphoric acid (V). Appl Nanosci. 2020;10(12):4703–16. doi:10.1007/s13204-020-01419-6. [Google Scholar] [CrossRef]
22. Fałtynowicz H, Kaczmarczyk J, Kułażyński M. Preparation and characterization of activated carbons from biomass material-giant knotweed (Reynoutria sachalinensis). Open Chem. 2015;13(1):000010151520150128. doi:10.1515/chem-2015-0128. [Google Scholar] [CrossRef]
23. Kra DO, Allou NB, Atheba P, Drogui P, Trokourey A. Preparation and characterization of activated carbon based on wood (Acacia auriculeaformis, Côte d’Ivoire). J Encapsulation Adsorpt Sci. 2019;9(2):63–82. doi:10.4236/jeas.2019.92004. [Google Scholar] [CrossRef]
24. Das D, Samal DP, Meikap BC. Preparation of activated carbon from green coconut shell and its characterization. J Chem Eng Process Technol. 2015;6(5):1000248. doi:10.4172/2157-7048.1000248. [Google Scholar] [CrossRef]
25. Ni’mah L, Juliastuti SR, Mahfud M. One-stage microwave-assisted activated carbon preparation from Langsat peel raw material for adsorption of iron, manganese and copper from acid mining waste. Commun Sci Technol. 2023;8(2):143–53. doi:10.21924/cst.8.2.2023.1299. [Google Scholar] [CrossRef]
26. Sakib MN, Mallik AK, Rahman MM. Update on chitosan-based electrospun nanofibers for wastewater treatment: a review. Carbohydr Polym Technol Appl. 2021;2:100064. doi:10.1016/j.carpta.2021.100064. [Google Scholar] [CrossRef]
27. Ho YS, McKay G. Pseudo-second order model for sorption processes. Process Biochem. 1999;34(5):451–65. doi:10.1016/S0032-9592(98)00112-5. [Google Scholar] [CrossRef]
28. Jha PK, Jha VK. Iodine adsorption characteristics of activated carbon obtained from Spinacia Oleracea (spinach) leaves. Mong J Chem. 2020;21(47):1–11. doi:10.5564/mjc.v21i47.1249. [Google Scholar] [CrossRef]
29. Ekpete OA, Horsfall MJNR. Preparation and characterization of activated carbon derived from fluted pump-kin stem waste (Telfairia occidentalis Hook F). Res J Chem Sci. 2011;1(3):10–7. [Google Scholar]
30. Cheng S, Zhang L, Xia H, Peng J, Shu J, Li C. Ultrasound and microwave-assisted preparation of Fe-activated carbon as an effective low-cost adsorbent for dyes wastewater treatment. RSC Adv. 2016;6(82):78936–46. doi:10.1039/c6ra14082c. [Google Scholar] [CrossRef]
31. Liu X, Han Y, Cheng Y, Xu G. Microwave-assisted ammonia modification of activated carbon for effective removal of phenol from wastewater: dft and experiment study. Appl Surf Sci. 2020;518:146258. doi:10.1016/j.apsusc.2020.146258. [Google Scholar] [CrossRef]
32. Cheng C, Liu H, Dai P, Shen X, Zhang J, Zhao T, et al. Microwave-assisted preparation and characterization of mesoporous activated carbon from mushroom roots by phytic acid (C6H18O24P6) activation. J Taiwan Inst Chem Eng. 2016;67:532–7. doi:10.1016/j.jtice.2016.08.032. [Google Scholar] [CrossRef]
33. Hesas RH, Daud W, Ashri WM, Sahu JN, Arami-Niya A. The effects of a microwave heating method on the production of activated carbon from agricultural waste: a review. J Anal Appl Pyrolysis. 2013;100:1–11. doi:10.1016/j.jaap.2012.12.019. [Google Scholar] [CrossRef]
34. Nurisman E, Miarti A, Sharul A. Studi Eksperimental Pengaruh Suhu Karbonisasi pada Prototipe Electrical Car-bonization Furnace (ECF) terhadap Rendemen dan Analisis Proksimat Karbon Aktif dari Limbah Tempurung Kelapa. In: Proceeding Seminar Nasional Pengelolaan Lingkungan; 2017 Nov 2; Palembang, Indonesia. [Google Scholar]
35. Dewi R, Azhari A, Nofriadi I. Aktivasi karbon Dari kulit pinang dengan menggunakan aktivator Kimia koh. J Teknol Kim Unimal. 2021;9(2):12–22. doi:10.29103/jtku.v9i2.3351. [Google Scholar] [CrossRef]
36. Lubis RAF, Nasution HI, Zubir M. Production of activated carbon from natural sources for water purification. Indones J Chem Sci Technol. 2020;3(2):67. doi:10.24114/ijcst.v3i2.19531. [Google Scholar] [CrossRef]
37. Zaini MAA, Meng TW, Kamaruddin MJ, Setapar SHM, Yunus MAC. Microwave-induced zinc chloride activated palm kernel shell for dye removal. Sains Malays. 2014;43(9):1421–8. [Google Scholar]
38. Cimò G, Kucerik J, Berns AE, Schaumann GE, Alonzo G, Conte P. Effect of heating time and temperature on the chemical characteristics of biochar from poultry manure. J Agric Food Chem. 2014;62(8):1912–8. doi:10.1021/jf405549z. [Google Scholar] [PubMed] [CrossRef]
39. Basu S, Ghosh G, Saha S. Adsorption characteristics of phosphoric acid induced activation of bio-carbon: equilibrium, kinetics, thermodynamics and batch adsorber design. Process Saf Environ Prot. 2018;117:125–42. doi:10.1016/j.psep.2018.04.015. [Google Scholar] [CrossRef]
40. Sahoo PK, Tripathy S, Panigrahi MK, Equeenuddin SM. Evaluation of the use of an alkali modified fly ash as a potential adsorbent for the removal of metals from acid mine drainage. Appl Water Sci. 2013;3(3):567–76. doi:10.1007/s13201-013-0113-2. [Google Scholar] [CrossRef]
41. Kul AR, Koyuncu H. Adsorption of Pb(II) ions from aqueous solution by native and activated bentonite: kinetic, equilibrium and thermodynamic study. J Hazard Mater. 2010;179(1–3):332–9. doi:10.1016/j.jhazmat.2010.03.009. [Google Scholar] [PubMed] [CrossRef]
42. Ni’mah L, Mahfud M, Juliastuti SR. Study of activated carbon from coconut shell waste to adsorb Cu and Mn metals in acid mine drainage. J Fibers Polym Compos. 2022;1(1):34–42. doi:10.55043/jfpc.v1i1.35. [Google Scholar] [CrossRef]
43. Murtihapsari M, Mangallo B, Handyani DD. Model isoterm freundlich Dan Langmuir oleh adsorben arang aktif bambu Andong (G. verticillata (Wild) Munro) Dan bambu ater (G. atter (Hassk) Kurz ex Munro). Sains Natural. 2012;2(1):17. doi:10.31938/jsn.v2i1.31. [Google Scholar] [CrossRef]
44. Borys P, Grzywna ZJ. On the fractality of the Freundlich adsorption isotherm in equilibrium and non-equilibrium cases. Phys Chem Chem Phys. 2016;18(30):20784–9. doi:10.1039/C6CP03356C. [Google Scholar] [PubMed] [CrossRef]
45. Omda SEl, Sergent SR. Standard deviation. CD-ROM Prof. 2024;8(7):90–1. doi:10.7748/ns.13.32.22.s43. [Google Scholar] [CrossRef]
46. Gayathiri M, Pulingam T, Lee KT, Sudesh K. Activated carbon from biomass waste precursors: factors affecting production and adsorption mechanism. Chemosphere. 2022;294:133764. doi:10.1016/j.chemosphere.2022.133764. [Google Scholar] [PubMed] [CrossRef]
47. Mane PV, Rego RM, Yap PL, Losic D, Kurkuri MD. Unveiling cutting-edge advances in high surface area porous materials for the efficient removal of toxic metal ions from water. Prog Mater Sci. 2024;146:101314. doi:10.1016/j.pmatsci.2024.101314. [Google Scholar] [CrossRef]
48. Hameed BH, Ahmad AA, Aziz N. Isotherms, kinetics and thermodynamics of acid dye adsorption on activated palm ash. Chem Eng J. 2007;133(1–3):195–203. doi:10.1016/j.cej.2007.01.032. [Google Scholar] [CrossRef]
49. Akhtar MS, Ali S, Zaman W. Innovative adsorbents for pollutant removal: exploring the latest research and applications. Molecules. 2024;29(18):4317. doi:10.3390/molecules29184317. [Google Scholar] [PubMed] [CrossRef]
Cite This Article
 Copyright © 2025 The Author(s). Published by Tech Science Press.
This work is licensed under a Creative Commons Attribution 4.0 International License , which permits unrestricted use, distribution, and reproduction in any medium, provided the original work is properly cited.
 Downloads
 Citation Tools