
 Submit a Paper
 Propose a Special lssue
 Open Access
ARTICLE
Effect of Design Parameters on the Properties of PLA Biocomposites Fabricated via Fused Filament Deposition
1 Programa de Ingenieria Civil, Facultad de Ingenieria, Universidad Militar Nueva Granada, Carrera 11, N. 101-80, Bogota, 111321, Colombia
2 Facultad de Ciencias, Departamento de Fisica, Universidad Nacional de Colombia, Carrera 45, N. 26-85, Bogota, 111321, Colombia
* Corresponding Author: Martha L. Sánchez. Email:
(This article belongs to the Special Issue: Advances in Eco-friendly Wood-Based Composites: Design, Manufacturing, Properties and Applications – Ⅱ)
Journal of Renewable Materials 2025, 13(7), 1413-1437. https://doi.org/10.32604/jrm.2025.02025-0028
Received 01 February 2025; Accepted 23 April 2025; Issue published 22 July 2025
 View Full Text
 Download PDF
Abstract
The use of additive manufacturing techniques in the development of unconventional materials can help reduce the environmental impact of traditional construction materials. In this paper, the properties of a 3D-printed biocomposite were evaluated. Biofilaments obtained by mixing pulverized bamboo fibers with polylactic acid (PLA) resin were extruded during the manufacturing process. To assess the effect of incorporating plant fibers, an analysis was conducted on the morphology, elemental chemical composition, crystallinity index, principal functional groups, thermal stability, surface roughness, microhardness, density, tensile strength, elastic modulus, and strain percentage of reinforced samples. The results were compared with those obtained from the characterization of standard PLA filaments (unreinforced). The fused deposition modeling (FDM) technique was employed to print biocomposite specimens. Additionally, the influence of the printing parameters (infill density, build orientation, and layer thickness) on the physical, tribological, and mechanical properties of the biocomposites was analyzed. These results were compared with those obtained for specimens printed with pure PLA. The findings indicate that incorporating 10% vegetable filler into PLA filaments enhanced the strength and stiffness of the biocomposite under axial loads. Finally, the strength of the biocomposite subjected to axial loads was compared with the standardized values for wood-plastic composites, demonstrating the feasibility of its use for non-structural purposes in civil construction.Keywords
The development and application of new materials has positively influenced various industrial sectors. The use of biodegradable resources to obtain alternative composite materials contributes to the mitigation of the environmental impact associated with both the use of petroleum-derived resources and the management of solid waste, which represents a critical aspect of sustainable development [1–4].
Due to their innovative nature, additive manufacturing methods have gained importance in the design and development of biocomposite materials [5]. Unlike traditional production processes, these methods do not require the use of specialized tools, enabling the production of personalized designs with a reduction in time, costs, and waste, allowing the optimization of the design according to the function of the material [5,6].
In recent years, there have been significant advances in the 3D printing of polymer composites. The filament fused deposition modeling (FDM) technique enables the printing of composite materials, allowing flexibility and versatility in the design of unconventional materials [7–11].
According to Vălean et al., one of the most-used polymers in fused deposition modeling processes is polylactic acid (PLA) [12]. This polymer is processed from the chemical sintering of sugars obtained from the biomass of plants such as corn, cassava, and sugar cane. This resin stands out for its thermoplastic character, which allows its reversible deformation under heat, facilitating its processing and reuse [13].
Recent studies have focused on evaluating the mechanical performance of biocomposites made by 3D printing PLA filaments reinforced with plant fibers [14–18]. Some research has focused on analyzing the effect of the type of fiber, its orientation, and its dosage on the strength and stiffness of the material. The results suggest that the incorporation of plant fibers as reinforcement in PLA filaments improves the strength and stiffness when compared to specimens obtained by means of the deposition of pure PLA filaments [14–16]. Although there may be an increase in the mechanical properties of biocomposites made with biofilaments, some experimental results demonstrate that by increasing the content of reinforcing particles in the filament, the printed surface becomes more porous and rougher [2]. Additionally, due to the water absorption of plant fibers, these compounds may not perform adequately in humid environments [17,18].
Experimental results have shown that it is possible to improve the mechanical behavior of the material by subjecting the plant fibers to preliminary surface treatments and a drying process prior to mixing and extruding the filaments [19]. The selection of parameters such as temperature and extrusion speed, as well as the use of lubricants, can contribute to improving the quality of the filaments, thus reducing the appearance of voids and guaranteeing a homogeneous distribution of the fibers that act as reinforcement [20].
It has recently been proven that the parameters involved in the printing process can affect the physical and mechanical properties of biocomposite specimens [21]. Research in recent years has proven that the proper selection of the infill pattern can improve the energy absorption capacity of the material [21,22]. Other factors, such as build orientation, layer thickness, raster width and angle, and infill percentage are variables that influence the mechanical performance of the material and therefore must be considered [23,24]. It is for this reason that previous research has focused on the study of these parameters and their effect on the properties of parts obtained through FDM [25–29].
Based on the above, the purpose of this study was to evaluate the properties of a 3D printed biocomposite using filaments extruded from a mixture of pulverized bamboo fibers and a polylactic acid (PLA) resin. The physical, chemical, and mechanical properties of the filaments were analyzed: morphology, elemental chemical composition, crystallinity index, functional groups, thermal stability, surface roughness, microhardness, density, tensile strength, elastic modulus, and strain percentage. In order to evaluate the efficiency of filling with bamboo fibers, the results were compared with those obtained when characterizing simple PLA filaments (unreinforced). Filament fused deposition modeling (FDM) was used to print biocomposite specimens. The influence of the printing parameters (infill density, build orientation, and layer thickness) on the physical (density and absorption capacity), tribological (friction coefficient and wear rate), and mechanical (tensile and compressive strength) properties of the biocomposites were analyzed. The experimental results were compared with those obtained for specimens printed with pure PLA. Finally, the tensile and compressive strengths were evaluated against the standardized values for wood-plastic composites (WPC).
Strips 5 cm wide and 30 cm long were obtained from four-year-old bamboo culm stems of the species Guadua angustifolia Kunth. Subsequently, the strips were crushed by mechanical means in order to obtain short fibers (between 1 and 2 cm long). Ozone treatment was carried out in order to eliminate lignin, wax, oil, and some impurities. A Clearwater Tech LLC generator was used for the treatment. The ozone was added at a rate of 230 mg O3/h. The fibers were treated for two hours. After treatment, the fibers were dried, pulverized, and sieved through a 45 µm sieve. The size of the filler was selected based on the characteristics of the extruder used (single-screw extruder). With the use of particles retained in the #325 sieve (45 μm), the dispersion capacity of the reinforcement within the PLA increases. On the other hand, larger particles can cause clogging in the extruder nozzle and affect the surface quality of the extruded filament.
For this study, an Ingeo biopolymer 4032D was used. Following the supplier’s suggestions, the material was dried for 4 h at 80°C to prevent loss of viscosity. After drying, the material was stored in a sealed package in order to avoid contact with atmospheric conditions.
1.75 mm filaments were obtained by applying the extrusion method. Pure PLA filaments (PLA-F) and filaments obtained from the combination of PLA and pulverized Guadua fibers (PLA-G-F) were constructed using a single-screw extruder operating at 50 mm/s. The extrusion temperature was 180°C. A commercial biodegradable plasticizer was used to improve the mixing and extrusion process. For the PLA-G-F filaments, a composition of 90% granulated PLA and 10% pulverized Guadua fibers was used.
2.2 Properties of PLA-F and PLA-G-F Filaments
2.2.1 Morphology and Elemental Composition
To analyze the morphology of the filaments, the scanning electron microscopy (SEM) technique was employed, using a Tescan Vega3 electronic microscope with the detection of secondary electrons (SE). To improve the electrical conductivity, the specimens were metallized. Micrographs at 106x magnification were obtained. The acceleration voltage of the electron beam was 20 kV, and the working distance (WD) was 14.9 mm. The determination of the elemental composition of the filaments was done by applying the energy-dispersive X-ray spectroscopy (EDS) technique, using a Bruker XFlash 410M analyzer attached to the SEM microscope.
The X-ray diffraction (XRD) spectra of the PLA-F and PLA-G-F filaments were obtained using a Malvern PANalytical X-ray diffractometer. The scanned samples were taken at diffraction angles between 10° and 40°. The crystallinity index (C.I) was calculated by means of Eq. (1).
2.2.3 Chemical Functional Groups
Fourier transform infrared spectroscopy (FTIR) was performed using a Thermo Scientific Nicolet iS10 equipped with an ATR module, covering a measurement range of 4000 to 600 cm−¹ with 16 scans.
A simultaneous thermal analysis (DSC-TGA) was conducted using an SDT Q600 V20.9 Build 20. The results were obtained according to ISO 11358-1:2022 [30]. Thermal stability tests were carried out in a synthetic air atmosphere at 60 mL/min with a ramp of 5°C/min, in alumina crucibles. The combustion starting temperature (Toi), the ignition temperature (Ti), the temperature at which the maximum rate of weight loss occurred (Tmax), the burning temperature (Tb), the final combustion temperature (Tof), and the total mass loss percentage (Δm) were determined.
The roughness of the filaments was determined using a PCERT 1200 roughness tester. This instrument allows a measurement range between 0.020 and 160.0 μm and works by moving a 5 µm radius diamond pointer with a curvature of 90°. For the tests, ten specimens of 1.75 mm in diameter and 5 cm in length were evaluated.
The Vickers microhardness (HV) was determined using a FALCON 400G2 durometer from Innovatest, applying a load of 50 g. The test was carried out following the recommendations of the ISO 6507-1:2018 standard [31]. The HV was determined using Eq. (2).
where P is the applied load in kg, and D is the average diagonal length.
To determine the density of the filaments, five specimens with a diameter of 1.75 mm and a length of 5 cm were analyzed. The pycnometer test was conducted following Method B of the ISO 1183-1:2019 standard [32]. Density (
where mS,A is the apparent mass in air, in g, mS,IL is the apparent mass in the immersion liquid, in g, and ρIL is the density of the immersion liquid at 23°C, in g/cm3.
2.2.8 Mechanical Properties of PLA-F and PLA-G-F Filaments
For the mechanical tests, an axial tensile test was performed. Fifteen samples of 1.75 mm in diameter and 5 cm in length were prepared. The mechanical tests were carried out on a WP 300 universal testing machine, which has a 20 kN load capacity. The tensile test is shown in Fig. 1. The strain rate was 1 mm/min.

Figure 1: Filament tension test
The dimensions of the tensile specimens were established in accordance with the recommendations of ASTM D638-Type V [33]. For the compression tests, the samples were designed with a diameter of 25 mm and a length of 50 mm. To define the number of specimens, a three-factor complete general factorial design was used. For each factor, three levels and five replicates were defined. Based on the experimental design, the number of probes to be tested was defined. A total of 270 samples were printed (135 for tensile and 135 for compression tests). The models were prepared using Ultimarker Cura 5.5.0 software and were printed using a Creality Ender 5 S1 3D Printer. The printing parameters are presented in Table 1.

2.4 Physical Characterization of 3D Printing
The surface roughness was determined following the procedure outlined in Section 2.2.5. A measuring platform was employed to adjust the position between the specimen and the instrument. To enhance the accuracy of the results, ten measurements were taken for each specimen. HV hardness was evaluated according to the procedure described in Section 2.2.6. For these tests, five specimens with a diameter of 15 mm and a thickness of 3 mm were designed for each of the combinations defined during the printing process. The absorption capacity after 24 h of immersion in water at room temperature was assessed in accordance with ASTM 570-22 [34]. Test specimens with a diameter of 50.8 mm and a thickness of 3.2 mm were prepared for this evaluation. The density of the specimens was determined following the procedures outlined in ASTM D792-20 [35], using square samples measuring 2 cm on each side.
The tribological properties were assessed by measuring the coefficient of friction (COF) and calculating the wear rate. For the tests, specimens were printed with a diameter of 15 mm and a thickness of 5 mm. The “pin-on-disk” technique was employed using a Nanovea tribometer. Testing was conducted at room temperature with a Cr6 steel ball 6 mm in diameter. The linear speed was set at 600 mm/min with an amplitude of 10 mm, and the test was carried out for 1000 cycles. A normal load of 5 N was applied, resulting in a total sliding distance of 20 m. The wear rate was calculated using Archard’s law [36].
2.6 Mechanical Characterization of 3D Printed Specimens
For the mechanical characterization, tensile and axial compression tests were performed. The tensile tests of the 3D-printed biocomposites were conducted in accordance with ASTM D638 specifications [33]. The compression tests were carried out following the recommendations of ASTM D695 [37]. The mechanical tests were carried out on the WP 300 universal testing machine, which has a 20 kN load capacity. For the tensile tests, the strain rate was 1 mm/min. For the compression tests, the strain rate was 1.3 mm/min. The test setup is shown in Fig. 2. The calculated properties include the tensile and compressive strength, the elastic modulus under tensile and compressive loads, and the maximum strain percentages.

Figure 2: Tensile tests
3.1 Morphology and Elemental Composition
The SEM micrographs for PLA-F and PLA-G-F are shown in Fig. 3a,b. Comparing the micrographs, some differences can be seen in the surface texture of the filaments. In Fig. 3b, the presence of microvoids and the randomly distributed Guadua fibers is evident. The microvoids could be associated with the non-homogeneous distribution of pulverized Guadua fibers and PLA granules during the extrusion process. On the other hand, some irregularities and the presence of some protuberances can be observed in PLA-G-F filaments (see Fig. 3b). Similar results were presented by Karis et al. [38], and these are aspects that must be considered, since they could cause clogging of the nozzle due to the agglomeration of fibers and the irregular diameter of the filament.

Figure 3: Morphology of filaments: (a) transversal section of PLA-F; (b) transversal section of PLA-G-F
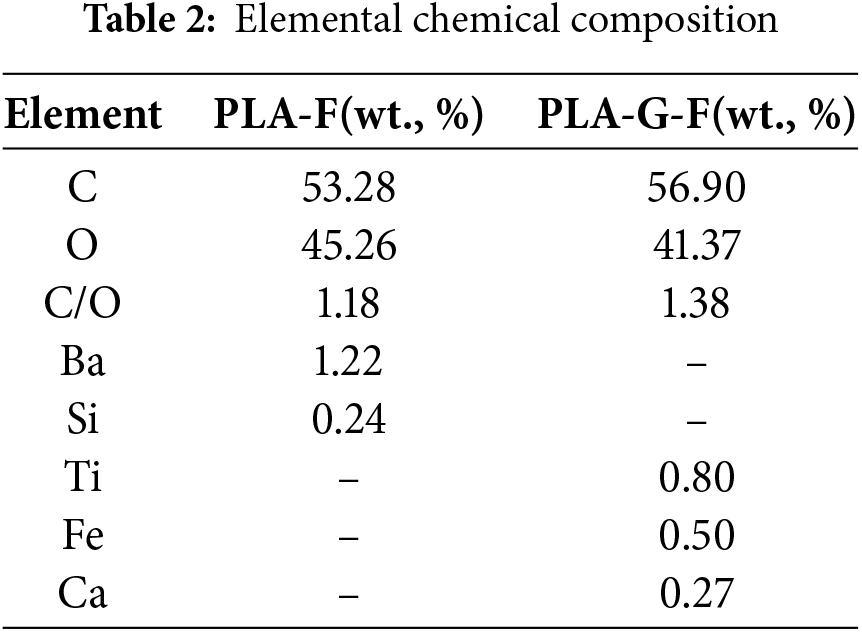
EDS was used to analyze the elemental composition of the filaments. Fig. 4 presents the spectra. From the figure, it can be observed that more than 98.5% of the elemental composition of the fibers corresponds to carbon and oxygen elements, while the small concentrations of Ba, Si, Fe, and Ti may be associated with impurities and/or contamination during the extrusion process. A small percentage of Ca (0.27%) in PLA-G-F filaments could be related to the lignocellulosic nature of the vegetal fiber. The results presented in Table 2 show the elemental composition of filaments, as well as the atomic C/O ratio. An increase of 14.5% can be observed in the C/O ratio of the PLA-G-F. Similar results were reported by Mondragón-Herrera et al. [39] and can be attributed to the addition of vegetable fiber as filament filler.
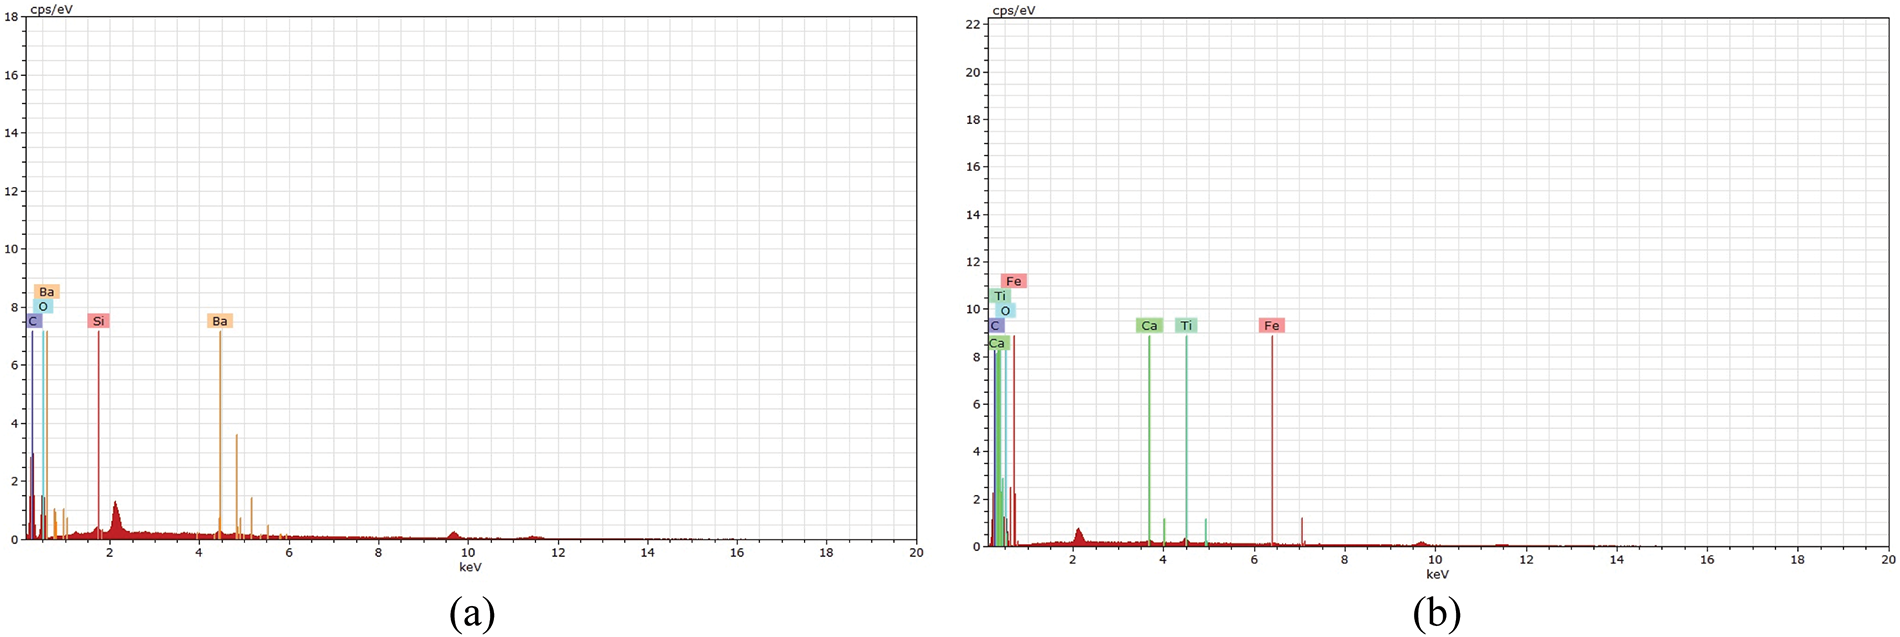
Figure 4: EDS of filaments: (a) PLA-F; (b) PLA-G-F
XRD spectra of the PLA-F and PLA-G-F filaments were analyzed. The deconvolution and the identification of crystallographic planes are shown in Fig. 5a,b. The results suggest the semi-crystalline nature of the filaments analyzed. The diffractograms of PLA-F and PLA-G-F display characteristic crystalline peaks corresponding to the planes (020) at 13.54°, (010) at 16.22°, (021) at 19.87°, (121) at 25.2°, (040) at 27.14°, and (002) at 28.97°. By contrast, the PLA-G-F diffractograms show distinctive peaks for the planes (020) at 13.75°, (110) at 16.58°, (111) at 22.13°, and (040) at 27.47°. The observed crystalline peaks may be attributable to the α structure of PLA [40].
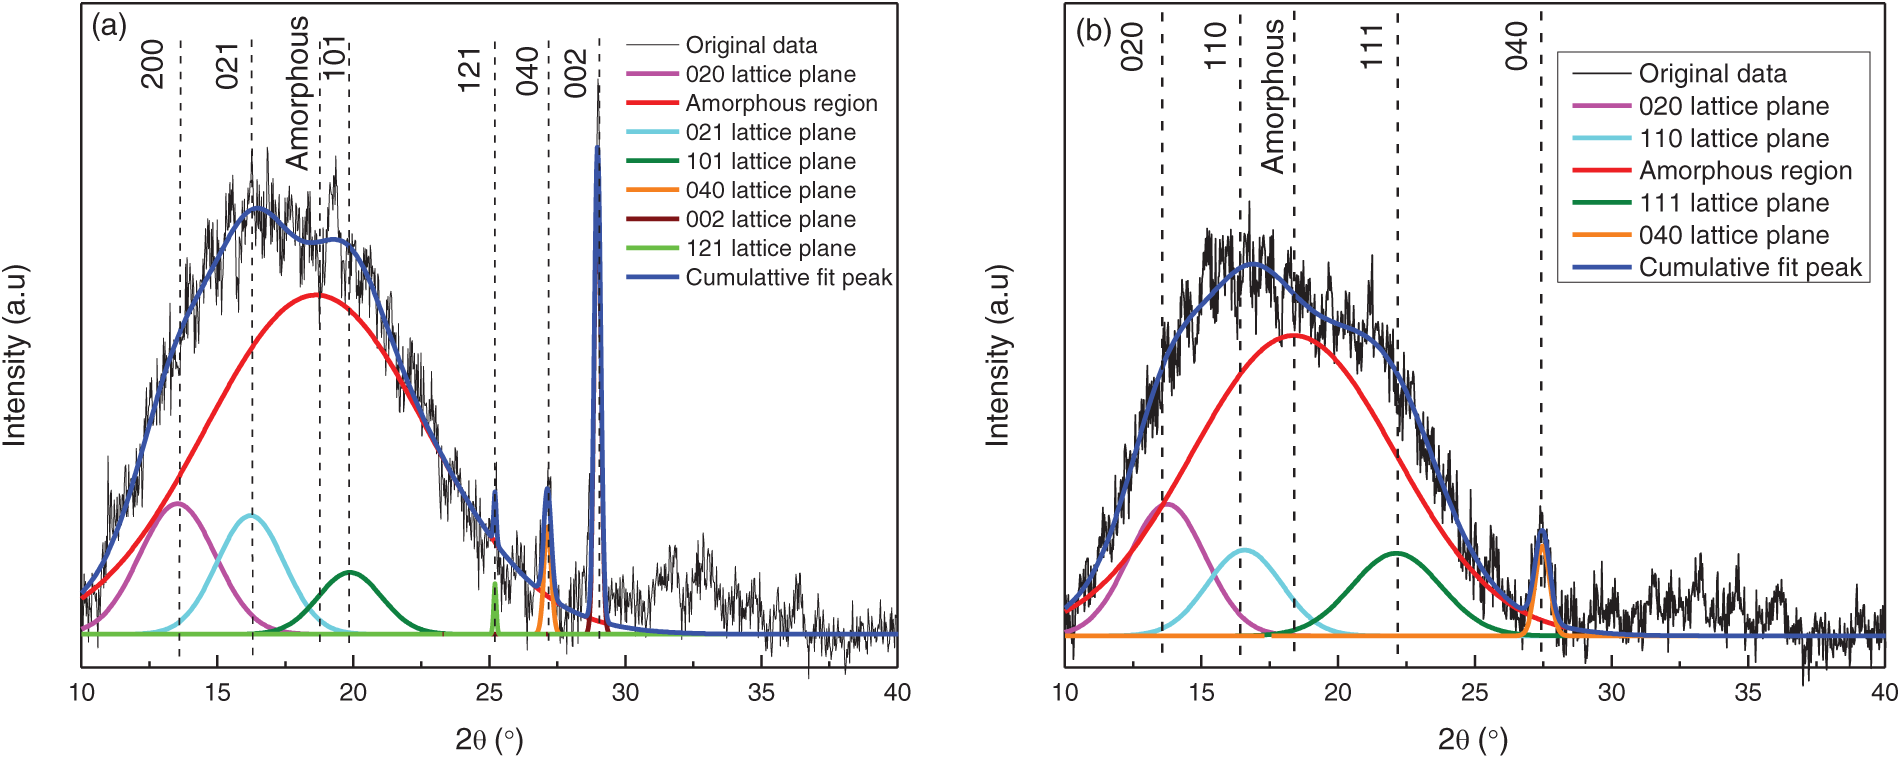
Figure 5: Spectral deconvolution and crystallographic plane identification: (a) PLA-F; (b) PLA-G-F
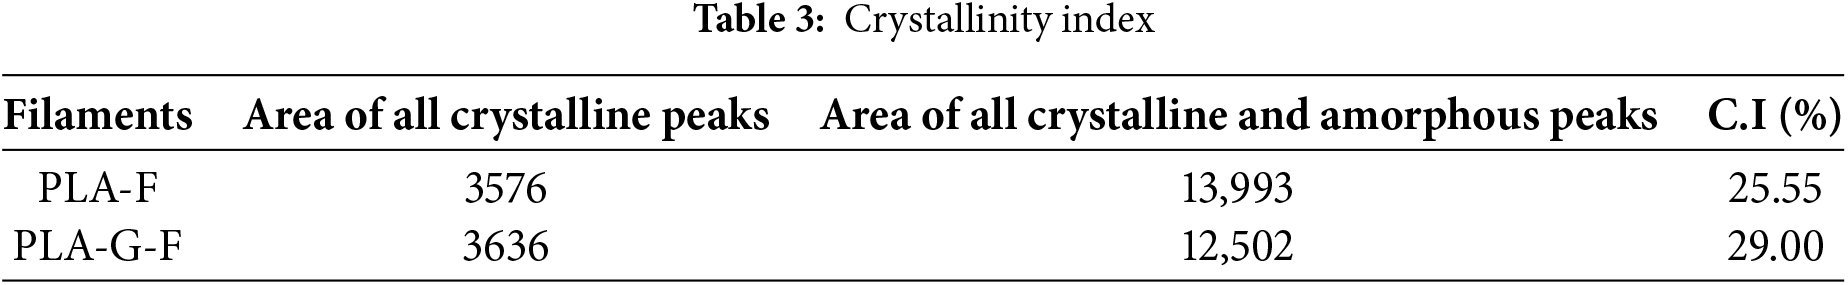
The crystallinity index (C.I) was calculated using Eq. (1) (see Table 3). The results show an increase of 13.50% in the crystallinity index of the PLA-G-F. According to Liao et al., because of the semi-crystalline nature of PLA it is important to evaluate its crystallinity index and how this value influences the processing of materials obtained through additive manufacturing processes [41]. Although increasing the crystallinity index can improve the mechanical performance and strength against thermal degradation of the material, this increase can affect the adhesion between its successive layers during the printing process. Additionally, depending on the diameter of the nozzle, it may be necessary to increase its temperature in order to avoid clogging during the deposition of the filament on the printing bed [42]. An increase in temperature facilitates the flow of the filament, promoting greater adhesion between successive printing layers, thus counteracting the effect of the increase in the crystallinity index on the adhesion between the printing layers.
3.3 Chemical Functional Groups
The ATR-FTIR technique was employed to identify the principal absorption bands corresponding to the functional groups present in the filaments, as shown in Fig. 6. The results indicate that both PLA-F and PLA-G-F exhibit the same functional groups. The bands observed between 2995 and 2851 cm−¹ are associated with the symmetric and asymmetric stretching of C–H in CH3. The band near 1745 cm−¹ suggests carbonyl group stretching. The bands between 1453 and 1360 cm−¹ are related to the symmetric and asymmetric bending of the CH3 bond, while those between 1266 and 1081 cm−¹ correspond to the ether group (C-O-C). Additionally, the bands from 1043 to 956 cm−¹ correspond to the rocking of the C–CH3 bond, and the bands near 867 and 754 cm−¹ represent the stretching of the O-CH-CH3 group and the wagging of CH3, respectively [40–43]. On analyzing the ATR-FTIR spectra, variations in the intensity of the bands between 2995 and 2851 cm−¹ can be observed. Similar results were found by Macedo et al. [44] and may be related to changes in the structure of CH3. According to Kljun et al., the lateral order index (LOI) can be used to interpret qualitative changes in crystallinity [45]. This index is based on establishing the relationship between the absorbance bands located at 1430 and 893 cm−1. Generally, as the LOI increases, the crystallinity also increases. The LOI was determined for the filaments studied, and values of 1.09 and 1.15 were found for the PLA-F and PLA-G-F, respectively. An increase of 5% can be seen in this value. These results are consistent with the increase in the crystallinity index value of the PLAF-G presented in Table 3.
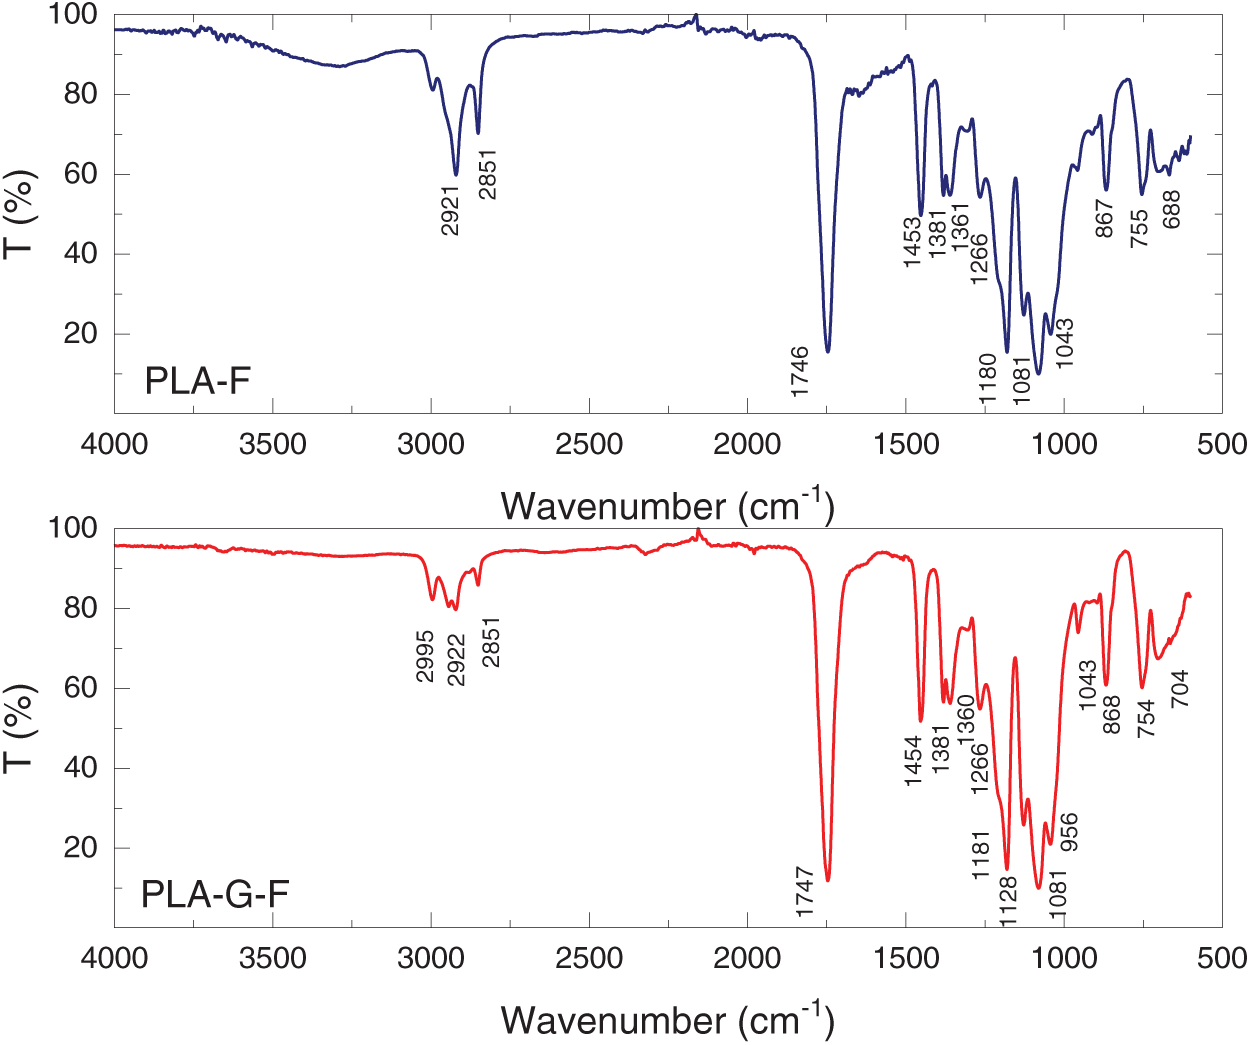
Figure 6: ATR-FTIR spectra for PLA-F and PLA-G-F filaments. T is the transmittance
A combined DSC-TGA thermal analysis was performed to evaluate the thermal stability of the PLA-F and PLA-G-F filaments. The results are shown in Figs. 7 and 8. The findings indicated that adding pulverized Guadua fibers did not significantly affect the thermal stability of the filaments. The first thermal transition observed was the glass transition temperature (Tg), which occurred between 60°C and 65°C for PLA-F and close to 72°C for PLA-G-F. On the other hand, an exothermic peak near 100°C in the PLA-G-F filaments can be associated with the cold crystallization of PLA (Tc), indicating the crystallization of the polymer with increasing temperature. The main endothermic peak can be observed near 175°C and corresponds to the melting temperature Tm. Differences between the values obtained for PLA-F and PLA-G-F may be related to changes in the crystallinity of the filaments because of the incorporation of plant fibers. Finally, at temperatures above 350°C, an exothermic peak can be seen, which is related to the weight loss detected in the TGA curves, confirming the thermal degradation of the material. Similar results were reported by Cuifo et al. and show typical behavior for semicrystalline thermoplastic materials [46].
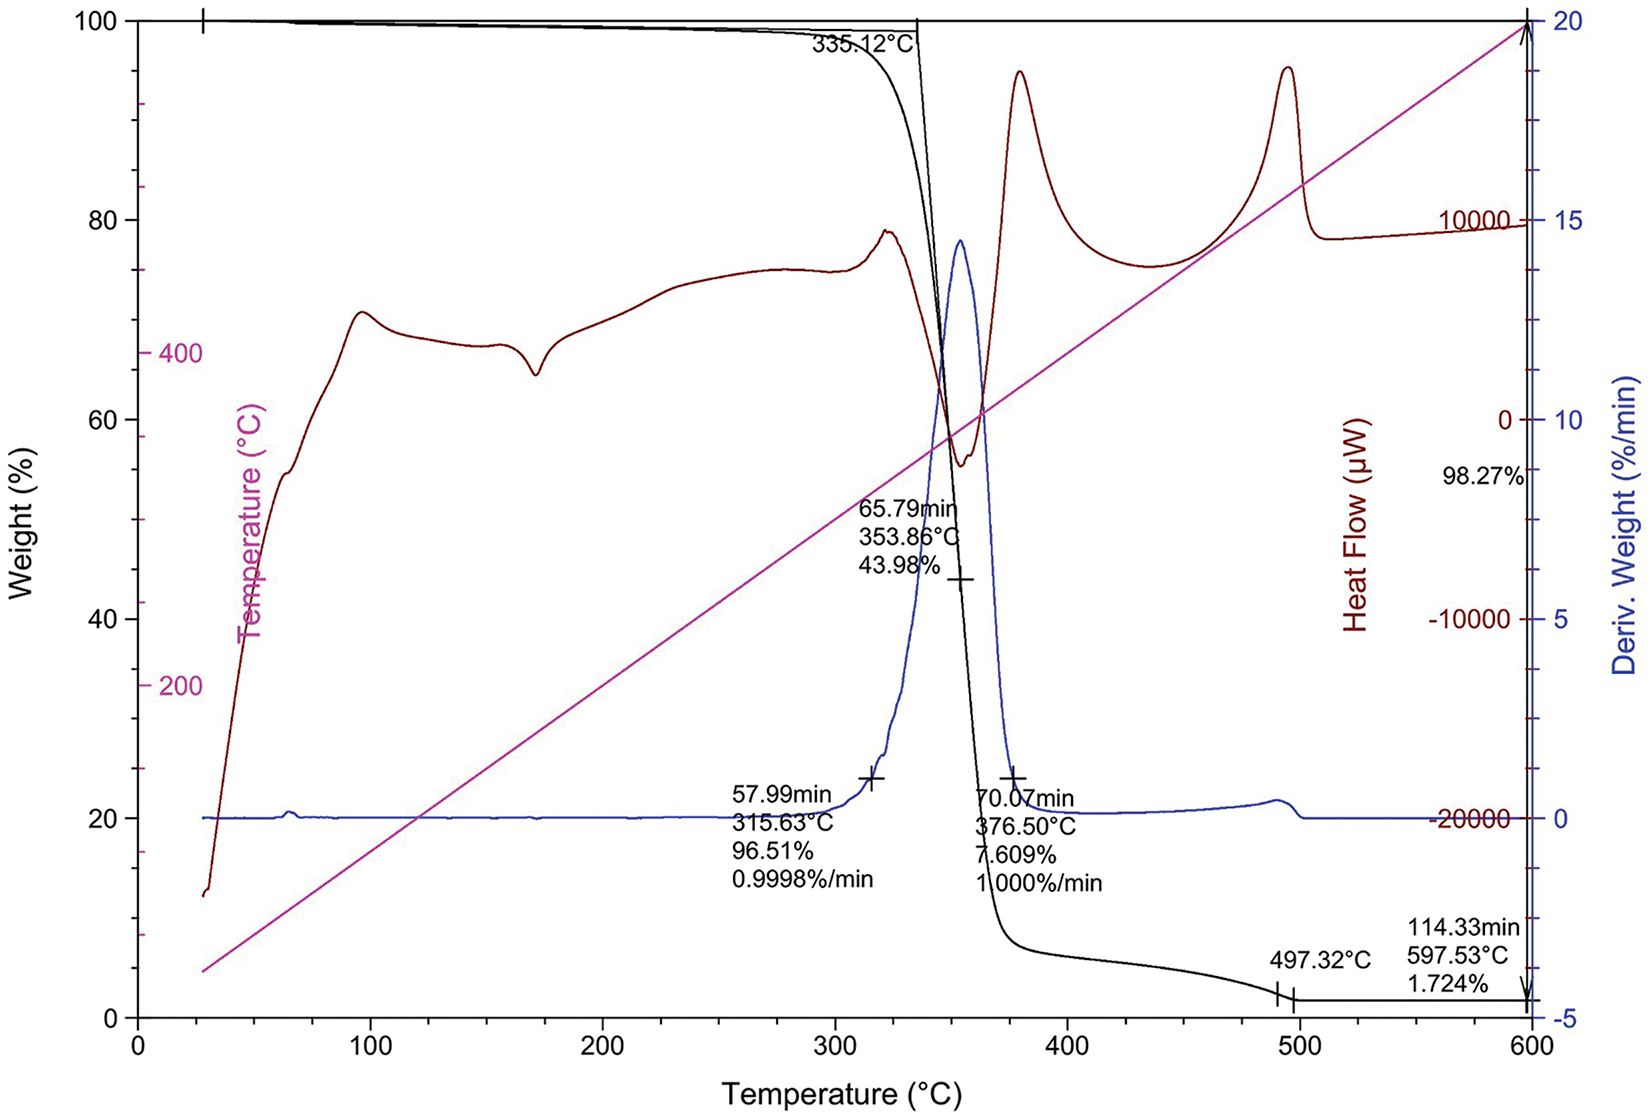
Figure 7: DSC-TGA analysis for PLA-F
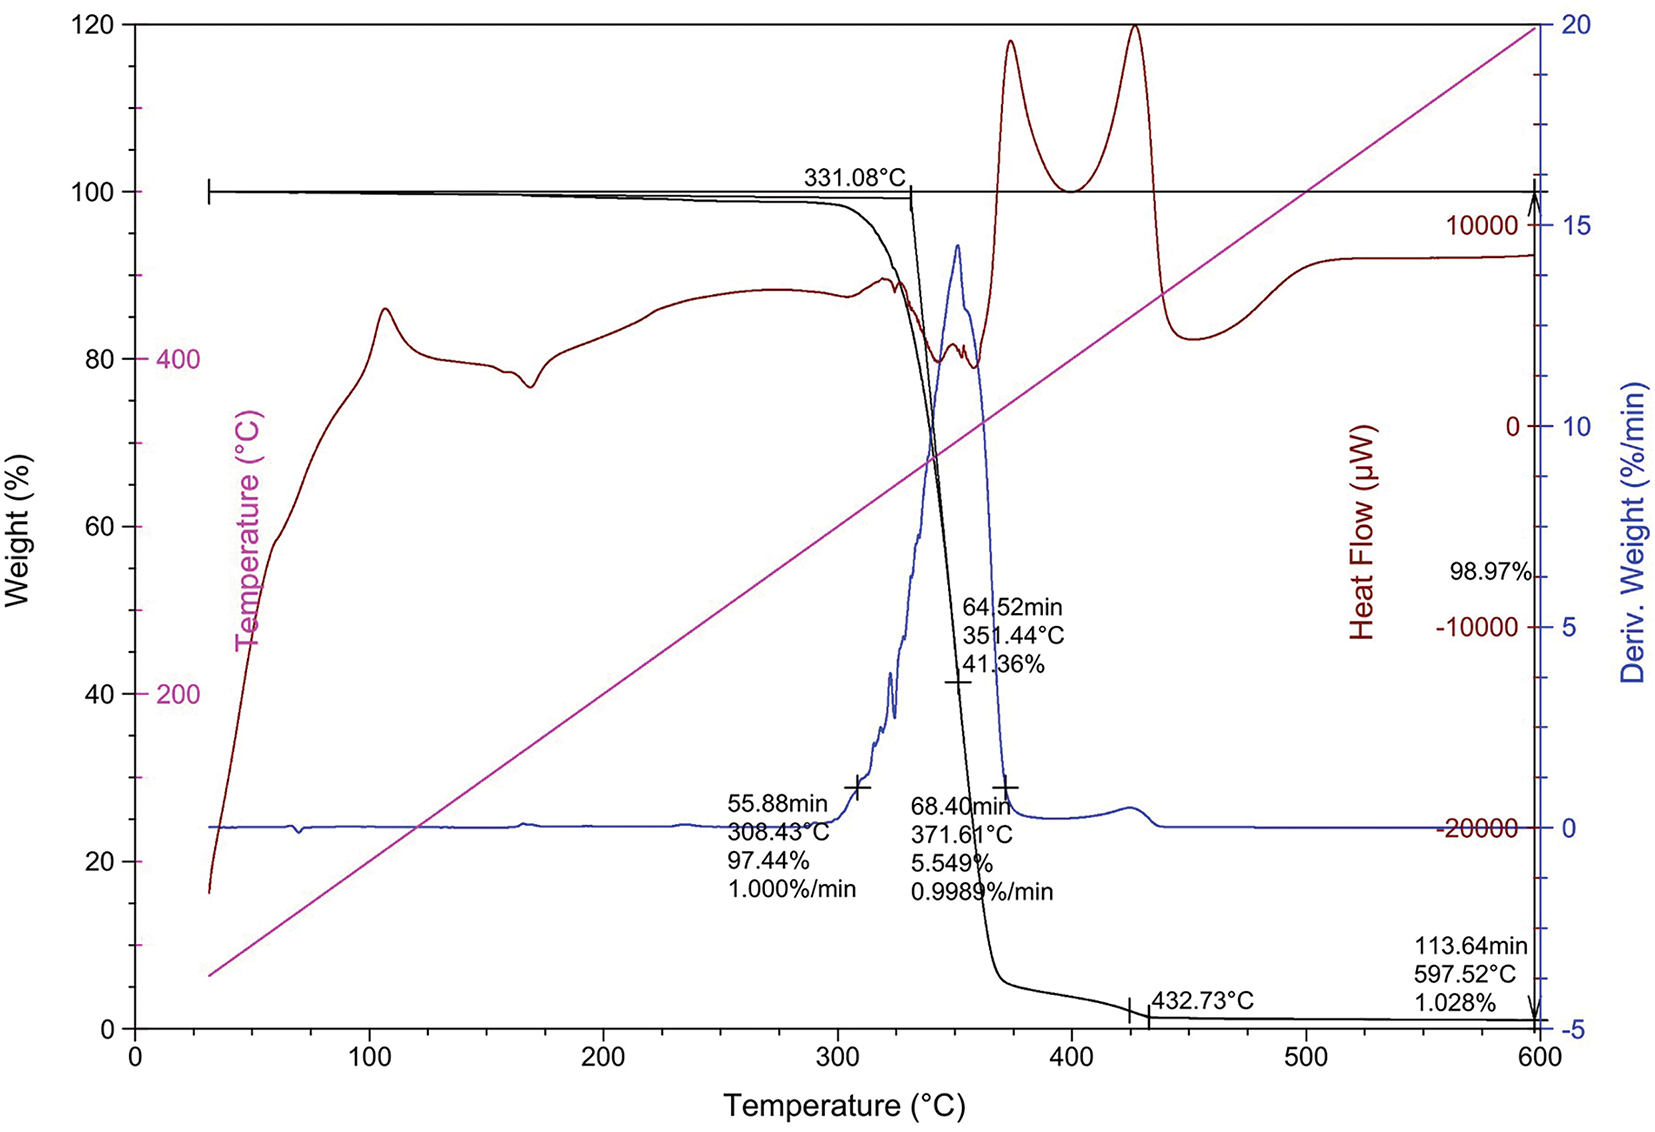
Figure 8: DSC-TGA analysis for PLA-G-F
The stages of the thermal degradation of the filaments can be observed in Figs. 7 and 8. At a temperature close to 150°C, a slight decrease in mass (less than 2%) in both filaments can be related to the loss of initial humidity of the samples and the elimination of volatile compounds present in the PLA-G-F filament. In Fig. 7, the PLA-F degradation process was divided into two stages. The first, located between 315.63°C and 353.86°C, can be associated with the main degradation of the polymer. At this stage, a mass loss of 96.51% and a maximum degradation rate of 0.9998%/min can be seen. Additionally, an endothermic peak at 335.12°C could be related to the thermal decomposition of PLA. A second degradation stage can be seen between 376.50°C and 497.32°C, suggesting the presence of carbonaceous residues in the sample. Finally, the endothermic peak at 597.53°C could be related to the carbonization of these residues.
Fig. 8 shows the thermal degradation stages of the PLA-G-F filaments. Similar results were presented by Khan et al. [47]. In this case, it is possible to identify three stages in the degradation process. The first stage begins at a temperature of 308.43°C and corresponds to the initial degradation of hemicellulosic compounds. The second stage can be observed between 351.44°C and 371.61°C. This is the fundamental phase of the mass loss of the filament and could be associated with the thermal degradation of the cellulose. In the third stage, the degradation of PLA begins. This occurs at temperatures above 350°C.
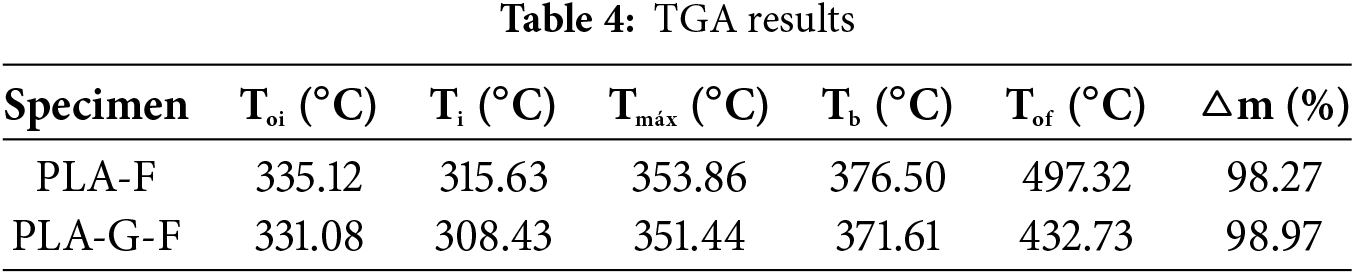
Table 4 presents the TGA results for the PLA-F and PLA-G-F specimens. It can be seen that the addition of Guadua filler results in a reduction of less than 3% in the values of Toi, Ti, Tmax, and Tb temperatures. However, a 12% reduction in the value of the end of combustion temperature can be observed in the PLA-G-F. According to Daver et al., this can be attributed to the decomposition of low molecular weight substances present in the plant fibers used as filler. These substances can decompose at lower temperatures, thus influencing the overall thermal behavior of the biocomposite [48].
3.5 Physical and Mechanical Properties of the Filaments
Table 5 presents the physical and mechanical properties of the PLA-F and PLA-G-F filaments. The results indicate that the incorporation of vegetal filler did not significantly reduce the density of the filaments, with differences of less than 3%. Additionally, an increase in the roughness and hardness of the PLA-G-F was observed, with values rising by 15% and 20%, respectively. According to Kariz et al., the non-homogeneous distribution of the filler during the extrusion process can lead to irregularities and protuberances that contribute to increased roughness of the filaments [38]. On the other hand, the vegetable filler acts as a reinforcement for the thermoplastic resin, enhancing both the hardness and the tensile strength of the biofilament.
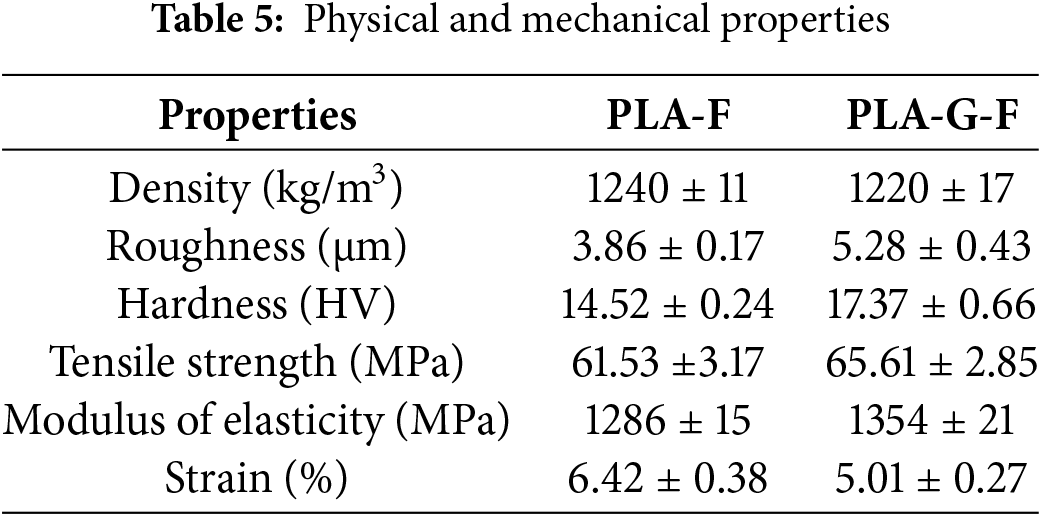
On analyzing the mechanical properties, an increase of up to 10% in the strength and stiffness of PLA-G-F was seen. Similar findings were reported by Lau et al. and can be attributed to the amount of fiber used as filler (10%) [49]. Despite the increase in the strength and stiffness values of the filament under tension, a reduction of approximately 22% in the maximum strain percentage demonstrates the loss of ductility of the filaments with the addition of the filler material. The nonhomogeneous dispersion of the reinforcement and the presence of voids in the filament can increase the brittleness of the filament, affecting their quality and the mechanical performance of the manufactured products [50].
3.6 Physical Characterization of Printed Specimens
The effect of the printing parameters on the hardness and roughness of the specimens printed with PA-G-F was analyzed. The results are shown in Fig. 9a,b.
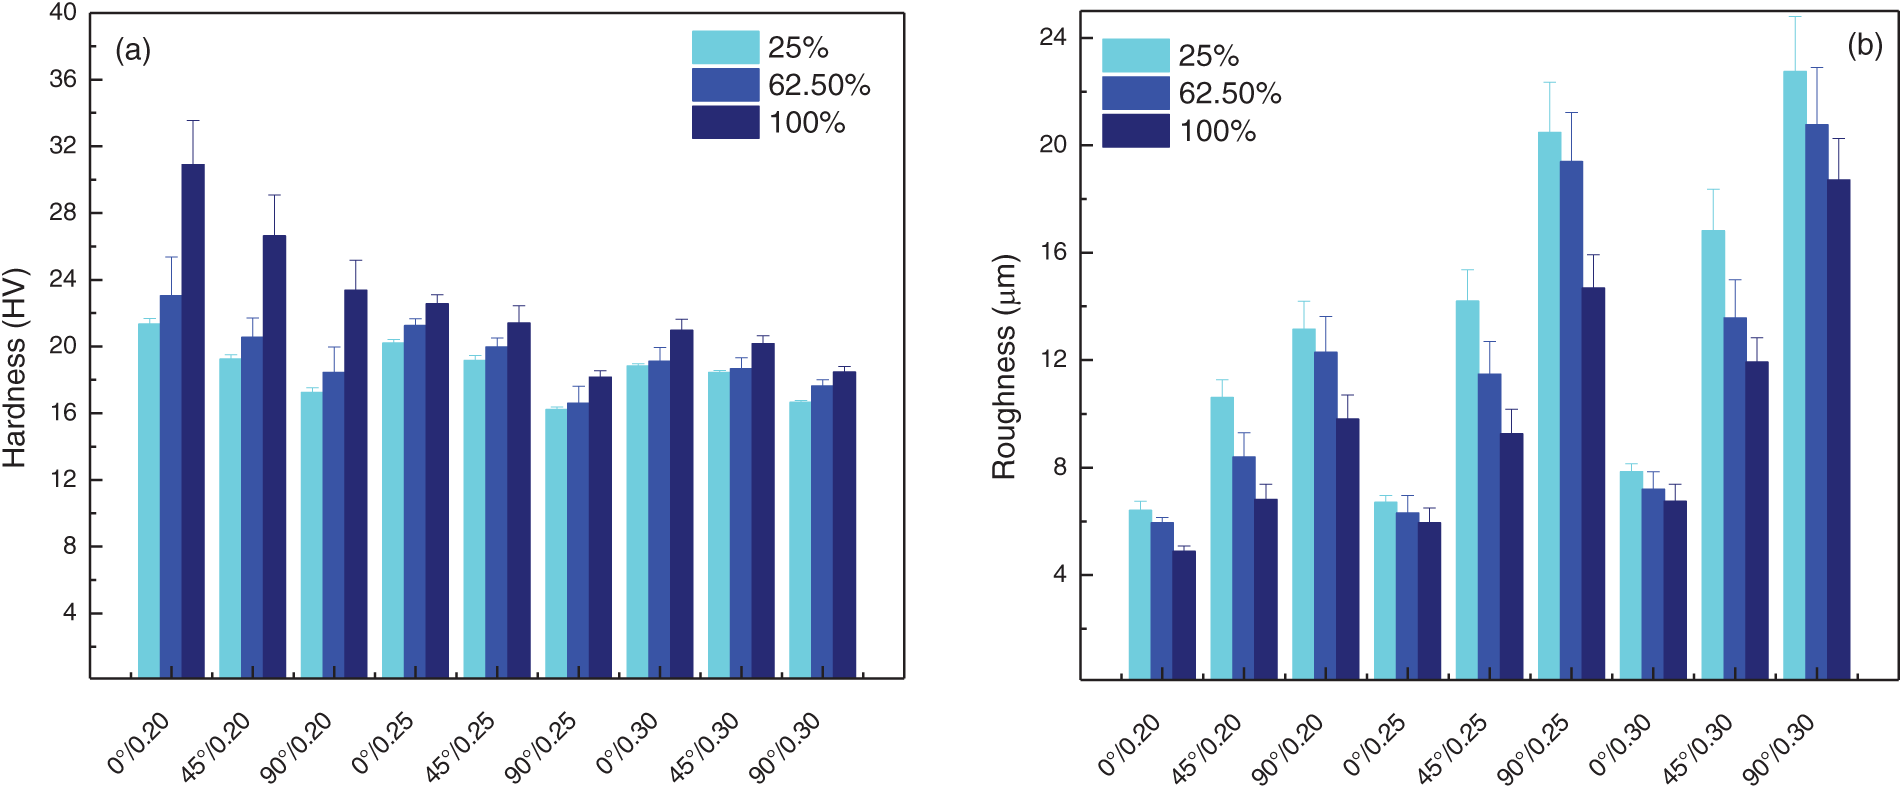
Figure 9: Effect of the printing parameters: (a) effect on hardness; (b) effect on roughness
Fig. 9a shows the effect of the printing parameters (infill density, build orientation, and layer thickness) on the hardness of the specimens printed with PLA-G-F. By increasing the infill density from 25% to 100%, an increase of between 10% and 40% in the hardness of the specimens can be observed. According to Maguluri et al., this increase is due to the fact that a higher infill density provides a more solid and homogeneous internal structure, which contributes to improving the strength against penetration [51]. Analysis of the influence of printing layer thickness reveals a reduction of up to 40% in the hardness of the specimens when the layer thickness is increased from 0.20 to 0.30 mm. The increase in layer thickness affects the cohesion between successive layers due to the greater volume of material deposited with each layer [52]. Furthermore, specimens printed at 0° exhibited the highest hardness values, ranging from 18.83 to 30.89 HV, while those printed at a 90° displayed the lowest hardness values, between 16.21 and 22.56 HV.
On observing Fig. 9b, it can be verified that increasing the infill density from 25% to 100% reduces the roughness by up to 30%. On the other hand, on modifying the build orientation from 0° to 90° an increase in roughness of 30% to 50% can be seen. Finally, increasing the layer thickness to 0.3 mm leads to a significant rise in the roughness of the specimens, exceeding 50%. Specimens printed at 0° with 100% infill density and a layer thickness of 0.2 mm exhibited the lowest roughness values (4.88 +/− 0.21 µm), while those printed with 25% infill density at 90° and a layer thickness of 0.3 mm exhibited the highest values (22.75 +/− 2.05 µm).
The effect of the printing parameters on the density and the absorption capacity is illustrated in Fig. 10a,b. Fig. 10a shows a significant increase in density as the infill density rises from 25% to 100%. Specimens with 25% infill density exhibited values between 420 and 730 kg/m³, while those with 100% infill density reached values between 970 and 1225 kg/m³. Additionally, a 20% to 40% reduction in density occurs when the printing direction changes from 0° to 90°. There is also a slight decrease (less than 10%) in density when increasing the layer thickness from 0.20 to 0.30 mm.
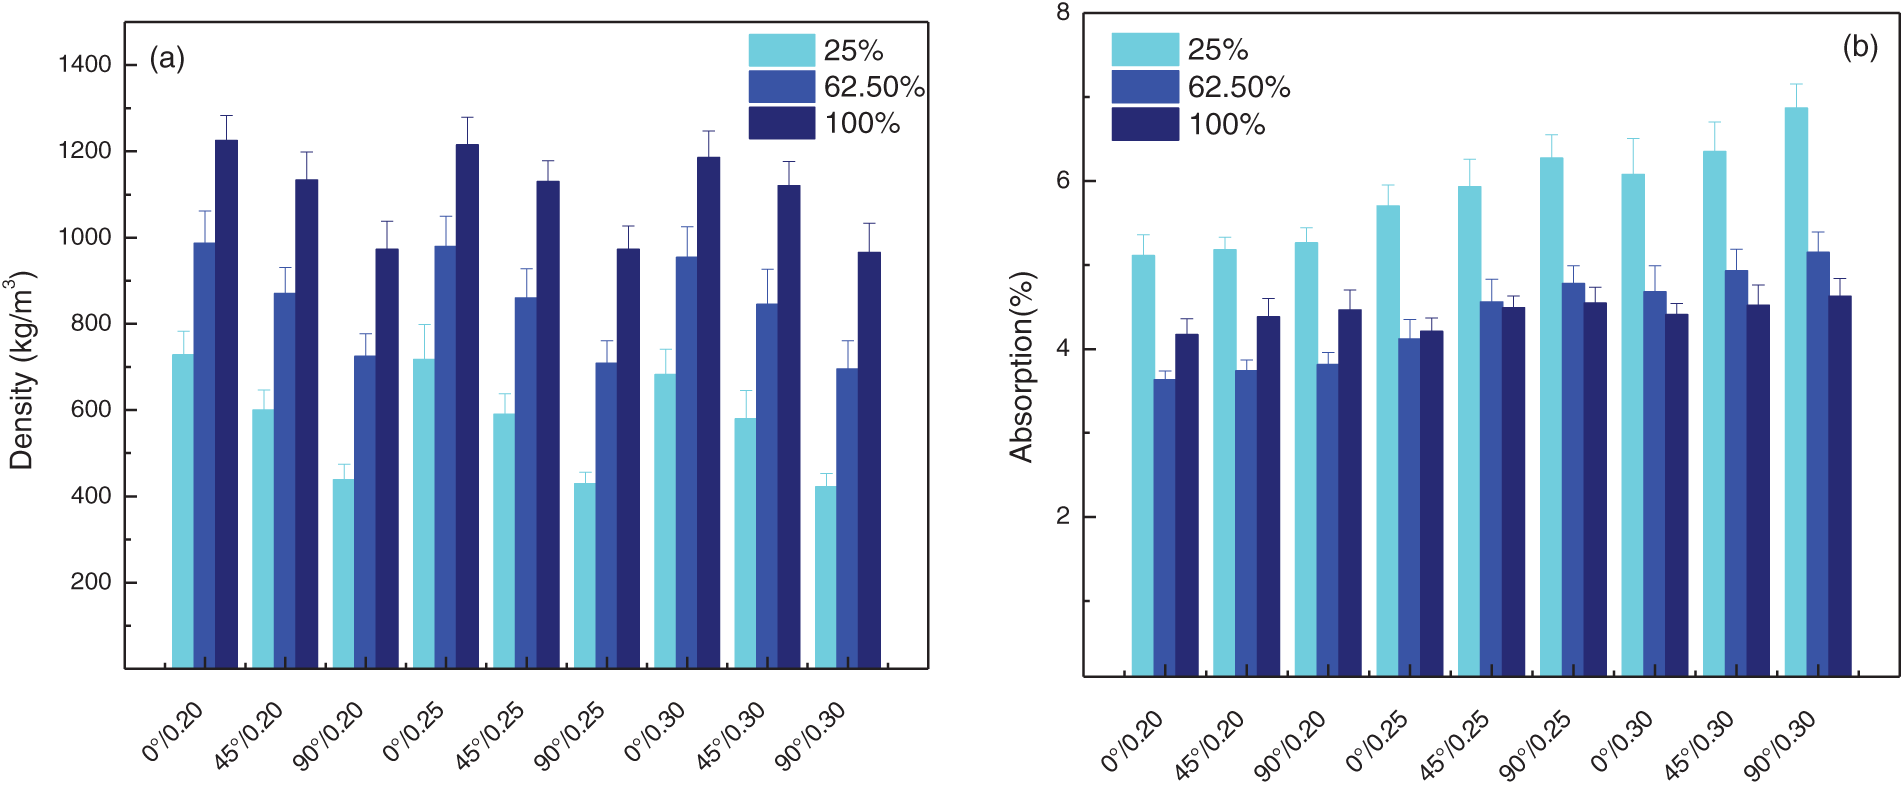
Figure 10: Effect of the printing parameters: (a) effect on density; (b) effect on absorption
On analyzing Fig. 10b, a reduction of up to 38% in the absorption rate is evident in specimens printed with 100% infill density. Specifically, specimens with 100% infill density, a layer thickness of 0.2 mm, and a 0° orientation exhibited the lowest absorption values (4.17%), whereas those printed with 25% infill density, a layer thickness of 0.30 mm, and a 90° orientation exhibited the highest absorption values (6.87%). These results indicate that on increasing the layer thickness and the build orientation, a greater number of micropores appear on the surface of the specimens, resulting in higher water absorption.
According to Dawoud et al., abrasive wear appears to be the main wear mechanism of polymers that slide against hard surfaces [53]. In the present study, a preliminary investigation of the effect of printing parameters (infill density, layer thickness, and built orientation) on the friction coefficient and the abrasive wear rate of biocomposites printed using FDM was carried out. Fig. 11a,b shows the coefficient of friction (COF) as a function of the sliding distance for specimens printed at 0°. In Fig. 11a, a reduction of up to 10% in the COF value on increasing the infill density from 20% to 100% can be seen. From the results, it is evident that for the same layer thickness (0.20 mm), specimens printed with the highest infill density (100%) exhibited the lowest COF values (0.63), while those printed with the lowest infill density (20%) exhibited higher COF values (0.72). Similar results were reported by Akıncıoğlu et al. when they analyzed the tribological characteristics of ABS structures with different infill densities [54]. As can be seen, the use of a higher infill density results in a smoother and less porous surface, which contributes to reducing the coefficient of friction. On the other hand, a slight increase (less than 5%) in COF values can be observed when the layer thickness is increased from 0.20 to 0.30 mm. Although increasing the thickness of the printing layer did not significantly affect the COF values, it should be taken into consideration that when thicker layers of material are deposited, they can increase the surface roughness, contributing to an increase in the COF.
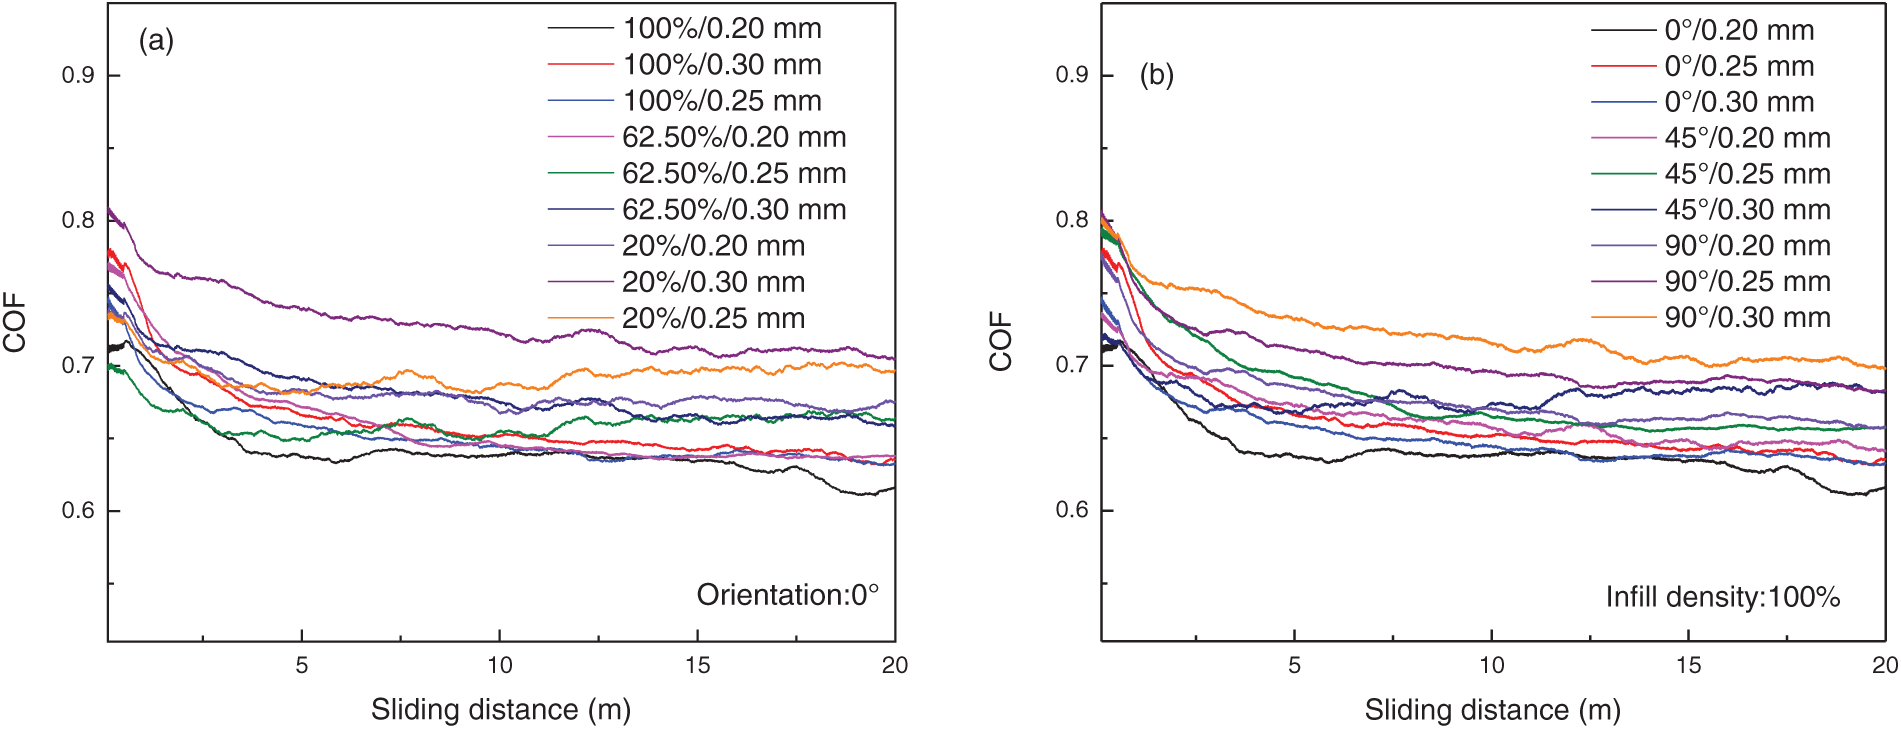
Figure 11: Effect of the printing parameters on the COF values: (a) effect of the infill density and layer thickness; (b) effect of the build orientation
The effect of the print orientation on the COF values of specimens printed with a specific infill density is shown in Fig. 11b. The results reveal an increase of up to 12% in COF values when the print direction is changed from 0° to 90°. As can be seen, specimens printed along the horizontal axis (0°) had COF values between 0.63 and 0.65, while those printed in the vertical direction exhibited higher values, ranging from 0.67 to 0.73.
The wear rate was calculated using Archard’s law, where the volume of material removed in the crater can be computed using the applied load, the tribometer’s sphere radius, and the length of interaction between the ball and the surface. The results are presented in Fig. 12. The specimens printed at 0° with 100% infill density and a layer thickness of 0.20 mm exhibited the lowest wear rate (4.26 × 10⁻³ mm3/N·m), while those printed at 90° with 20% infill density and a layer thickness of 0.30 mm had the highest wear rate (5.91 × 10⁻³ mm3/N·m). Increasing the infill density resulted in a reduction of up to 17% in the wear rate of all the analyzed samples. Additionally, with an increase in the print orientation and the layer thickness, the wear rate varied by a factor of between 5% and 10%.
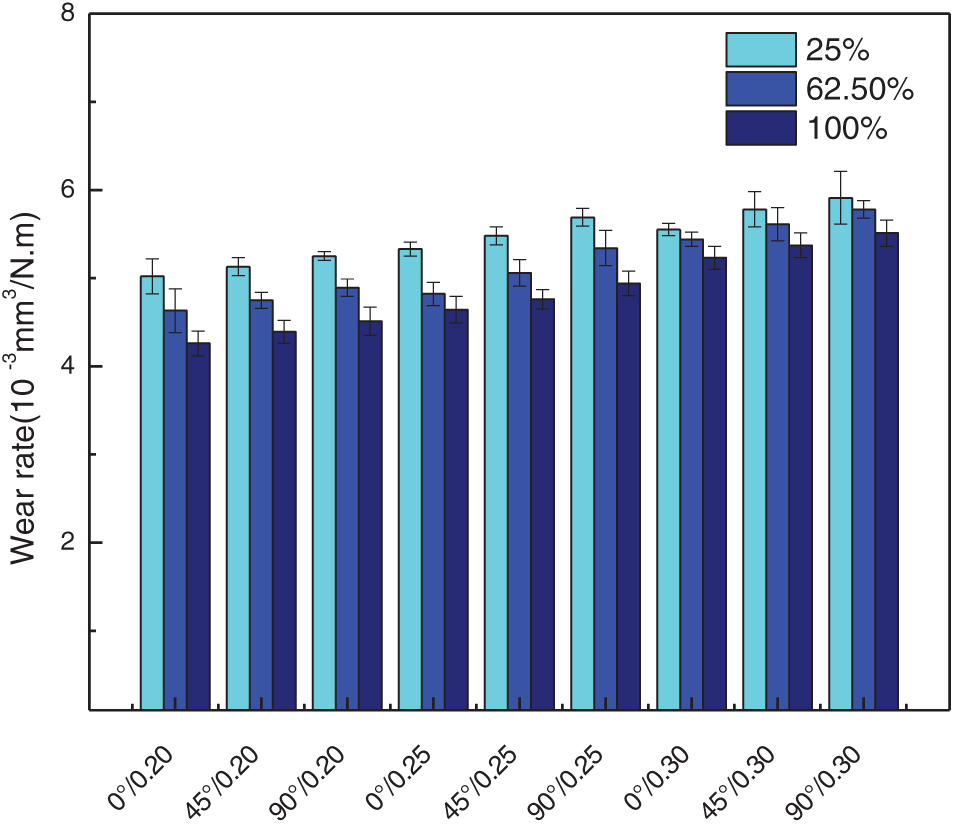
Figure 12: Effect of the printing parameters on the wear rate values
3.8 Mechanical Characterization of 3D Printed Specimens
The influence of the printing parameters (infill density, printing orientation, and layer thickness) on the strength and stiffness of specimens subjected to axial loads (tensile and compression) was analyzed. The results are presented in this section.
3.8.1 Effect of Infill Density and Layer Thickness on Tensile Strength
Fig. 13 shows the effect of the infill density on the tensile strength of specimens printed with PLA-G-F at 0° using layer thicknesses between 0.20 and 0.30 mm. For the analysis, three infill density values were considered: 25%, 62.5%, and 100%. From the results, it can be seen that regardless of the layer thickness, an increase in the infill density causes a significant increase in the tensile strength of all the specimens. The printed specimens with a layer thickness of 0.20 mm exhibited tensile values of 41.76, 34.71, and 32.61 MPa for infill densities of 100%, 62.50%, and 25%, respectively. These results allow us to verify the 26% increase in the strength of the material when the infill density was increased by between 25% and 100%. Additionally, the specimens with a layer thickness of 0.25 and 0.30 mm showed an increase in tensile strength of between 17% and 25%, respectively. Although increasing infill density can increase printing time, a higher density means that more material is used in the printing of the specimens, making them more solid and dense and reducing void spaces in the structure, which improves their mechanical behavior [55].
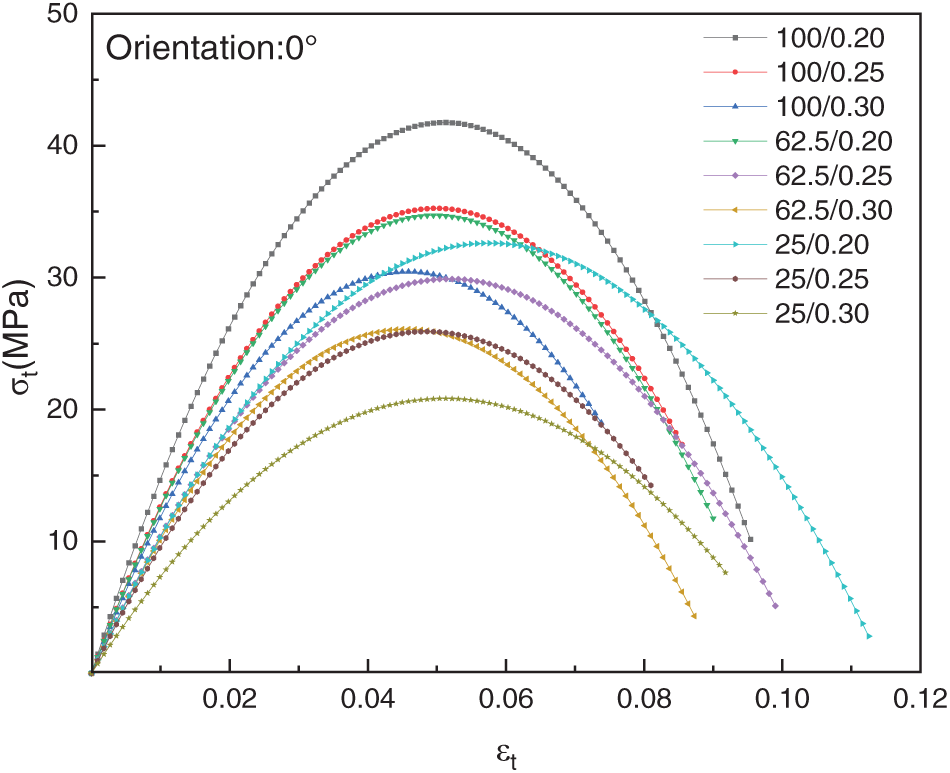
Figure 13: Effect of infill density and layer thickness on tensile strength
In Fig. 13, it can be seen that with an increase in the layer thickness, the tensile strength of the specimens is reduced by between 25% and 35%. Although it is true that increasing the thickness of the printing layer reduces the printing time and the material consumption, increasing this value can affect the adhesion between successive layers. On the other hand, larger spaces between layers can create weak points in the structure, making it more susceptible to delamination and affecting its mechanical behavior [56,57].
3.8.2 Effect of Build Orientation and Layer Thickness on Tensile Strength
Fig. 14 illustrates the effect of the build orientation on specimens printed with 100% infill density and layer thicknesses of 0.20, 0.25, and 0.30 mm. Specimens printed at 0° exhibited strength values of 41.76, 35.24 and 25.44 MPa for thicknesses of 0.20, 0.2, and 0.30 mm, respectively. Those printed at 45° displayed strengths of 35.24, 23.54, and 20.07 MPa for the same thicknesses, whereas specimens printed at 90° showed the lowest strength values: 30.44, 15.33, and 11.12 MPa for thicknesses of 0.20, 0.25, and 0.30 mm, respectively.
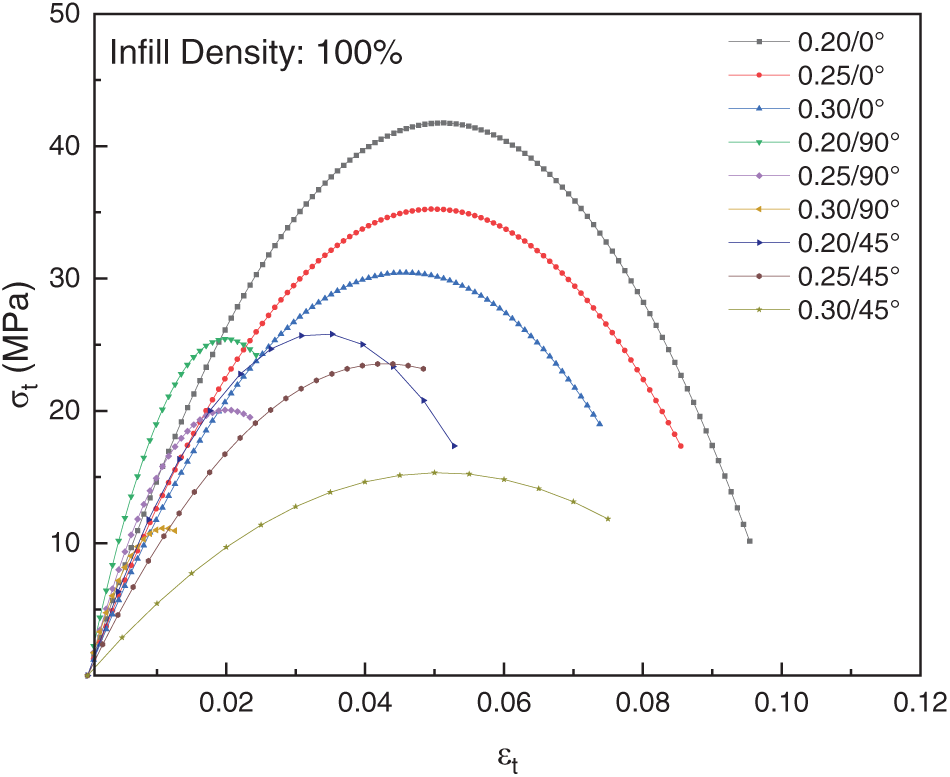
Figure 14: Relationship between build orientation and tensile strength
Analysis of the results reveals that changing the orientation from 0° to 90° leads to a significant reduction in tensile strength, ranging from 40% to 60%. According to Song et al. [57], the mechanical behavior of specimens printed with varying build orientations is linked to the manner of material failure. When the load is applied parallel to the printing direction (0°), the specimens exhibit greater tensile strength. This alignment facilitates better stress transfer and enhances the material’s ductility. Conversely, when layers are deposited perpendicular to the tensile load, they are more prone to separation under the applied stress, leading to delamination in specimens printed at 90°. For specimens printed at 45°, the deposition angle results in intermediate behavior, hindering optimal stress transfer along the printing lines. Fig. 15 illustrates the failure surfaces for specimens printed at 0°, 45°, and 90°.
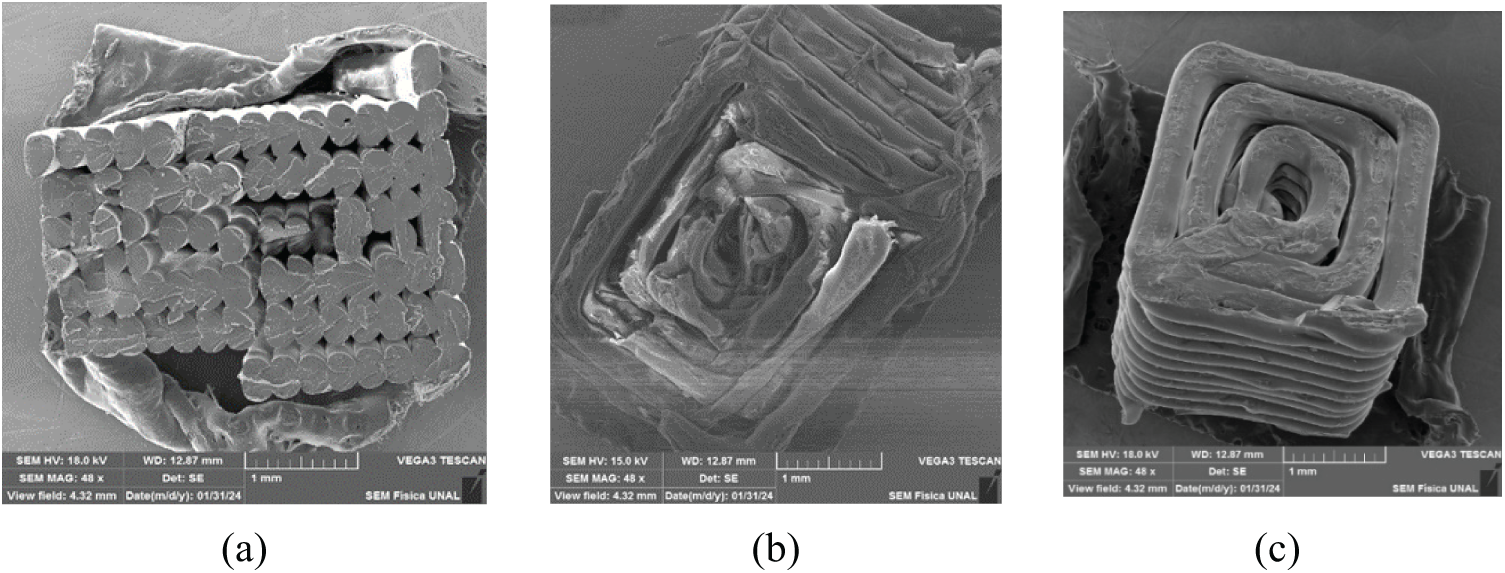
Figure 15: Tensile failure of specimens: (a) 0°; (b) 45°; (c) 90°
3.8.3 Effect on the Modulus of Elasticity and the Tensile Strength
The effect of the printing parameters on the modulus of elasticity is presented in Fig. 16. The results indicate that with an increase in the infill density, the stiffness of the specimens increases between 25% and 40%. On the other hand, by increasing the layer thickness from 0.20 to 0.30 mm, the elasticity modulus is reduced by up to 30%. According to Milovanovic et al., with the use of thinner layers, the adhesion between successive printing layers increases, contributing to greater stiffness [55]. Specimens printed with 100% infill density and a layer thickness of 0.2 mm exhibited the highest elastic modulus values when printed at 0°, reaching up to 1594 MPa, whereas specimens printed at 45° displayed lower elastic modulus values, with a maximum of 1238 MPa. Similar trends were observed by Arora et al. when varying the infill density (25% and 62.50%) and layer thickness (0.25 and 0.30 mm). The orientation of the printing lines parallel to the direction of the load application tends to be more effective, contributing to an increase in both the strength and the elastic modulus of the material [56].
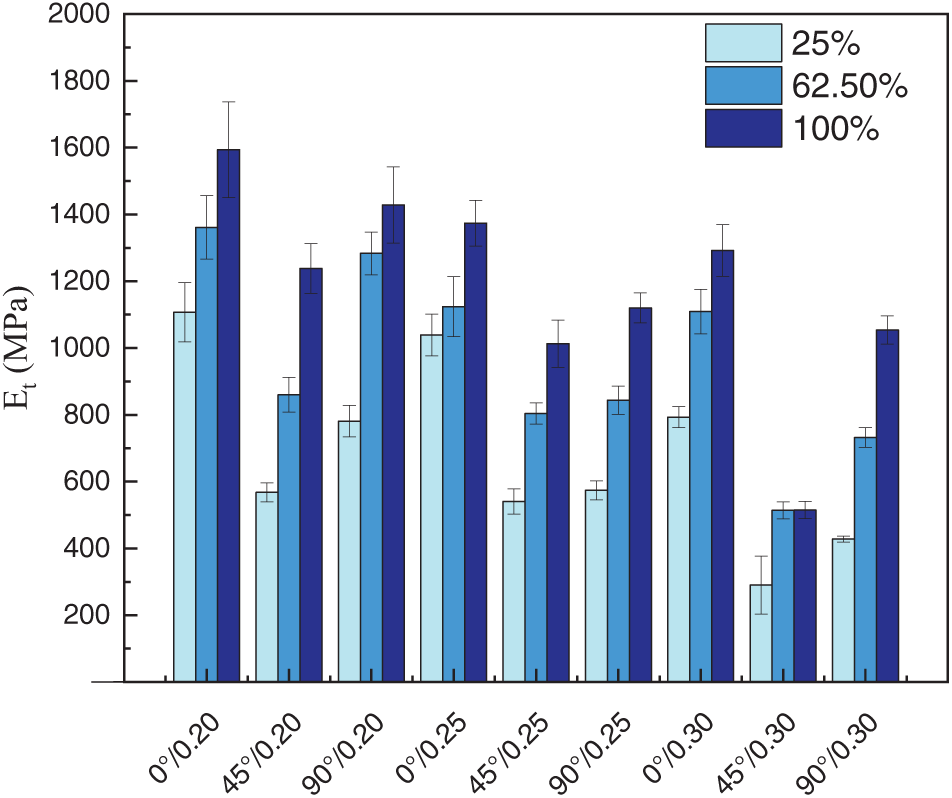
Figure 16: Variation of elastic modulus with printing parameters in PLA-G-F specimens
3.8.4 Effect on the Strength and Stiffness of Specimens Subjected to Axial Compression
The axial compression tests were conducted following ASTM D695-23 [37]. The maximum compressive strength (σc) and modulus of elasticity (Ec) were determined, with the results shown in Fig. 17a,b. Specimens printed with 100% infill density, a layer thickness of 0.20 mm, and horizontal orientation (0°) exhibited the highest strength values, at 65.44 MPa. On the other hand, those printed with 25% infill, a layer thickness of 0.30 mm, and a 90° orientation exhibited the lowest values, at 12.85 MPa. Additionally, specimens with 100% infill demonstrated greater stiffness, with elastic modulus values ranging from 1332 to 1791 MPa. Increasing the layer thickness resulted in a reduction of the elastic modulus of 10% to 20%. However, varying the print orientation from 0° to 90° produced a decrease of less than 15%.
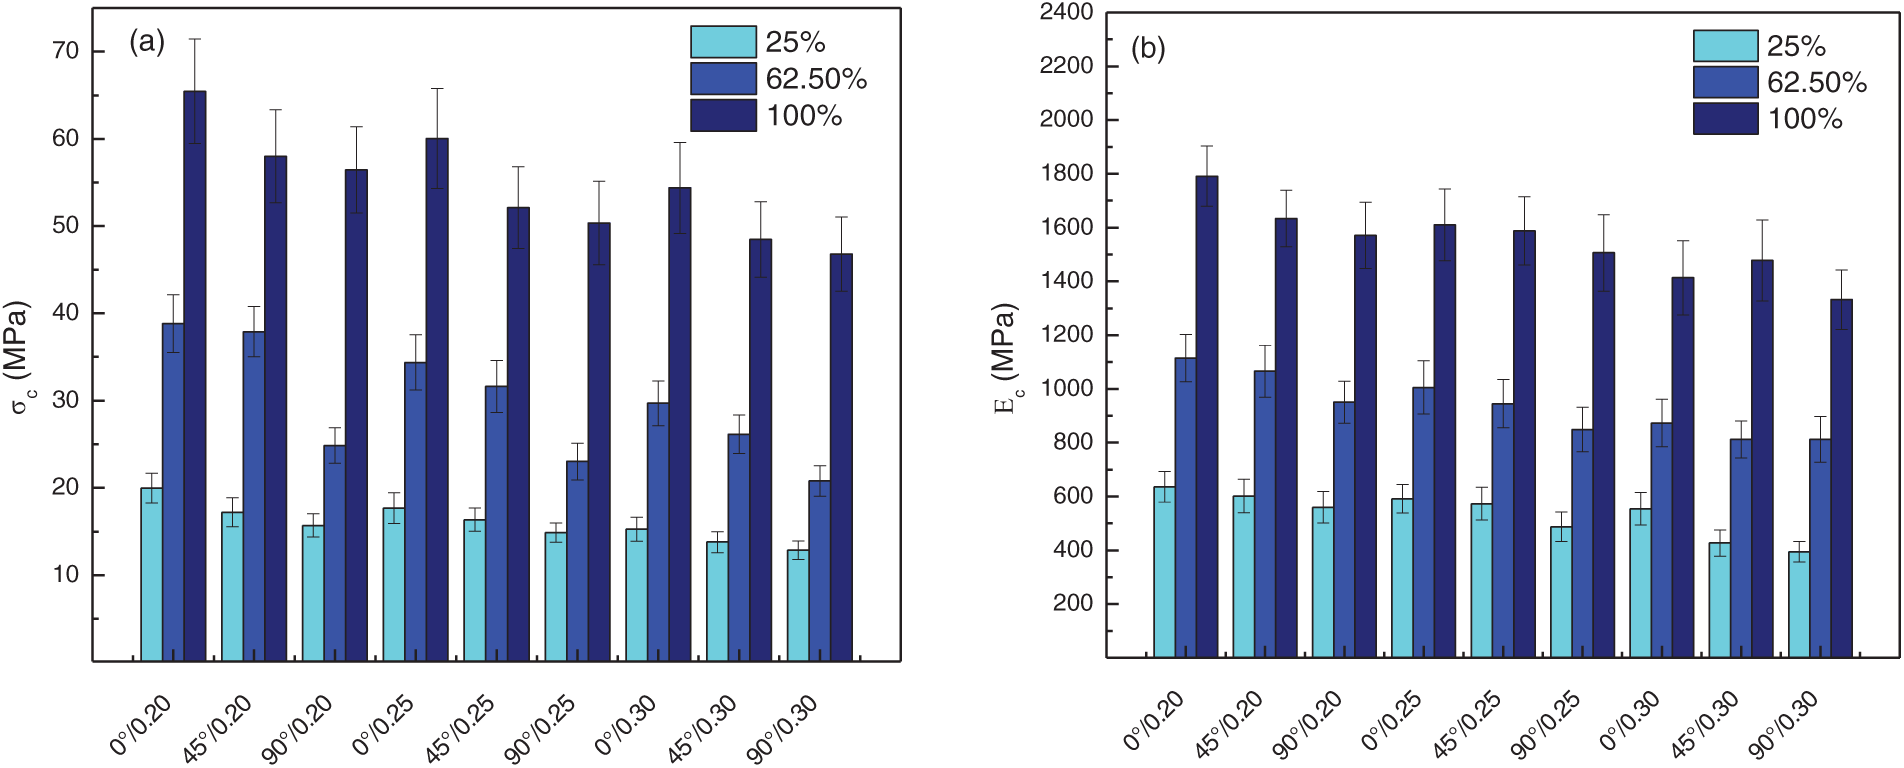
Figure 17: Axial compression test results: (a) Compressive strength; (b) Modulus of elasticity
3.8.5 Effect of the Addition of Reinforcing Fibers on the Physical and Mechanical Behavior of PLA Filaments
To analyze the effect of adding plant fibers as reinforcement of the PLA filaments, samples were printed with a 100% infill density, a printing layer thickness of 0.2 mm, and a printing orientation of 0°. The results are presented in Figs. 18 and 19. Based on these results, it can be seen that the addition of natural fibers did not significantly reduce the density of the specimens. The difference in density values was less than 5% (see Fig. 18). However, an increase in the absorption capacity of the samples made with PLA-G-F was observed. When analyzing the mechanical behavior of the specimens printed with PLA-G-F, an increase of around 10% in the tensile strength value was observed (see Fig. 19). The experimental results indicate that the addition of a low fiber content (10%) as filler in the PLA matrix contributed to increasing the strength and stiffness of the biocomposite subjected to axial loads (tension and compression). However, according to Mazzanti et al., it is important to take into consideration that the use of high concentrations of fibers as filler could increase the amount of microvoids in the printed elements, which would result in a loss of adhesion between the printed layers, negatively affecting the mechanical behavior of a material [58]. Upon analyzing the maximum strain percentage, a reduction of 20% to 30% was observed in specimens printed with PLA-G-F, showing a decrease in the ductility of the Guadua fiber-reinforced specimens.
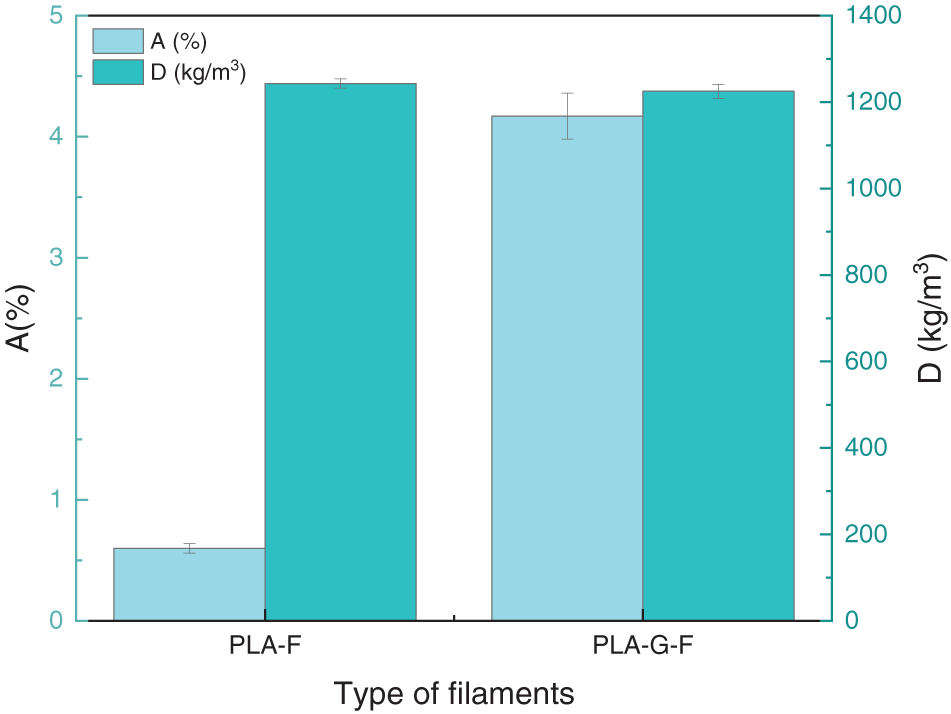
Figure 18: Effect of type of filament on physical properties
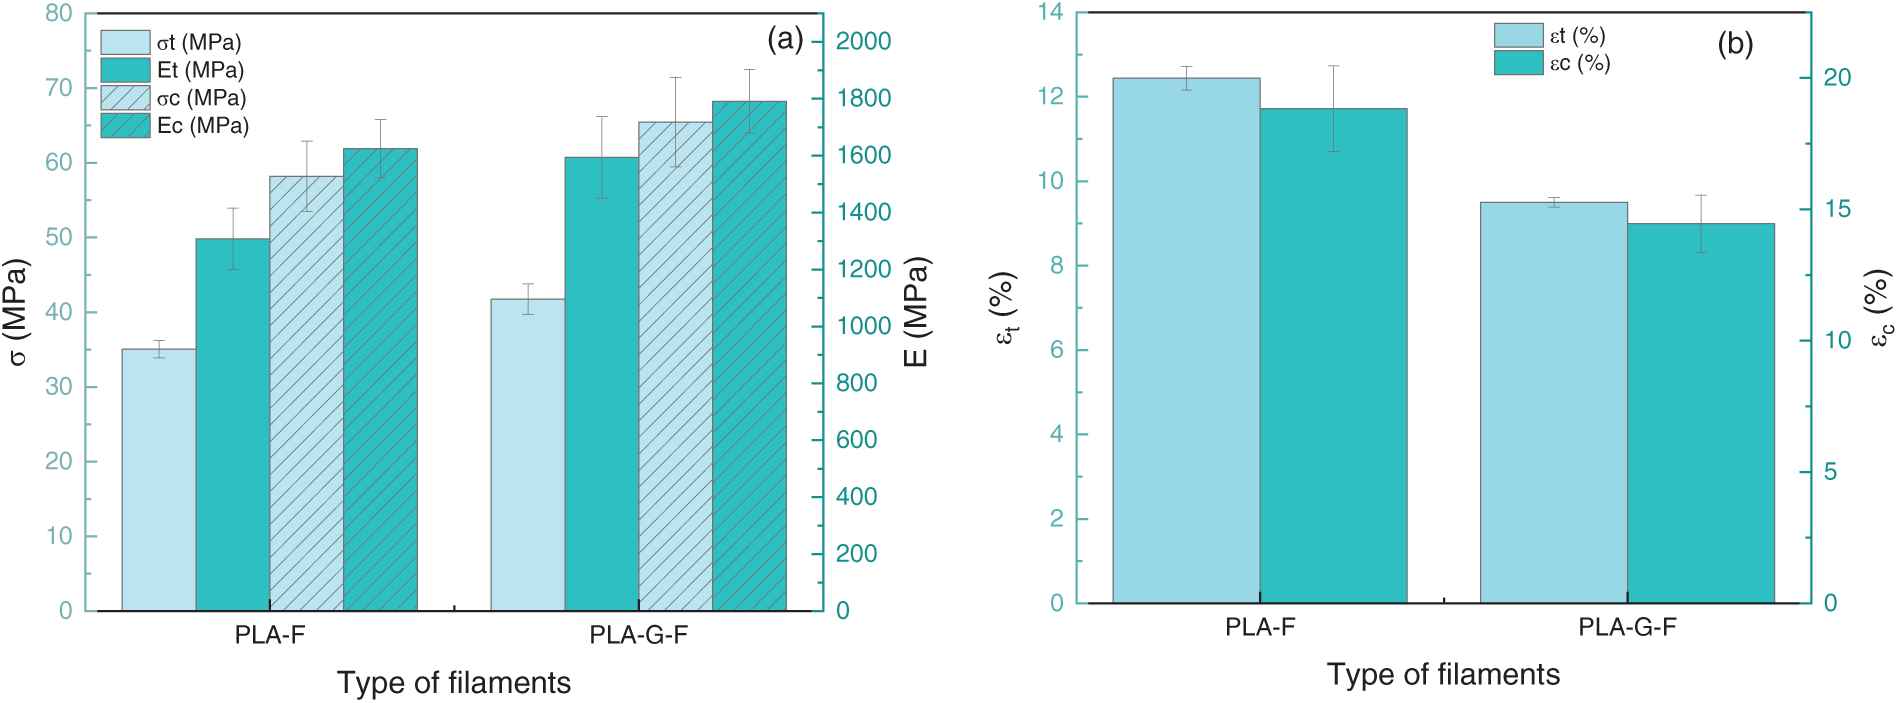
Figure 19: Effect of type of filament on the mechanical properties: (a) stress and stiffness; (b) maximum strain
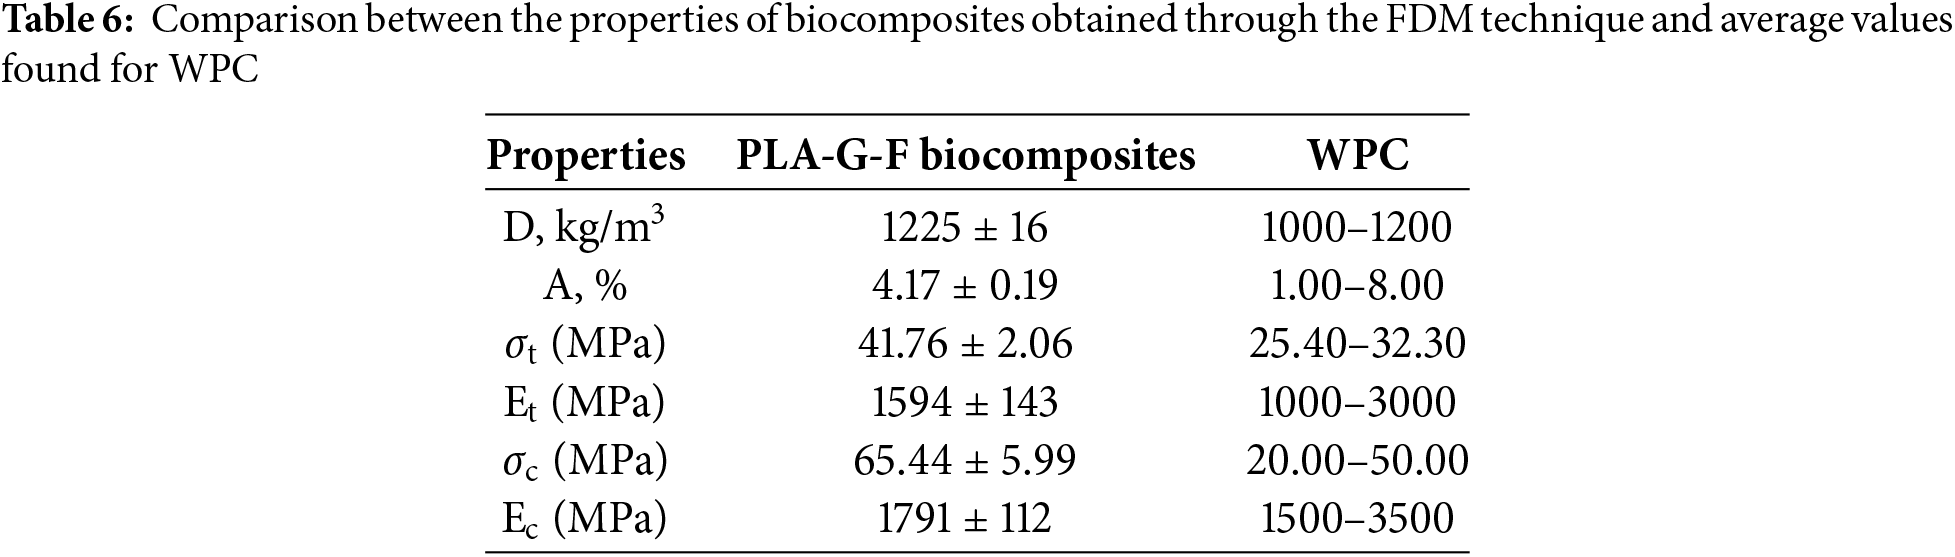
The properties of the biocomposites subjected to axial loads were compared with those reported in the technical literature for wood-plastic composites (WPC) [59–61], as shown in Table 6. The results indicate that despite the higher density of the evaluated specimens, their water absorption capacity remains within the typical range for WPC materials. Furthermore, the biocomposites produced using PLA-G-F filaments exhibited strength values approximately 25% higher than those commonly reported for WPC, reflecting superior mechanical performance. However, the elastic modulus of the PLA-G-F biocomposites fell within the standard range for WPC under axial loads (1000 to 3000 MPa for tensile and 1500 to 3500 MPa for compressive loads).
In this article, the morphological, chemical, mechanical, and tribological properties of biocomposites made with PLA filaments reinforced with vegetal fibers were evaluated. The influence of the infill density, printing layer thickness, and build orientation on their material behavior was determined and compared with the standard requirements for wood-plastic materials, evaluating their technical feasibility for non-structural applications in the construction sector.
The use of plant fibers as fillers for thermoplastic resins has garnered increasing interest in recent years due to their biodegradable nature and favorable physical and mechanical properties. In this study, filaments were extruded from a mixture of 90% PLA pellets and 10% pulverized Guadua fibers. Analysis of the morphological, physical, and chemical properties of the filaments revealed an increase in the carbon-to-oxygen (C/O) ratio and the crystallinity index of the reinforced filaments. ATR-FTIR results indicated an increase in the intensity of absorption peaks between 2995 and 2851 cm−¹. However, the presence of microvoids and the non-homogeneous distribution of the reinforcement led to increased surface roughness and a slight reduction in density (less than 5%).
Mechanical tests demonstrated that PLA-G-F exhibited higher hardness, strength, and elastic modulus values. Nonetheless, the reduction in strain percentage indicates a loss of ductility in the reinforced filaments.
The results of the tribology tests (COF at abrasive wear rate) showed that with increasing filler density, the internal structure of the material becomes more compact and its surface becomes smoother and less porous, which contributes to reducing the rate of abrasive wear. On the other hand, by increasing the layer thickness, the surface roughness of the material increases, which contributes to both the increase in the friction coefficient and the value of the wear rate. Furthermore, the effect of build orientation on the wear rate was determined. Specimens printed at 90° exhibited the highest values. These results correspond to a preliminary study of the effect of some of the parameters that affect the abrasive wear rate of biocomposites manufactured by 3D printing. However, an in-depth analysis of the behavior of the material requires an evaluation of the effect of other printing parameters (fill pattern, temperature, and printing speed) and the influence of factors associated with the test conditions (applied force, characteristics of the sphere used in the test, and speed of load application). These parameters should be studied in future investigations.
The effect of the printing parameters, specifically infill density, layer thickness, and print orientation, was evaluated. The results showed that aligning the printing layers with the load direction enhances stress transfer and increases material stiffness. On the other hand, increasing the layer thickness from 0.20 to 0.30 mm negatively affects the adhesion between successive printing layers, resulting in reduced strength and elastic modulus. Specimens printed with 100% infill density displayed superior mechanical performance. Moreover, the addition of 10% plant fiber filler in the PLA filaments improved the strength and stiffness of the biocomposite under axial loads.
The properties of the biocomposites printed with PLA-G-F suggest their potential as a viable substitute for WPC materials commonly used in non-structural applications such as decking, siding, and other similar uses. Their strength, stiffness, and absorption capacity align with the average values typically reported in commercial technical data sheets. However, to fully assess their feasibility, these material properties must be complemented by an economic viability study that evaluates the costs associated with large-scale production.
Acknowledgement: The authors gratefully acknowledge Vicerrectoría de Investigaciones at the Universidad Militar Nueva Granada (UMNG, Colombia) for financing the research.
Funding Statement: This paper is a derivative product of the project INV-ING-3788 financed by the Vicerectory of Research of the Universidad Militar Nueva Granada, validity 2023.
Author Contributions: The authors confirm contribution to the paper as follows: Conceptualization, Martha L. Sánchez and Luz Y. Morales; methodology, Martha L. Sanchez; software, Martha L. Sánchez; validation, Martha L. Sanchez, Luz Y. Morales and G. Capote; formal analysis, Martha L. Sanchez and G. Capote; investigation, Martha L. Sánchez, Luz Y. Morales and G. Capote; resources, Martha L. Sanchez and Luz Y. Morales; data curation, Martha L. Sanchez and G. Capote; writing—original draft preparation, Martha L. Sanchez and G. Capote; writing—review and editing, Martha L. Sanchez and G. Capote; visualization, Martha L. Sanchez and G. Capote; supervision, Martha L. Sanchez; project administration, Martha L. Sanchez; funding acquisition, Martha L. Sanchez and Luz Y. Morales. All authors reviewed the results and approved the final version of the manuscript.
Availability of Data and Materials: The data that support the findings of this study are available from the corresponding author, Martha L. Sanchez, upon reasonable request.
Ethics Approval: Not applicable.
Conflicts of Interest: The authors declare no conflicts of interest to report regarding the present study.
Abbreviations
| A | Absorption capacity |
| C.I | Crystallinity index |
| COF | Coefficient of friction |
| D | Density |
| Et | Modulus of elasticity in tension |
| Ec | Modulus of elasticity in compression |
| HV | Vickers microhardness |
| mS,A | Apparent mass in air |
| mS,IL | Apparent mass in the immersion liquid |
| PLA | Polylactic acid |
| PLA-F | Pure PLA filaments |
| PLA-G-F | Filaments obtained from the combination of PLA and pulverized Guadua fibers |
| SEM | Scanning electron microscopy |
| Tb | Burning temperature |
| Tc | Cold cristalization tempeature |
| Tg | Glass transition temperature |
| Ti | Ignition temperature |
| Tmax | Temperature at which the maximum rate of weight loss occurred |
| Tm | Melting temperature |
| Toi | Combustion starting temperature |
| Tof | Final combustion temperature |
| WPC | Wood-plastic composite |
| XRD | X-ray diffraction |
| ρs | Density of the filaments |
| ρIL | Density of the immersion liquid at 23°C |
| Δm | Total mass loss percentage |
| εt | Unitary strain in tension |
| εc | Unitary strain in compression |
| σt | Tensile strength |
| σt | Compressive strength |
References
1. Zarna C, Chinga-Carrasco G, Echtermeyer AT. Biocomposite panels with unidirectional core stiffeners—3-point bending properties and considerations on 3D printing and extrusion as a manufacturing method. Compos Struct. 2023;313(9):116930. doi:10.1016/j.compstruct.2023.116930. [Google Scholar] [CrossRef]
2. Kariz M, Sernek M, Kuzman M. Effect of humidity on 3D-printed specimens from wood-PLA filaments. Wood Research. 2018;63:917–22. [Google Scholar]
3. Zhiani Hervan S, Altınkaynak A. Hardness, friction, and wear characteristics of 3D-printed PLA polymer. Proc Inst Mech Eng Part J: J Eng Tribol. 2021;235(8):1590–8. doi:10.1177/1350650120966407. [Google Scholar] [CrossRef]
4. Roy R, Mukhopadhyay A. Tribological studies of 3D printed ABS and PLA plastic parts. Mater Today: Proc. 2021;41(3):856–62. doi:10.1016/j.matpr.2020.09.235. [Google Scholar] [CrossRef]
5. Le Duigou A, Barbé A, Guillou E, Castro M. 3D printing of continuous flax fibre reinforced biocomposites for structural applications. Mater Des. 2019;180(12):107884. doi:10.1016/j.matdes.2019.107884. [Google Scholar] [CrossRef]
6. Baigarina A, Shehab E, Ali MH. Construction 3D printing: a critical review and future research directions. Progress Addit Manuf. 2023;8(6):1–29. doi:10.1007/s40964-023-00409-8. [Google Scholar] [CrossRef]
7. Patel R, Desai C, Kushwah S, Mangrola MH. A review article on FDM process parameters in 3D printing for composite materials. Mater Today Proc. 2022;60(3):2162–6. doi:10.1016/j.matpr.2022.02.385. [Google Scholar] [CrossRef]
8. Kumar S, Singh H, Singh I, Bharti S, Kumar D, Siebert G, et al. A comprehensive review of FDM printing in sensor applications: advancements and future perspectives. J Manuf Process. 2024;113(2):152–70. doi:10.1016/j.jmapro.2024.01.030. [Google Scholar] [CrossRef]
9. Thakar CM, Parkhe SS, Jain A, Phasinam K, Murugesan G, Ventayen RJM. 3D Printing: basic principles and applications. Mater Today: Proc. 2022;51(5–8):842–9. doi:10.1016/j.matpr.2021.06.272. [Google Scholar] [CrossRef]
10. DePalma K, Walluk MR, Murtaugh A, Hilton J, McConky S, Hilton B. Assessment of 3D printing using fused deposition modeling and selective laser sintering for a circular economy. J Clean Prod. 2020;264(5):121567. doi:10.1016/j.jclepro.2020.121567. [Google Scholar] [CrossRef]
11. Garzon-Hernandez S, Garcia-Gonzalez D, Jérusalem A, Aria A. Design of FDM 3D printed polymers: an experimental-modelling methodology for the prediction of mechanical properties. Mater Des. 2020;188(2):108414. doi:10.1016/j.matdes.2019.108414. [Google Scholar] [CrossRef]
12. Vălean C, Stoia DI, Oprişa C, Linul E. Effect of fillers on mechanical properties of FDM printed PLA components. Procedia Struct Integr. 2024;56(11):97–104. doi:10.1016/j.prostr.2024.02.043. [Google Scholar] [CrossRef]
13. Shi LK, Li PC, Liu CR, Zhu JX, Zhang TH, Xiong G. An improved tensile strength and failure mode prediction model of FDM 3D printing PLA material: theoretical and experimental investigations. J Build Eng. 2024;90(6):109389. doi:10.1016/j.jobe.2024.109389. [Google Scholar] [CrossRef]
14. Le Duigou A, Chabaud G, Matsuzaki R, Castro M. Tailoring the mechanical properties of 3D-printed continuous flax/PLA biocomposites by controlling the slicing parameters. Compos Part B Eng. 2020;203(1):108474. doi:10.1016/j.compositesb.2020.108474. [Google Scholar] [CrossRef]
15. Stoof D, Pickering KL, Zhang Y. Fused deposition modelling of natural fibre/polylactic acid composites. J Compos Sci. 2017;1(1):1–8. doi:10.3390/jcs1010008. [Google Scholar] [CrossRef]
16. Aruan Efendy MG, Pickering KL. Comparison of strength and young modulus of aligned discontinuous fibre PLA composites obtained experimentally and from theoretical prediction models. Compos Struct. 2019;208(4):566–73. doi:10.1016/j.compstruct.2018.10.057. [Google Scholar] [CrossRef]
17. Kamau-Devers K, Kortum Z, Miller SA. Hydrothermal aging of bio-based poly(lactic acid) (PLA) wood polymer composites: studies on sorption behavior, morphology, and heat conductance. Constr Build Mater. 2019;214(1):290–302. doi:10.1016/j.conbuildmat.2019.04.098. [Google Scholar] [CrossRef]
18. Singh G, Singh S, Prakash C, Kumar R, Kumar R, Ramakrishna S. Characterization of three-dimensional printed thermal-stimulus polylactic acid-hydroxyapatite-based shape memory scaffolds. Polym Compos. 2020;41(9):3871–89. doi:10.1002/pc.25683. [Google Scholar] [CrossRef]
19. Parandoush P, Lin D. Review on additive manufacturing of polymer-fiber composites. Compos Struct. 2017;182:36–53. doi:10.1016/j.compstruct.2017.08.088. [Google Scholar] [CrossRef]
20. Wang X, Jiang M, Zhou Z, Gou J, Hui D. 3D printing of polymer matrix composites: a review and prospective. Compos Part B. 2017;110(2):442–58. doi:10.1016/j.compositesb.2016.11.034. [Google Scholar] [CrossRef]
21. Mishra PK, Senthil P, Adarsh S, Anoop MS. An investigation to study the combined effect of different infill pattern and infill density on the impact strength of 3D printed polylactic acid parts. Compos Commun. 2021;24:100605. doi:10.1016/j.coco.2020.100605. [Google Scholar] [CrossRef]
22. Parab S, Zaveri N. Investigating the influence of infill pattern on the compressive strength of fused deposition modelled PLA parts. In: Vasudevan H, Kottur V, Raina A, editors. Proceedings of International Conference on Intelligent Manufacturing and Automation. Singapore: Springer; 2020. p. 239–47. doi:10.1007/978-981-15-4485-9_25. [Google Scholar] [CrossRef]
23. Rodríguez-Panes A, Claver J, Camacho AM. The influence of manufacturing parameters on the mechanical behaviour of PLA and ABS pieces manufactured by FDM: a comparative analysis. Materials. 2018;11(8):1333. doi:10.3390/ma11081333. [Google Scholar] [PubMed] [CrossRef]
24. Birosz TM, Ledenyák L, Andó M. Effect of FDM infill patterns on mechanical properties. Polym Test. 2022;113:107654. doi:10.1016/j.polymertesting.2022.107654. [Google Scholar] [CrossRef]
25. Milovanović A, Sedmak A, Grbović A, Golubović Z, Mladenović G, Čolić K, et al. Comparative analysis of printing parameters effect on mechanical properties of natural PLA and advanced PLA-X material. Procedia Struct Integr. 2020 2020;28(5):1963–8. doi:10.1016/j.prostr.2020.11.019. [Google Scholar] [CrossRef]
26. Nugroho N, Ardiansyah R, Rusita L, Larasati IL. Effect of layer thickness on flexural properties of PLA (PolyLactid Acid) by 3D printing. J Phys Conf Ser. 2018;1130:1–10. doi:10.1088/1742-6596/1130/1/012017. [Google Scholar] [CrossRef]
27. Giri J, Chiwande A, Gupta Y, Mahatme C, Giri P. Effect of process parameters on mechanical properties of 3D printed samples using FDM process. Mater Today Proc. 2021;47(17):5856–61. doi:10.1016/j.matpr.2021.04.283. [Google Scholar] [CrossRef]
28. Wu W, Geng P, Li G, Zhao D, Zhang H, Zhao J. Influence of layer thickness and raster angle on the mechanical properties of 3D-printed PEEK and a comparative mechanical study between PEEK and ABS. Materials. 2015;8(9):5834–46. doi:10.3390/ma8095271. [Google Scholar] [PubMed] [CrossRef]
29. Cho EE, Hein HH, Lynn Z, Hla SJ, Tran T. Investigation on influence of infill pattern and layer thickness on mechanical strength of PLA material in 3D. J Eng Res. 2019;3(2):27–37. doi:10.26666/rmp.jesr.2019.2.5. [Google Scholar] [CrossRef]
30. ISO 11358-1: 2022. Plastics—Thermogravimetry (TG) of polymers. Geneva, Switzerland: International Organization for Standardization; 2022. [Google Scholar]
31. ISO 6507-1: 2018. Metallic materials—Vickers hardness test—Part 1: Test method. Geneva, Switzerland: International Organization for Standardization; 2018. [Google Scholar]
32. ISO 1183-1: 2019. Plastics—Methods for determining the density of non-cellular plastics—Part 1: Immersion method, liquid pycnometer method and titration method. Geneva, Switzerland: International Organization for Standardization; 2019. [Google Scholar]
33. ASTM D638-22. Standard test method for tensile properties of plastics. West Conshohocken, PA: ASTM International; 2022 [cited 2025 Mar 10]. Available from: http://www.astm.orgASTM. [Google Scholar]
34. ASTM D570-22. Standard test method for water absorption of plastics. West Conshohocken, PA: ASTM International; 2022. [Google Scholar]
35. ASTM D792-20. Density and specific gravity (Relative Density) of plastics by displacement. West Conshohocken, PA: ASTM International; 2020. [Google Scholar]
36. Gee MG, Gant A, Hutchings I, Bethke R, Schiffman K, Van Acker K, et al. Progress towards standardization of ball cratering. Wear. 2003;255(1–6):1–13. doi:10.1016/S0043-1648(03)00091-7. [Google Scholar] [CrossRef]
37. ASTM D695-23. Standard test method for compressive properties of rigid plastics. West Conshohocken, PA: ASTM International; 2023. [Google Scholar]
38. Kariz M, Sernek M, Obúcina M, Kuzman MK. Effect of wood content in FDM filament on properties of 3D printed parts. Mater Today Commun. 2018;14(1):135–40. doi:10.1016/j.mtcomm.2017.12.016. [Google Scholar] [CrossRef]
39. Mondragón-Herrera LI, Vargas-Coronado RF, Carrillo-Escalante H, Cauich-Rodríguez JV, Hernández-Sánchez F, Velasco-Santos C, et al. Thermal, and physicochemical properties of filaments of poly (lactic acidpolyhydroxyalkanoates and their blend for additive manufacturing. Polymers. 2024;16(8):1062. doi:10.3390/polym16081062. [Google Scholar] [PubMed] [CrossRef]
40. Mngomezulu ME, Luyt AS, John MJ. Morphology, thermal and dynamic mechanical properties of poly (lactic acid)/expandable graphite (PLA/EG) flame retardant composites. J Thermoplast Compos Mater. 2017;32(1):89–107. doi:10.1177/0892705717744830. [Google Scholar] [CrossRef]
41. Liao Y, Liu C, Coppola B, Barra G, Di Maio L, Incarnato L, et al. Effect of porosity and crystallinity on 3D printed PLA properties. Polymers. 2019;11(9):1487. doi:10.3390/polym11091487. [Google Scholar] [PubMed] [CrossRef]
42. Ma B, Wang X, He Y, Dong Z, Zhang X, Chen X, et al. Effect of poly(lactic acid) crystallization on its mechanical and heat strength performances. Polymer. 2021;212(7):123280. doi:10.1016/j.polymer.2020.123280. [Google Scholar] [CrossRef]
43. Cai Y, Lv J, Feng J. Spectral characterization of four kinds of biodegradable plastics: poly (lactic acidpoly (butylenes adipateco- terepthlatepoly (hydroxybutyrate-cohydroxyvalerate) and poly (butylenes succinate) with FTIR and Raman spectroscopy. J Polym Environ. 2013;21(1):108–14. doi:10.1007/s10924-012-0534-2. [Google Scholar] [CrossRef]
44. Macedo M, Silva G, Feitor M, Costa T, Ito E, Melo J. Surface modification of kapok fibers by cold plasma surface treatment. J Mater Res Technol. 2020;9(2):2467–76. doi:10.1016/j.jmrt.2019.12.077. [Google Scholar] [CrossRef]
45. Kljun A, Benians TAS, Goubet F, Meulewaeter F, Knox JP, BlackburN RS. Comparative analysis of crystallinity changes in cellulose I polymers using ATR-FTIR, X-ray diffraction, and carbohydrate-binding module probes. Biomacromolecules. 2011;12(11):4121–6. doi:10.1021/bm201176m. [Google Scholar] [PubMed] [CrossRef]
46. Cuiffo MA, Snyder J, Elliott AM, Romero N, Kannan S, Halada GP. Impact of the fused deposition (FDM) printing process on polylactic acid (PLA) chemistry and structure. Appl Sci. 2017;7(6):579. doi:10.3390/app7060579. [Google Scholar] [CrossRef]
47. Khan A, Sapuan SM, Zainudin ES, Zuhri MYM. Physical, mechanical and thermal properties of novel bamboo/kenaf fiber-reinforced polylactic acid (PLA) hybrid composites. Compos Commun. 2024;51(1):102103. doi:10.1016/j.coco.2024.102103. [Google Scholar] [CrossRef]
48. Daver F, Lee KPM, Brandt M, Shanks R. Cork-PLA composite filaments for fused deposition modelling. Compos Sci Technol. 2018;168(10):230–7. doi:10.1016/j.compscitech.2018.10.008. [Google Scholar] [CrossRef]
49. Lau HY, Hussin MS, Hamat S, Abdul.Manan MS, Ibrahim M, Zakaria H. Effect of kenaf fiber loading on the tensile properties of 3D printing PLA filament. Mater Today Proc. 2023;58(2):209. doi:10.1016/j.matpr.2023.03.015. [Google Scholar] [CrossRef]
50. Sivagnanamani GS, Ramesh P, Kumar MH, Arul Mozhi Selvan V. Fracture analysis of fused deposition modelling of bio-composite filaments. Engineering Materials © Springer Nature Singapore Pte Ltd.; 2021. p. 71–84. doi:10.1007/978-981-16-0642-7_4978-981-16-0642-7. [Google Scholar] [CrossRef]
51. Maguluri N, Suresh G, Guntu SR. Effect of printing parameters on the hardness of 3D printed poly-lactic acid parts using DOE approach. IOP Conf Ser: Mater Sci Eng. 2022;1248(1):012004. doi:10.1088/1757-899X/1248/1/012004. [Google Scholar] [CrossRef]
52. Ayrilmis N. Effect of layer thickness on surface properties of 3D printed materials produced from wood flour/PLA filament. Polym Test. 2018;71(7/8):163–6. doi:10.1016/j.polymertesting.2018.09.009. [Google Scholar] [CrossRef]
53. Dawoud M, Taha I, Ebeid SJ. Effect of processing parameters and graphite content on the tribological behaviour of 3D printed acrylonitrile butadiene styrene. Materialwiss Werkstofftech. 2015;46(12):1185–95. doi:10.1002/mawe.201500450. [Google Scholar] [CrossRef]
54. Akıncıoğlu G, Şirin E, Aslan E. Tribological characteristics of ABS structures with different infill densities tested by pin-on-disc. Proc Institut Mech Eng Part J: J Eng Tribol. 2023;237(5):1224–34. doi:10.1177/13506501231153521. [Google Scholar] [CrossRef]
55. Milovanović A, Galaţanu S-V, Sedmak A, Marşavina L, Trajković I, Popa C-F, et al. Layer thickness influence on impact properties of FDM printed PLA material. Procedia Struct Integr. 2024;56(1):190–7. doi:10.1016/j.prostr.2024.02.055. [Google Scholar] [CrossRef]
56. Arora PK, Shrivastava Y, Kuma H. Optimising FDM printing parameters for improved tensile properties in 3D printed ASTM D638 standard samples. Aust J Mech Eng. 2023;23(2):1–14. doi:10.1080/14484846.2023.2283663. [Google Scholar] [CrossRef]
57. Song S, Zhang J, Liu M, Li F, Bai F. Effect of build orientation and layer thickness on manufacturing accuracy, printing time, and material consumption of 3D printed complete denture bases. J Dent. 2023;130(1):104435. doi:10.1016/j.jdent.2023.104435. [Google Scholar] [PubMed] [CrossRef]
58. Mazzanti V, Malagutti L, Mollica F. FDM 3D printing of polymers containing natural fillers: a review of their mechanical properties. Polymers. 2019;11(7):1094. doi:10.3390/polym11071094. [Google Scholar] [PubMed] [CrossRef]
59. UNE-EN 15534-6: 2016+A1. Composites made from cellulose-based materials and thermoplastics (usually called wood-polymer composites (WPC) or natural fibre composites (NFC))—Part 6: specifications for fencing profiles and elements. Asociación Española de Normalización (UNE) AENOR parte 6. 2016. p. 1–32. [Google Scholar]
60. Cai Z, Senalik CA, Ross RJ. Chapter 12: mechanical properties of wood-based composite materials. In: Wood handbook—Wood as an engineering material. General Technical Report FPL-GTR-282. Madison, WI: U.S. Department of Agriculture, Forest Service, Forest Products Laboratory; 2021. p. 1–15. [Google Scholar]
61. Azlinawati R. A comprehensive review on utilization of waste materials in wood plastic composite. Mat Today Sustain. 2024;27(19):100889. doi:10.1016/j.mtsust.2024.100889. [Google Scholar] [CrossRef]
Cite This Article
 Copyright © 2025 The Author(s). Published by Tech Science Press.
This work is licensed under a Creative Commons Attribution 4.0 International License , which permits unrestricted use, distribution, and reproduction in any medium, provided the original work is properly cited.
 Downloads
 Citation Tools