
 Open Access
ARTICLE

Reliability of Foot Intrinsic Muscle Strength Testing and Correlation with Corresponding Muscle Morphology in Elderly Adults
1 Key Laboratory of Exercise and Health Sciences, Shanghai University of Sport, Shanghai, 200438, China
2 The Third School of Clinical Medicine (School of Rehabilitation Medicine), Zhejiang Chinese Medical University, Hangzhou, 310053, China
* Corresponding Author: Lin Wang. Email:
# These authors contributed equally to this work
Molecular & Cellular Biomechanics 2023, 20(1), 23-33. https://doi.org/10.32604/mcb.2023.040788
Received 30 March 2023; Accepted 29 May 2023; Issue published 20 June 2023
 View Full Text
 Download PDF
Abstract
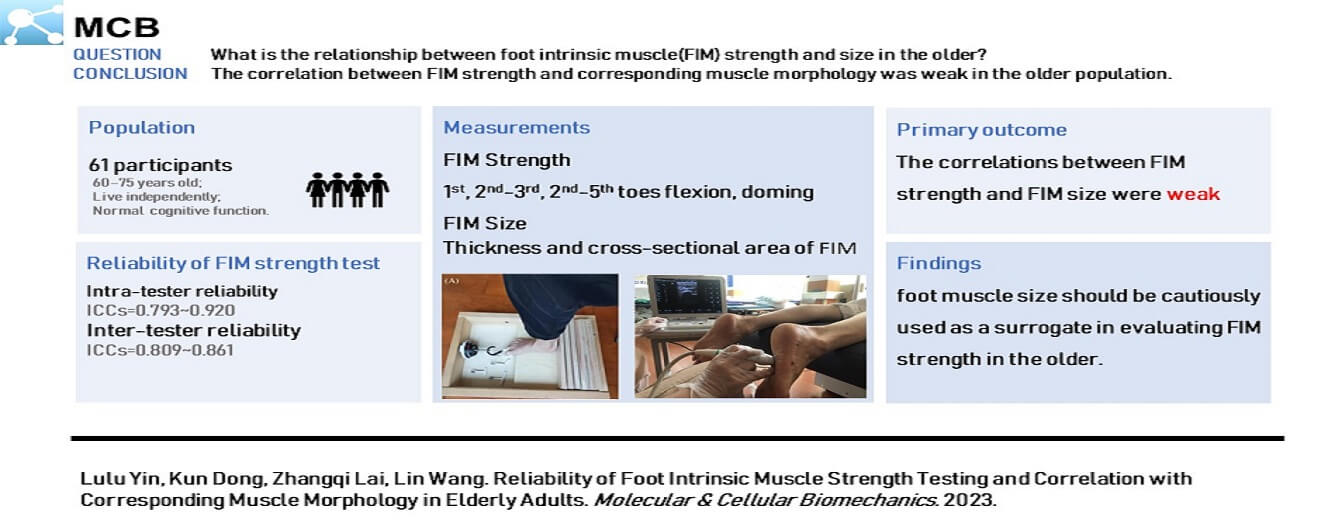
Age-related loss of foot intrinsic muscle (FIM) strength may be associated with disability, falls, and inability to perform daily activities. Previous studies have determined the reliability of FIM strength testing and evaluated the relationship between FIM strength and corresponding muscle morphology in young adults. However, few studies have measured FIM strength in the older. Therefore, this study aimed to assess the intra- and inter-reliability of FIM strength tests and the relationship between FIM strength and FIM size in the older. A total of 61 participants aged 60–75 years were recruited, and 18 of them were selected randomly for the verification of FIM strength test reliability. A portable dynamometer was used in evaluating FIM strength, particularly the 1st (FT1), 2nd–3rd (FT2-3), and 2nd–5th (FT2-5) toes flexion, and doming. A portable musculoskeletal ultrasound device was used in measuring the cross-sectional area (CSA) and thickness of FIMs, namely, flexor digitorum brevis (FDB), abductor hallucis (AbH), flexor hallucis brevis, quadratus plantae (QP), and abductor digiti minimi (AbDM). Intra- and interclass correlation coefficients (ICCs) were used in evaluating the reliability of the FIM strength tests, and Pearson’s correlation coefficients were used in determining the relationship between FIM strength and FIM size. All FIM strength tests showed good to excellent intratester reliability (ICCs: 0.793–0.920). Doming, FT2-3, and FT2-5 tests exhibited good intertester reliability (ICCs: 0.809–0.861). Doming strength was only correlated positively significantly with the thickness of AbH (r = 0.257, p = 0.046), FT1 strength was correlated negatively with AbDM thickness (r = −0.375, p = 0.003), FT2-3 strength was significantly positively correlated with the CSA of FDB (r = 0.359, p = 0.004) and the thickness (r = 0.273, p = 0.033) and CSA (r = 0.287, p = 0.025) of QP. FT2-5 strength was positively correlated with the CSA of FDB (r = 0.297, p = 0.020) and the thickness (r = 0.258, p = 0.045) and CSA (r = 0.319, p = 0.012) of QP but negatively correlated with the thickness of AbDM (r = −0.296, p = 0.020). The correlation between FIM strength and FIM size was weak. The findings suggested that foot muscle size should be cautiously used as a surrogate in evaluating FIM strength in the older.Graphic Abstract
Keywords
With the global trend of population aging, fall prevention in older adults has emerged as a critical issue that must be addressed by public health authorities. Older adults are at high risk of falls and disability because of the global atrophy of muscle fibers and neuromuscular control degeneration [1–4]. Furthermore, muscle function diminished with age, not only in the form of decreased muscle strength but also in the form of morphological changes [5,6]. The combined effects of motor unit loss and muscle fiber atrophy ultimately leads to a 40% decline in total muscle cross-sectional area in the older [1]. Previous research has investigated the deterioration of postural stability and fall prevention strategies in older adults, with an emphasis on lower extremity large muscle training. However, the foot, which serves as the initial segment of the human kinetic chain, is often neglected.
Foot intrinsic muscles (FIMs), originated and inserted in the plantar bones and aponeurosis, consisted of four layers of muscles characterized by small cross-sectional areas and short moment arms [7]. FIMs support the active longitudinal and transverse arches of the foot half dome, facilitating propulsion and shock absorption during human locomotion [7–9]. In addition, these muscles enable foot bones to resist external forces and reduce the risk of bone stress injury [10]. The strength of FIMs, such as flexor digitorum brevis (FDB), abductor hallucis (AbH), and quadratus plantae (QP) is an important determinant of postural adjustment for maintaining balance and preventing falls in the older [11,12]. Weak foot intrinsic muscles has been shown one of the risk factors in foot diseases, including foot deformity claw toe, hammer toe [13], hallux valgus [14], plantar fasciitis [15], and Charcot–Marie–Tooth disease [16].
Therefore, the reliable evaluation of FIM strength was highlighted to quantify the weakness of the foot and monitor the progress of rehabilitation. Currently, various tools have been developed for evaluating FIM strength, including the toes grip test [17], hand-held dynamometry test [18], pressure plate test [19], and paper grip test [20]. The hand-held dynamometer has been widely used in evaluating FIM strength because of its portability and low cost. It has demonstrated good to excellent reliability for measuring the strength of toes flexion and doming in young healthy adults [21–23].
In addition, the influence of aged changes in muscle morphology on FIM strength and related posture stability of the older is worthy of attention. In young adults, a good correlation has been found between foot muscle strength and foot muscle size [24–27]. However, studies on the relationships between FIM strength and corresponding muscle morphology in the older are rare, and this limitation restricts full understanding of fall prevention in the older. A series of degeneration events have been observed in the older, including altrophy of muscle fibers, decreased muscle strength, increased muscle activation variability [3], and changed force velocity of muscle contraction [28]. Therefore, the reliability of FIM strength tests and correlation with corresponding muscles morphology for young people may not be applicable to older adults. Furthermore, relevant studies focusing on the older population and exploring the correlation between FIM strength and corresponding muscle morphology are rare.
Therefore, the purposes of this study were to evaluate the reliability of FIM strength tests and to determine the relationship between FIM strength and size in the older. This study intended to reinforce understanding of FIM function and the development of foot health assessment methods in older adults. According to previous research results, we hypothesized that the reliability of FIM strength tests is good, but the correlations between strength and size of FIM are weak to moderate in older adults.
PASS 15.0 Sample Size Software (NCSS, UT, USA) was used in sample size estimation. Pearson’s correlation tests were used, the α level was set at p < 0.05, power was set at 0.9, and the baseline correlation (ρ0) was set at 0. Previous correlation studies have shown that the correlation coefficient between foot muscle shape and strength is between 0.4 and 0.7 [29,30]. Given the effect of aging, this study set the alternative correlation (ρ1) at 0.4. Finally, a sample size of 61 participants were required to achieve established statistical efficiency.
All participants were recruited through posters in local communities. The inclusion criteria were as follows: (1) 60–75 years old [29], (2) live independently, and (3) normal cognitive function. The exclusion criteria were as follows: (1) diabetes, stroke, and severe cardiopulmonary disease, (2) history of lower extremity injury in the past 6 months, and (3) toe deformities diagnosed by a podiatrist, including hallux valgus, claw toe deformity, and hammer finger deformity. According to sample size estimation, 61 eligible participants (age: 67.3 ± 4.6 years, height: 157.7 ± 21.8 cm, body mass: 62.9 ± 8.9 kg, BMI: 24.4 ± 3.0 kg/m2, male/female: 16/45) were enrolled. Dominant leg was verified by kicking a ball [31]. This study was approved by the ethics committee of Shanghai University of Sport (Number: 102772021RT026). All participants signed written informed consent forms.
In the FIM strength reliability test, 18 participants (age: 66.7 ± 3.8 years, height: 160.3 ± 7.7 cm, body mass: 61.6 ± 7.5 kg, BMI: 24.0 ± 2.5 kg/m2) were randomly selected for three times of FIM strength measurement. At the first day, tester A completed the first test (Tester-A1) and the second test (Tester-A2) with an interval of 30 min. After 2–7 days, the participants returned for another test by the other tester (Tester-B) [22].
ErgoFet dynamometer (ergoFet, Hoggan Health, USA) and customed wooden fixture were used in measuring FIM strength at a sample frequency of 100 Hz. Each participant completed the test randomly after foot intrinsic strength tests, namely, doming, 1st toe flexion (FT1), 2nd–3rd toes flexion (FT2-3), and 2nd–5th toes flexion (FT2–5). Two trained testers performed all measurements. Before the formal test, participants were allowed to familiarize toes flexion and doming. In the toes flexion tests, each participant was instructed to sit on a chair with knee and ankle flexed at 90°. The examined toes were connected to the dynamometer with a curved T-bar or carabiner, and then the tester instructed the participants to try their best in bending only their toes and preventing forefoot lifting (Fig. 1A) [22]. In order to adapt to different ways of exerting force on the toes, a carabiner was used to isolate FT1. In order to control the 2nd–5th toes from participating in the flexion of the 1st toe, participants were informed to flex only the big toe, keep the 2nd–5th toes as extended as possible, visual check was also conducted during the test process. In the FT2–3, FT2–5 strength test, two different curved T-bars were prepared, and participants selected the most comfortable one for the grip test. In the doming test, the participants stood with their feet shoulder width apart and their center of gravity located between the two legs. The dynamometer was placed above the scaphoid tubercle, and then the participants were instructed to slide the forefeet toward the heel or lift the arch as much as possible without lifting or curling their toes. These actions resulted in the “shortening” of the foot and raising of the longitudinal arch (Fig. 1B) [22]. In all the strength tests, the participants were asked to perform maximum voluntary contraction for three continuous seconds. The participants were given sufficient rest time between each test. Three successful trials of each strength test were used in data analysis.
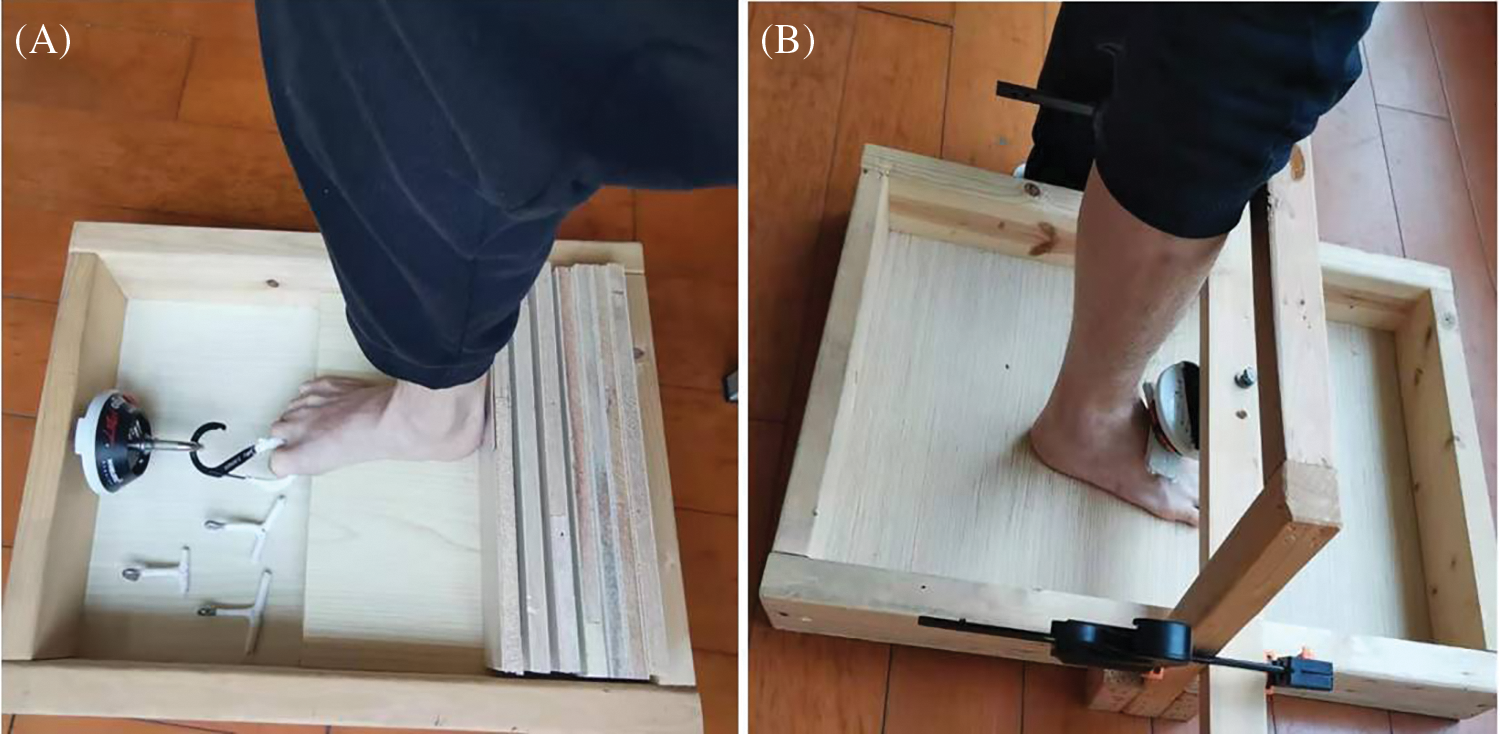
Figure 1: Foot intrinsic muscle strength test. (A) Toes flexion test, (B) Doming test
A musculoskeletal ultrasound system with a 6–14 MHz linear probe (Mindray M7, MINDRAY, Shenzhen, China) was used in measuring the muscle thickness and CSAs of the FDB, AbH, flexor hallucis brevis (FHB), QP, and abductor digiti minimi (AbDM), as shown in Fig. 2. The participants were instructed to lie down in a prone position with their ankles protruding from the bedside and drooping naturally. Muscle testing positions were determined as previously described [32]. At each measurement position, ultrasound coupling gel was applied between the skin and probe placed along the direction of a muscle fiber, and the thickness was calculated. At the thickest position of the muscle, the probe was rotated at 90° for the measurement of CSA. This method has has high intra- and inter-tester reliability [32]. After the long axis of the probe was positioned perpendicular to the muscle boundary, the image was captured when the muscle was relaxed. During the test, the ultrasound probe exerted minimal pressure on the foot sole to reduce the deformation of the tested muscle. Three images were obtained at each test location, and the probe was removed after each test.
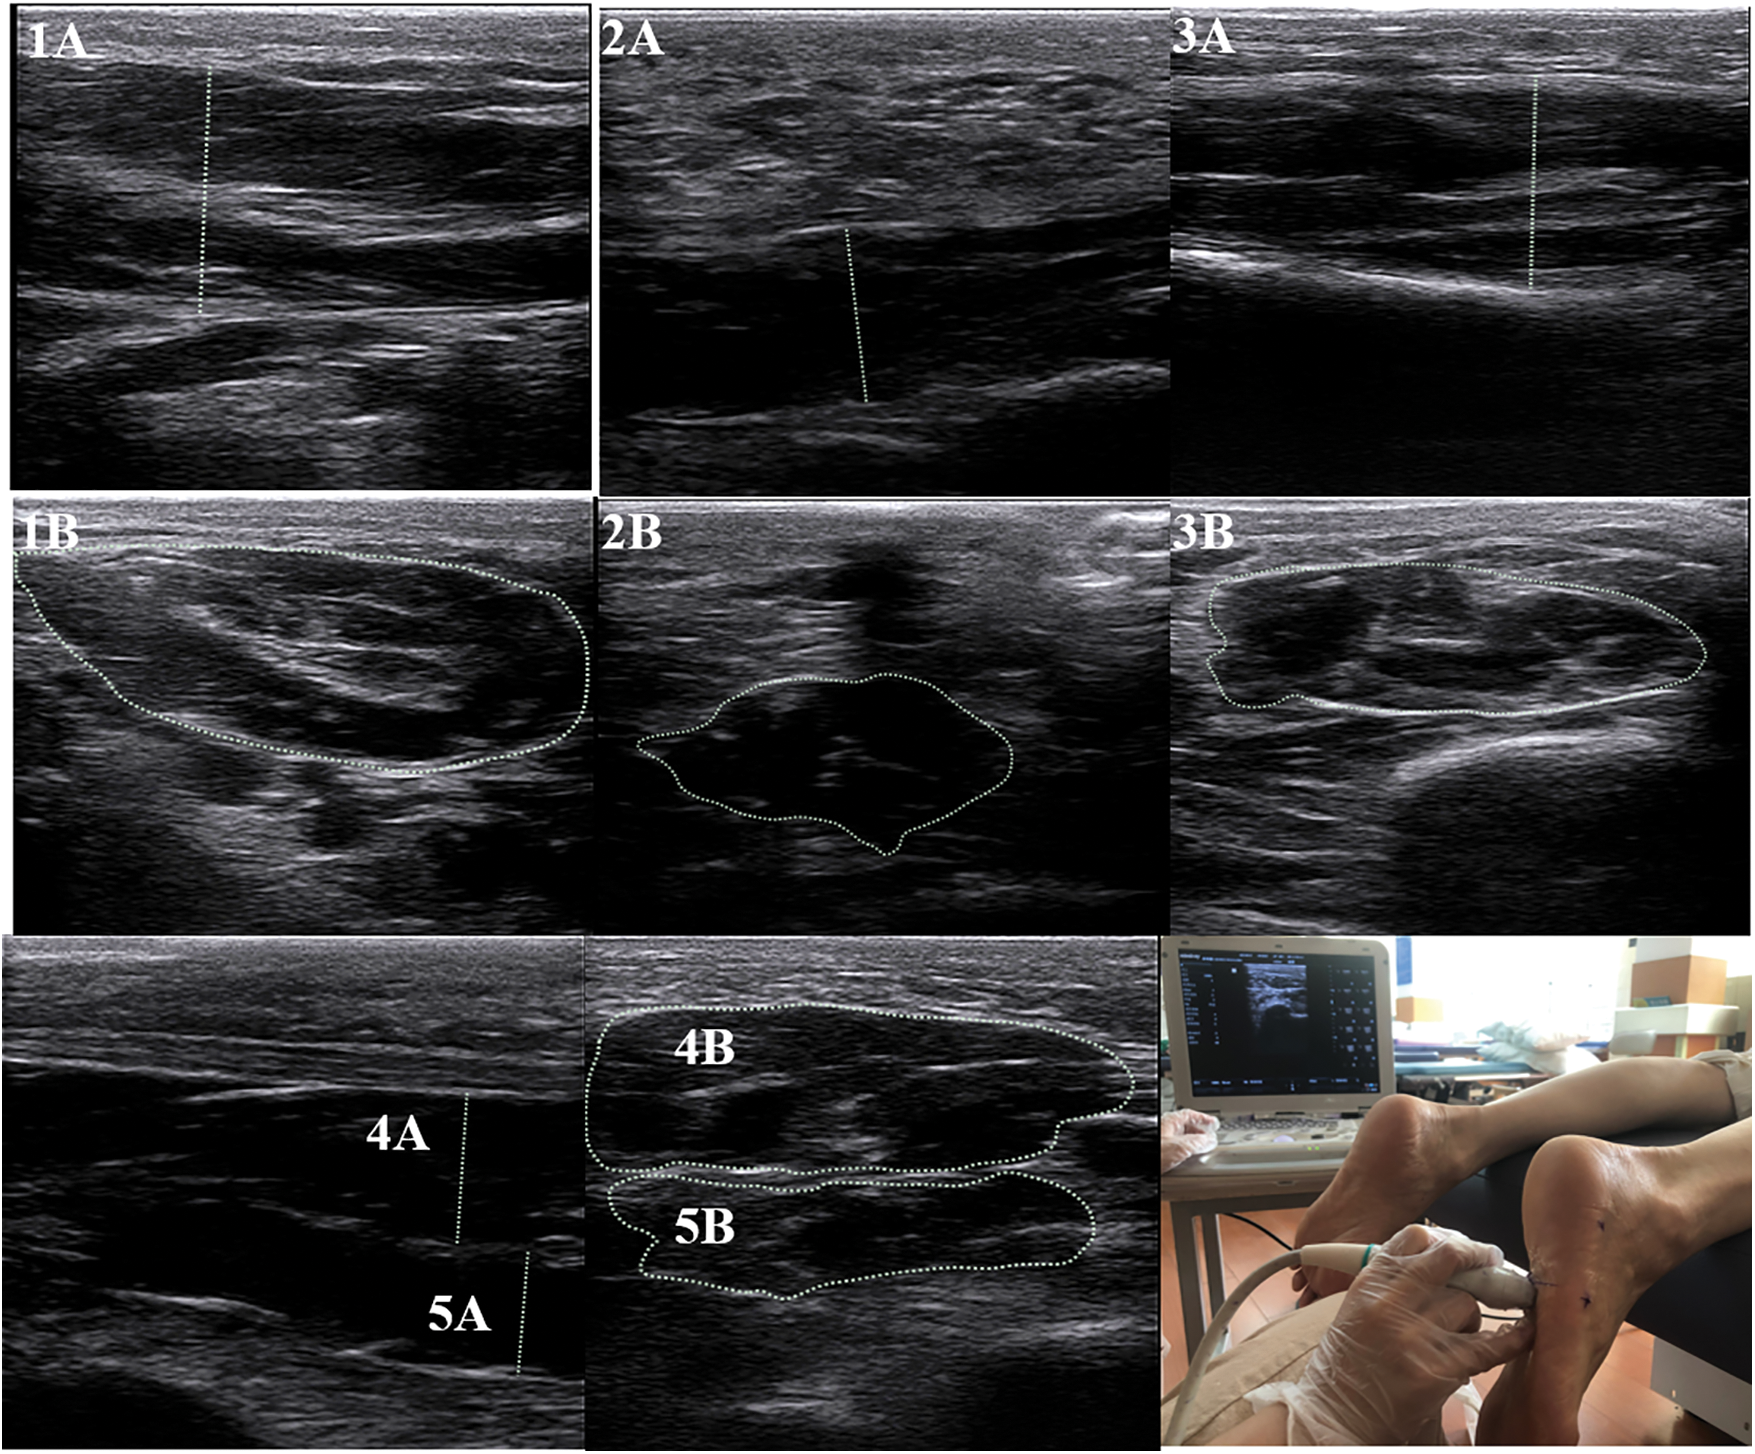
Figure 2: Ultrasound image of foot intrinsic muscles
Note: 1 = Abductor Hallucis; 2 = Abductor Digiti Minimi; 3 = Flexor Hallucis Brevis; 4 = Flexor Digitorum Brevis; 5 = Quadratus Plantae; A = thickness; B = cross-sectional area. Due to the inconsistent anatomical shape of the muscle, some lines indicating the thickest part of the muscle may appear to be slanted.
Raw data from the ergoFet dynamometer were imported into a custom LabView software for the determination of peak force [21,22]. As shown in Fig. 3, the force–time curve showed change trend of force over time. In the doming test data, a movable 0.5 s window on the graph was used in determining the stable force, and then the average strength of 0.5 s was extract for statistical analysis (Fig. 3A). The peak force of toes flexion was determined using the average of six data points around a selected point. Ten data points, including the peak force, were required to maintain relative stability and prevent false peaks. The remaining nine points did not exceed ±0.5 N of the peak in the 10 points (Fig. 3B). The average of the three peak forces was used in statistical analysis.
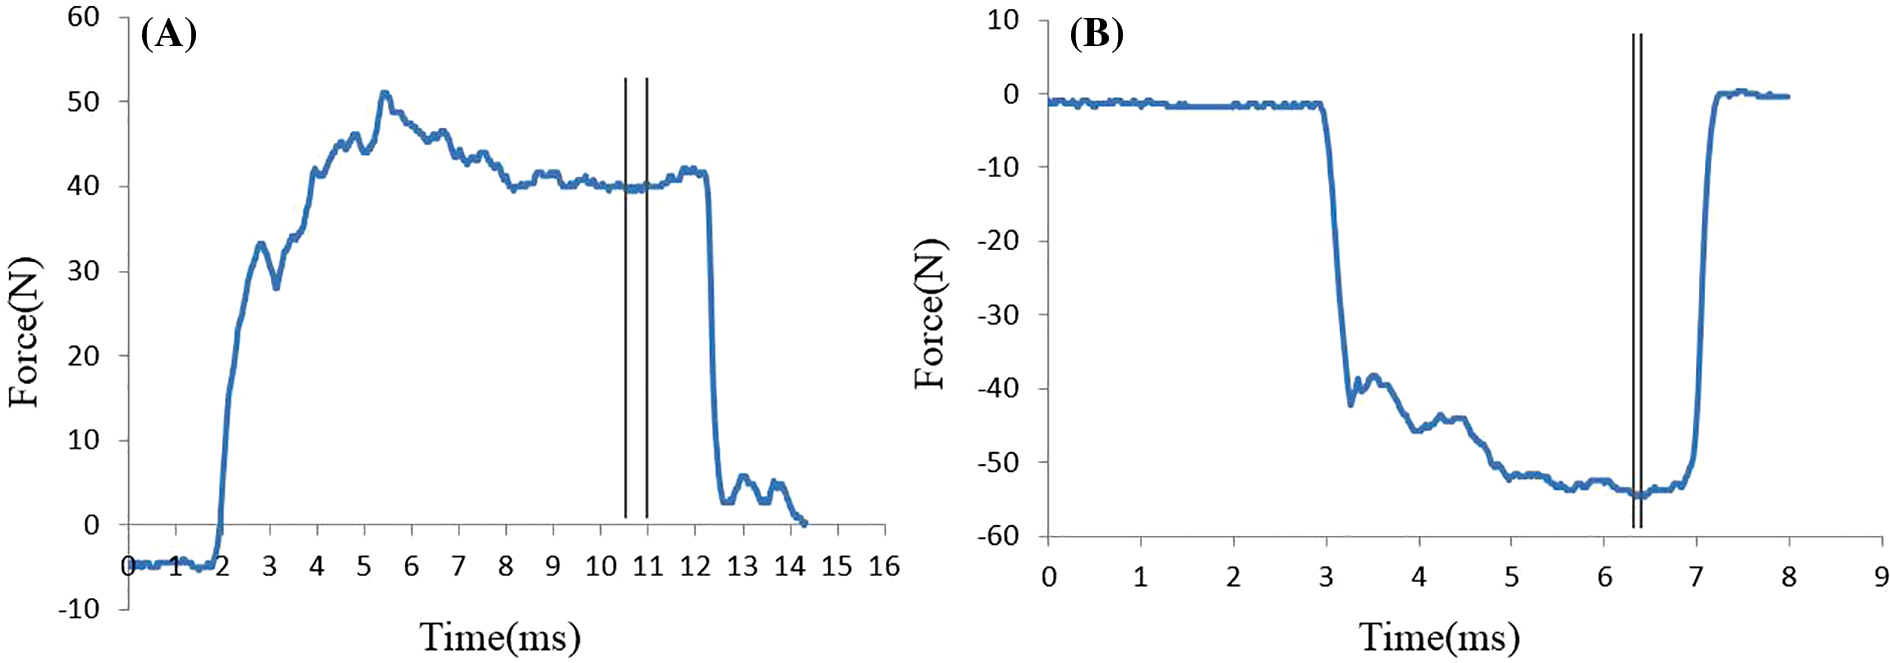
Figure 3: Force–time curve of intrinsic foot muscles. (A) Doming force, (B) Toe grip strength
SPSS 26.0 (IBM Corp., Armonk, NY, USA) was used for statistical analysis, and Shapiro-Wilk test was used in confirming the normal distribution of data. Data were square root-transformed when they were not normally distributed and further ln-transformed when they still did not conform to a normal distribution. Intraclass correlation coefficient (two-way random effects model, absolute agreement) and 95% confidence interval (CI) were used in evaluating intra- and inter-reliability. ICC values of less than 0.5, between 0.5 and 0.75, between 0.75 and 0.9, and greater than 0.90 indicated poor, moderate, good, and excellent reliability, respectively [33]. In addition, the agreement between measurements was assessed using the standard error of measurement (
As shown in Table 1, all FIM strength tests showed good to excellent intra-tester reliability (ICCs = 0.793–0.920, p < 0.01). All test exhibited good intertester reliability (ICCs = 0.809–0.861, p < 0.01), except FT1 (ICC = 0.408, p = 0.147). In addition, one-way repeated ANOVA showed no significant difference among the three doming strength measurements (F [2,16] = 0.350, p = 0.707), FT1 (F [2,16] = 1.107, p = 0.338], FT2–3 (F [2,16] = 0.960, p = 0.390), and FT2–5 (F [2,16] = 0.468, p = 0.629).
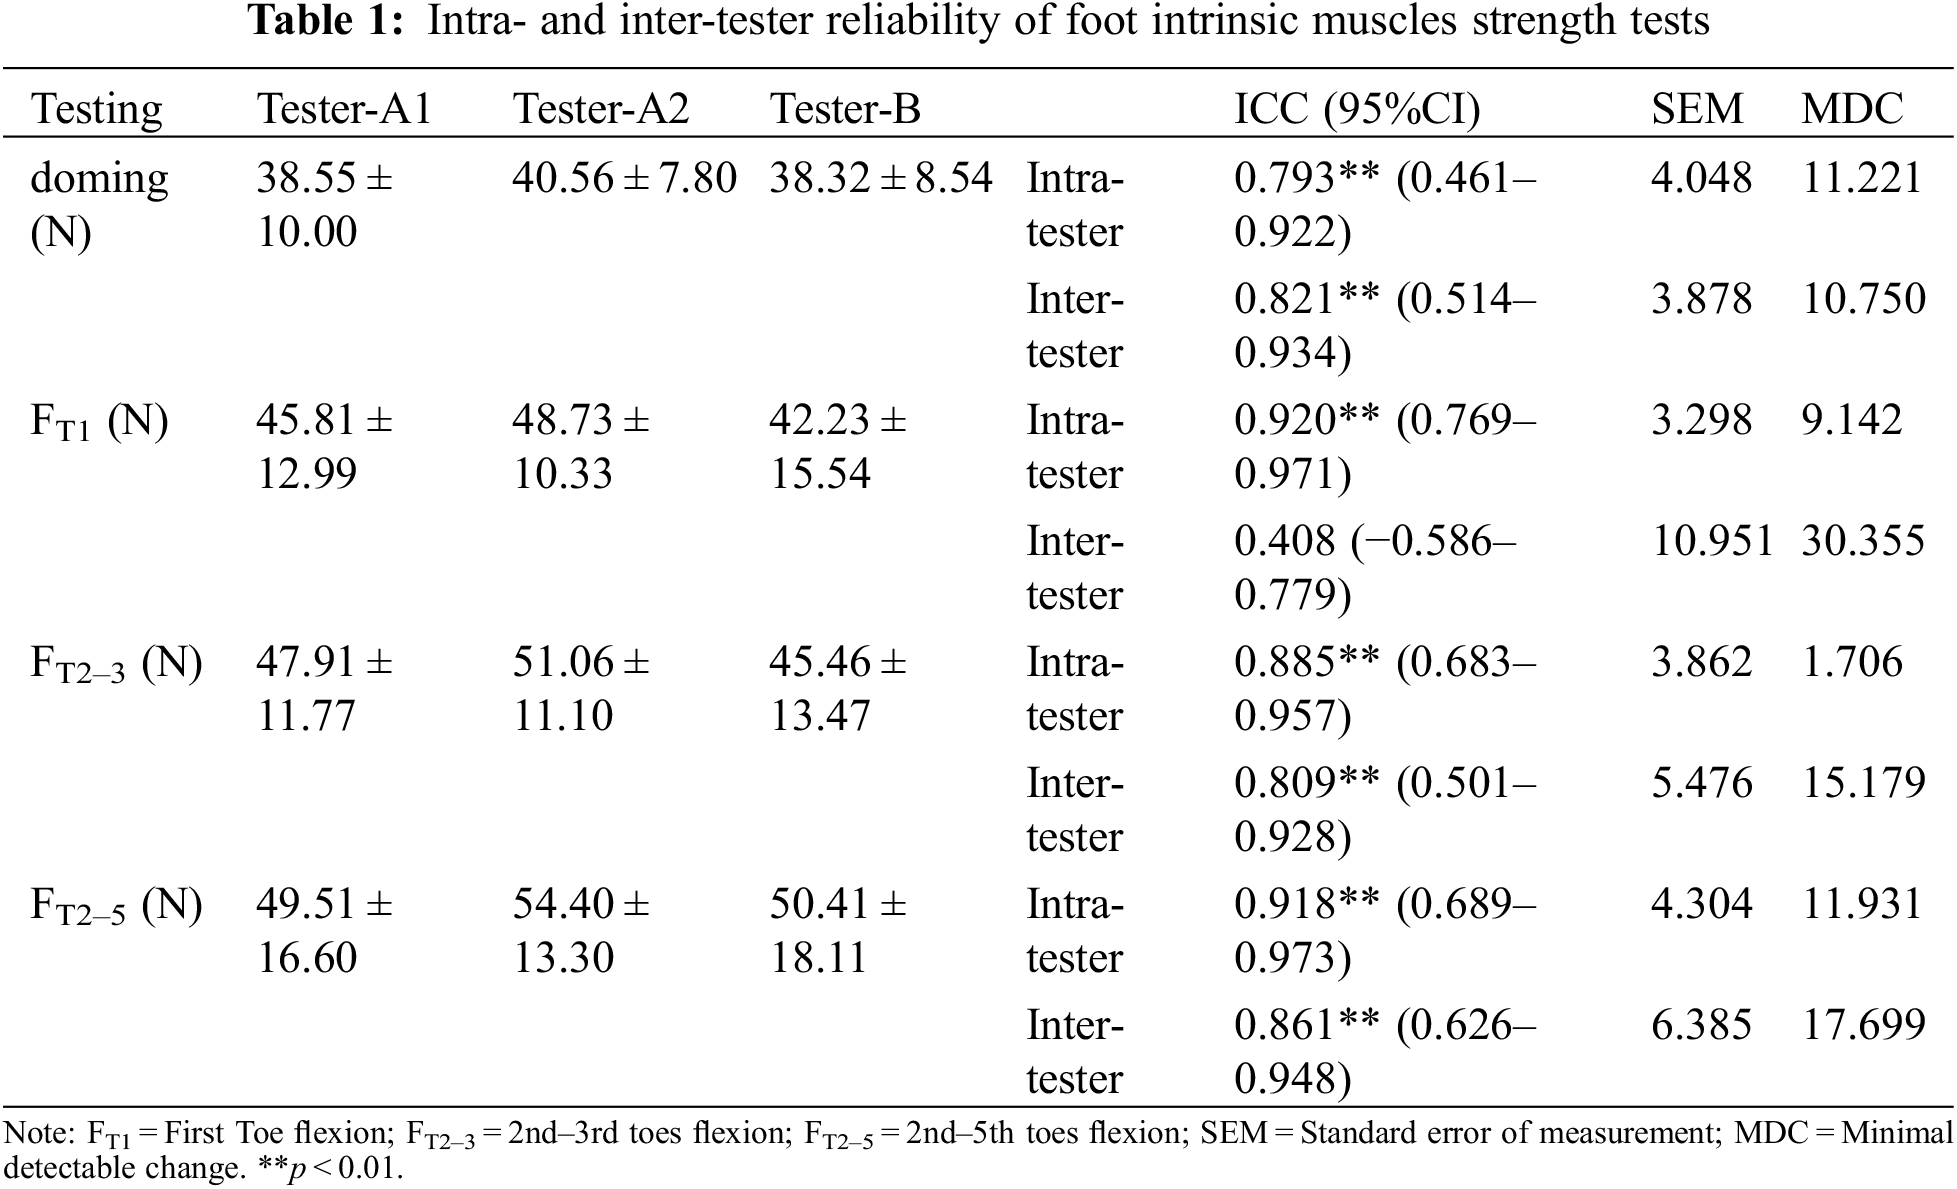
Table 2 displays the thickness and CSA of a measured FIM. As shown in Fig. 4, doming strength showed weak positive correlation with the thickness of AbH (r = 0.257, p = 0.046; Fig. 4a), FT1 showed moderate negative correlation with AbDM thickness (r = −0.375, p = 0.003; Fig. 4b), FT2–3 was significantly positively correlated with the CSA of FDB (r = 0.359, p = 0.004; Fig. 4c) and thickness (r = 0.273, p = 0.033; Fig. 4d) and CSA (r = 0.287, p = 0.025; Fig. 4e) of QP. FT2–5 was correlated positively with the CSA of FDB (r = 0.297, p = 0.020; Fig. 4f) and thickness (r = 0.258, p = 0.045; Fig. 4g) and CSA (r = 0.319, p = 0.012; Fig. 4h) of QP, but FT2–5 was negatively correlated with the thickness of AbDM (r = −0.296, p = 0.020; Fig. 4i). Except the above significant correlation results, no significant correlation was found between the rest of FIM strength and corresponding muscle morphology parameters.
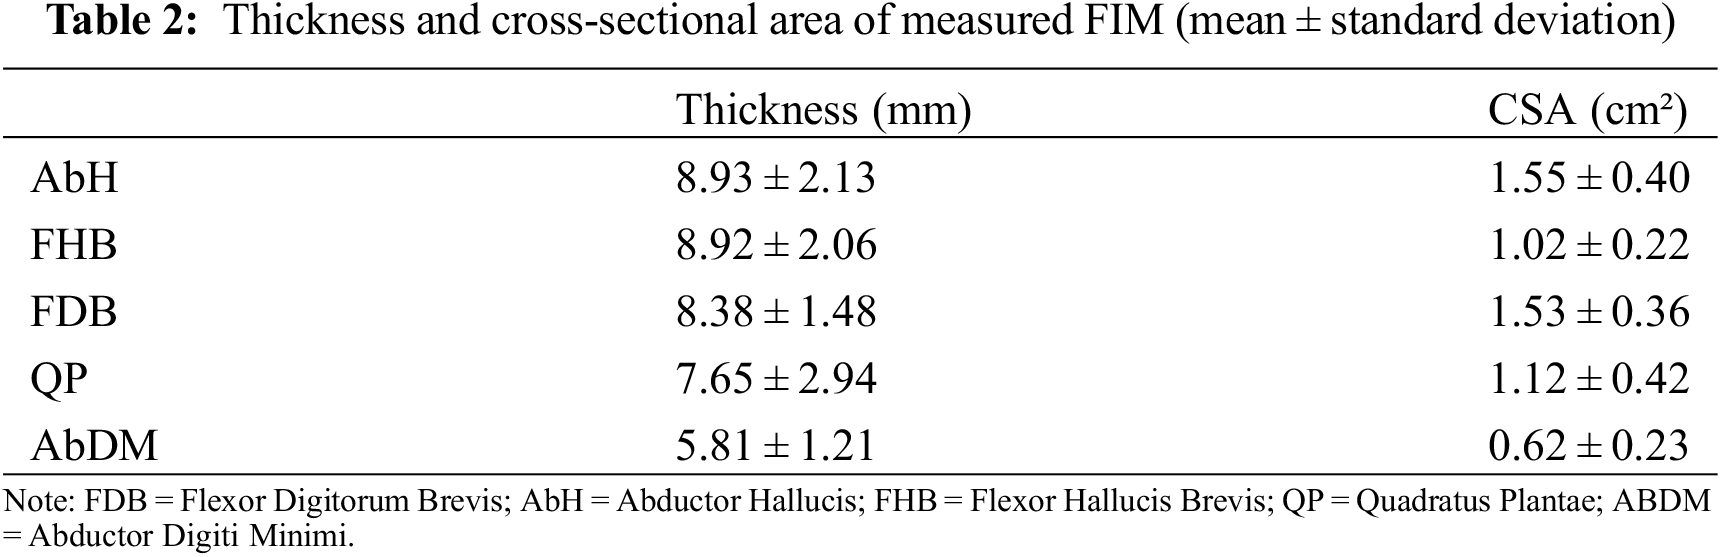
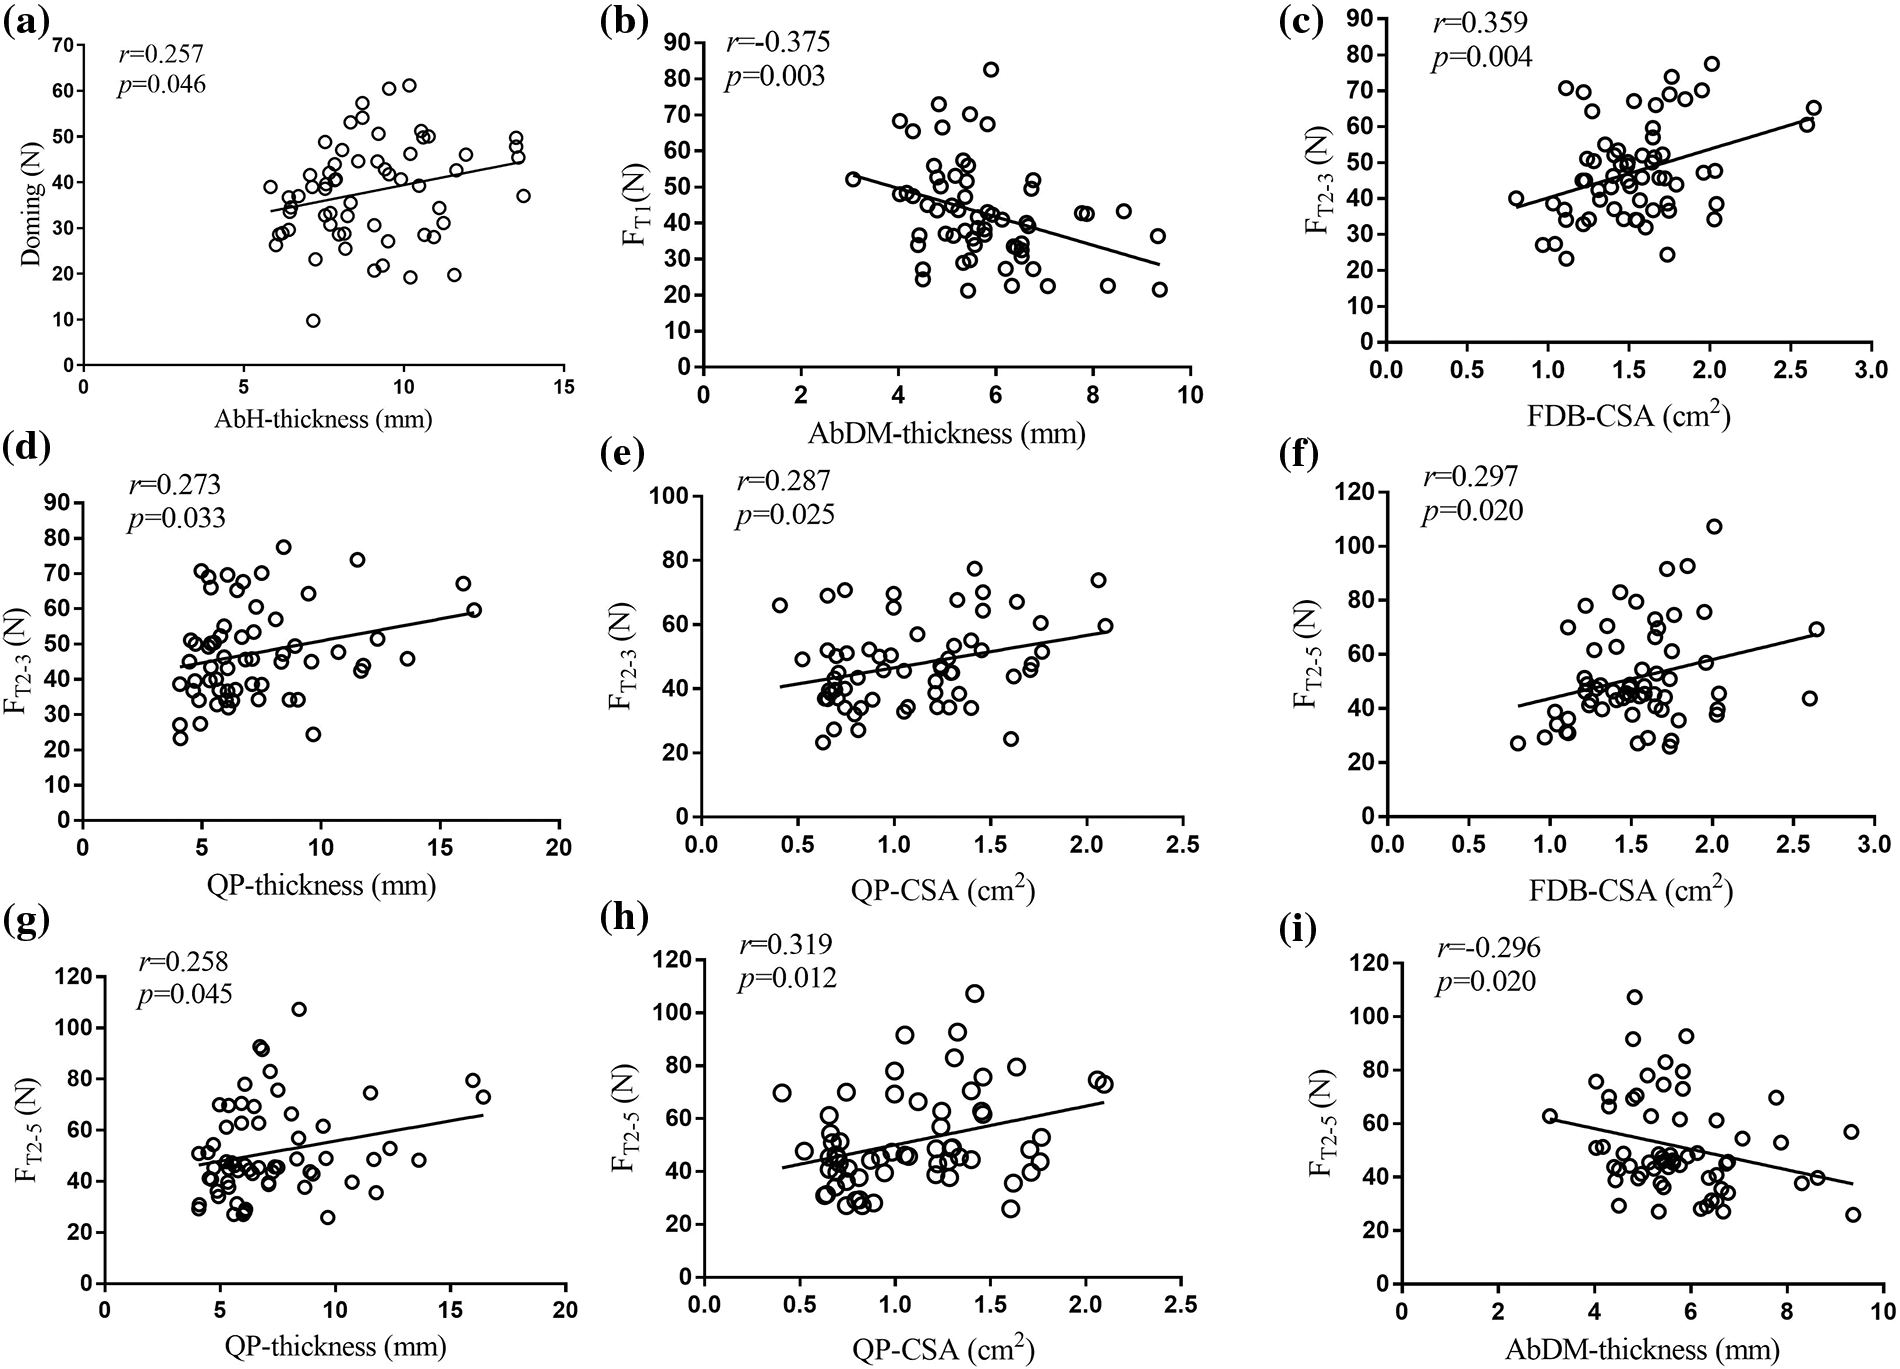
Figure 4: Correlation between strength and size of foot intrinsic muscles
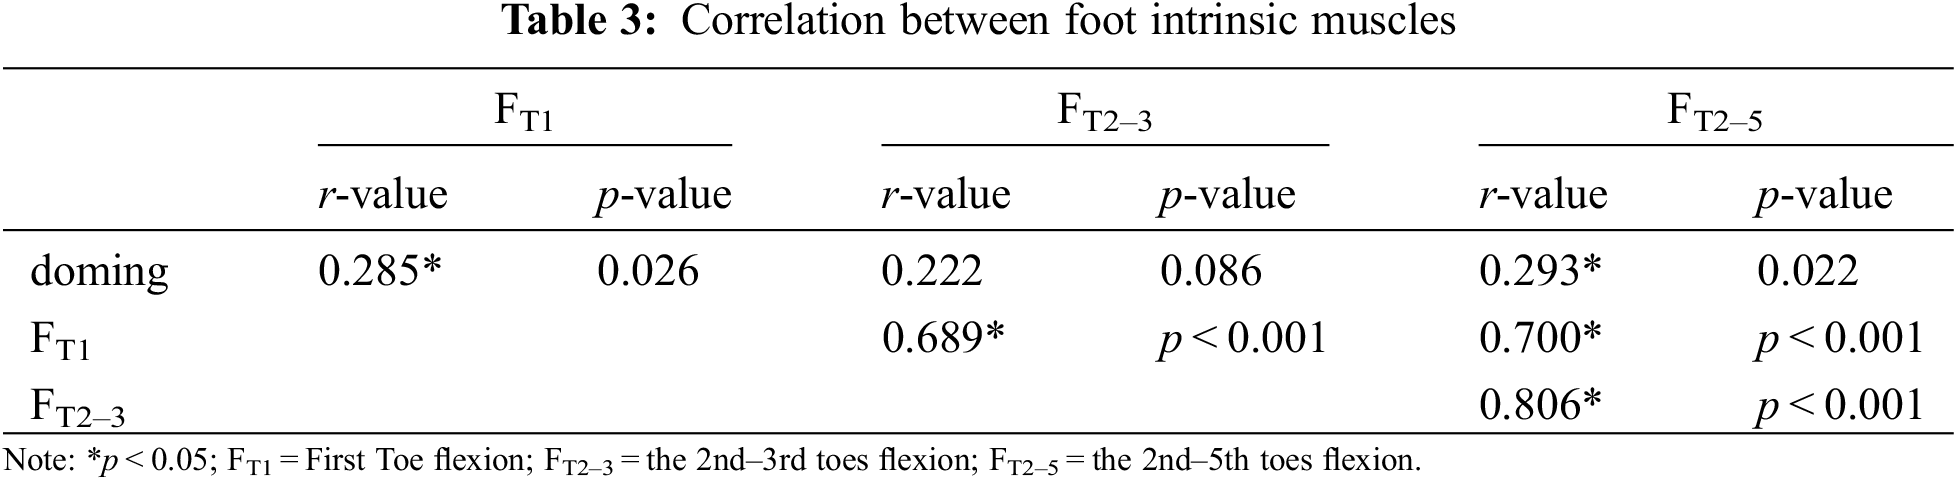
In addition, we found that doming showed weakly positive and significant correlation with FT1 (r = 0.285, p = 0.026) and FT2–5 (r = 0.293, p = 0.022), FT1 showed moderately positive and significant correlation with FT2–3 (r = 0.689, p < 0.001) and FT2–5 (r = 0.700, p < 0.001), FT2–3 showed correlated strongly positive and significant correlation with FT2–5 (r = 0.806, p < 0.001; Table 3).
This study investigated the reliability of FIM strength tests and determined relationship between FIM strength and corresponding muscle size in an older population. Toes grip and doming test using a portable dynamometer was found to be reliable for older adults. However, we only found generally weak correlations between lateral toes flexion (FT2–3, FT2–5) strength and FDB or QP size. Moreover, no significant correlation was found among medial toe flexion (FT1), doming strength, and corresponding muscle morphology.
In this study, all FIM strength tests showed good to excellent intratester reliability (ICCs:0.793–0.920). Doming, FT2–3, and FT2–5 tests exhibited good intertester reliability (ICCs:0.809–0.861). The above results were inferior to previous results in which the same equipment was used for young adults. All toes flexion (ICCs > 0.945) and doming (ICCs > 0.944) strength tests showed reliable results for young healthy adults [21]. These results were consistent with our hypothesis, confirming the assumption that the variability of muscle contraction increases due to the degeneration of muscle fibers [1]. However, current FIM strength measurement equipment is reliable for the older population. Specifically, doming exercise has been recommended to strengthen the intrinsic muscles of the foot. This method can activate abductor muscles and prevent the excessive decline in the height of the medial longitudinal arch [7]. This study demonstrated that doming strength test has good reliability for the older population (ICC > 0.75). Researchers can use similar methods to assess the benefits of short foot exercise for the older.
Current intratester ICCs were slightly higher than the results obtained by the foot pressure platform testing methods of Menz et al. [36] (ICCFT1: 0.88, ICCFT2–5: 0.87). The gripping bar used in the current study provided an obvious grasping target for the toes and may have enabled toe flexors to be activated efficiently. In addition, doming, FT2–3, and FT2–5 tests showed higher intertester reliability than FT1 in the current research. The reason may be the evolution human bipedal movement. Humans were more inclined to focus on interphalangeal joint movement through multiple joints instead of a single joint [21]. Moreover, the local stress was concentrated at the first interphalangeal joint in the FT1 test, and the participants may have felt pain. Thus, the reliability of the FT1 strength test was reduced.
Compared with moderate to strong correlations between FIM strength and corresponding muscle morphology in young adults [29–30,37], generally weak correlations between lateral toes flexion strength and size of FDB or QP were found. Moreover, no significant correlation was found among medial toes flexion, doming strength, and corresponding muscle morphology. Owing to aging-associated changes, morphology factors affecting muscle strength, including muscle bundle length, pinnate angle, volume, and CSA, changed significantly [38]. Moreover, aging-related muscle atrophy possibly reduces type II muscle fibers [39] and consequently decreases muscle fiber tension [39]. Along with the low activation level of agonist muscles in the older [40], the correlation between muscle size and strength is probably weakened to a large extent.
In this study, the strength of FT2–3 and FT2–5 in the older population was significantly correlated with the CSA of FDB and the thickness and CSA of QP. According to the anatomical alignment characteristics of FDB and QP, a relatively large volume was distributed in the plantar deep layer, playing irreplaceable role in toes flexion strength [7]. This result was consistent with the findings in young people [26,29]. Mickle et al. found that the strength of FT2–5 strength was significantly correlated with the thickness and CSAs of FDB and QP [29]. Similar results were reported by Abe et al. [24]. Unexpectedly, no significant correlation between FT1 and sizes of foot medial muscles, such as AbH and FHB, was found. This result was inconsistent with the significant correlation between great toe flexion force and the CSA of AbH [30] and between the CSA and thickness of FHB [29]. This finding revealed inconsistency in degradation rate between strength and size of great toe flexor in older adults.
Except the weak correlation between doming and AbH thickness, no significant correlations were found between doming strength and FIM size. This finding revealed that in the healthy older, doming force is only minimally affected by FIM morphology possibly because of the compensatory contribution of foot extrinsic muscles, such as flexor hallucis longus and peroneus longus [21]. Tendon of FIM cross behind the ankle joint and attach to the flexor retinaculum, providing dynamic support and foot arch stabilization. Interestingly, negative correlations were found between FT1 and FT2–5 and thickness of AbDM, indicating that the thickness of AbDM has no positive contribution to foot grip strength in healthy older people. This finding was similar to that of a previous research, which reported no significant correlation between the CSA and muscle volume of AbDM and the strength of the toes flexor [37].
Moreover, doming strength was weakly correlated significantly with FT1 and FT2–5, indicating that toes flexion and doming strength were associated with each other, although the correlation was weak. This may be due to the compensation of foot extrinsic muscles, such as tibialis anterior and tibialis posterior muscles, which reduced the correlation between toes flexion muscle strength and doming strength. This finding can provide evidence-based recommendations that add short foot movements into usual rehabilitation practice except the toes-grasping exercise or towel-rolling exercise [8,41].
Several limitations should be considered when interpreting current results. First, this study is a cross-sectional study, and thus we were unable to infer the causality of current research results. Future research can explore the effects of foot core muscle training on foot intrinsic muscle strength and corresponding muscle size. Second, given that outgoing restrictions during COVID-19, There are great difficulties in recruiting participants to the laboratory, thus the gender distribution of the participants was inequal. Thus, our data cannot be used for gender subgroup analysis. Given the differences between males and females in hormone levels and muscle fiber composition, future studies can be carried out to compare gender differences for the strength and morphology of foot intrinsic muscles.
In summary, the correlation between FIM strength and corresponding muscle morphology was weak in the older population. The findings of this research indicated foot muscle size should be cautiously used as a surrogate in evaluating FIM strength in the older.
Acknowledgement: The authors are thankful for all the participants’ voluntary contribution during the completion of this study.
Funding Statement: The authors received no specific funding for this study.
Author Contributions: Study conception and design: Lulu Yin, Kun Dong, Zhangqi Lai, Lin Wang. Analysis and interpretation of results: Lulu Yin, Kun Dong, Zhangqi Lai, Lin Wang. Draft manuscript preparation: Lulu Yin, Kun Dong. All authors reviewed the results and approved the final version of the manuscript.
Availability of Data and Materials: The raw data supporting the conclusions of this article will be made available by corresponding author, without undue reservation.
Conflicts of Interest: The authors declare that they have no conflicts of interest to report regarding the present study.
References
1. Power, G. A., Dalton, B. H., Rice, C. L. (2013). Human neuromuscular structure and function in old age: A brief review. Journal of Sport and Health Science, 2, 215–226. [Google Scholar]
2. Pol, F., Khajooei, Z., Hosseini, S. M., Taheri, A., Forghany, S. et al. (2022). Foot and ankle characteristics associated with fear of falling and mobility in community-dwelling older people: A cross-sectional study. Journal of Foot and Ankle Research, 15, 86. [Google Scholar] [PubMed]
3. Duan, X., Rhee, J., Mehta, R. K., Srinivasan, D. (2018). Neuromuscular control and performance differences associated with gender and obesity in fatiguing tasks performed by older adults. Frontiers in Physiology, 9, 800. [Google Scholar]
4. Chen, X., Xu, D. (2021). Effects of Tai Chi Chuan on the physical and mental health of the elderly: A systematic review. Physical Activity and Health, 5(1), 21–27. [Google Scholar]
5. Kent-Braun, J. A., Ng, A. V., Young, K. (2000). Skeletal muscle contractile and noncontractile components in young and older women and men. Journal of Applied Physiology, 88(2), 662–668. [Google Scholar] [PubMed]
6. Morse, C. I., Thom, J. M., Reeves, N. D., Birch, K. M., Narici, M. V. (2005). In vivo physiological cross-sectional area and specific force are reduced in the gastrocnemius of elderly men. Journal of Applied Physiology, 99(3), 1050–1055. [Google Scholar]
7. McKeon, P. O., Hertel, J., Bramble, D., Davis, I. (2015). The foot core system: A new paradigm for understanding intrinsic foot muscle function. British Journal of Sports Medicine, 49, 290. [Google Scholar] [PubMed]
8. Tourillon, R., Gojanovic, B., Fourchet, F. (2019). How to evaluate and improve foot strength in athletes: An update. Frontiers in Sports and Active Living, 1, 46. [Google Scholar] [PubMed]
9. Farris, D. J., Kelly, L. A., Cresswell, A. G., Lichtwark, G. A. (2019). The functional importance of human foot muscles for bipedal locomotion. Proceedings of the National Academy of Sciences of the United States of America, 116, 1645–1650. [Google Scholar] [PubMed]
10. Ridge, S. T., Olsen, M. T., Bruening, D. A., Jurgensmeier, K., Griffin, D. et al. (2019). Walking in minimalist shoes is effective for strengthening foot muscles. Medicine and Science in Sports and Exercise, 51(1), 104–113. [Google Scholar]
11. Chatzistergos, P. E., Healy, A., Naemi, R., Sundar, L., Ramachandran, A. et al. (2019). The relationship between hallux grip force and balance in people with diabetes. Gait Posture, 70, 109–115. [Google Scholar] [PubMed]
12. Futrell, E. E., Roberts, D., Toole, E. (2022). The effects of intrinsic foot muscle strengthening on functional mobility in older adults: A systematic review. Journal of the American Geriatrics Society, 70, 531–540. [Google Scholar] [PubMed]
13. Kwon, O. Y., Tuttle, L. J., Johnson, J. E., Mueller, M. J. (2009). Muscle imbalance and reduced ankle joint motion in people with hammer toe deformity. Clin Biomech, 24, 670–675. [Google Scholar]
14. Moulodi, N., Azadinia, F., Ebrahimi-Takamjani, I., Atlasi, R., Jalali, M. et al. (2020). The functional capacity and morphological characteristics of the intrinsic foot muscles in subjects with Hallux Valgus deformity: A systematic review. Foot, 45, 101706. [Google Scholar]
15. Chang, R., Kent-Braun, J. A., Hamill, J. (2012). Use of MRI for volume estimation of tibialis posterior and plantar intrinsic foot muscles in healthy and chronic plantar fasciitis limbs. Clinical Biomechanics, 27(5), 500–505. [Google Scholar]
16. Bus, S. A., Maas, M., Michels, R. P., Levi, M. (2009). Role of intrinsic muscle atrophy in the etiology of claw toe deformity in diabetic neuropathy may not be as straightforward as widely believed. Diabetes Care, 32, 1063–1067. [Google Scholar] [PubMed]
17. Uritani, D., Fukumoto, T., Matsumoto, D. (2012). Intrarater and interrater reliabilitiesfor a toe grip dynamometer. Journal of Physical Therapy Science, 24, 639–643. [Google Scholar]
18. Spink, M. J., Fotoohabadi, M. R., Menz, H. B. (2010). Foot and ankle strength assessment using hand-held dynamometry: Reliability and age-related differences. Gerontology, 56, 525–532. [Google Scholar] [PubMed]
19. Quek, J., Treleaven, J., Brauer, S. G., O’Leary, S., Clark, R. A. (2015). Intra-rater reliability of hallux flexor strength measures using the Nintendo Wii Balance Board. Journal of Foot and Ankle Research, 8, 1–5. [Google Scholar]
20. de Win, M. M., Theuvenet, W. J., Roche, P. W., de Bie, R. A., van Mameren, H. (2002). The paper grip test for screening on intrinsic muscle paralysis in the foot of leprosy patients. International Journal of Leprosy and other Mycobacterial Diseases, 70, 16–24. [Google Scholar] [PubMed]
21. Bruening, D. A., Ridge, S. T., Jacobs, J. L., Olsen, M. T., Griffin, D. W. et al. (2019). Functional assessments of foot strength: A comparative and repeatability study. BMC Musculoskeletal Disorders, 20, 608. [Google Scholar] [PubMed]
22. Ridge, S. T., Myrer, J. W., Olsen, M. T., Jurgensmeier, K., Johnson, A. W. (2017). Reliability of doming and toe flexion testing to quantify foot muscle strength. Journal of Foot and Ankle Research, 10, 55. [Google Scholar]
23. Fraser, J. J., Koldenhoven, R. M., Saliba, S. A., Hertel, J. (2017). Reliability of ankle-foot morphology, mobility, strength, and motor performance measures. International Journal of Sports Physical Therapy, 12(7), 1134–1149. [Google Scholar]
24. Abe, T., Tayashiki, K., Nakatani, M., Watanabe, H. (2016). Relationships of ultrasound measures of intrinsic foot muscle cross-sectional area and muscle volume with maximum toe flexor muscle strength and physical performance in young adults. Journal of Physical Therapy Science, 28(1), 14–19. [Google Scholar]
25. Kurihara, T., Tottori, N., Otsuka, M., Yamauchi, J., Isaka, T. (2012). The relationship between toe grip force and muscle sizes of foot intrinsic and extrinsic muscles. The Proceedings of the Symposium on Sports and Human Dynamics, pp. 451–453. [Google Scholar]
26. Kurihara, T., Yamauchi, J., Otsuka, M., Tottori, N., Hashimoto, T. et al. (2014). Maximum toe flexor muscle strength and quantitative analysis of human plantar intrinsic and extrinsic muscles by a magnetic resonance imaging technique. Journal of Foot and Ankle Research, 7(1), 26. [Google Scholar] [PubMed]
27. Reeves, J. E., Jones, R., Liu, A., Bent, L., Nester, C. (2019). The relationship between toe grip strength and intrinsic muscle morphology. Footwear Science, 11, S30–S31. [Google Scholar]
28. Raj, I. S., Bird, S. R., Shield, A. J. (2010). Aging and the force-velocity relationship of muscles. Experimental Gerontology, 45, 81–90. [Google Scholar] [PubMed]
29. Mickle, K. J., Angin, S., Crofts, G., Nester, C. J. (2016). Effects of age on strength and morphology of toe flexor muscles. The Journal of Orthopaedic and Sports Physical Therapy, 46, 1065–1070. [Google Scholar]
30. Latey, P. J., Burns, J., Nightingale, E. J., Clarke, J. L., Hiller, C. E. (2018). Reliability and correlates of cross-sectional area of abductor hallucis and the medial belly of the flexor hallucis brevis measured by ultrasound. Journal of Foot and Ankle Research, 11, 28. [Google Scholar] [PubMed]
31. van Melick, N., Meddeler, B. M., Hoogeboom, T. J., Nijhuis-van der Sanden, M. W. G., van Cingel, R. E. H. (2017). How to determine leg dominance: The agreement between self-reported and observed performance in healthy adults. PLoS One, 12, e0189876. [Google Scholar]
32. Mickle, K. J., Nester, C. J., Crofts, G., Steele, J. R. (2013). Reliability of ultrasound to measure morphology of the toe flexor muscles. Journal of Foot and Ankle Research, 6(1), 12. [Google Scholar]
33. Koo, T. K., Li, M. Y. (2016). A guideline of selecting and reporting intraclass correlation coefficients for reliability research. Journal of Chiropractic Medicine, 15, 155–163. [Google Scholar] [PubMed]
34. Terwee, C. B., Bot, S. D., de Boer, M. R., van der Windt, D. A., Knol, D. L. et al. (2007). Quality criteria were proposed for measurement properties of health status questionnaires. Journal of Clinical Epidemiology, 60, 34–42. [Google Scholar] [PubMed]
35. Akoglu, H. (2018). User’s guide to correlation coefficients. Turkish Journal of Emergency Medicine, 18(3), 91–93. [Google Scholar] [PubMed]
36. Menz, H. B., Zammit, G. V., Munteanu, S. E., Scott, G. (2006). Plantarflexion strength of the toes: Age and gender differences and evaluation of a clinical screening test. Foot & Ankle International, 27, 1103–1108. [Google Scholar]
37. Kusagawa, Y., Kurihara, T., Maeo, S., Sugiyama, T., Kanehisa, H. et al. (2022). Associations between the size of individual plantar intrinsic and extrinsic foot muscles and toe flexor strength. Journal of Foot and Ankle Research, 15, 22. [Google Scholar] [PubMed]
38. Narici, M. V., Maganaris, C. N., Reeves, N. D., Capodaglio, P. (2003). Effect of aging on human muscle architecture. Journal of Applied Physiology, 95(6), 2229–2234. [Google Scholar] [PubMed]
39. Trappe, S., Gallagher, P., Harber, M., Carrithers, J., Fluckey, J. et al. (2003). Single muscle fibre contractile properties in young and old men and women. The Journal of Physiology, 552(1), 47–58. [Google Scholar]
40. Morse, C. I., Thom, J. M., Davis, M. G., Fox, K. R., Birch, K. M. et al. (2004). Reduced plantarflexor specific torque in the elderly is associated with a lower activation capacity. European Journal of Applied Physiology, 92, 219–226. [Google Scholar] [PubMed]
41. Matias, A. B., Taddei, U. T., Duarte, M., Sacco, I. C. (2016). Protocol for evaluating the effects of a therapeutic foot exercise program on injury incidence, foot functionality and biomechanics in long-distance runners: A randomized controlled trial. BMC Musculoskeletal Disorders, 17(1), 160. [Google Scholar] [PubMed]
Cite This Article
 Copyright © 2023 The Author(s). Published by Tech Science Press.
This work is licensed under a Creative Commons Attribution 4.0 International License , which permits unrestricted use, distribution, and reproduction in any medium, provided the original work is properly cited.
 Downloads
 Citation Tools