
 Open Access
ARTICLE

Computational Fluid Dynamics Analysis of Upper Airway Changes after Protraction Headgear and Rapid Maxillary Expansion Treatment
1
School of Energy and Power Engineering, Shandong University, Jinan, 250061, China
2
Department of Orthodontics, School and Hospital of Stomatology, Cheeloo College of Medicine, Shandong University & Shandong
Key Laboratory of Oral Tissue Regeneration & Shandong Engineering Laboratory for Dental Materials and Oral Tissue
Regeneration, Jinan, 250012, China
3
Department of Ultrasound, Jinan Central Hospital, Jinan, 250000, China
* Corresponding Authors: Jingying Wang. Email: ; Shuai Chen. Email:
Molecular & Cellular Biomechanics 2023, 20(1), 15-22. https://doi.org/10.32604/mcb.2023.029107
Received 01 February 2023; Accepted 23 February 2023; Issue published 20 June 2023
 View Full Text
 Download PDF
Abstract
Clinically, it is common for Class III patients with maxillary skeletal deficiency, which may result in a variety of adverse consequences. Protraction headgear and rapid maxillary expansion (PE) is an effective treatment, but its effect on upper airway hydrodynamics has not been reported. The main purpose of this study was to evaluate the changes of the flow in the upper airway after PE by computational fluid dynamics (CFD). The sample includes fifteen patients (6 males, 9 females, age 11.00 ± 1.00) and the paired T-test was used to analyze the differences between the measured data before and after treatment. The maximum flow velocity decreased from 8.42 ± 0.16 m/s to 6.98 ± 0.36 m/s (p < 0.05), and the maximum shear force decreased from 3.72 ± 1.48 Pa to 2.13 ± 0.18 Pa. The maximum negative pressure decreased from −101.78 ± 33.60 Pa to 58.15 ± 9.16 Pa, only the changes of velopharynx and glossopharynx were statistically significant; while the maximum resistance decreased from 140.88 ± 68.68 Pa/mL/s to 45.95 ± 22.96 Pa/mL/s. PE can effectively reduce the airflow resistance of the upper airway and the probability of airway collapse, thus improving the patient’s ventilation function.Graphic Abstract

Keywords
Class III with maxillary skeletal deficiency is a common malocclusion in clinical practice, with an incidence of 15.69% in Chinese population [1]. It usually presents with maxillary skeletal deficiency and normal or excessive mandible. This kind of malocclusion can cause adverse effects on oral and general health, and affect the appearance and mental health of the child [2]. In severe cases, it can also cause airway collapse, affect the ventilation function of patients, and even lead to obstructive sleep apnea hypopnea syndrome (OSAHS) [3]. Therefore, timely diagnosis and early intervention of Class III malocclusion are conducive to the normal growth and development of children.
Protraction headgear and rapid maxillary expansion (PE) is an effective way to treat growing patients with skeletal Class III malocclusion. Most of the previous studies have evaluated the morphological effect of PE on the upper airway by using 2D lateral cephalogram and 3D CBCT images. Lombardo et al. compared 47 children receiving PE treatment with 18 control groups, and found that the oropharyngeal sagittal diameter increased significantly in the treatment group, achieving a long-term stable effect [4]. However, the accuracy of the research results will be affected by the limitations of the lateral cephalogram, such as amplification error, structural overlap and the two-dimensional evaluation results cannot truly reflect the changes of the three-dimensional structure [5]. CBCT technology has high spatial resolution, can effectively distinguish soft tissue from air, and can carry out three-dimensional measurement and analysis of the tissue structure, to obtain more accurate morphological results [6,7]. Still, the morphological changes are only appearances and cannot reflect the changes in the characteristics of air flow in the respiratory tract. At present, the effect of PE correction on the upper airway hydrodynamics remains to be fully studied.
The computational fluid dynamics (CFD) can provide clear visualizations, such as flow characteristics and patterns inside the upper airway of the human body, allowing researchers to study the critical airflow in the upper airway prior to surgery [8]. A number of scholars have applied CFD method to study the hydrodynamic changes of nasal cavity and upper airway after treatment with rapid maxillary expansion [9,10], and found that arch expansion is helpful to improve the ventilation function of children. Therefore, CFD is considered to be a reliable tool for evaluating the clinical effect [11,12].
This study intends to use CFD method to evaluate the changes of the upper airway after PE treatment, and to understand the influence of PE on ventilation function in Class III growing patients with maxillary deficiency.
This study has been approved by the Shandong University School of Stomatology Research Ethic Board (protocol number 20200802). The subjects were 15 Class III growing patients with maxillary deficiency (age 11.00 ± 1.00, body mass index 15.30 kg/m2 ± 1.09 kg/m2), including 6 males and 9 females. Inclusion criteria were as follows: (1) prepubertal or pubertal stage according to the cervical vertebral maturation method; (2) −4° < ANB < 0°; (3) Wits < −2; (4) anterior crossbite; (5) 22° ≤ FH-MP ≤ 32°; (6) no history of orthodontic treatment; (7) no other maxillofacial bone deformity.
The maxillary arch expander was glued to the anchorage teeth using glass ions, and was turned 2 times a day until the tongue tip of the maxillary posterior teeth was opposite the buccal tip of the mandibular posterior teeth. The fully adjustable front traction device is used. The traction direction was 30° forward and down from the occlusal plane. The orthopedic force value of each side is about 500 g. The traction time of the patient should not be less than 14 h per day. At the end of the treatment, at least 3∼5 mm overjet was obtained, and the molar relationship was Class I or II.
CBCT images were taken before and after treatment with a 3-month interval. Both times were taken by the same operator using New Tom 5G focusing on the head and neck region with the patients in supine position. The voxel resolution was 0.3 mm, and the scanning parameters were set at 110 kV and 10 mA. Before CBCT was taken, the patient rested for 30 min at room temperature. The acquired data were stored and exported in DICOM format files.
2.4 Upper Airway Model Segmentation and Reconstruction
Import the DICOM file into Mimics 10.0 (Materialise NV, Leuven, Belgium) software. Then, edit and reconstruct it through the following 6 steps, obtain the three-dimensional model of the upper respiratory tract, and save it as STL format file output (Fig. 1).
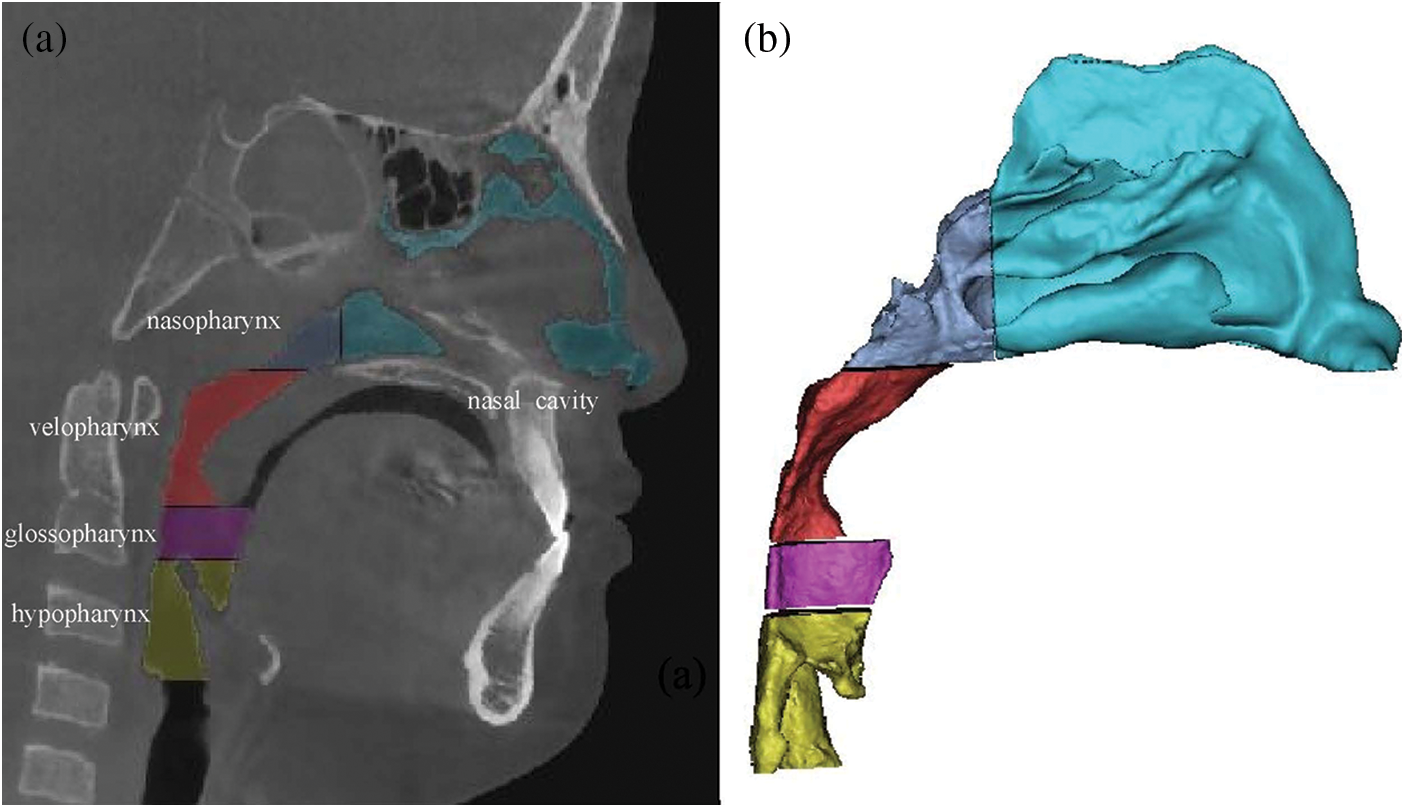
Figure 1: (a) upper airway model segmentation; (b) airway reconstruction
(1) Setting thresholds: the bone, muscle and other tissues with obvious difference in pixel value in CBCT are distinguished by setting threshold. In this study, the upper airway threshold was set as −1000∼−345 HU [13].
(2) Image segmentation: the erase function was used to segment the boundary of the upper airway in the coronal plane, sagittal plane and horizontal plane.
(3) Region growth: region growing function was used to remove the disconnected tissue around the upper airway.
(4) Edit mask: check the segmentation boundary slice by slice, and accurately erase and repair the respiratory tract boundary. Manually erase the nasal bone and areas other than the upper airway, such as the maxillary sinus, ethmoid sinus, frontal sinus, sphenoid sinus, etc.
(5) Three-dimensional reconstruction: use 3D calculation to form a 3D model of the upper airway.
(6) Smooth processing: smoothing function is used to remove the sharp edges on the rough surface of the model and improve the overall quality of the model.
After that, convert the STL file into igs format and import it into Ansys workbench 2022 (Ansys Inc., Pittsburg, PA), setting the front nostril as a pressure outlet, 0 Pa relative to standard atmospheric pressure, the lower margin of the throat cavity as a velocity inlet, and the tidal volume at −300 mL/s [14].
Adopt standard k-ω numerical model, and set the upper airway wall as non-slip. The residual was set to 10−5, and the calculation of the pressure field and velocity field of the upper airway was carried out using the SIMPLEC algorithm.
Among them, the transport equation of standard k-ω model is as follows:
In the above equation,
First of all, the mesh independence test is carried out. ANSYS-Meshing was used to generate the unstructured tetrahedral volumetric grids of the upper airway flow domain. Mesh diameters of 1.0, 2.0 and 5.0 mm were used respectively to calculate the upper airway model with mesh numbers of 870,000, 540,000 and 230,000. The average pressure of the oropharyngeal cross section was taken as the measurement standard. The results show that the calculation results are more accurate with the increase of the number of grids, but the difference of pressure is less than 1.6% between the results of 540,000 and 870,000 grids, so it can be considered that the calculation results are independent of the number of grids. Therefore, the grid diameter was uniformly set at 2.0 mm in this study.
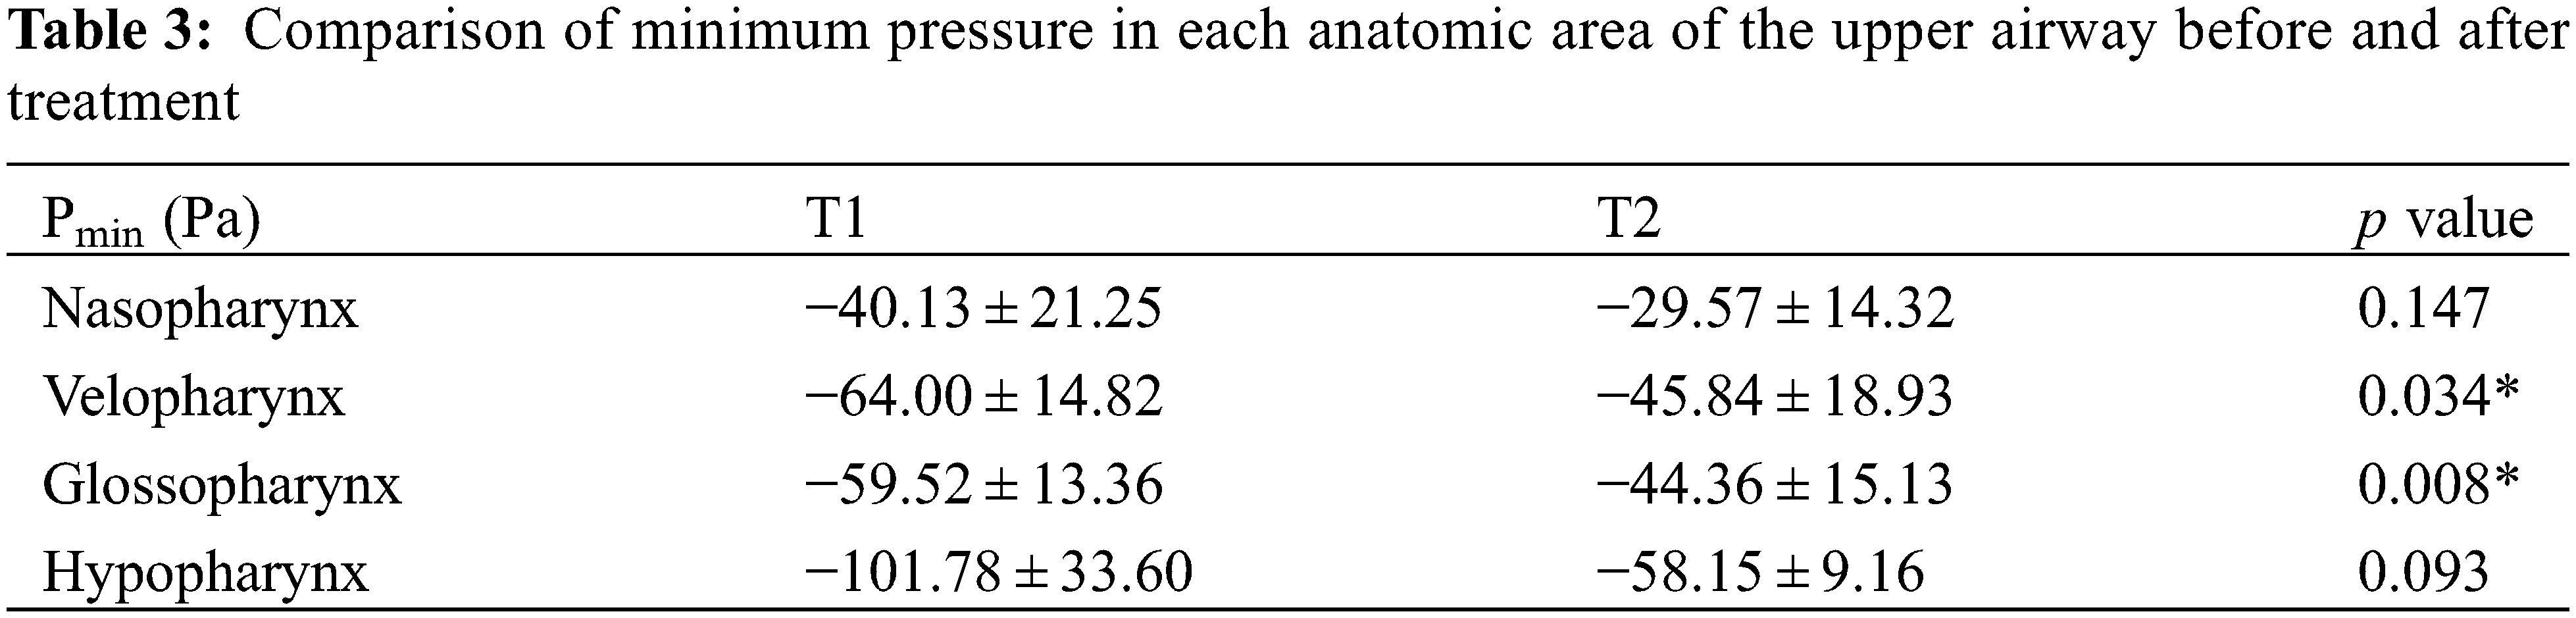
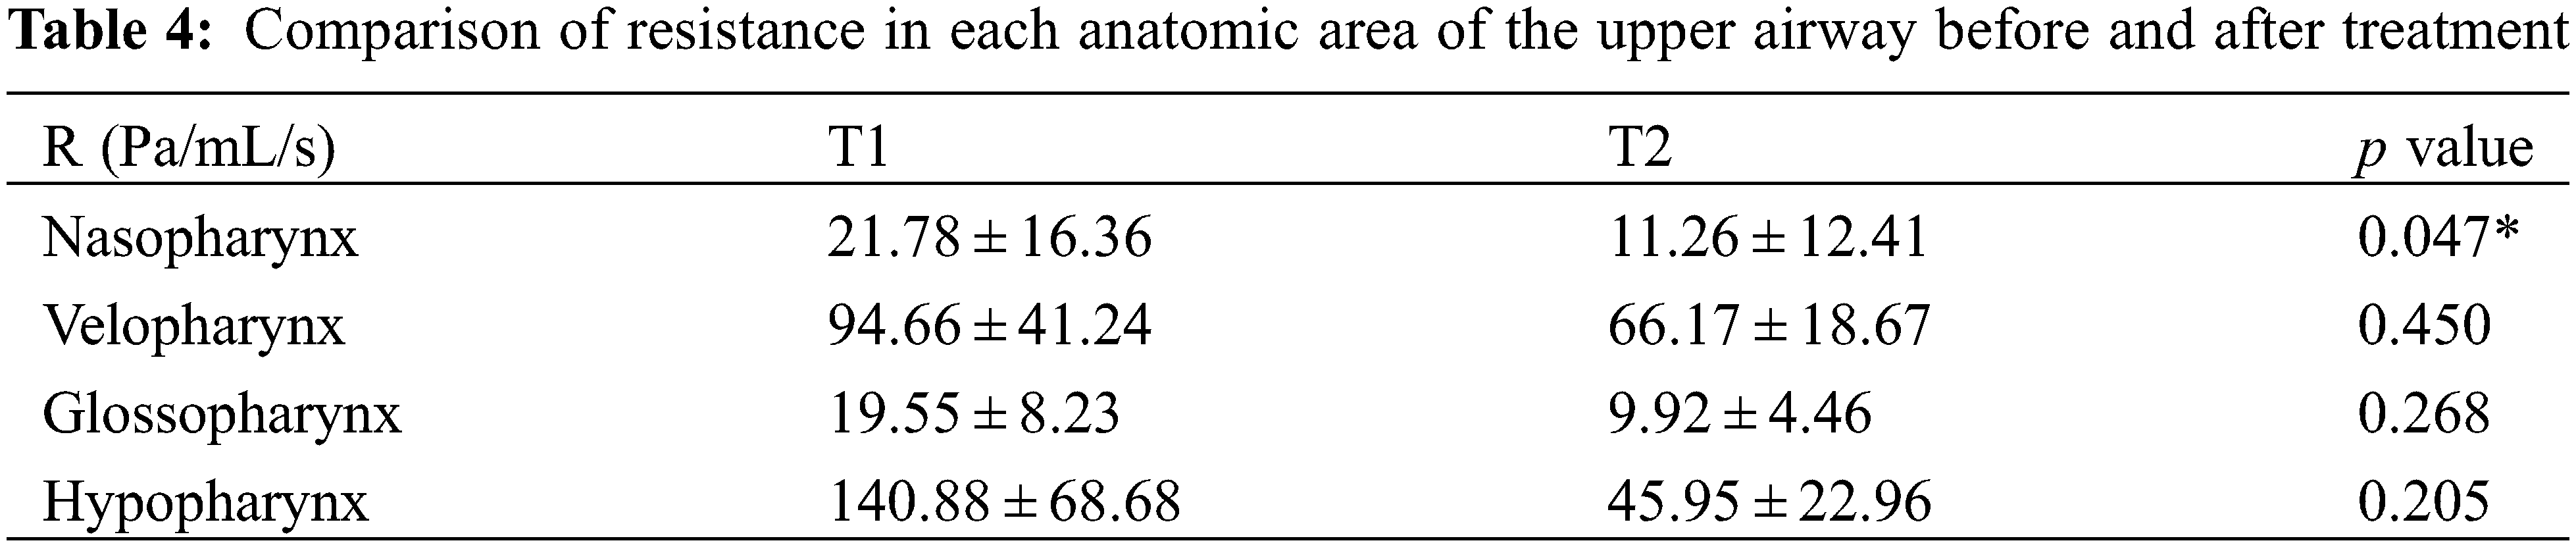
In CFD-POST, a cross section is established every 1 mm along the longitudinal direction of the upper airway. The minimum pressure (Pmin), maximum flow velocity (Vmax), maximum shear force (WSSmax) and respiratory resistance (R, R = ΔP/Q, where ΔP is pressure drop and Q is respiration rate) of nasopharynx, velopharynx, glossopharynx and hypopharynx were measured.
Statistical analysis of all measurement items was performed. The paired T-test was used to analyze the differences between the patients’ measurements before and after treatment. p < 0.05 was considered statistically significant. All measurements were repeated 1 week later by the same researcher, and the measurement error was calculated according to the Dahlberg formula. The errors of pressure, velocity and shear force were 0.872 Pa, 0.043 m/s and 0.037 Pa, respectively. These analyses show that the method error in this study can be ignored.
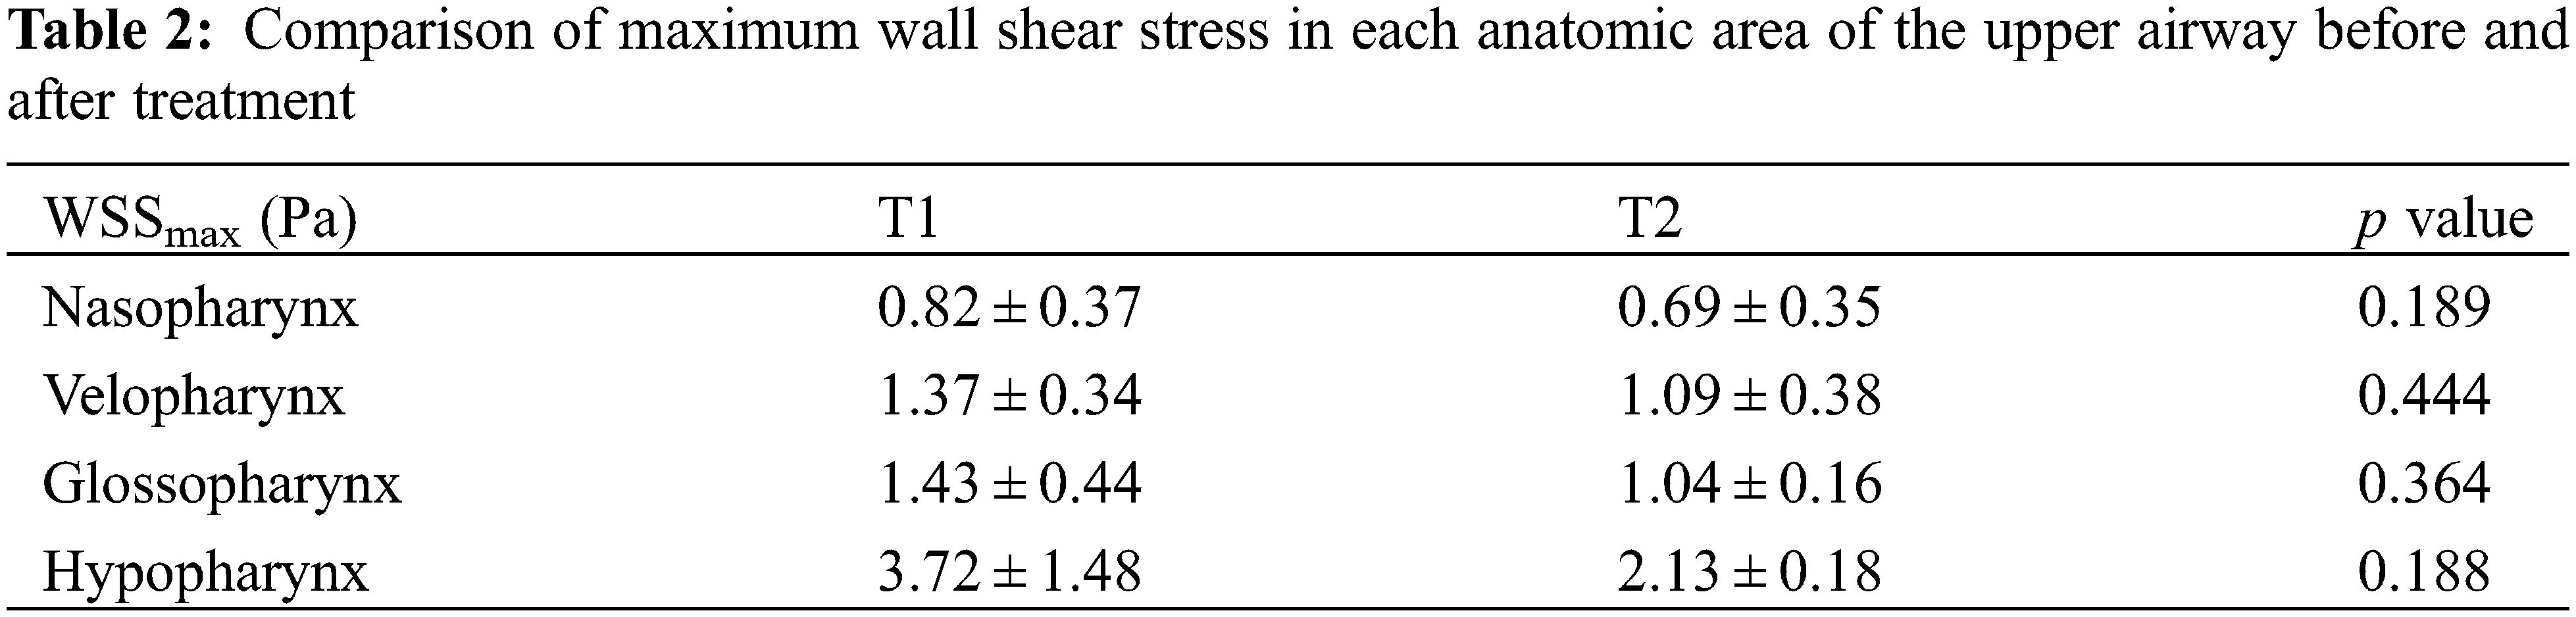
Table 1 compared the maximum inspiratory flow rate of each anatomic site of the upper airway before and after treatment. Compared with that before treatment, the maximum flow velocity of nasopharynx, velopharynx, glossopharynx and hypopharynx after treatment were all smaller, decreasing by 0.24, 0.83, 1.18, 1.43 m/s, respectively, only the change of hypopharynx had significant statistical difference (p < 0.05). In addition, with the increase of flow rate before treatment (Fig. 2), the maximum shear stress of various anatomical parts of upper airway in Class III patients was greater, mainly located in the hypopharynx, especially in the narrow part of the airway, which showed high wall shear stress (Table 2), but only the difference of the glossopharynx was statistically significant (p < 0.05).
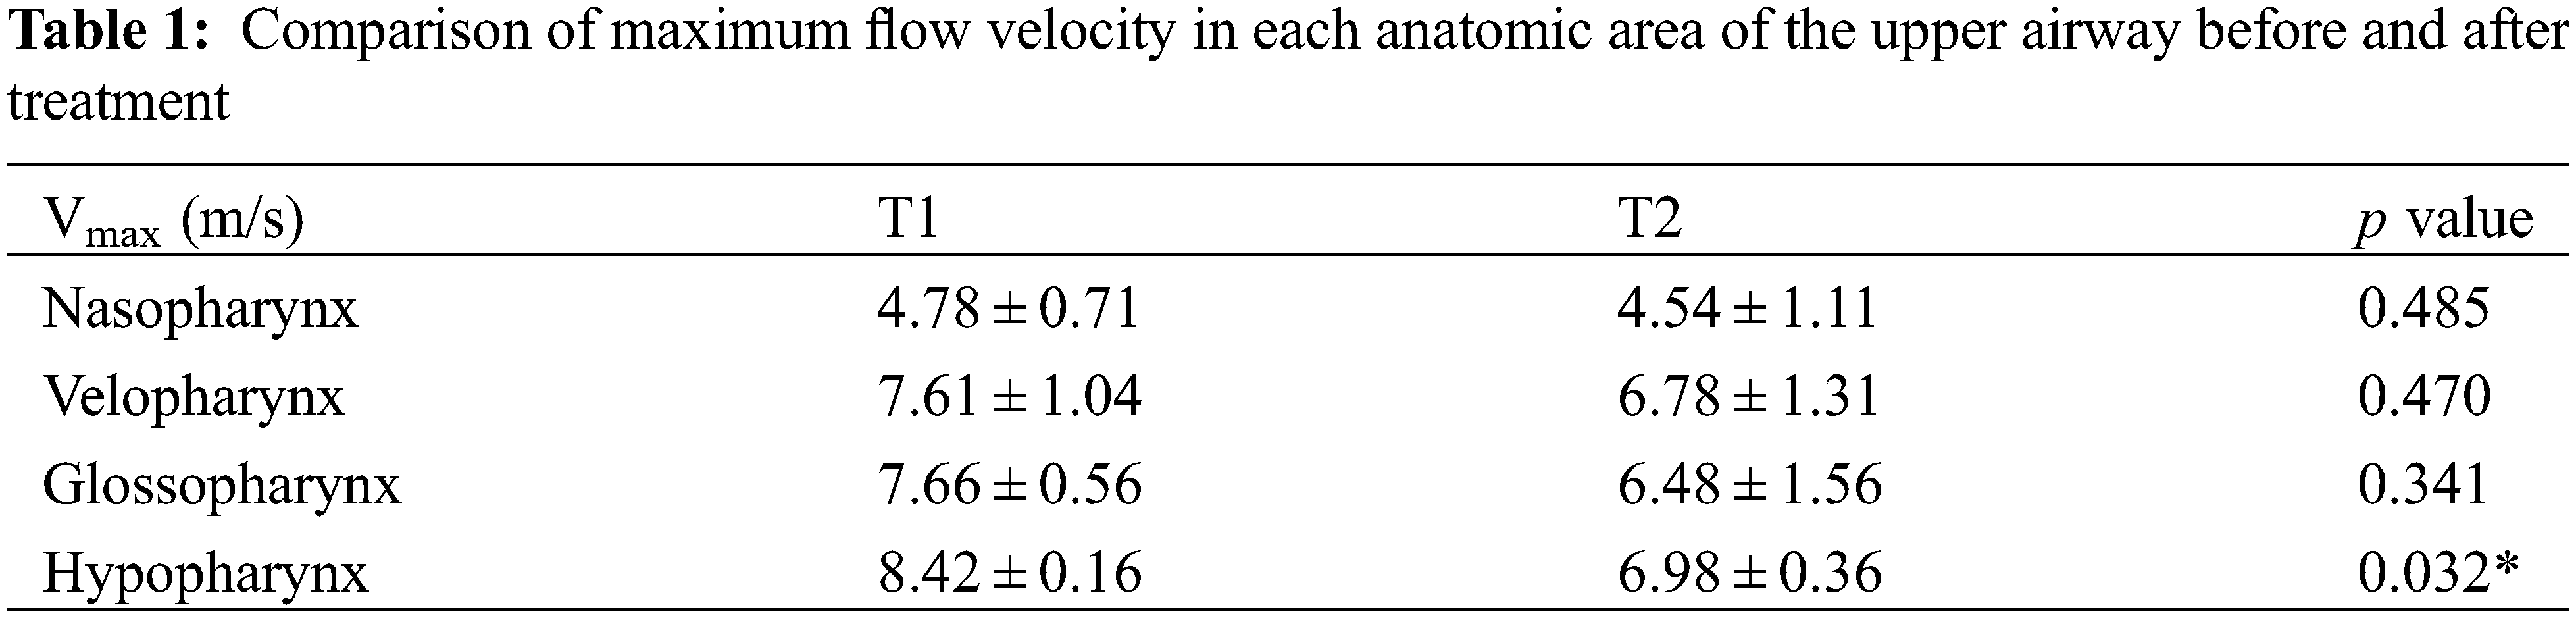
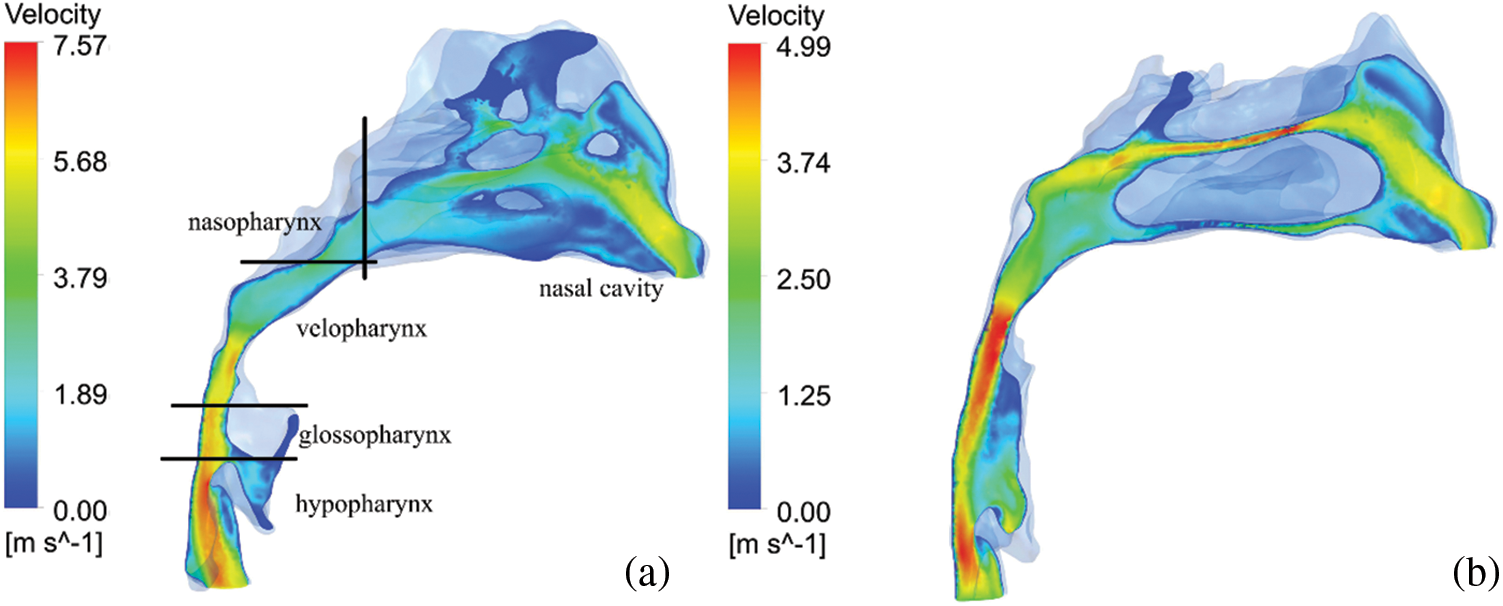
Figure 2: The velocity profile of the airflow. (a) before PE; (b) after PE
As shown in Fig. 3, the pressure distribution of a patient is shown. It can be seen that the maximum negative pressure of each anatomical part has been greatly reduced, especially velopharynx and glossopharynx (Table 3). Respiratory resistance, as one of the indicators to evaluate the ventilation function of the upper airway, was significantly improved after treatment, from 21.78 ± 16.36 Pa/mL/s to 11.26 ± 12.41 Pa/mL/s (Table 4).
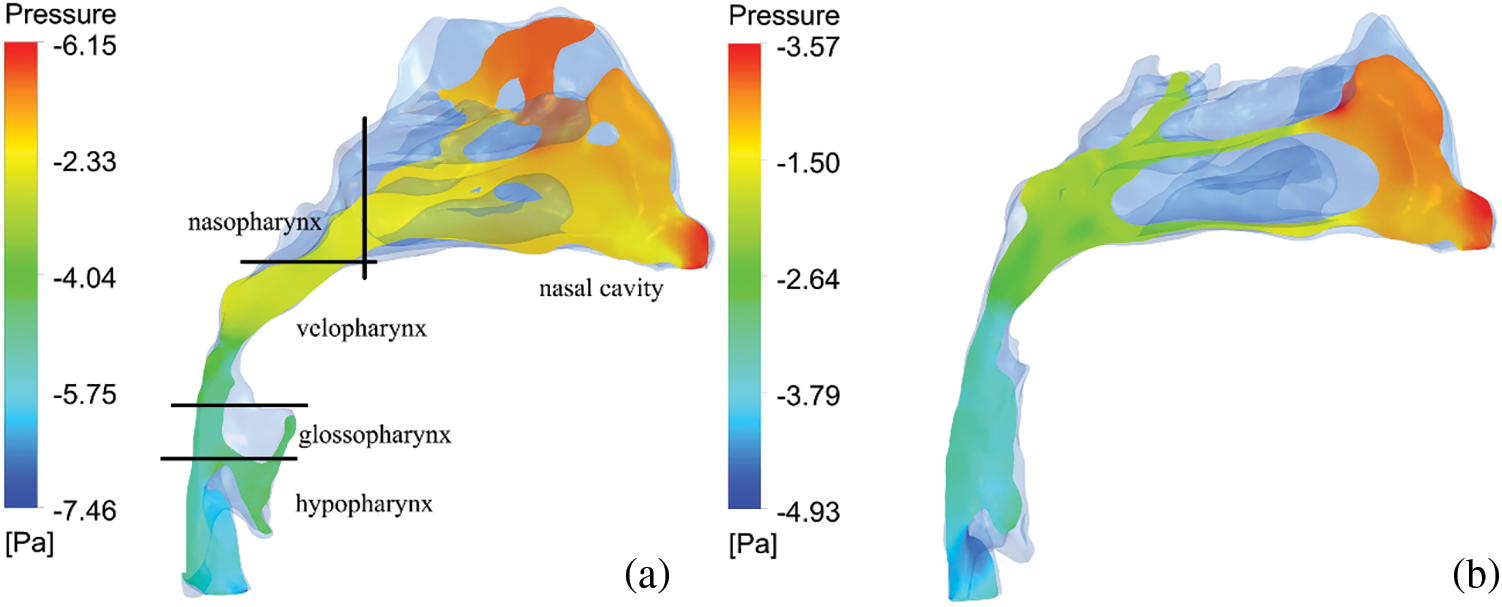
Figure 3: The pressure profile of the airflow. (a) before PE; (b) after PE
Based on previous studies, we have demonstrated the reliability of CFD simulation of the upper airway through in vitro experiments [15]. Therefore, the CFD method was used to evaluate the changes of upper airway function after treatment in growing patients of Class III malocclusion with skeletal deficiency. Previous studies have suggested that in quiet breathing, the time scale of breathing is long enough to consider the flow process of air as a steady state [16]. Hahn et al. [17] measured airflow in five cross sections using a thermal film anemometer in a 20-fold enlarged physical model of the nasal cavity. The results showed that the nasal hair had little effect on airflow in the nasal cavity, and that temperature and humidity had no significant effect on airflow. Thus, in this study, the airflow internal flow in the upper airway was regarded as steady-state, and the effects of nasal hair, temperature and humidity were ignored.
Before PE treatment, the airflow velocity in the upper airway of patients had a relatively drastic change, but after PE, the airflow velocity tended to be flat, and the most obvious change was in the hypopharynx, where the velocity decreased by 17.10%. The flow velocity distribution from nasopharynx to hypopharynx also became more uniform than before. The impact of airflow on the pharyngeal wall was reduced, and the wall shear stress of each anatomical part was also reduced, which had a good protective effect on airway mucosa [18].
The larger negative pressure in the pharyngeal airway during inspiration may cause the airway to collapse. In this study, during the gradual downward process of respiratory airflow from the nasal part to the velopharynx, the cross-sectional area of the airway gradually decreased, the flow velocity gradually increased, and the airflow pressure decreased. When passing through the narrowest area of the lower boundary of the velopharynx, the airflow velocity suddenly increased, and the pressure decreased rapidly, resulting in a sharp increase in pressure drop and increased airway resistance. In particular, the negative pressure near the soft palate and the throat is relatively large, where it is easy to cause the soft palate to move backward and the tongue to fall back, which may lead to the collapse of the pharyngeal airway [4]. After PE treatment, the flow of air through the velopharyngeal position is slowed down and the pressure is reduced slowly. This difference in pressure values is due to the reduction in nasal airway resistance after treatment [9] and increased sagittal diameter of the airway [3].
There are some limitations in this study. First, the interaction between the airflow and the soft tissues surrounding the upper airway was not considered; Second, the collapse of the upper airway occurred during the patient’s sleep, but the CBCT images were currently obtained while awake.
In conclusion, protraction headgear and rapid maxillary expansion can stimulate the development of maxilla, change the pressure distribution and airflow flow in the upper airway, and reduce the probability of airway collapse, thus improving the ventilation function of patients.
Funding Statement: This work was supported by the “Future Project for the Young Scholars of Shandong University” (No. 31380082164048).
Author Contributions: HX contributed to conception, design, data acquisition, analysis, interpretation, and drafted and critically revised the manuscript. SC contributed to conception, analysis and interpretation and critically revised the manuscript. XS contributed to data acquisition and analysis. JW contributed to conception, design, interpretation, and drafted and critically revised the manuscript. All authors reviewed the results and approved the final version of the manuscript.
Availability of Data and Materials: The data used to support the findings of this study are available from the corresponding author upon request.
Conflicts of Interest: The authors declare that they have no conflicts of interest to report regarding the present study.
References
1. Hardy, D. K., Cubas, Y. P., Orellana, M. F. (2012). Prevalence of angle class III malocclusion: A systematic review and meta-analysis. Open Journal of Epidemiology, 2(4), 75–82. https://doi.org/10.4236/ojepi.2012.24012 [Google Scholar] [CrossRef]
2. Vaida, L. L., Moca, A. E., Negrutiu, B. M., Precup, A. L., Bumbu, B. A. et al. (2019). Correction of Class III malocclusions through morphological changes of the maxilla using the protraction face mask by three different therapeutic approaches. Romanian Journal of Morphology and Embryology, 60(2), 605–615. [Google Scholar] [PubMed]
3. Ming, Y., Hu, Y., Li, Y., Yu, J., He, H. et al. (2018). Effects of maxillary protraction appliances on airway dimensions in growing class III maxillary retrognathic patients: A systematic review and meta-analysis. International Journal of Pediatric Otorhinolaryngology, 105, 138–145. https://doi.org/10.1016/j.ijporl.2017.12.013 [Google Scholar] [CrossRef]
4. Suga, H., Iwasaki, T., Mishima, K., Nakano, H., Ueyama, Y. et al. (2021). Evaluation of the effect of oral appliance treatment on upper-airway ventilation conditions in obstructive sleep apnea using computational fluid dynamics. Cranio, 39(3), 209–217. https://doi.org/10.1080/08869634.2019.1596554 [Google Scholar] [CrossRef]
5. Celikoglu, M., Bayram, M., Sekerci, A. E., Buyuk, S. K., Toy, E. (2014). Comparison of pharyngeal airway volume among different vertical skeletal patterns: A cone-beam computed tomography study. Angle Orthod, 84(5), 782–787. https://doi.org/10.2319/101013-748.1 [Google Scholar] [PubMed] [CrossRef]
6. Zimmerman, J. N., Vora, S. R., Pliska, B. T. (2019). Reliability of upper airway assessment using CBCT. European Journal of Orthodontics, 41(1), 101–108. https://doi.org/10.1093/ejo/cjy058 [Google Scholar] [CrossRef]
7. Sujir, N., Desai, A., Ahmed, J., Nambiar, S., Saha, A. (2022). Cone beam computed tomography (CBCT) in the assessment of the airway: A review. Journal of Positive School Psychology, 6(7), 3658–3663. [Google Scholar]
8. Faizal, W. M., Ghazali, N. N. N., Khor, C. Y., Badruddin, I. A., Zainon, M. Z. et al. (2020). Computational fluid dynamics modelling of human upper airway: A review. Computer Methods and Programs in Biomedicine, 196, 105627. https://doi.org/10.1016/j.cmpb.2020.105627 [Google Scholar] [CrossRef]
9. Chen, S., Wang, J., Xi, X., Zhao, Y., Liu, H. et al. (2021). Rapid maxillary expansion has a beneficial effect on the ventilation in children with nasal septal deviation: A computational fluid dynamics study. Front Pediatr, 9, 718735. https://doi.org/10.3389/fped.2021.718735 [Google Scholar] [PubMed] [CrossRef]
10. Feng, X., Chen, Y., Hellen-Halme, K., Cai, W., Shi, X. (2021). The effect of rapid maxillary expansion on the upper airway’s aerodynamic characteristics. BMC Oral Health, 21(1), 123. https://doi.org/10.1186/s12903-021-01488-1 [Google Scholar] [CrossRef]
11. Yanagisawa-Minami, A., Sugiyama, T., Iwasaki, T., Yamasaki, Y. (2020). Primary site identification in children with obstructive sleep apnea by computational fluid dynamics analysis of the upper airway. Journal of Clinical Sleep Medicine, 16(3), 431–439. [Google Scholar] [PubMed]
12. Ghosh, R. P., Bianchi, M., Marom, G., Rotman, O. M., Kovarovic, B. et al. (2019). Patient-specific computational approach for trans catheter aortic valve replacement (TAVRPre-procedural planning for enhancing performance and clinical outcomes. Molecular & Cellular Biomechanics, 16(Suppl.2), 12–14. https://doi.org/10.32604/mcb.2019.07379 [Google Scholar] [CrossRef]
13. Rana, S. S., Kharbanda, O. P., Agarwal, B. (2020). Influence of tongue volume, oral cavity volume and their ratio on upper airway: A cone beam computed tomography study. Journal of Oral Biology and Craniofacial Research, 10(2), 110–117. [Google Scholar]
14. Iwasaki, T., Takemoto, Y., Inada, E., Sato, H., Suga, H. et al. (2014). The effect of rapid maxillary expansion on pharyngeal airway pressure during inspiration evaluated using computational fluid dynamics. International Journal of Pediatric Otorhinolaryngology, 78(8), 1258–1264. [Google Scholar] [PubMed]
15. Chen, S., Wang, J., Liu, D., Lei, L., Wu, W. et al. (2021). Open oral cavity has little effects on upper airway aerodynamics in children with obstructive sleep apnea syndrome: A computational fluid dynamics study based on patient-specific models. Journal of Biomechanics, 121, 110383. [Google Scholar]
16. Bates, A. J., Doorly, D. J., Cetto, R., Calmet, H., Gambaruto, A. M. et al. (2015). Dynamics of airflow in a short inhalation. Journal of the Royal Society Interface, 12(102), 20140880. [Google Scholar]
17. Hahn, I., Scherer, P. W., Mozell, M. M. (1993). Velocity profiles measured for airflow through a large-scale model of the human nasal cavity. Journal of Applied Physiology, 75(5), 2273–2287. [Google Scholar]
18. Stéphano, J., Mauroy, B. (2021). Wall shear stress distribution in a compliant airway tree. Physics of Fluids, 33(3), 031907. [Google Scholar]
Cite This Article
 Copyright © 2023 The Author(s). Published by Tech Science Press.
This work is licensed under a Creative Commons Attribution 4.0 International License , which permits unrestricted use, distribution, and reproduction in any medium, provided the original work is properly cited.
 Downloads
 Citation Tools