
 Open Access
ARTICLE

Can PAPE-Induced Increases in Jump Height Be Explained by Jumping Kinematics?
1 Faculty of Sports Science, Ningbo University, Ningbo, 315211, China
2 Centre for Health and Exercise Science Research, Hong Kong Baptist University, Kowloon Tong, Hong Kong, China
3 Department of Radiology, Ningbo No. 2 Hospital, Ningbo, 315010, China
* Corresponding Author: Yaodong Gu. Email:
Molecular & Cellular Biomechanics 2023, 20(2), 67-79. https://doi.org/10.32604/mcb.2023.042910
Received 16 June 2023; Accepted 22 August 2023; Issue published 01 November 2023
 View Full Text
 Download PDF
Abstract
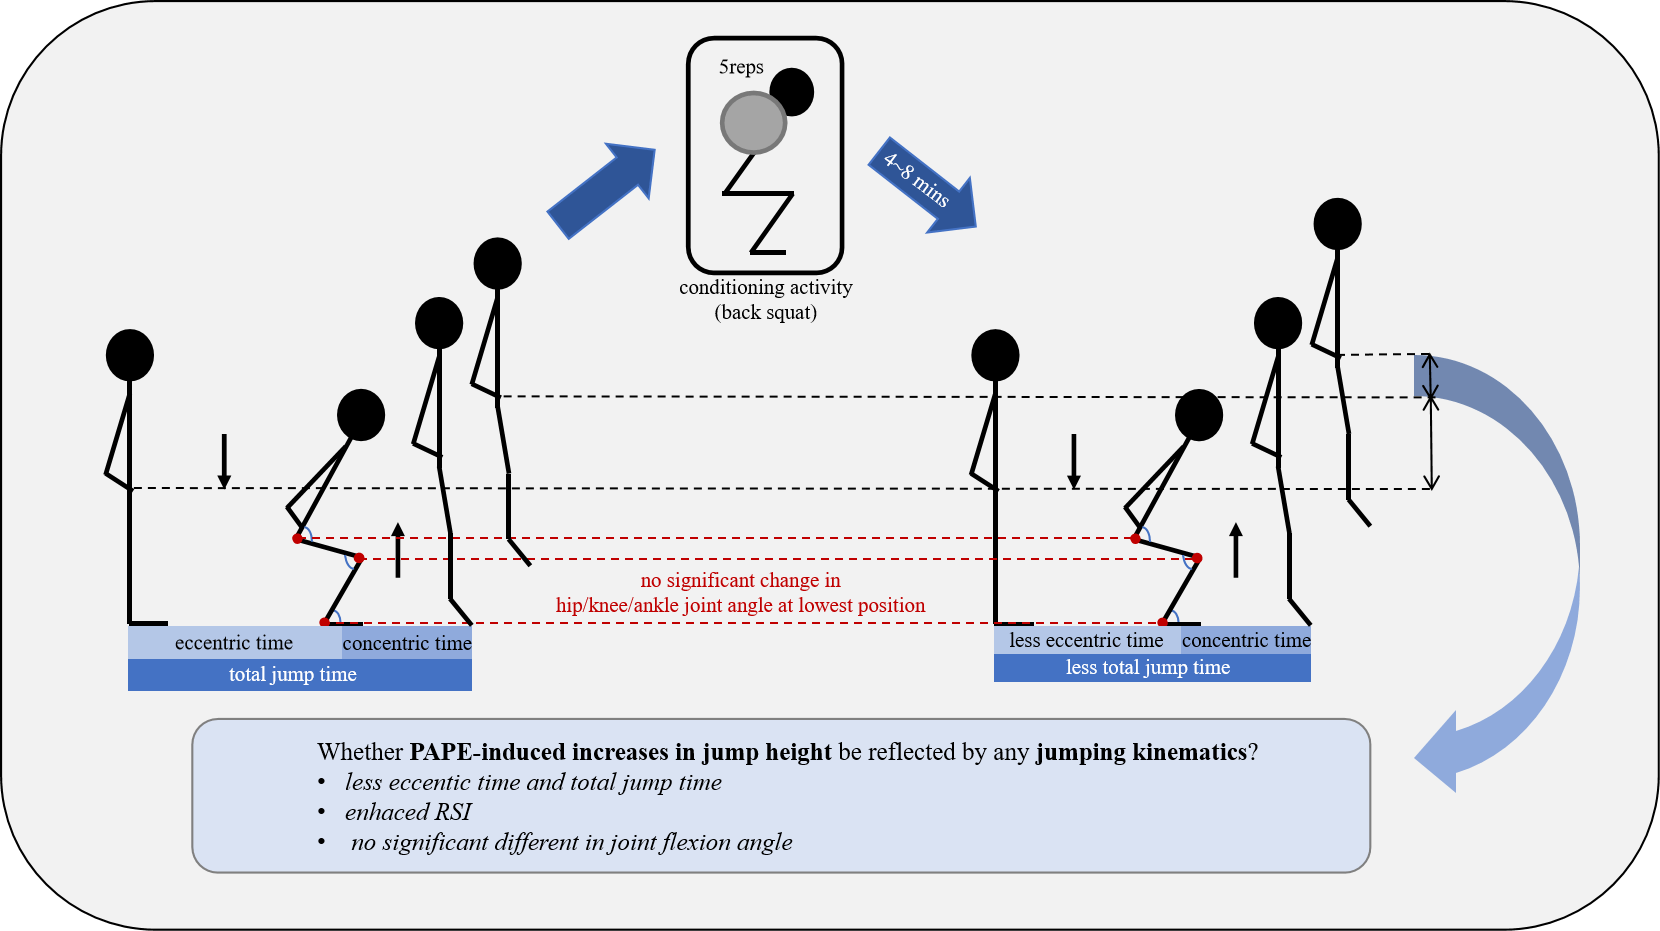
The aim of this study was to investigate whether kinematic data during a countermovement jump (CMJ) could explain the post-activation performance enhancement (PAPE) effects following acute resistance exercise. Twenty-four male participants with resistance training and jumping experience were recruited and randomly assigned to either the experimental group (PAPE-stimulus) (n = 12) or the control group (n = 12). In the experimental group, participants performed 5 reps of squats at 80% 1RM to induce PAPE, while the control group received no intervention. Both groups performed three CMJ tests before (PRE) and at immediate (POST0), 4 (POST4), 8 (POST8), and 12 (POST12) min after the intervention, with kinematic data recorded during the CMJ. Kinematic parameters analyzed in this study included jump height, hip-knee-ankle flexion angles at the lowest position of the countermovement, eccentric and concentric time durations, and the temporal changes of hip-knee-ankle flexion angles during the entire jumping phase. The presence of PAPE was determined by the change in jump height. The results showed that in the experimental group, jump height significantly increased at POST4 (p < 0.001) and POST8 (p < 0.001) and significantly decreased at POST0 (p = 0.008), with no significant change at POST12. The control group showed no significant changes at any measured time point. Kinematic parameters showed that there was no significant difference in joint flexion angle of the lower body during the CMJ between pre- and post-intervention, regardless of PAPE or fatigue. However, eccentric time significantly decreased at 4 and 8 min (p = 0.013 and p = 0.001, respectively) after the intervention. These findings suggest that PAPE-induced increases in jump height after acute resistance exercise can be attributed to the decrease in eccentric phase duration, but not joint flexion angle. Additionally, the fatigue-induced decrease in jump height cannot be reflected by jumping kinematics. Based on these findings, coaches may use complex training to utilize the PAPE effects to increase jump height while reducing the eccentric time during vertical jumps. This method can enhance an athlete’s eccentric ability to generate force in a short amount of time which is crucial for performance enhancement.
Graphic Abstract
Keywords
Evaluation of neuromuscular parameters holds great significance for both athletes and coaches [1], as it allows them to track the training adaptations. Athletes often perform various tests to monitor these adaptations, with one commonly utilized indicator being the vertical jumping height, which provides insights into the mechanical power generated by the leg extensor muscles [2]. The CMJ (Countermovement Jump) test proves to be a highly convenient assessment method. It can not only evaluate athletes’ explosive power [3] but also identify signs of neuromuscular fatigue [4,5]. Due to its simplicity and effectiveness, the CMJ has become widely employed in research studies and serves as a valuable tool for monitoring training adaptations [5–8]. Previous studies [9–12] have delved into the kinematics of jumping and explored the impact of knee flexion angle on CMJ outcomes. These studies have consistently found an interesting relationship: during the eccentric phase of the countermovement jump, an increase in the degree of the lower limb joint flexion (an increase in the countermovement magnitude) is associated with a corresponding improvement in jumping height.
It is well known that the contractile history of a muscle has two opposing effects on muscular force output: post-activation potentiation (PAP) and fatigue. PAP is a physiological phenomenon characterized by an acute increase in muscular twitch force after previous contractile activity [13]. Whether prior muscle contraction stimulation can enhance subsequent athletic performance depends on the “potential difference” between PAP and fatigue effects. Only when PAP is higher than fatigue, will the muscle contraction traces significantly improve subsequent athletic performance [13]. It is worth noting that in recent literature, a new concept called “PAPE” has been introduced to distinguish it from “PAP” [14,15]. The term “PAP” traditionally refers to the improvement of electrically evoked twitch force, while more recently the term “post-activation performance enhancement” (PAPE) has been used to denote the increase in human voluntary movement performance, such as maximal strength, power and speed resulting from voluntary contractions. The primary distinction between these two terms lies in their emphasis: “PAP” focuses on mechanistic aspects (e.g., twitch peak force), while “PAPE” is more centered on performance-related aspects (e.g., jump height) [15]. To maintain consistency and accuracy in terminology, this article will use “PAPE” instead of the traditional term “PAP”. The effects of fatigue and PAPE induced by acute resistance exercise can significantly impact the performance of the CMJ [16,17]. If CMJ testing is conducted immediately after resistance exercise, CMJ performance may decrease due to fatigue. However, after a period of recovery, CMJ performance may improve due to the PAPE induced by resistance exercise effects.
Most of previous studies have explored PAPE phenomenon using either maximal voluntary contractions [17] or sub-maximum or longer exercises [18,19]. These different approaches have shown the potential to induce PAPE for subsequent activities. However, despite the abundance of researches, a consensus regarding the optimal conditioning activity protocol or the factors that may influence the relationship between PAPE and conditioning activity has yet to be reached [19]. These factors include the types of contractions utilized, the duration and intensity of the exercises performed, and the length of the recovery period. Furthermore, the training status and experience of athletes are also crucial factors influencing the effectiveness of PAPE. Research has indicated that high-level athletes or those with better strength levels tend to exhibit more pronounced PAPE effects [19].
Likewise, the mechanism behind PAPE remains incompletely understood [19]. Tillin et al. [20] have proposed three potential mechanisms to explain PAP: the increased recruitment of higher-order motor units, the phosphorylation of myosin-regulatory light chains, and the changes in muscle fiber pennation angle. While these explanations concerning PAP partially account for PAPE, other mechanisms, such as changes in muscle temperature, increases in muscle force and/or shortening velocity triggered by fluid shifts into the working muscles, also play a significant role in PAPE [14]. However, these mechanism are yet to be defined. Investigating the biomechanical changes in CMJ resulting from PAPE phenomenon might offer valuable insights into the mechanism underlying muscle potentiation after acute resistance exercise.
Currently, there exists a dearth of clear information about the mechanism, especially from a kinematic perspective, accountable for the PAPE phenomenon after acute resistance exercise. In a previous study [21], it was found that following a dynamic resistance warm-up, jump height was enhanced, and there was a reduction in the angles of the hip and knee joints at the lowest point of eccentric phase, indicating an increase in flexion angles during the jump. However, in 2016, Garcia-Pinillos et al. [22] induced PAPE in endurance runners by using the Léger Test (an incremental running test) and tried to observe changes in their vertical jumping kinematics prior to and following PAPE, but the results showed no changes. We speculate that the insignificant findings could be attributed to the fact that (1) the movement type between the methods used to induce PAPE (an exhausting running test) and CMJ were not closely related, and (2) the participants were endurance runners who may not be familiar with jumping patterns. Therefore, this study addresses these two issues and aims to determine whether kinematic data during CMJ might explain the PAPE phenomenon of acute resistance exercise (back squats). The hypothesis of the study is that any enhancements observed in CMJ performance could be manifested by an increase in joint flexion angle at the nadir of the eccentric phase and a reduction in the duration of the eccentric phase.
We used GPower 3.1 (Franz Faul, Germany) to calculate the sample size required for the repeated measures ANOVA. The effect size was set at 0.25 based on previous studies. The alpha level was set at 0.05, and the statistical power was set at 0.80. The measurement occasions were 5. Using these parameters, the total sample size required for the study was calculated to be 22 participants. To ensure sufficient statistical power, we decided to recruit 24 participants.
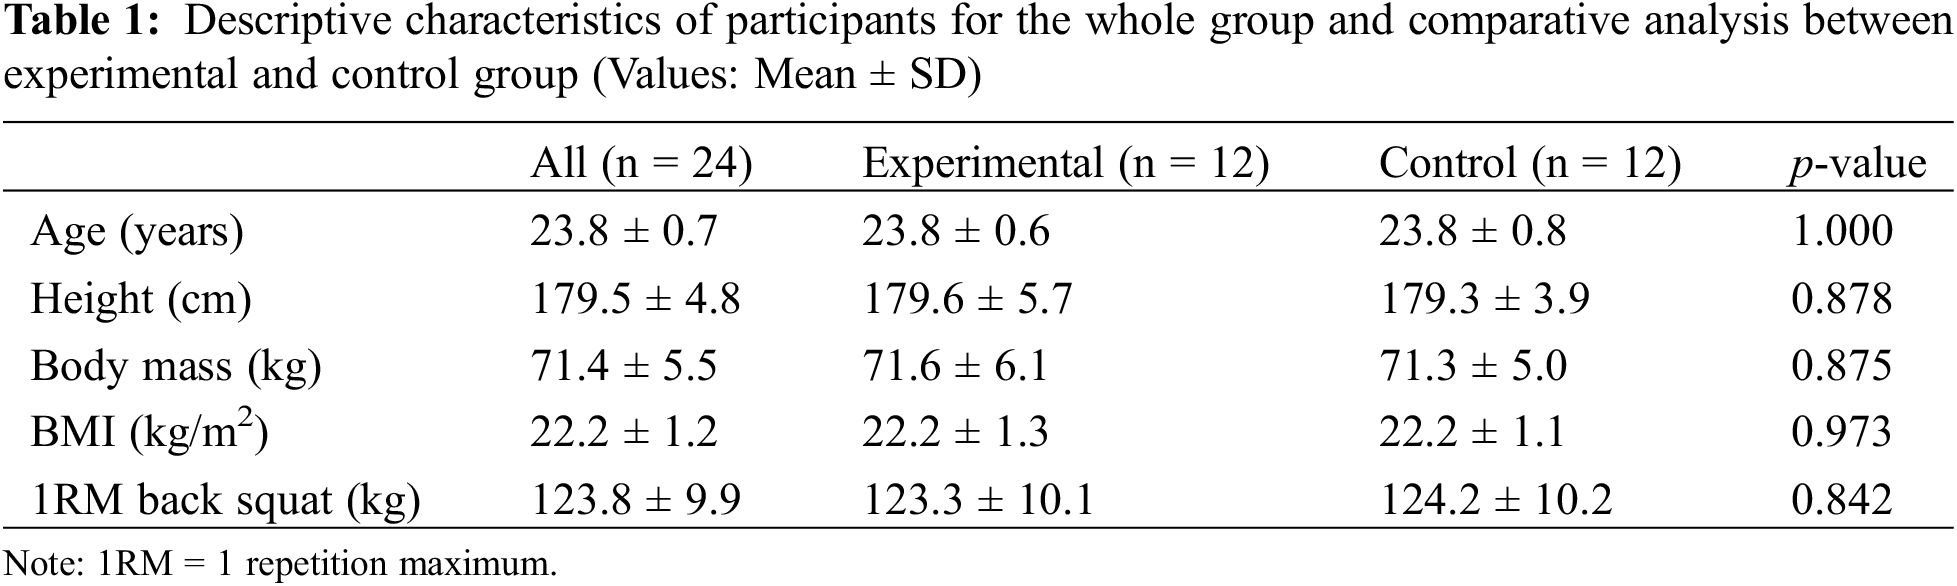
Twenty-four male participants (age: 23.8 ± 0.7 years, height: 179.5 ± 4.8 cm, body mass: 71.4 ± 5.5 kg, BMI: 22.2 ± 1.2 kg/m2, 1RM back squat: 123.8 ± 9.9 kg) voluntarily enrolled in this study. All participants were students from the College of Physical Education at Ningbo University. All had at least 2 years of resistance training experience (including a jump training background). All subjects also had a 1RM back squat weight ranging from 1.5 to 2 times their body weight and all were familiar with jumping patterns. All participants reported no musculoskeletal injury history in the past year prior to data collection. The participants were randomly assigned to the experimental (PAPE stimulus condition) or the control group. There were no significant differences in age (p = 1.000), height (p = 0.878), body mass (p = 0.875), BMI (p = 0.973), and 1RM back squat (p = 0.842). Detailed data are presented in Table 1. Before participating in the study, participants were informed of potential risks and were asked to avoid vigorous exercise within 24 h before testing, to refrain from consuming caffeine and alcohol, and to avoid eating within 2 h before testing. All participants read and signed informed consent forms outlining in detail experimental conditions. The study was approved by the Ethics Committee of Ningbo University.
Prior to the main experimental trials, all subjects visited the laboratory to determine their 1RM squat and familiarize themselves with the testing protocols. The protocol for the 1RM squat test follows the procedures outlined in Essentials of Strength Training and Conditioning, 4th edition [23]. A familiarization session was conducted for each participant to ensure proper execution of the CMJ (without arm-swing) technique. These sessions aimed to mitigate any potential influence of learned knowledge.
Following the familiarization and 1RM strength testing period, all subjects underwent formal tests. The formal tests were conducted 48 h after the familiarization and strength trial. Height and body mass measurements were taken for each subject before they proceeded with a standardized warm-up routine. The warm-up included 5 min of light-intensity jogging and a series of dynamic stretches that specifically targeted the muscles involved in the squat and CMJ movements. A 10-min rest period followed the warm-up. In the experimental group, participants performed a conditioning (PAPE-stimulus), which consisted of a single set of 5 reps of half-squats at 80% 1RM. The participants were given instructions to squat down until their thighs were parallel to the ground and then rise explosively. The duration of the conditioning was approximately 25 s. The CMJ tests were performed before the conditioning (PRE), at immediate (PAPE0), at 4 min (PAPE4), at 8 min (PAPE8), and at 12 min (PAPE12) after the conditioning stimulus, respectively. At each time point, the participants underwent 3 CMJ tests, with a 5-s interval between each test. For the control group, the same protocol was followed, and CMJ tests were performed at the same time points (CONT0, CONT4, CONT8, and CONT12). The only distinction was that during the “conditioning period”, participants in the control group engaged in passive rest for 25 s (Fig. 1).
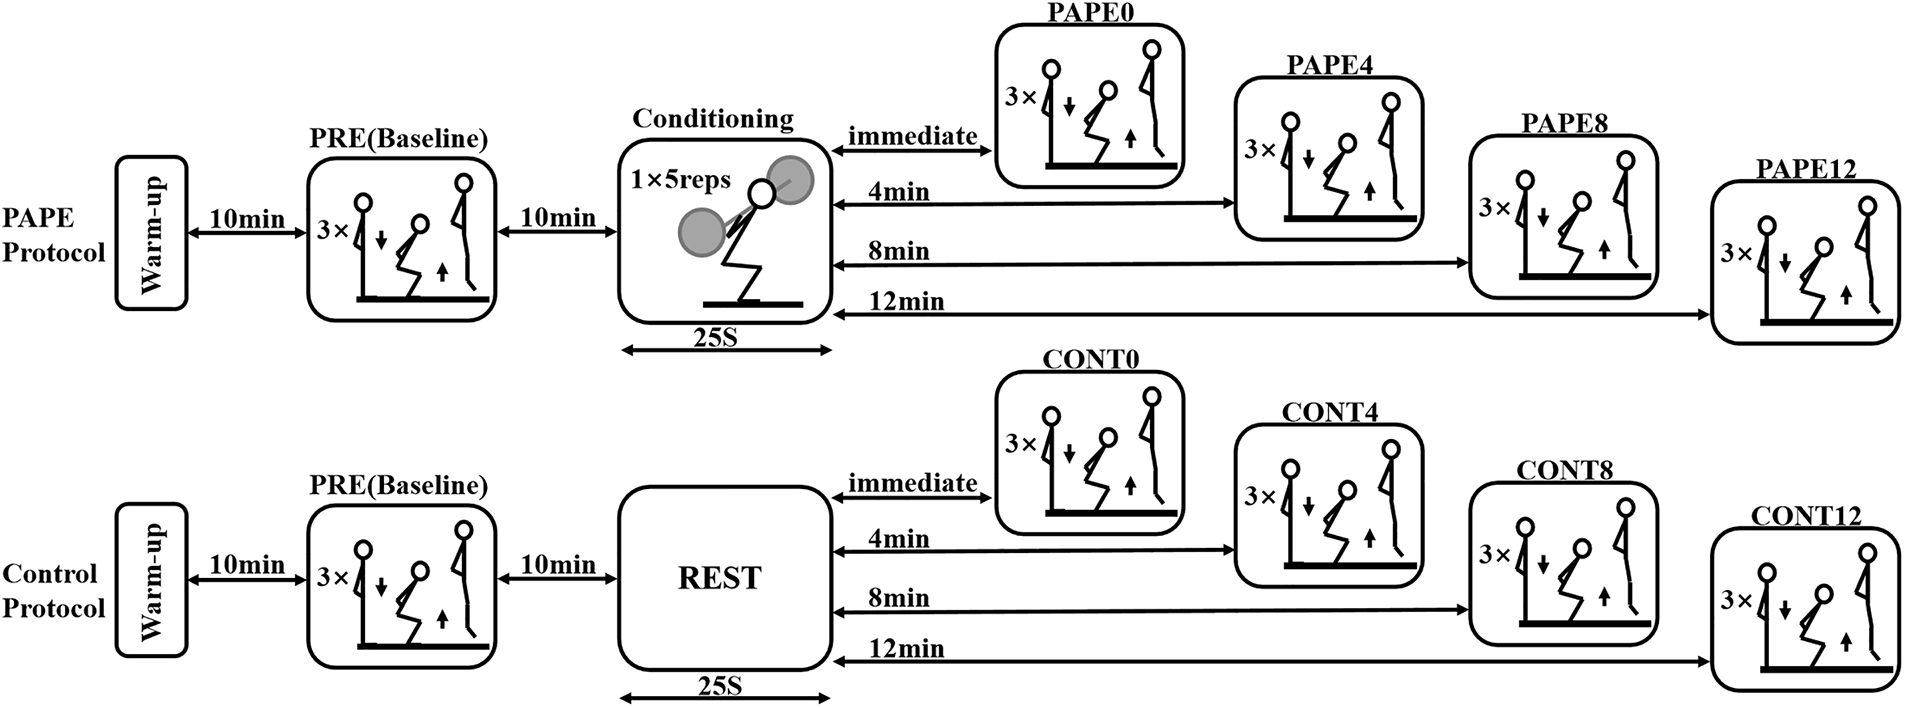
Figure 1: Schematic diagram of experimental procedure for experimental (PAPE) and control group. Bidirectional arrows indicate time intervals
2.3 Data Collection and Analysis
In each CMJ measurement, from a standing position (shod, in a balanced position with feet width placed shoulder width apart and toes slightly turned outwards), the participants were instructed to countermove quickly and immediately jump for maximal height; arms swing was not allowed and controlled. The depth of the countermovement was self-selected by each participant.
Each CMJ was recorded using the Xsens MTw Awinda motion capture system (Xsens Technologies B.V., the Netherlands) with a 60 frame/s recording speed. Seven inertial sensors were placed on the participants’ lower limbs (pelvic, upper leg (R), upper leg (L), lower leg (R), lower leg (L), foot (R), foot (L)) to obtain kinematic parameters during the CMJ. Only the right leg was analysed in this study. The CMJ with the highest jump height was selected for subsequent analysis.
The dependent variables selected for the jumping kinematic were: (1) the degree of the hip, knee, and ankle flexion at the lowest position of the countermovement (the lowest body’s center of mass displacement), (2) the duration of the eccentric and concentric phases (tecc and tconc) of the jump, and (3) the temporal changes of hip, knee, and ankle flexion angles during the entire jumping phase. All the aforementioned data can be directly obtained using the Xsens motion capture system.
For jump height, we indirectly calculated height by measuring the velocity of the center of mass at the instant of takeoff. As indicated by Linthorne [24], the relationship between flight height and takeoff velocity is as follows:
where
Descriptive statistics of variables obtained are presented as mean ± standard deviation. Prior to analysis, normality assumption was tested using the Shapiro-Wilk test, and the homogeneity of variance assumption was examined using Levene’s test. Independent samples t-tests were conducted to compare the characteristics of participants between the experimental and control groups. Repeated measures ANOVA (for pairwise comparison the LSD test was applied) was used to assess the effects of PAPE on CMJ performance and jumping kinematics. Effect sizes using partial eta2 (ηp2) were also calculated. The scale of classification of ηp2 was < 0.04 = trivial, 0.041 to 0.249 = small, 0.25 to 0.549 = medium, 0.55 to 0.799 = large, and > 0.8 = very large [25]. The level of significance was accepted as p < 0.05. Statistical analyses were conducted using IBM SPSS Statistics (version 27, SPSS AG, Zurich, Switzerland). Additionally, one-dimensional statistical parametric mapping (SPM1D) paired sample t-test was used to compare changes in joint flexion angle during the entire jumping phase, and it was performed using Python 3.9.5 (Python Software Foundation, Wilmington, DE, USA), Scipy 1.6.2 (Scipy.org), Numpy 1.20.2 (Numpy.org), and Matplotlib 3.3.3 (Matplotlib.org) with a significant level of 5%.
The presence of PAPE or fatigue was determined by changes in CMJ height at four-time points. A significant increase in jump height compared to baseline was considered a successful induction of PAPE, while a significant decrease in jump height was considered fatigue. If jump height did not significantly change, it was considered that no effects (PAPE or fatigue) were induced. The CMJ performed with PAPE or fatigue effect was used to further analyse its kinematic parameters.
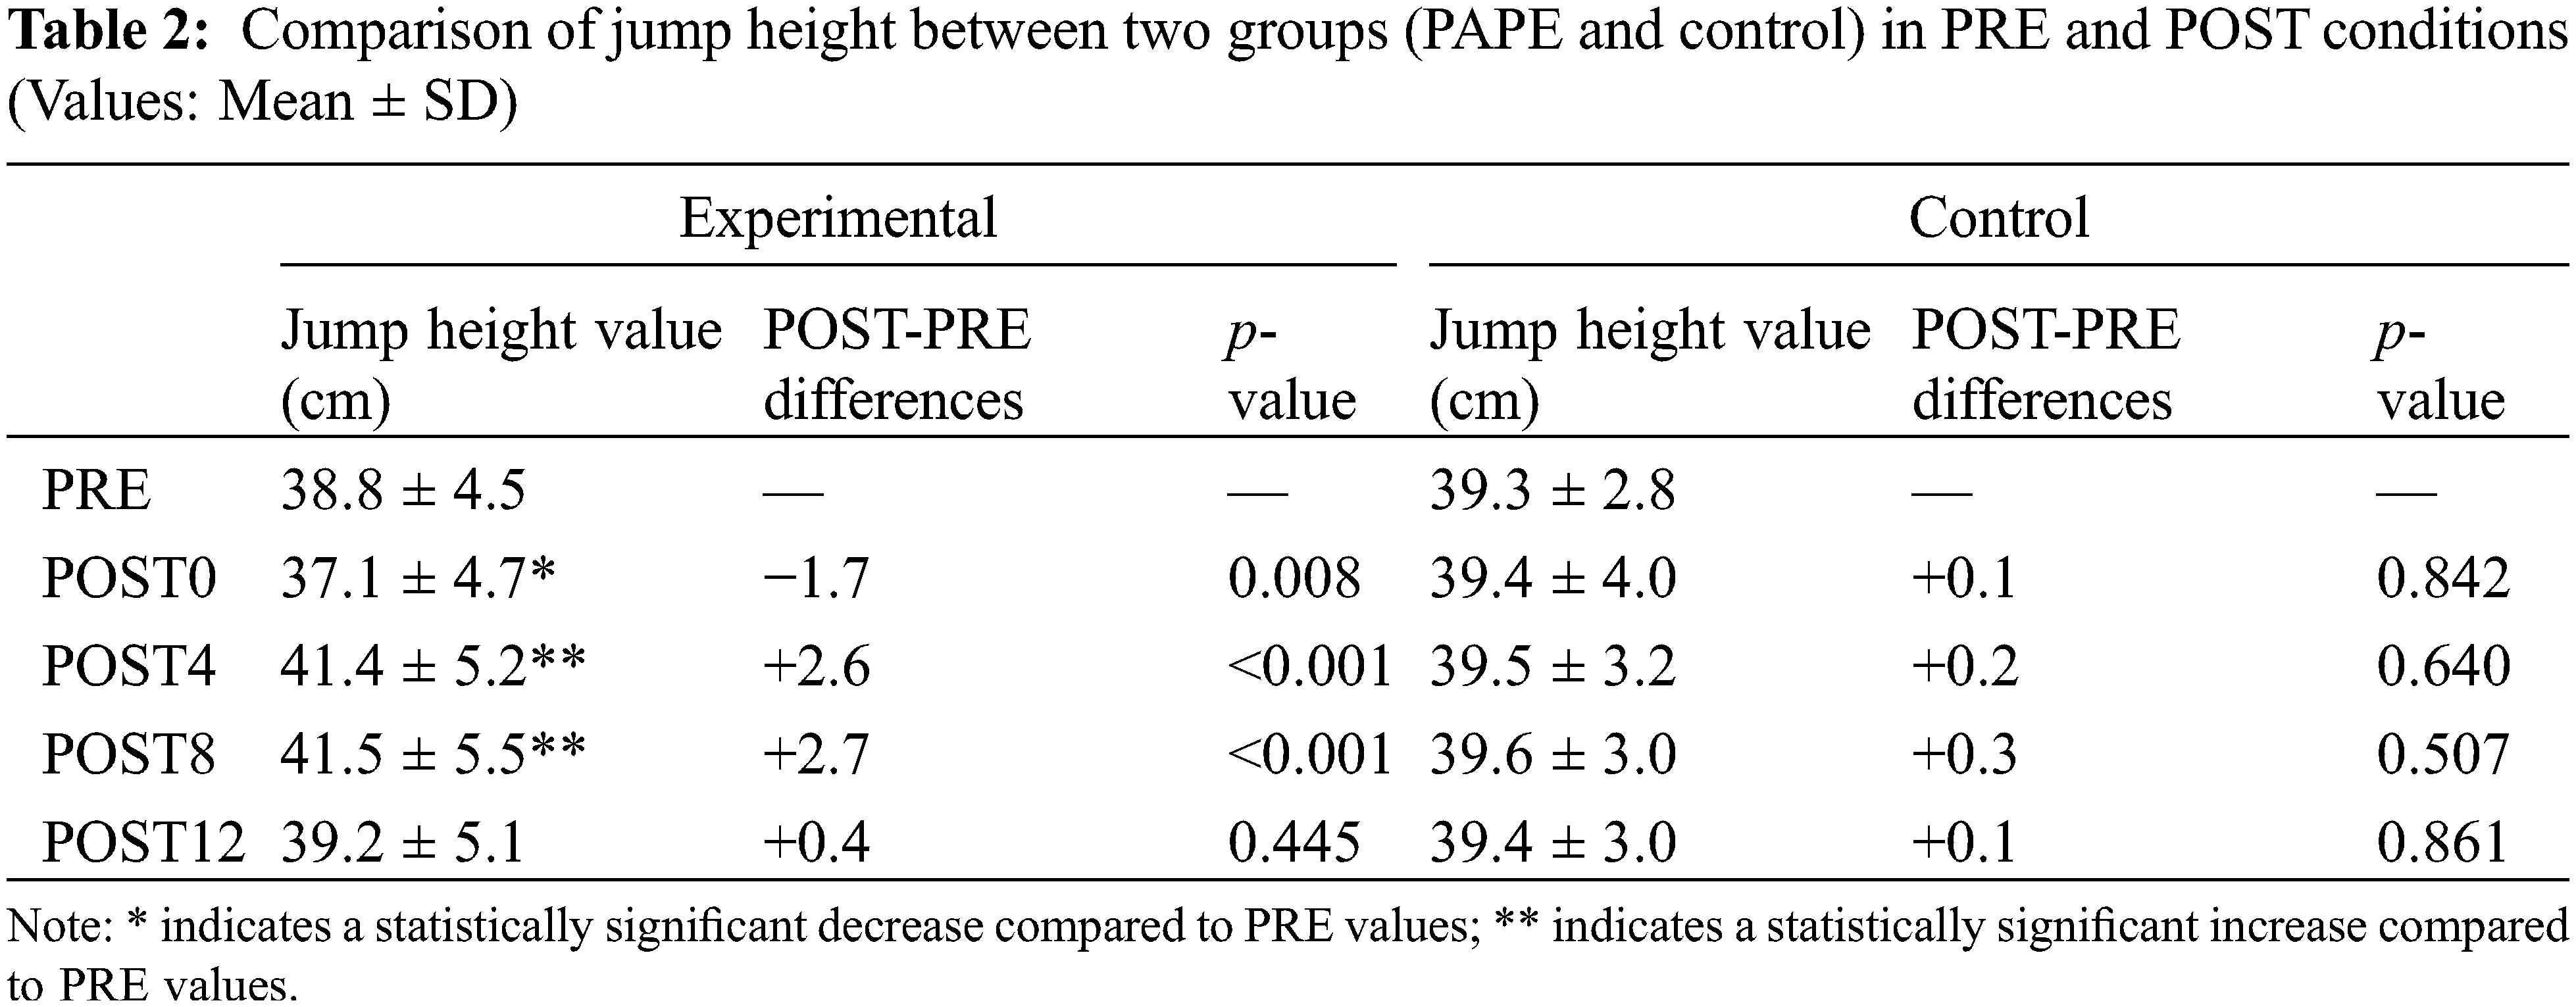
Repeated-measures ANOVA revealed a significant protocol * time interaction on CMJ height (F = 10.859, p < 0.001, ηp2 = 0.330). The difference in jump height obtained between the two groups during the PRE was not statistically significant (p = 0.756). PRE-POST comparisons revealed a significant effect of PAPE stimulus on jump height. A significant decrease in jump height was found in the CMJ that was performed immediately after the PAPE stimulus (38.8 ± 4.5 cm vs. 37.1 ± 4.7 cm, p = 0.008). Following 4 and 8 min of recovery, there were significant increases in jump height compared with the baseline CMJ (38.8 ± 4.5 cm vs. 41.4 ± 5.2, p < 0.001 and 38.8 ± 4.5 cm vs. 41.5 ± 5.5, p < 0.001, respectively). There was no significant change in jump height following 12 min of recovery compared to the baseline CMJ (p = 0.445). In addition, the increases in performance at the 4- and 8-min time points were not significantly different (p = 0.732). However, compared to the baseline, none of the jump heights at four-time points was significantly different in the control group. No significant differences were revealed between POST0, POST4, POST8, and POST12 in the control group. A more detailed and intuitive depiction of the changes in height can be observed in Table 2.
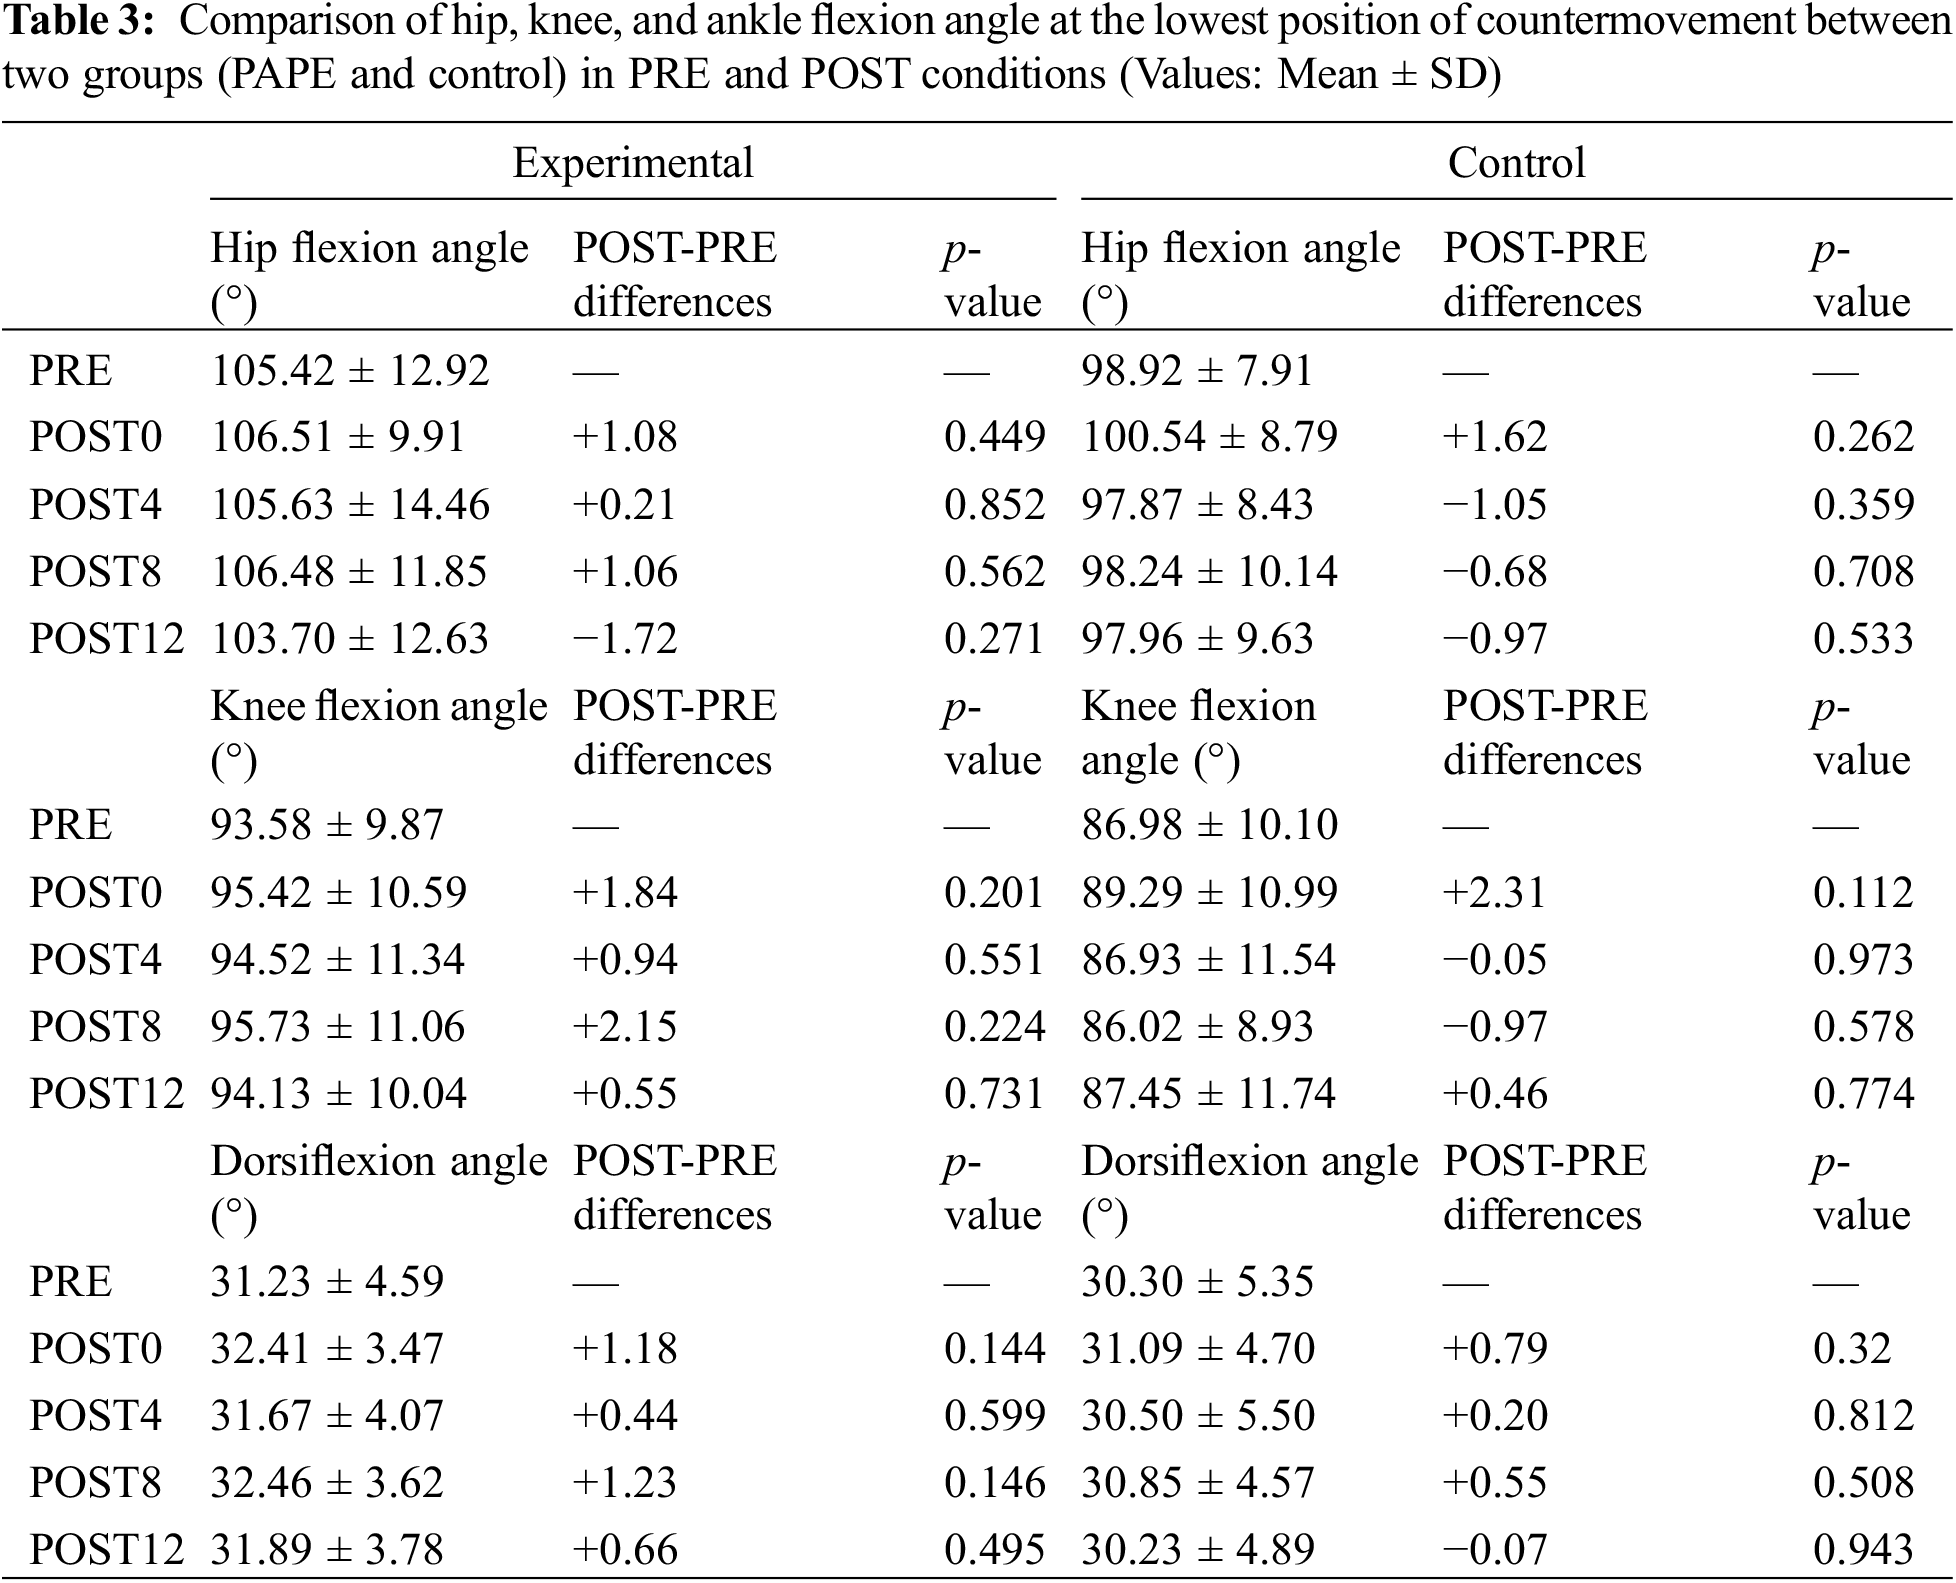
3.2 Joint Flexion Angle (at the Lowest Position of Countermovement)
A comparative analysis of variables related to the degree of hip, knee, and ankle flexion at the lowest position of the countermovement before and after the PAP stimulus (PRE-POST) is shown in Table 3. For the within-group comparison, neither the experimental group nor the control group showed significant changes in the post-test at a 4-time point according to pre-test values (p > 0.05). No significant differences were revealed between POST0, POST4, POST8, and POST12 in the experimental group or control group.
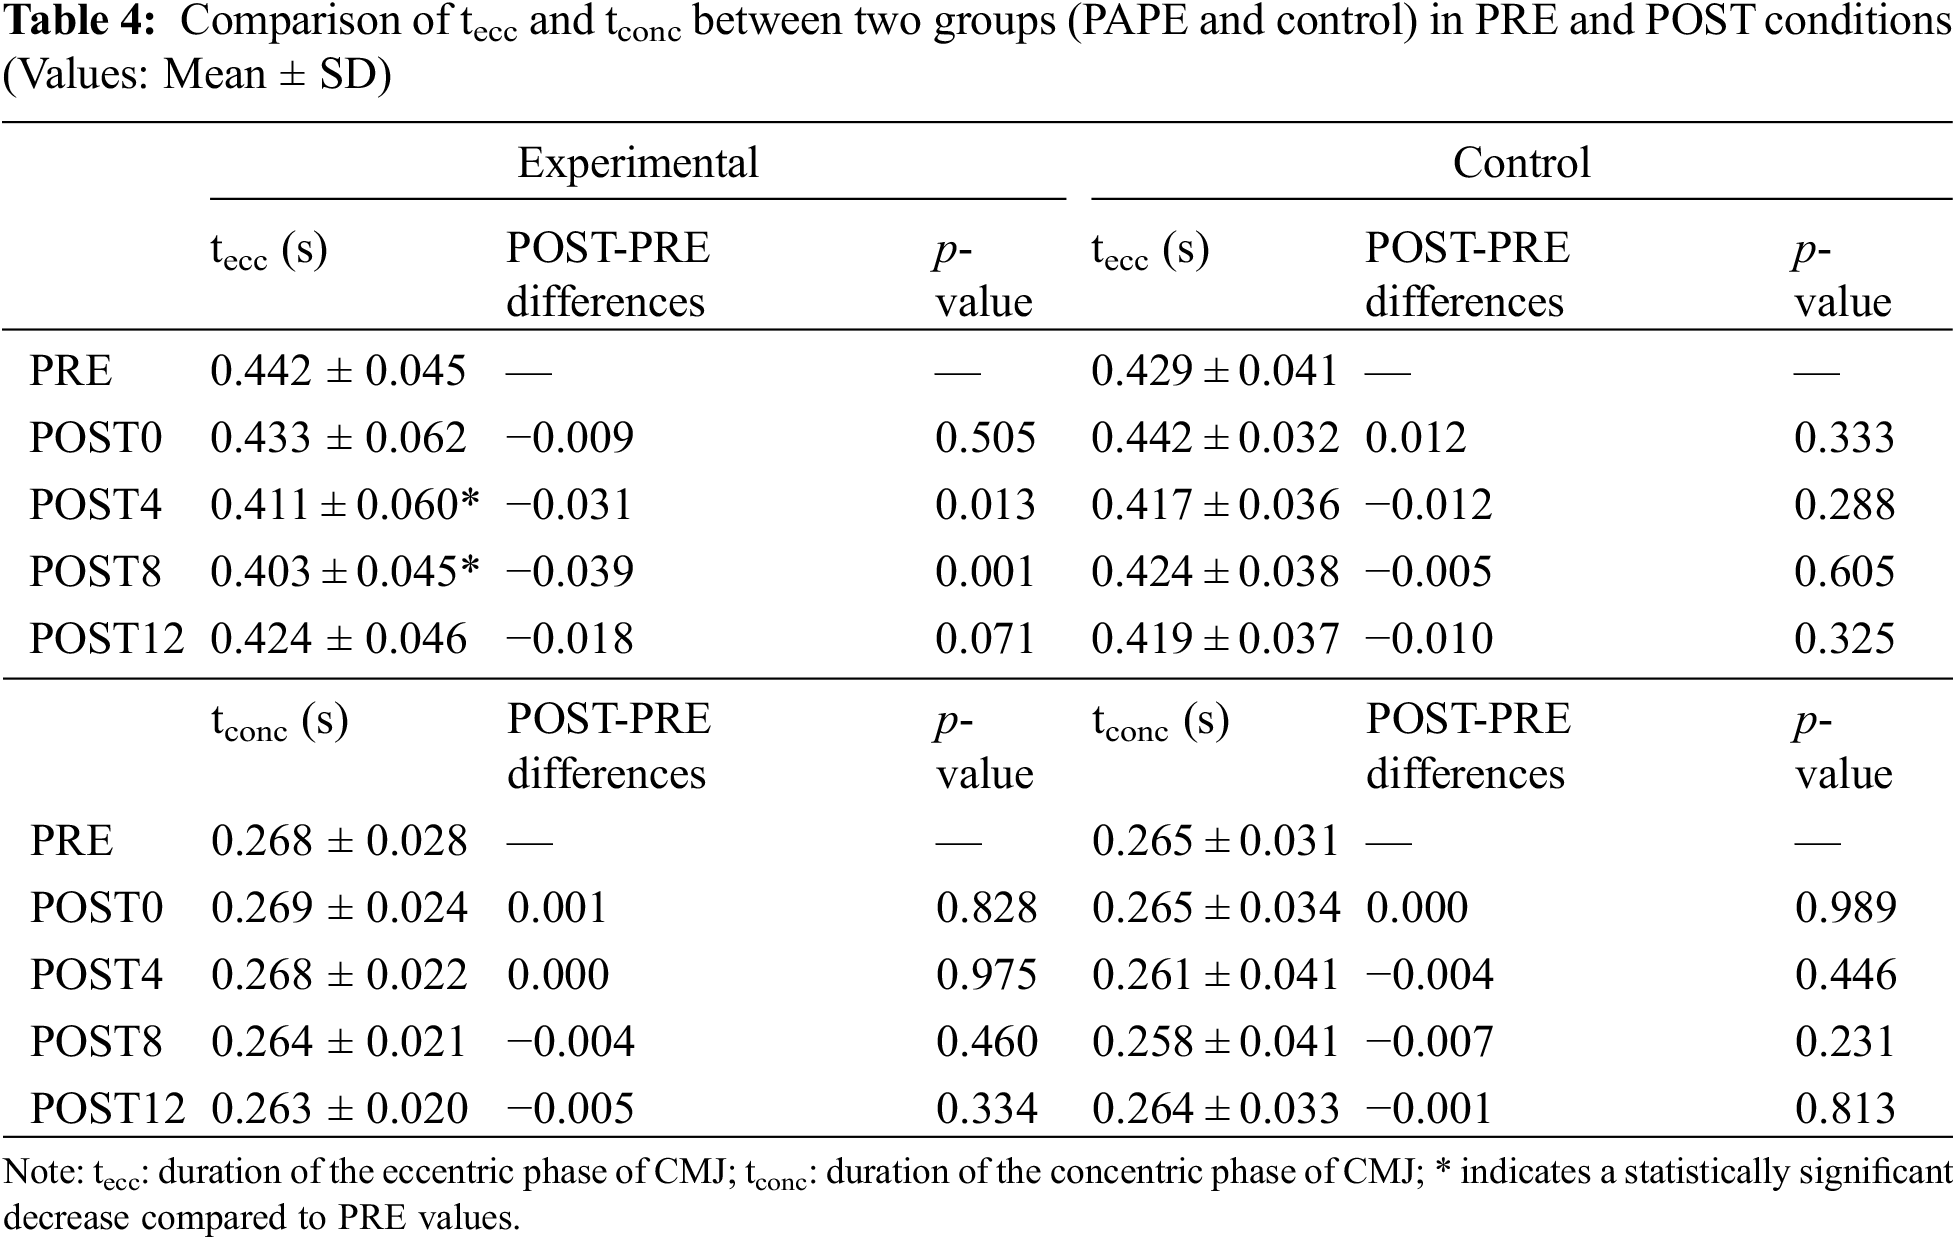
3.3 Duration of Eccentric (tecc) and Concentric (tconc) Phase
A comparative analysis of variables related to the duration of the eccentric (tecc) and concentric (tconc) phase of CMJ before and after PAPE stimulus (PRE-POST) is presented in Table 4. There exists a significant protocol * time effect on eccentric time (F = 4.786, p = 0.002, ηp2 = 0.279). In the experimental group, there was a significant reduction in tecc for both the POST4 and POST8 tests compared to the PRE values (p = 0.013 and p = 0.001, respectively). However, the decreases in tecc at the 4- and 8-min time points were not significantly different (p = 0.416). Moreover, there were no significant changes in tconc for any of the four-time points compared to the PRE values. In the control group, there were no significant changes in either tecc or tconc at any of the four-time points compared to the PRE values.
3.4 The Temporal Changes of Joint Flexion Angles during the Entire Jumping Phase
For this variable, we selected the time points in the experimental group with significant differences in jump height compared to PRE (i.e., POST0, POST4, and POST8) for pairwise comparisons with PRE. The comparison results are shown in Fig. 2. Results of SPM1D paired-sample t-tests showed that, except for the hip flexion angle at the POST4 exceeding the threshold during 95%~99% of the entire jump phase (α = 0.05, t* = 4.569) and showing a significant difference (p = 0.039), there were no significant differences in the trends of hip, knee and ankle angle changes compared to PRE at other time points.
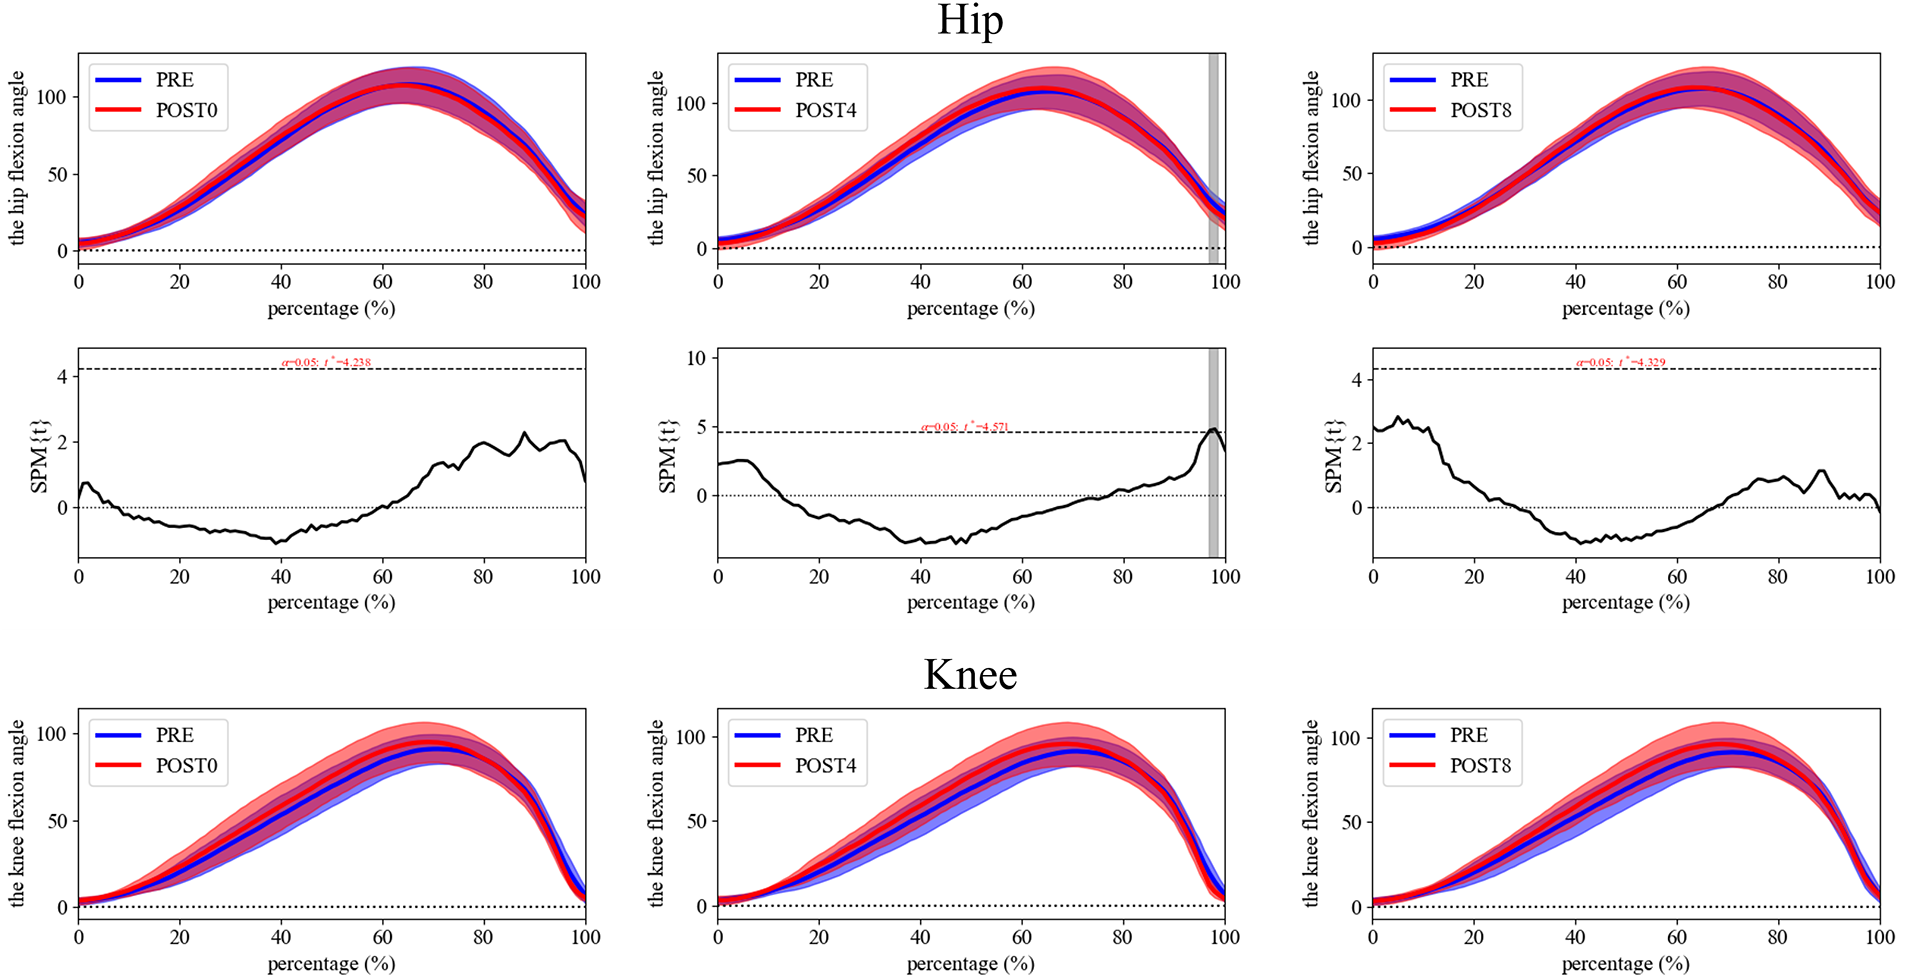
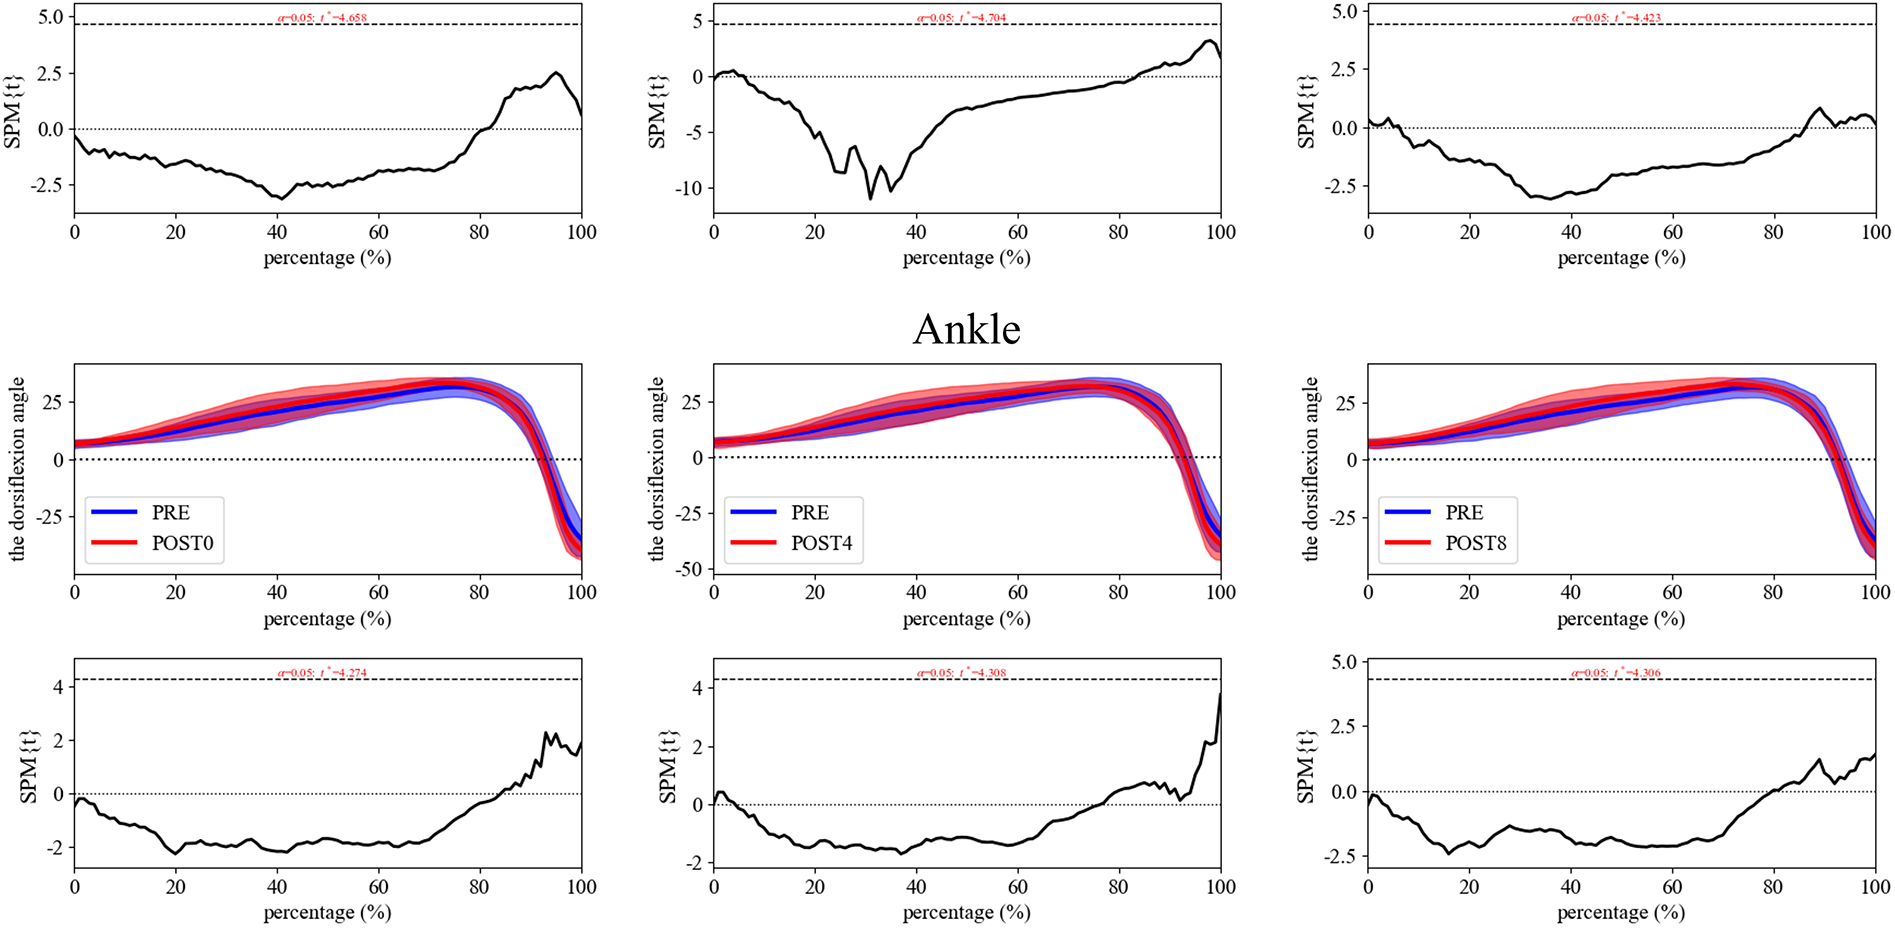
Figure 2: The SPM1D paired sample t-test for the variation of hip, knee, and ankle flexion angles throughout the entire jumping phase across different time points (PRE-POST0/POST4/POST8)
This study aimed to investigate whether kinematic data obtained during the countermovement jump (CMJ) could elucidate the post-activation performance enhancement (PAPE) phenomenon following acute resistance exercise. The results showed that: (1) there were no significant changes in the joint flexion angles of the lower body at the lowest point of the eccentric phase during the CMJ, regardless of the presence of PAPE or fatigue; (2) compared to the pre-intervention state, no significant differences were observed in the temporal changes of the joint flexion angles of lower extremities during the entire jumping phase, regardless of whether the subject was in a PAPE or fatigue state; (3) the eccentric time of the CMJ was significantly shortened when PAPE occurred. These results suggest that improvements noted in CMJ performance, i.e., the PAPE phenomenon, are reflected in a decrease of the duration of the eccentric phase (tecc), rather than the joint flexion angle or the duration of the concentric phase (tconc). Moreover, acute resistance exercise-induced fatigue that led to decreased CMJ performance did not affect jumping kinematics (neither joint flexion angles nor tecc and tconc).
The CMJ is a fundamental skill required in numerous sports. Prior research has established a positive correlation between lower body strength and power measures and CMJ performance [26,27]. CMJ tests are frequently used to evaluate both the acute impacts of neuromuscular workouts and the effectiveness of lower body power training protocols. Several previous studies have reported on PAPE in vertical jumps after conducting conditioning activities with external resistance [16,17]. However, none of them have examined jumping kinematics and their potential association with the acute improvement of jumping performance.
Few studies have examined the relative contributions of lower limb joints (hip, knee, and ankle) to the CMJ performance, but there are discrepancies among the findings of these studies. Hubley et al. [28] employed a work-energy analysis to assess the contribution of muscles crossing the hip, knee, and ankle joints during CMJ. The results indicate that the ankle and hip muscles contributed on average 23% and 28%, respectively, while the remaining 49% was done by muscles at the knee joint. However, Fukashiro et al. [29] examined joint moment and mechanical power flow of the lower limb during the vertical jump and found that the greatest contributor was the hip joint. More recently, one study [30] suggested that the kinematic and dynamic parameters of the knee and ankle joints might explain CMJ performance variation. The magnitude of countermovement has also been associated with CMJ performance, with the knee flexion angle during the eccentric phase being an important variable that influences its outcome. Numerous studies [9–12] have found that increasing the knee joint angle during the eccentric phase can lead to an improvement in jump height. Similarly, the greater the range of motion in ankle dorsiflexion, the better the performance in CMJ [31,32]. As mentioned earlier, no differences were found in the aforementioned variables related to CMJ performance between POST4/POST8 (when PAPE was present) and PRE. Therefore, the increase in CMJ height induced by PAPE cannot be explained by changes in joint flexion angle during the eccentric phase. This also suggests that an individual’s jumping technique does not change whether the PAPE effect exists or not.
Regarding the variable of jump time, we observed a significant decrease in eccentric time during CMJ when PAPE was present (POST4/POST8). As is well known that the reactive strength index (RSI) is calculated by dividing the height jumped by the jump time (the time from start to takeoff) [33]. Due to the decrease in eccentric time, the total jump time was reduced, and with the increase in jump height, those resulted in an increase in RSI after PAPE. RSI describes an individual’s ability to change quickly from an eccentric to concentric muscular contraction and is also interpreted as an indicator of the ability of the athletes to withstand stretch or eccentric loads [33]. In simple terms, a higher RSI indicates that the athlete has a greater ability to absorb force during the eccentric phase of the jump, which is crucial for optimal performance. Previous studies have also reported an increase in eccentric capacity among athletes following a short-term specific training protocol [34–36]. Those, to some extent, support the findings of our study. The statement above indicates that the PAPE-induced increase in CMJ height may be due to, from a kinematic perspective, a decrease in eccentric time.
Moreover, in this study, we also examined the changes in jumping kinematics under fatigue. Although it might be expected that the decrease in CMJ performance was reflected in jumping kinematics, the results were no different. The results obtained support some prior findings. According to Rodacki et al. [37], the fatigue of the knee flexor muscles does not have a significant impact on the kinematic or kinetic variables at any joint level, whether it is during the eccentric or concentric phases of movement. Similarly, Pereira et al. [38] found that fatigue does not alter segment contributions and segmental synergies, even though there may be a decrease in jumping height. We speculated that Fatigue can lead to a reorganization of movement structure, meaning that athletes may exhibit a new coordination pattern under fatigue. The fatigue-induced state may cause the subjects to adopt a nonoptimal and nonspecific coordination solution. In other words, the neural input used in the fatigued condition did not constitute an optimal solution and likely contributed to a decrease in maximal jump height [37]. Besides, under fatigue, the peak force and peak power during the CMJ decrease, indicating a reduced ability of the muscles to generate force [39]. This decrease in force-generating capacity is also a contributing factor to the decline in CMJ height.
Although this study revealed certain changes in kinematic parameters of CMJ before and after PAPE, there are still some limitations to consider. Firstly, the PAPE effect is influenced significantly by individual factors, and the participants in this study were not professional athletes. Secondly, we need to consider the potential placebo effect among participants in the experimental group, as they were not completely blinded to the purpose of the experiment pre-conditioning back squat stimulus. So, it is essential to approach the findings of this study with a balanced perspective.
This study outlines that kinematic data related to joint flexion angle during CMJ do not explain the PAPE phenomenon after acute resistance exercise, but eccentric time does. Specifically, the PAPE-induced increase in jump height can be attributed to the decrease in the duration of the eccentric phase. Additionally, the fatigue-induced decrease in jump height after acute resistance exercise cannot be reflected by the jumping kinematics. From a practical standpoint, this study helps to understand how PAPE or fatigue following acute resistance exercise affects certain kinematic parameters associated with CMJ performance. For strength and conditioning coaches, complex training (a training method that combines strength exercises with plyometric exercises in a single training session) can be used to leverage the PAPE effect by controlling rest periods within 4 to 8 min to increase jump height while reducing the eccentric time during vertical jumps. This can improve athletes’ Reactive Strength Index (RSI) and enhance their ability to generate force in a short amount of time, which is crucial for performance in basketball rebounding, blocking, spiking, and other similar movements used in different sports.
Acknowledgement: None.
Funding Statement: This study was sponsored by Zhejiang Province Science Fund for Distinguished Young Scholars (Grant Number: LR22A020002), Zhejiang Key Research and Development Program (Grant Number: 2021C03130), Ningbo Key Research and Development Program (Grant Number: 20222Z196), Ningbo Natural Science Foundation (Grant Numbers: 2022J065, 2022J120) and K. C. Wong Magna Fund in Ningbo University.
Author Contributions: X.J. and Y.X. conceptualized the study, developed the methodology, and drafted the manuscript. X.L., S.D., J.S.B., and Y.G. provided valuable insights and critical feedback, contributing to the refinement of the final manuscript. All authors actively participated in shaping the overall direction of the paper and contributed significantly to the final version.
Availability of Data and Materials: The data pertaining to the present study are accessible upon request, allowing interested parties to obtain the relevant information for further examination.
Conflicts of Interest: The authors declare that they have no conflicts of interest to report regarding the present study.
References
1. Cormie, P., McGuigan, M. R., Newton, R. U. (2011). Developing maximal neuromuscular power: Part 1–Biological basis of maximal power production. Sports Medicine, 41(1), 17–38. [Google Scholar] [PubMed]
2. Vuorimaa, T., Hakkinen, K., Vahasoyrinki, P., Rusko, H. (1996). Comparison of three maximal anaerobic running test protocols in marathon runners, middle-distance runners and sprinters. International Journal of Sports Medicine, 17, S109–S113. [Google Scholar] [PubMed]
3. Markovic, G., Dizdar, D., Jukic, I., Cardinale, M. (2004). Reliability and factorial validity of squat and countermovement jump tests. Journal of Strength and Conditioning Research, 18(3), 551–555. [Google Scholar] [PubMed]
4. Bosco, C., Tihanyi, J., Latteri, F., Fekete, G., Apor, P. et al. (1986). The effect of fatigue on store and re-use of elastic energy in slow and fast types of human skeletal muscle. Acta Physiologica Scandinavica, 128(1), 109–117. [Google Scholar] [PubMed]
5. Gathercole, R. J., Stellingwerff, T., Sporer, B. C. (2015). Effect of acute fatigue and training adaptation on countermovement jump performance in elite snowboard cross athletes. Journal of Strength and Conditioning Research, 29(1), 37–46. [Google Scholar] [PubMed]
6. Gorostiaga, E. M., Asiain, X., Izquierdo, M., Postigo, A., Aguado, R. et al. (2010). Vertical jump performance and blood ammonia and lactate levels during typical training sessions in elite 400-m runners. Journal of Strength and Conditioning Research, 24(4), 1138–1149. [Google Scholar] [PubMed]
7. Hoffman, B. W., Raiteri, B. J., Connick, M. J., Beckman, E. M., Macaro, A. et al. (2022). Altered countermovement jump force profile and muscle-tendon unit kinematics following combined ballistic training. Scandinavian Journal of Medicine & Science in Sports, 32(10), 1464–1476. [Google Scholar]
8. Suchomel, T. J., McKeever, S. M., McMahon, J. J., Comfort, P. (2020). The effect of training with weightlifting catching or pulling derivatives on squat jump and countermovement jump force-time adaptations. Journal of Functional and Morphology and Kinesiology, 5(2), 28–43. [Google Scholar]
9. Salles, A. S., Baltzopoulos, V., Rittweger, J. (2011). Differential effects of countermovement magnitude and volitional effort on vertical jumping. European Journal of Applied Physiology, 111(3), 441–448. [Google Scholar] [PubMed]
10. Moran, K. A., Wallace, E. S. (2007). Eccentric loading and range of knee joint motion effects on performance enhancement in vertical jumping. Human Movement Science, 26(6), 824–840. [Google Scholar] [PubMed]
11. Domire, Z. J., Challis, J. H. (2007). The influence of squat depth on maximal vertical jump performance. Journal of Sports Sciences, 25(2), 193–200. [Google Scholar] [PubMed]
12. Gheller, R. G., Dal Pupo, J., Ache-Dias, J., Detanico, D., Padulo, J. et al. (2015). Effect of different knee starting angles on intersegmental coordination and performance in vertical jumps. Human Movement Science, 42, 71–80. [Google Scholar] [PubMed]
13. Sale, D. G. (2002). Postactivation potentiation: Role in human performance. Exercise and Sport Sciences Reviews, 30(3), 138–143. [Google Scholar] [PubMed]
14. Blazevich, A. J., Babault, N. (2019). Post-activation potentiation versus post-activation performance enhancement in humans: Historical perspective, underlying mechanisms, and current issues. Frontiers in Physiology, 10, 1359. [Google Scholar] [PubMed]
15. Prieske, O., Behrens, M., Chaabene, H., Granacher, U., Maffiuletti, N. A. (2020). Time to differentiate postactivation “potentiation” from “performance enhancement” in the strength and conditioning community. Sports Medicine, 50(9), 1559–1565. [Google Scholar] [PubMed]
16. Mola, J. N., Bruce-Low, S. S., Burnet, S. J. (2014). Optimal recovery time for postactivation potentiation in professional soccer players. Journal of Strength and Conditioning Research, 28(6), 1529–1537. [Google Scholar] [PubMed]
17. Koklu, Y., Koklu, O., Isikdemir, E., Alemdaroglu, U. (2022). Effect of varying recovery duration on postactivation potentiation of explosive jump and short sprint in elite young soccer players. Journal of Strength and Conditioning Research, 36(2), 534–539. [Google Scholar] [PubMed]
18. Mina, M. A., Blazevich, A. J., Tsatalas, T., Giakas, G., Seitz, L. B. et al. (2019). Variable, but not free-weight, resistance back squat exercise potentiates jump performance following a comprehensive task-specific warm-up. Scandinavian Journal of Medicine & Science in Sports, 29(3), 380–392. [Google Scholar]
19. Wilson, J. M., Duncan, N. M., Marin, P. J., Brown, L. E., Loenneke, J. P. et al. (2013). Meta-analysis of postactivation potentiation and power: Effects of conditioning activity, volume, gender, rest periods, and training status. Journal of Strength and Conditioning Research, 27(3), 854–859. [Google Scholar] [PubMed]
20. Tillin, N. A., Bishop, D. (2009). Factors modulating post-activation potentiation and its effect on performance of subsequent explosive activities. Sports Medicine, 39(2), 147–166. [Google Scholar] [PubMed]
21. Cilli, M., Gelen, E., Yildiz, S., Saglam, T., Camur, M. (2014). Acute effects of a resisted dynamic warm-up protocol on jumping performance. Biology of Sport, 31(4), 277–282. [Google Scholar] [PubMed]
22. Garcia-Pinillos, F., Molina-Molina, A., Latorre-Roman, P. A. (2016). Impact of an incremental running test on jumping kinematics in endurance runners: Can jumping kinematic explain the post-activation potentiation phenomenon? Sports Biomechanics, 15(2), 103–115. [Google Scholar] [PubMed]
23. Haff, G. G., Triplett, N. T. (2015). Essentials of strength training and conditioning. 4th edition. USA: Human Kinetics. [Google Scholar]
24. Linthorne, N. P. (2001). Analysis of standing vertical jumps using a force platform. American Journal of Physics, 69(11), 1198–1204. [Google Scholar]
25. Hopkins, W. G. (2002). A scale of magnitudes for effect statistics. A new view of statistics. www.sportsci.org/resource/stats/effectmag.html (accessed on 22/06/2023). [Google Scholar]
26. Boraczynski, M., Boraczynski, T., Podstawski, R., Wojcik, Z., Gronek, P. (2020). Relationships between measures of functional and isometric lower body strength, aerobic capacity, anaerobic power, sprint and countermovement jump performance in professional soccer players. Journal of Human Kinetics, 75, 161–175. [Google Scholar] [PubMed]
27. Bridgeman, L. A., McGuigan, M. R., Gill, N. D., Dulson, D. K. (2018). Relationships between concentric and eccentric strength and countermovement jump performance in resistance trained men. Journal of Strength and Conditioning Research, 32(1), 255–260. [Google Scholar] [PubMed]
28. Hubley, C. L., Wells, R. P. (1983). A work-energy approach to determine individual joint contributions to vertical jump performance. European Journal of Applied Physiology and Occupational Physiology, 50(2), 247–254. [Google Scholar] [PubMed]
29. Fukashiro, S., Komi, P. V. (1987). Joint moment and mechanical power flow of the lower limb during vertical jump. International Journal of Sports Medicine, 8, 15–21. [Google Scholar] [PubMed]
30. McErlain-Naylor, S., King, M., Pain, M. T. (2014). Determinants of countermovement jump performance: A kinetic and kinematic analysis. Journal of Sports Sciences, 32(19), 1805–1812. [Google Scholar] [PubMed]
31. Papaiakovou, G. (2013). Kinematic and kinetic differences in the execution of vertical jumps between people with good and poor ankle joint dorsiflexion. Journal of Sports Sciences, 31(16), 1789–1796. [Google Scholar] [PubMed]
32. Driller, M. W., Overmayer, R. G. (2017). The effects of tissue flossing on ankle range of motion and jump performance. Physical Therapy in Sport, 25, 20–24. [Google Scholar] [PubMed]
33. McClymont, D., Hore, A. (2003). Use of the reactive strength index (RSI) as an indicator of plyometric training conditions. Science and Football V: The Proceedings of the fifth World Congress on Sports Science and Football, Lisbon, Portugal. [Google Scholar]
34. Kijowksi, K. N., Capps, C. R., Goodman, C. L., Erickson, T. M., Knorr, D. P. et al. (2015). Short-term resistance and plyometric training improves eccentric phase kinetics in jumping. Journal of Strength and Conditioning Research, 29(8), 2186–2196. [Google Scholar] [PubMed]
35. Avdan, G., Onal, S., Rekabdar, B. (2023). Regression transfer learning for the prediction of three-dimensional ground reaction forces and joint moments during gait. International Journal of Biomedical Engineering and Technology, 42(4), 317–338. [Google Scholar]
36. Cormie, P., McBride, J. M., McCaulley, G. O. (2009). Power-time, force-time, and velocity-time curve analysis of the countermovement jump: Impact of training. Journal of Strength and Conditioning Research, 23(1), 177–186. [Google Scholar] [PubMed]
37. Rodacki, A. L., Fowler, N. E., Bennett, S. J. (2002). Vertical jump coordination: Fatigue effects. Medicine & Science in Sports & Exercise, 34(1), 105–116. [Google Scholar]
38. Pereira, G., de Freitas, P. B., Barela, J. A., Ugrinowitsch, C., Rodacki, A. L. et al. (2014). Vertical jump fatigue does not affect intersegmental coordination and segmental contribution. Motriz: Revista de Educação Física, 20, 303–309. [Google Scholar]
39. Lin, H. T., Kuo, W. C., Chen, Y., Lo, T. Y., Li, Y. I. et al. (2022). Effects of fatigue in lower back muscles on basketball jump shots and landings. Physical Activity and Health, 6(1), 273–286. [Google Scholar]
Cite This Article
 Copyright © 2023 The Author(s). Published by Tech Science Press.
This work is licensed under a Creative Commons Attribution 4.0 International License , which permits unrestricted use, distribution, and reproduction in any medium, provided the original work is properly cited.
 Downloads
 Citation Tools