
 Submit a Paper
 Propose a Special lssue
 Open Access
ARTICLE

Evaluation of Pre-Harvest Sprouting (PHS) Resistance and Screening of High-Quality Varieties from Thirty-Seven Quinoa (Chenopodium quinoa Willd.) Resources in Chengdu Plain
Key Laboratory of Coarse Cereal Processing, Ministry of Agriculture and Rural Affairs, Chengdu University, Chengdu, 610106, China
* Corresponding Author: Xiaoyong Wu. Email:
Phyton-International Journal of Experimental Botany 2023, 92(10), 2921-2936. https://doi.org/10.32604/phyton.2023.029853
Received 11 March 2023; Accepted 24 July 2023; Issue published 15 September 2023
 View Full Text
 Download PDF
Abstract
Pre-harvest sprouting (PHS) will have a serious effect both on the yield and quality of quinoa (Chenopodium quinoa Willd.). It is crucial to select and breed quinoa varieties with PHS resistance and excellent agronomic traits for guidance production and utilization of quinoa. A comprehensive evaluation of the PHS resistance and agronomic traits of 37 species of quinoa resources was conducted in Chengdu Plain. The evaluation used various methods, including grain germination rate (GR), grain germination index (GI), total spike germination rate (SR), total grain germination index (SI), grey correlation analysis (GCA), cluster analysis and correlation analysis. Results showed significant differences in PHS resistance and agronomic traits amongst the 37 quinoa resources. CDU-23 was most resistant to PHS within 24 h, with a germination rate of 2.67% and 0% according to the GR and SR results, respectively. However, in the same time, CDU-31 showed the maximum susceptibility to PHS based on the SR of 31.07%, while CDU-34 was the most sensitive to PHS according to the GR of 100%. The comprehensive evaluation identified one and nine kinds of high resistance species for grain and whole spike germination, respectively. In both cases, the coefficients of variation (CV) for these parameters were 34.78% and 82.13%, respectively. GCA results showed that the magnitude of the association between each trait and yield in the thirty-seven quinoa resources was in the following order: thousand grain weight > seed length > seed area > seed width. Although the seed weight of CDU-18 reached 3.7010 g, the seed weight of CDU-5 was only 1.6030 g. However, the size of the seeds, their width and area did not correlate with their 1000-grain weight. There was a complex correlation between PHS resistance index and agronomic traits. Based on clustering analysis, thirty-seven quinoa resources were classified into three taxa. It was found that various taxa differed in PHS resistance and agronomic traits. Several comparisons of the aggregated data led to the selection of five varieties of quinoa, of which CDU-2 presented excellent agronomic qualities and strong PHS resistance. This study has provided a reference for breeding excellent quinoa varieties with PHS resistance.Keywords
Quinoa (Chenopodium quinoa Willd.), an annual dicotyledonous plant of the Chenopodium genus in the Amaranthaceae family, is native to the Andes region of South America and an agricultural crop similar to grains [1]. About 7000 years ago, quinoa was domesticated and cultivated by the local population as a main food crop [2]. Quinoa can withstand extreme conditions that common crops (rice, wheat, corn, sorghum) cannot survive [3], including drought salinity and frost tolerance, and can be grown at high altitude areas. Quinoa is rich in starch (52.0%–69.0%), lipids (2.0%–9.5%), protein (13.8%–16.5%), dietary fiber (7.0%–9.7%) [4] and nutrients that meet the body’s daily intake [5]. Despite the high cultivation, nutritional and functional value of quinoa, it was neglected for thousands of years [6,7]. Until the last 50 years, as the global population grew dramatically and the natural environment and agricultural production conditions became increasingly severe, there was an urgent need to find a high-quality grain to satisfy the daily consumption of people [8]. In recent years, quinoa has been rediscovered due to its excellent agronomic property and nutritional value, so its area of cultivation and yield are rapidly increasing. In recent years, quinoa has been grown in China, France, India, Sweden, Denmark, Netherlands, Italy, and other countries [9,10]. Due to the Andean people’s contribution to the development of quinoa, the International Food and Agriculture Organization (FAO) has declared 2013 the “International Year of Quinoa” [1].
However, in Southwest China [11], especially Chengdu Plain, the harvest season of quinoa is often accompanied by high temperatures and high humidity, and Quinoa is extremely vulnerable to PHS if it is not harvested in time or not handled properly after harvested [8,12,13]. PHS will promote the hydrolysis of starch in grain endosperm [8,14,15], the change of protein spatial structure, the damage of seed internal structure which reduce the nutritional value of grain, create a favorable environment for saprophytic fungi, and lead to seed spoilage and deterioration [16] and loss of vitality. The annual global economic loss due to PHS is up to $1 billion [15]. Consequently, it is crucial to find a solution to the quinoa PHS method as soon as possible, both in terms of boosting agricultural production and promoting economic development.
Through natural variation and artificial selection, selective breeding is an effective method of evaluating PHS resistance of quinoa resources with excellent resistance in years of cultivation (the conventional methods to identify pre-harvest sprouting resistance mainly include whole-spike germination test and grain germination test) [17–19]. Varieties with excellent agronomic characters are selected from the screened resources for planting, so as far as possible to reduce the grain PHS caused by agricultural production loss. Quinoa yield is generally determined by effective spike length, number of spike branches and thousand grain weight [20]. Thousand grain weight is closely related to the grain phenotypic traits, which can be divided into grain size (grain area, grain width, grain length) and grain morphology (aspect ration, roundness value) [21,22]. The improvement of quinoa yield and quality can be achieved by improving the phenotypic traits of the grain of quinoa. In this study, varieties with PHS resistant were selected through grain germination and whole spike germination experiments, varieties with high quality agronomic traits were selected through thousand grain weight, grain length, grain width and grain area. The data were integrated and 37 quinoa resources were analyzed, and the excellent quinoa varieties suitable for planting in the Chengdu Plain were screened, which provided a reference for developing quinoa resources and improving quinoa yield.
2.1 Preparation and Treatment of Test Materials
In this experiment, 37 quinoa resources were provided by the Key Laboratory of Coarse Cereal Processing, Ministry of Agriculture and Rural Affairs at Chengdu University. Approximately 100–110 days were the most fertile period for the thirty-seven quinoa resources. The experimental site was located in Yuanba Village, Xinshi Street, Jianyang City, East New District, Chengdu City, Sichuan Province (104°56′59″N, 30°32′90″E; 387 m). The average temperature of the test site from March to July is 25°C in two years. All the materials were sowed in a plot of measured 3 m × 3.3 m, with a 30 cm × 30 cm plant spacing, cultivated 1 quinoa plant every 30 cm and cultivated 11 quinoa plants within 3.3 m. The experiments were conducted in 2021 and 2022, respectively, and three biological replicates were performed in each year. All the quinoa materials were sowed on March 15 and were harvested on July 11 in the first year and sowed on March 8 and were harvested before July 10 in the second year. Conventional field management was adopted during the growth period. During harvest, each plot was divided into five parts, and a top spike approximately 15 cm long was randomly selected from each part. Hence, each quinoa material was numbered and five spikes were selected in a plot.
All the quinoa spikes were dried in an oven at 37°C for 72 h until the moisture content of the grain less than 12%. An evaluation of spike germination was conducted on two spikes of each quinoa. Ninety grains were randomly selected from the remaining dried quinoa spikes for the grain germination test after manual threshing. Furthermore, 37 quinoa resources were assessed for their grain agronomic traits (including thousand grain weight, grain length, grain width, and grain area).
All the test materials were disinfected by immersion with 0.5% NaClO (grains immersion for 3 min and spikes immersion for 10 min), rinsed slowly with distilled water to remove residual reagents. A dark climate chamber at 25°C and 85% relative humidity was used to test germination of grains and spikes [23].
2.2.1 Whole Spike Germination Test
A whole spike germination test was conducted using wet tissue wrapping [23,24]. For each spike, wet paper towels were wrapped around it and it was placed upright in a 250 mL beaker for one hour until completely moist. During incubation, the samples were placed in a 25°C artificial climate chamber. In order to prevent the paper from drying out, 10 mL of distilled water was added to the beaker. The germination status of the spikes in the paper towels was observed every four hours. The 100% humidity of the paper towels was maintained at all times to provide a moist environment for the germination of quinoa spikes. The number of germinated seeds was observed and counted at 8, 16, 24, 32, 40, 48, 72 and 96 h respectively (the grain coat was considered to be broken or buds of 1–2 mm appeared named germinate) [25] and the whole spike germination rate (SR represents the percentage of PHS grains in total grains) and index (SI represents the average germination degree of quinoa PHS) were calculated. Among them, the whole spike germination resistance test was conducted within 8–48 h and the whole spike vitality test was carried out at 72, 96 and 120 h.
Each treated grain of quinoa was placed in a Petri dish covered with double filter paper (diameter 9 cm), 30 seeds were placed in each dish and 5 mL of distilled water was added, and the process was repeated three times. The Petri dishes were observed every two hours in a constant light incubator. Each grain germination rate (GR) and grain germination index (GI) was recorded every 4 h for 32 h on the filter paper with a moisture level of 100%. Subsequent, seed vitality test was carried out at 44, 56 and 68 h.
2.2.3 Agronomic Trait Determination
The length, width and area of each quinoa resource was performed using a WinRHIZO Reg STD4800 root system analyzer, while the thousand grain weight was determined with an electronic analytical balance FA2004.
Germination rate (%): GR = n(1~k)/N × 100%.
Germination index: GI = (K × n1 + …… + 3 × n(k−2) + 2 × n(k−1) + 1 × nk)/K × N [26].
In the formula: n(1~k) denotes the number of grains sprouting each time from the 1st to the next k times. The k represents the total number of germination tests. The N represents the total number of grains used for germination.
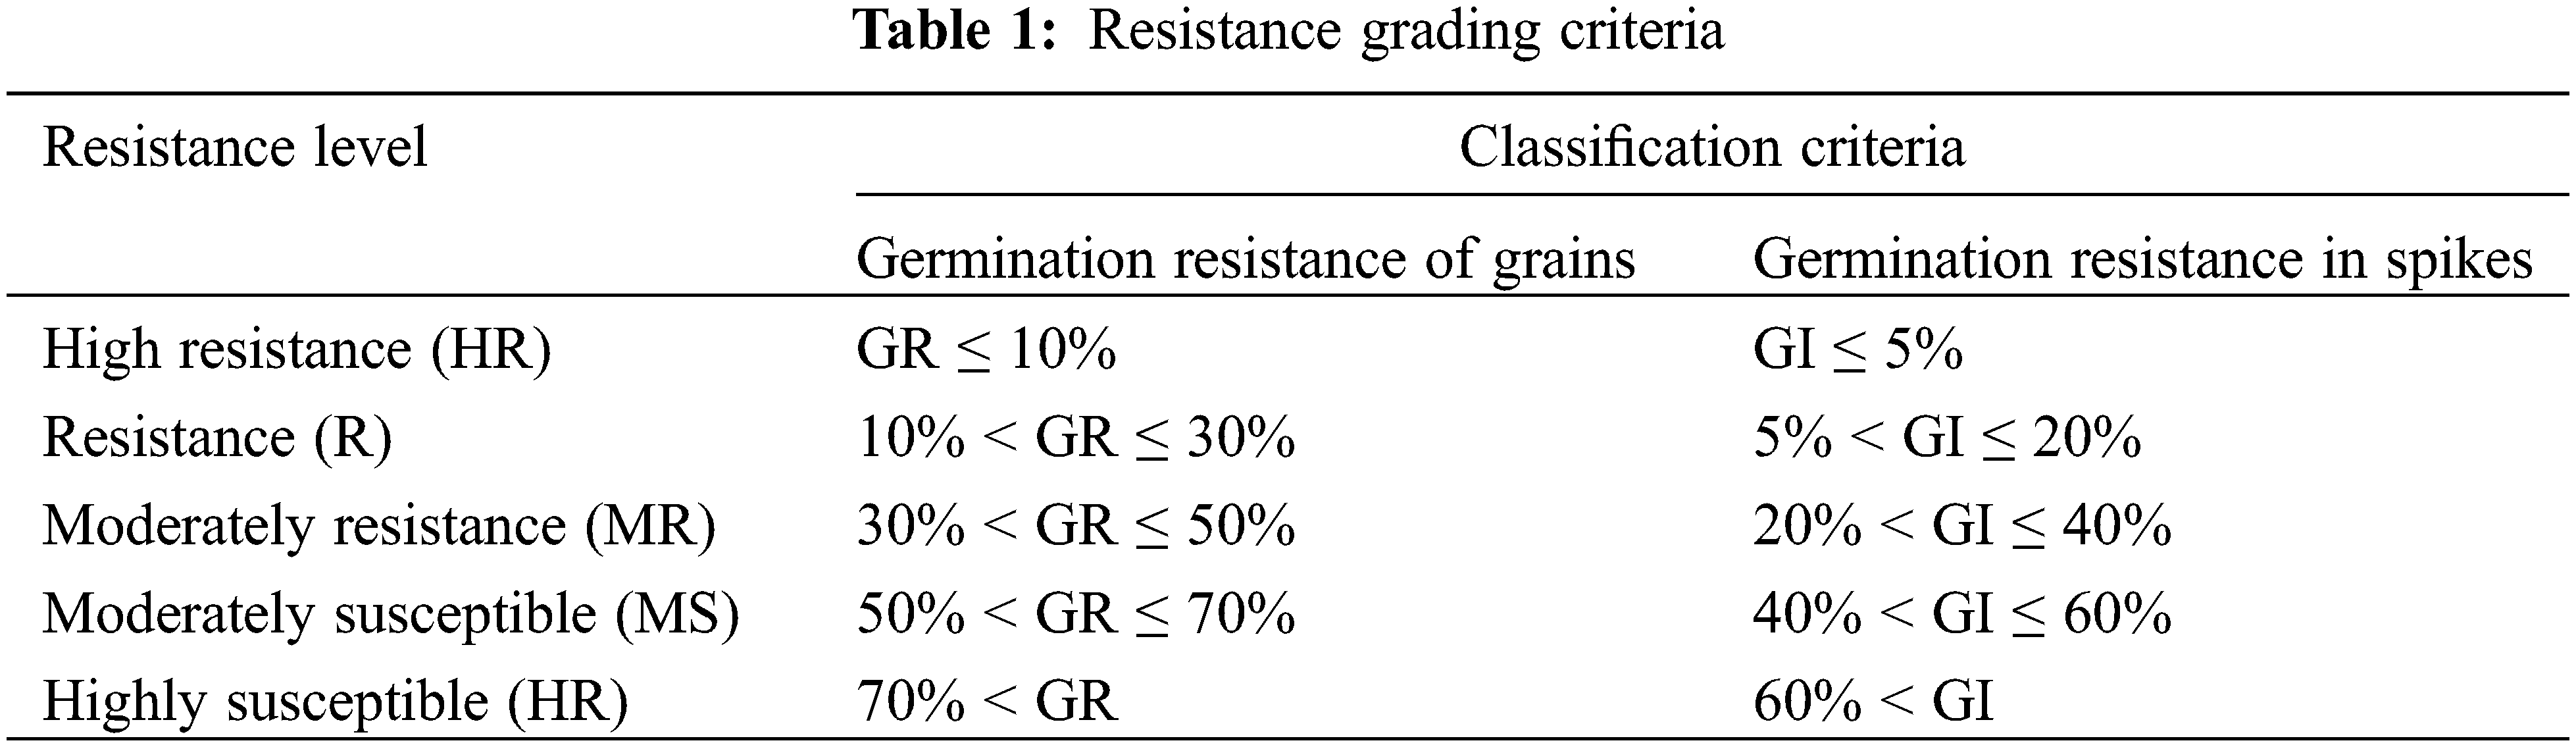
A modified version of the standard method for wheat spike germination resistance (NY/T1739-2009) was used for the whole spike germination resistance test [27,28]. References to relevant literature were used to develop the grading method for quinoa grains germination resistance in Table 1. The results of dormancy grade and grain germination resistance grade are consistent.
Coefficient of variation (CV) is defined as mean standard deviation (SD)/mean value (Mean) × 100%.
PHS resistance indicators were used for cluster analysis. Agronomic traits were used for grey correlation analysis and cluster analysis.
All the results were the average of two years. All statistical results were analyzed and plotted using Microsoft Excel 2019 software, SPSS Statistics 25 and Origin 2021. All data were averaged, and in this study, single factor ANOVA test method were used for significance analysis.
3.1 Evaluation and Analysis of Whole Spike Germination Trials
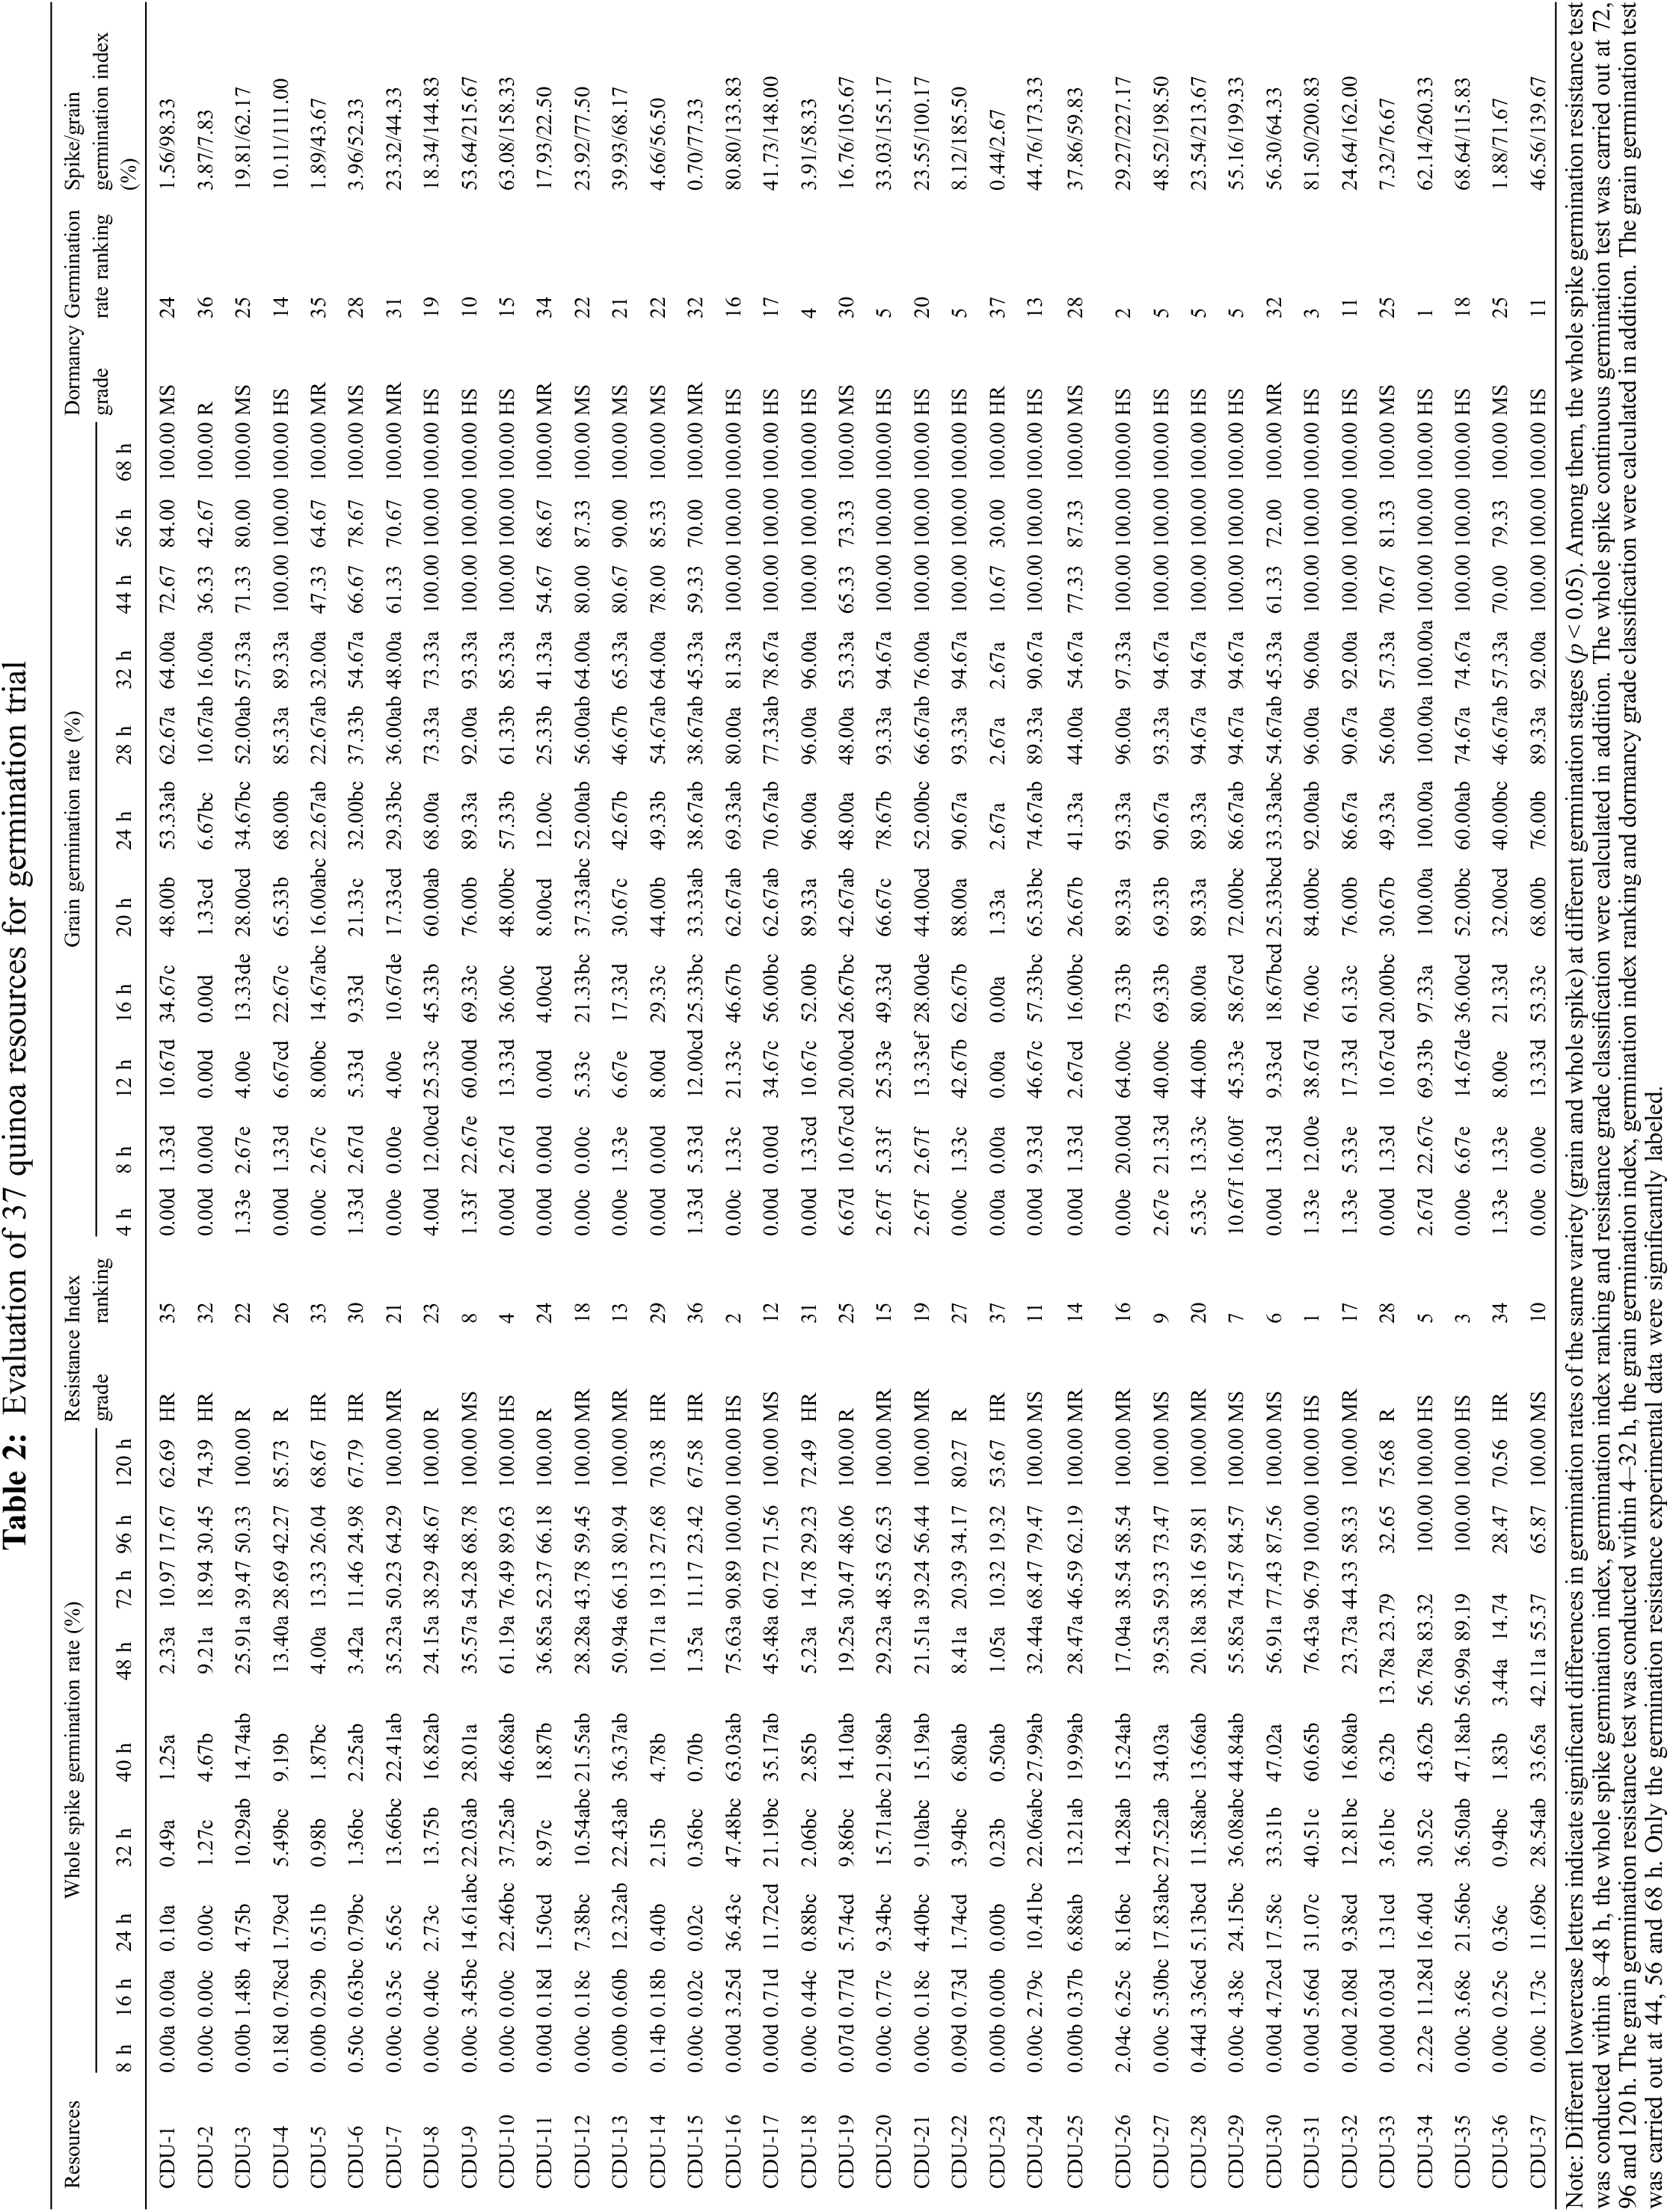
The results of the whole spikes germination trials were shown in Table 2. There were significant differences in whole spike germination resistance within 48 h among 37 quinoa resources treated under the same conditions. According to the standard, nine highly resistant (HR) varieties, seven resistant (R) varieties, nine moderately resistant (MR) varieties, seven moderately susceptible (MS) varieties and five highly susceptible (HS) varieties were selected. Among high resistance (HR) varieties, the spike germination index was in the order of CDU-23 < CDU-15 < CDU-1 < CDU-36 < CDU-5 < CDU-2 < CDU-18 < CDU-6 < CDU-14. CDU-23 spike had the lowest germination rate of 1.05% and germination index of 0.44%. It was followed by CDU-15 with 1.35% and 0.70% spike germination rate and index. The spike germination rate and index of CDU-1 were 2.33% and 1.56%, respectively. The germination rate of CDU-23 spikes was 0% during the first 32 h, and slowly increased to 1.05% within next 16 h. The germination process of CDU-15 was similar to that of CDU-23, with 0% of spikes germinating in the first 8 h and rose to 1.35% within next 40 h and remained unchanged. For CDU-1, the spike germination rate was 0% during the first 16 h and rose to 2.33% in the subsequent period. In a comprehensive analysis, CDU-31 had the lowest spike germination resistance among the 37 quinoa resources, followed by CDU-16 and CDU-35, which the spikes germination rates were 76.43%, 75.63% and 56.99%, respectively. CDU-31 and CDU-16 had 0 germination in the first 8 h, while CDU-35 had the same germination in the first 8 h. However, the spike germination rate of the three varieties aforementioned gradually increased in the subsequent time, and by 24 h, the spike germination rate had far exceeded that of the other varieties.
3.2 Evaluation and Analysis of Grain Germination Trials
Table 2 showed that there were significant differences in grain germination rates within 32 h among 37 quinoa resources treated under the same conditions. According to the standard, CDU-23 was screened as a highly PHS resistance (HR) variety with the grain germination rate and index of 2.67%. For CDU-23, there were zero grain germinated in the first 16 h and the germination rate increased to 2.67% in the second 16 h with no change in the subsequent time. CDU-2 was selected as a resistant (R) variety with a grain germination rate of 16.00% and grain germination index of 7.83%. Moreover, the germination process of CDU-1 was similar to that of CDU-23, with no germination during the first 16 h and no change after the germination rate reached 16.00% in the subsequent time. Twenty out of thirty-seven quinoa materials were screened as high-sensitive (HS) varieties. The top three grain germination rates were CDU-34, CDU-26 and CDU-31. According to the above sequence, with 100.00%, 97.33% and 96.00% of germination rates and 260.33%, 227.17% and 200.83% of germination indices, respectively. The CDU-34 grains had all sprouted within 20 h, while CDU-26 and CDU-31 reached the peak within 24 and 28 h, respectively. CDU-15 was selected as one of the medium PHS resistant (MR) varieties, which germination rates and germination indices were 45.33% and 77.33%. Moreover, when CDU-15 was subjected to a 32 h of germination treatment, its germination rate was the highest and tended to increase continuously.
3.3 Resistance Analyses of Grain Germination Rate and Whole Spike Germination Index
As a statistical indicator of seed germination resistance, grain germination rate indirectly indicated the dormancy resistance of each resource in Table 3. The variation in grain germination resistance among the 37 quinoa resources ranged from 2.67% to 100.00%, with a coefficient of variation of 34.78% and germination was discrete and highly variable among the species. There were only one highly resistant (HR) and one resistant (R) variety in seed germination, which were CDU-23 and CDU-2, respectively. There were twenty seed germination high susceptibility (HS) varieties, accounting for 54.05% of the total resources, with a variation range of 72.00%–100.00%, which was the most representative part. However, the coefficient of variation of the high-sensitive (HS) varieties was only 9.64% with a good degree of dispersion, indicating that the differences in germination rate between each HS variety were not significant. The second was followed by ten seed germination moderately susceptible (MS) varieties with the least variation range from 53.33% to 65.33% and the least dispersion of coefficient of variation of 7.60%, indicating that the germination rates of each moderately susceptible variety were very close.
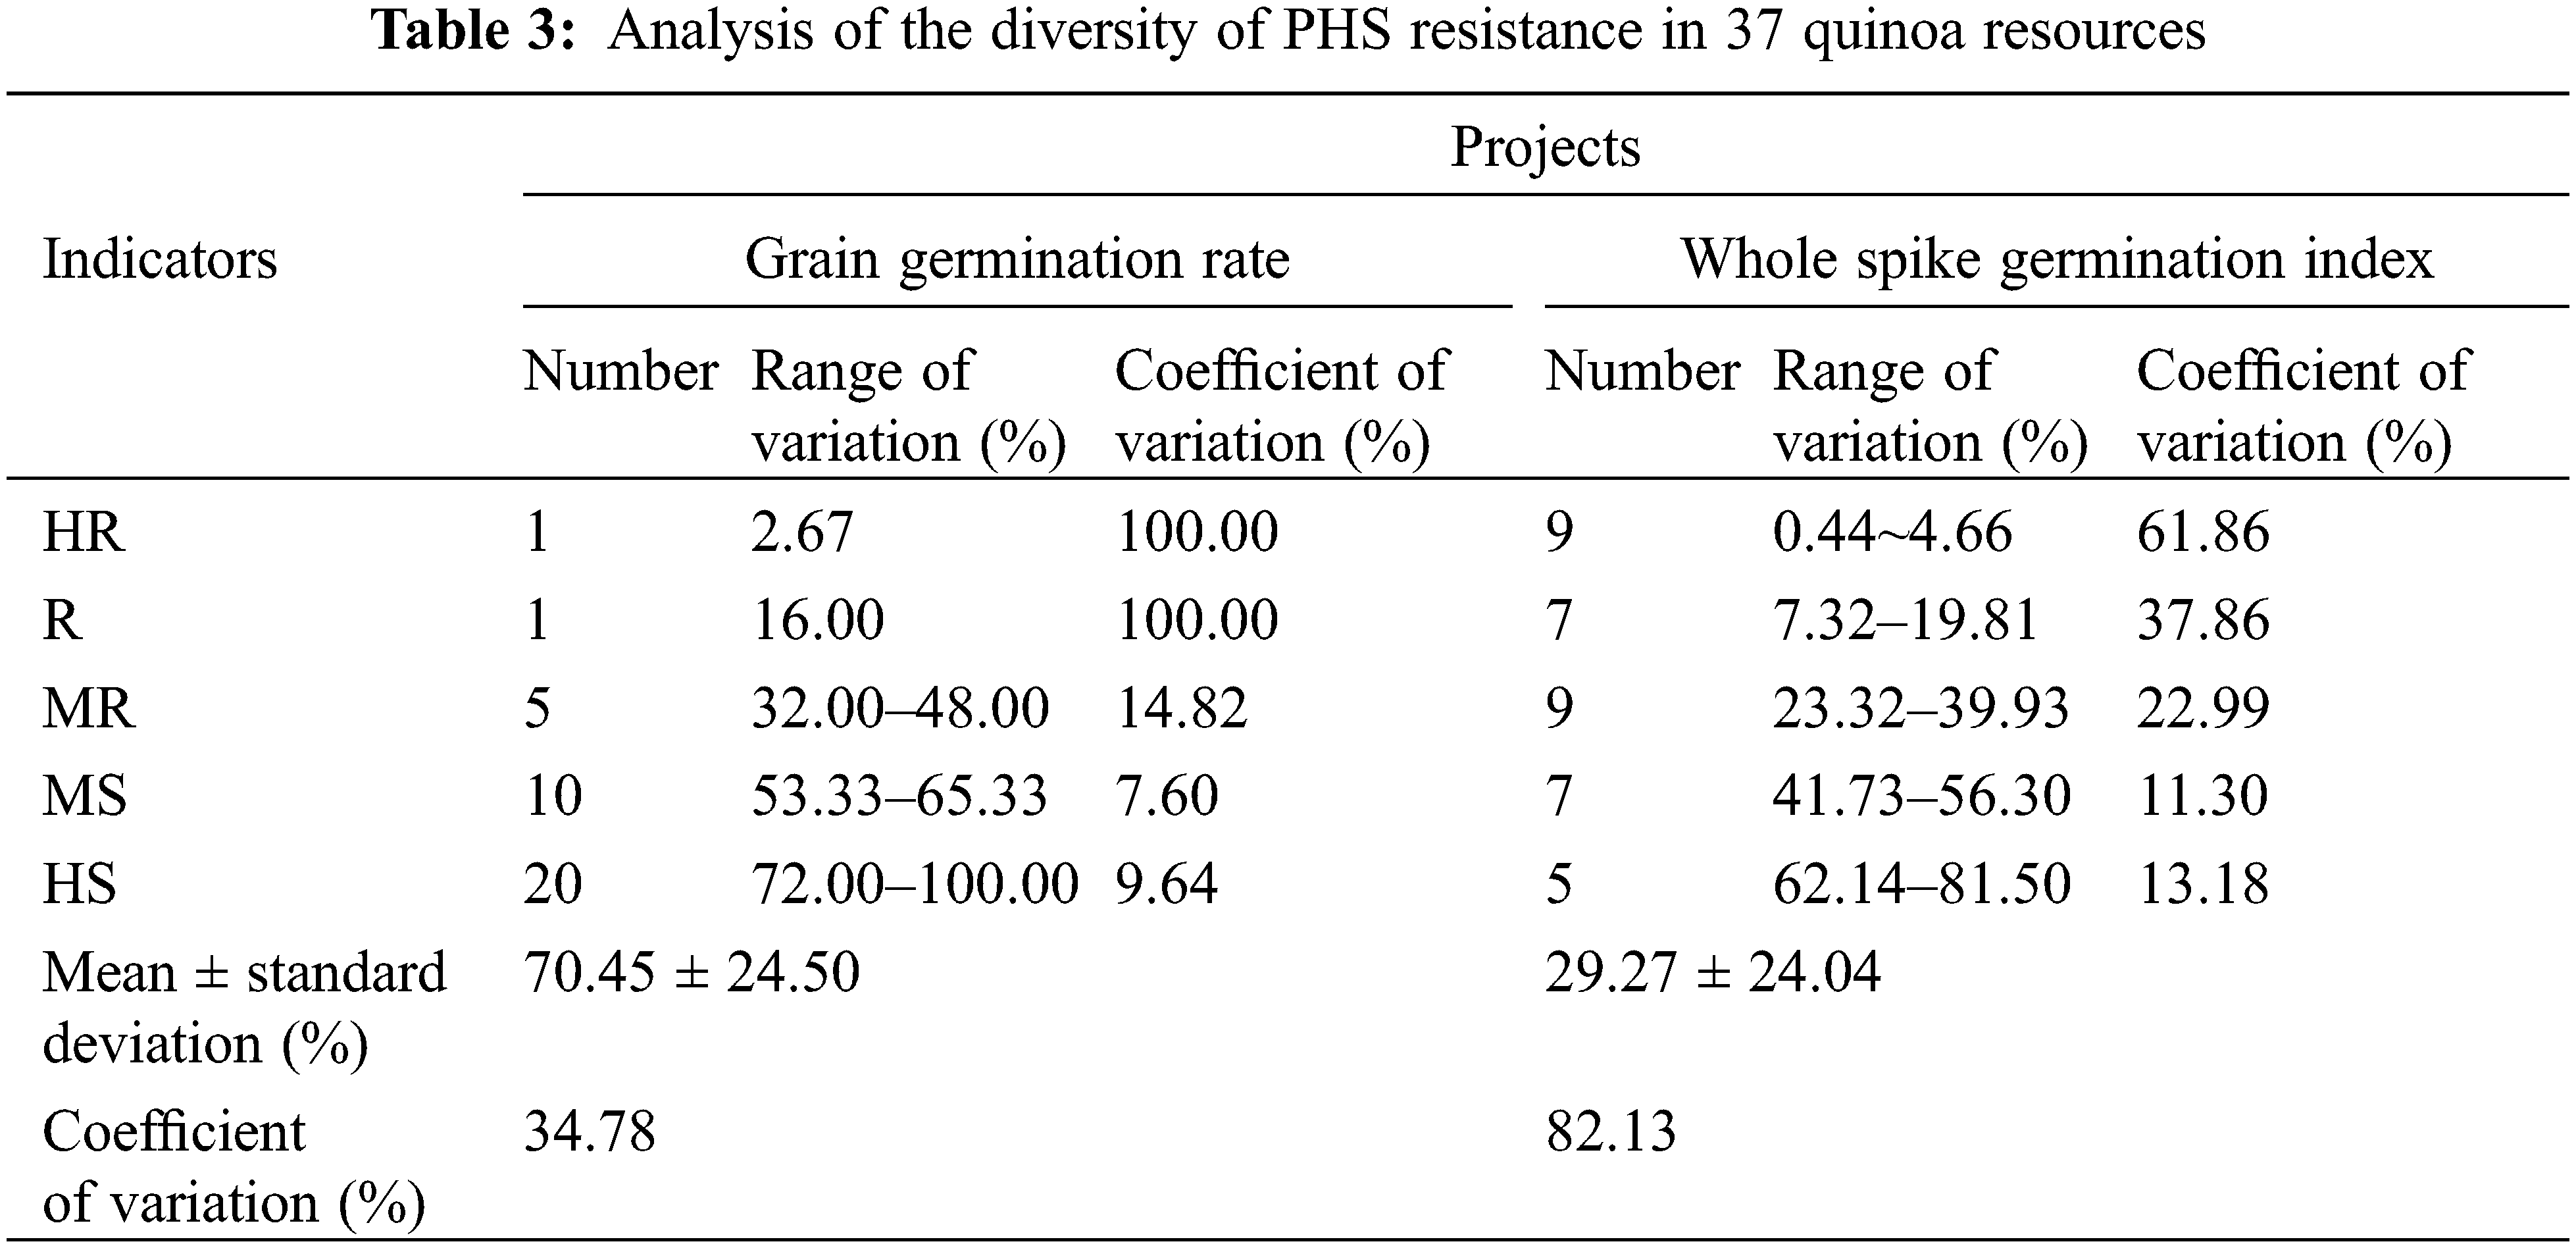
The whole-spike germination index was used as a grading index. In the whole spike germination resistance results, the variation of germination index of 37 quinoa resources ranged from 0.44% to 81.50% with a coefficient of variation as high as 82.13%, indicating that there were significant differences in quinoa spike resistance among the resources. The coefficient of variation of the medium-sense (MS) variety of spike germination was the smallest at 11.30%, and the range of variation was also small at 41.73% to 56.30% for a total of seven resources. The second was the highly sensitive (HS) varieties with a slightly larger coefficient of variation. There were five varieties with a coefficient of variation of 13.18%. Spike germination high resistance (HR) varieties were the most numerous, with a total of nine varieties and a minimum variation range of 0.44% to 4.66%, but the coefficient of variation was as high as 61.86%. Among highly resistant (HR) varieties, spike seed germination resistance differed significantly, and spike seed vigor differed significantly among highly resistant (HR) varieties, while highly resistant (HR) varieties differed significantly in spike seed vigor, they were all capable of inhibiting PHS to varying degrees.
3.4 Analysis of High-Quality Agronomic Traits of Quinoa Resources
Fig. 1 showed that the phenotypic trait characteristics of quinoa seeds showed a roughly normal distribution trend. There was an R2 greater than 0.9 in grain length (Fig. 1A), grain width (Fig. 1B), grain area (Fig. 1C), and thousand grain weight (Fig. 1D), suggesting that the phenotypic traits were well modeled and the overall variation was small.
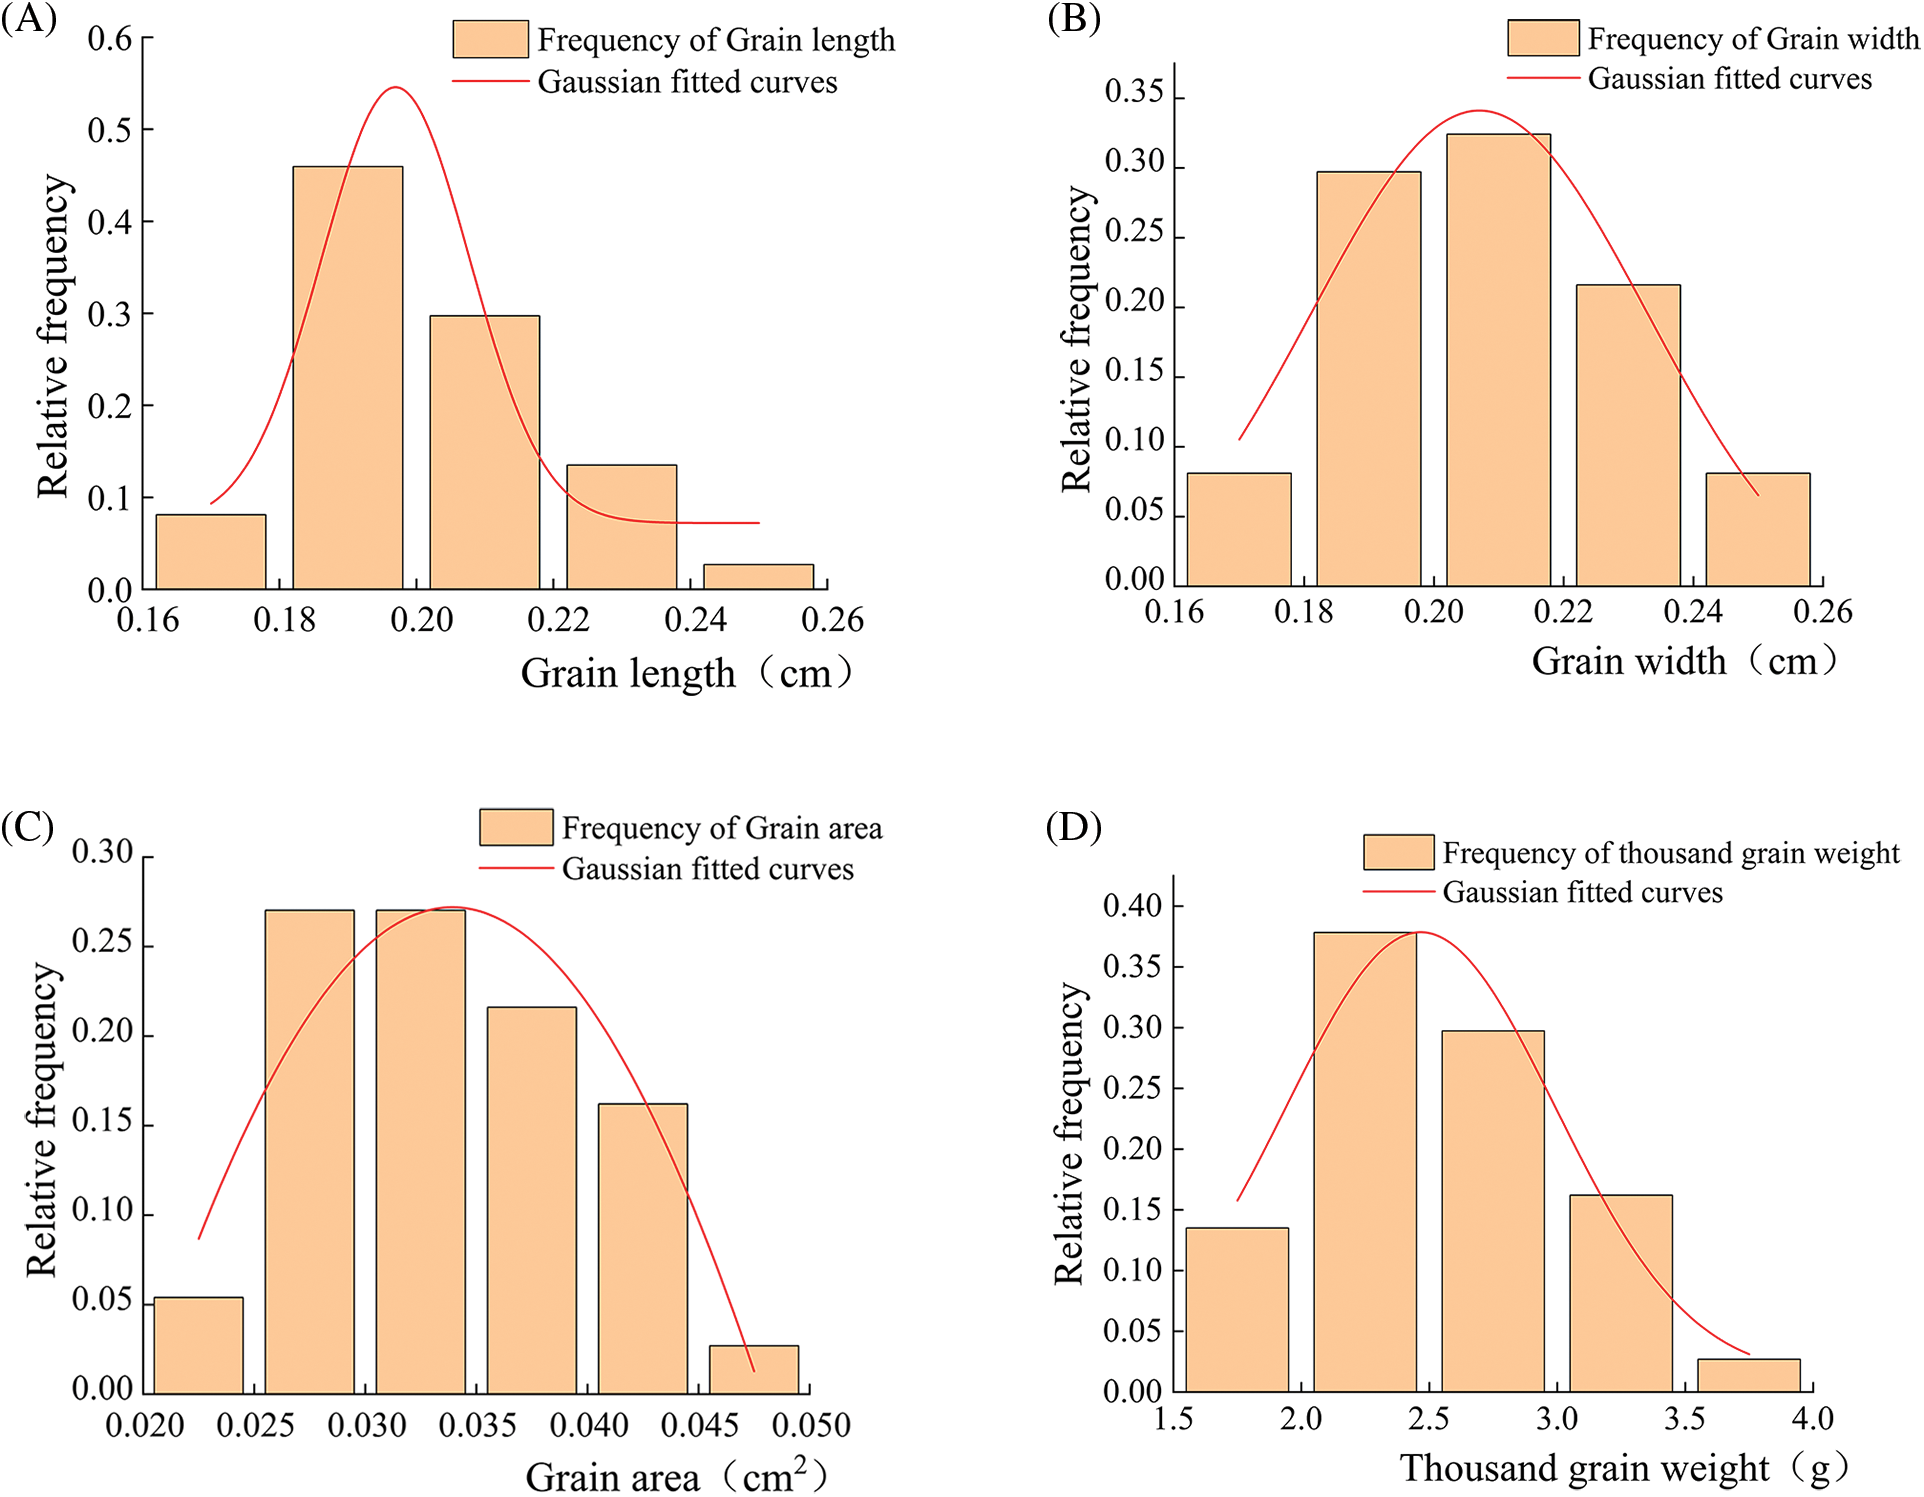
Figure 1: Frequency distribution of agronomic traits in the grains of 37 quinoa resources. (A) Grain length; (B) Grain width; (C) Grain area; (D) Thousand grain weight
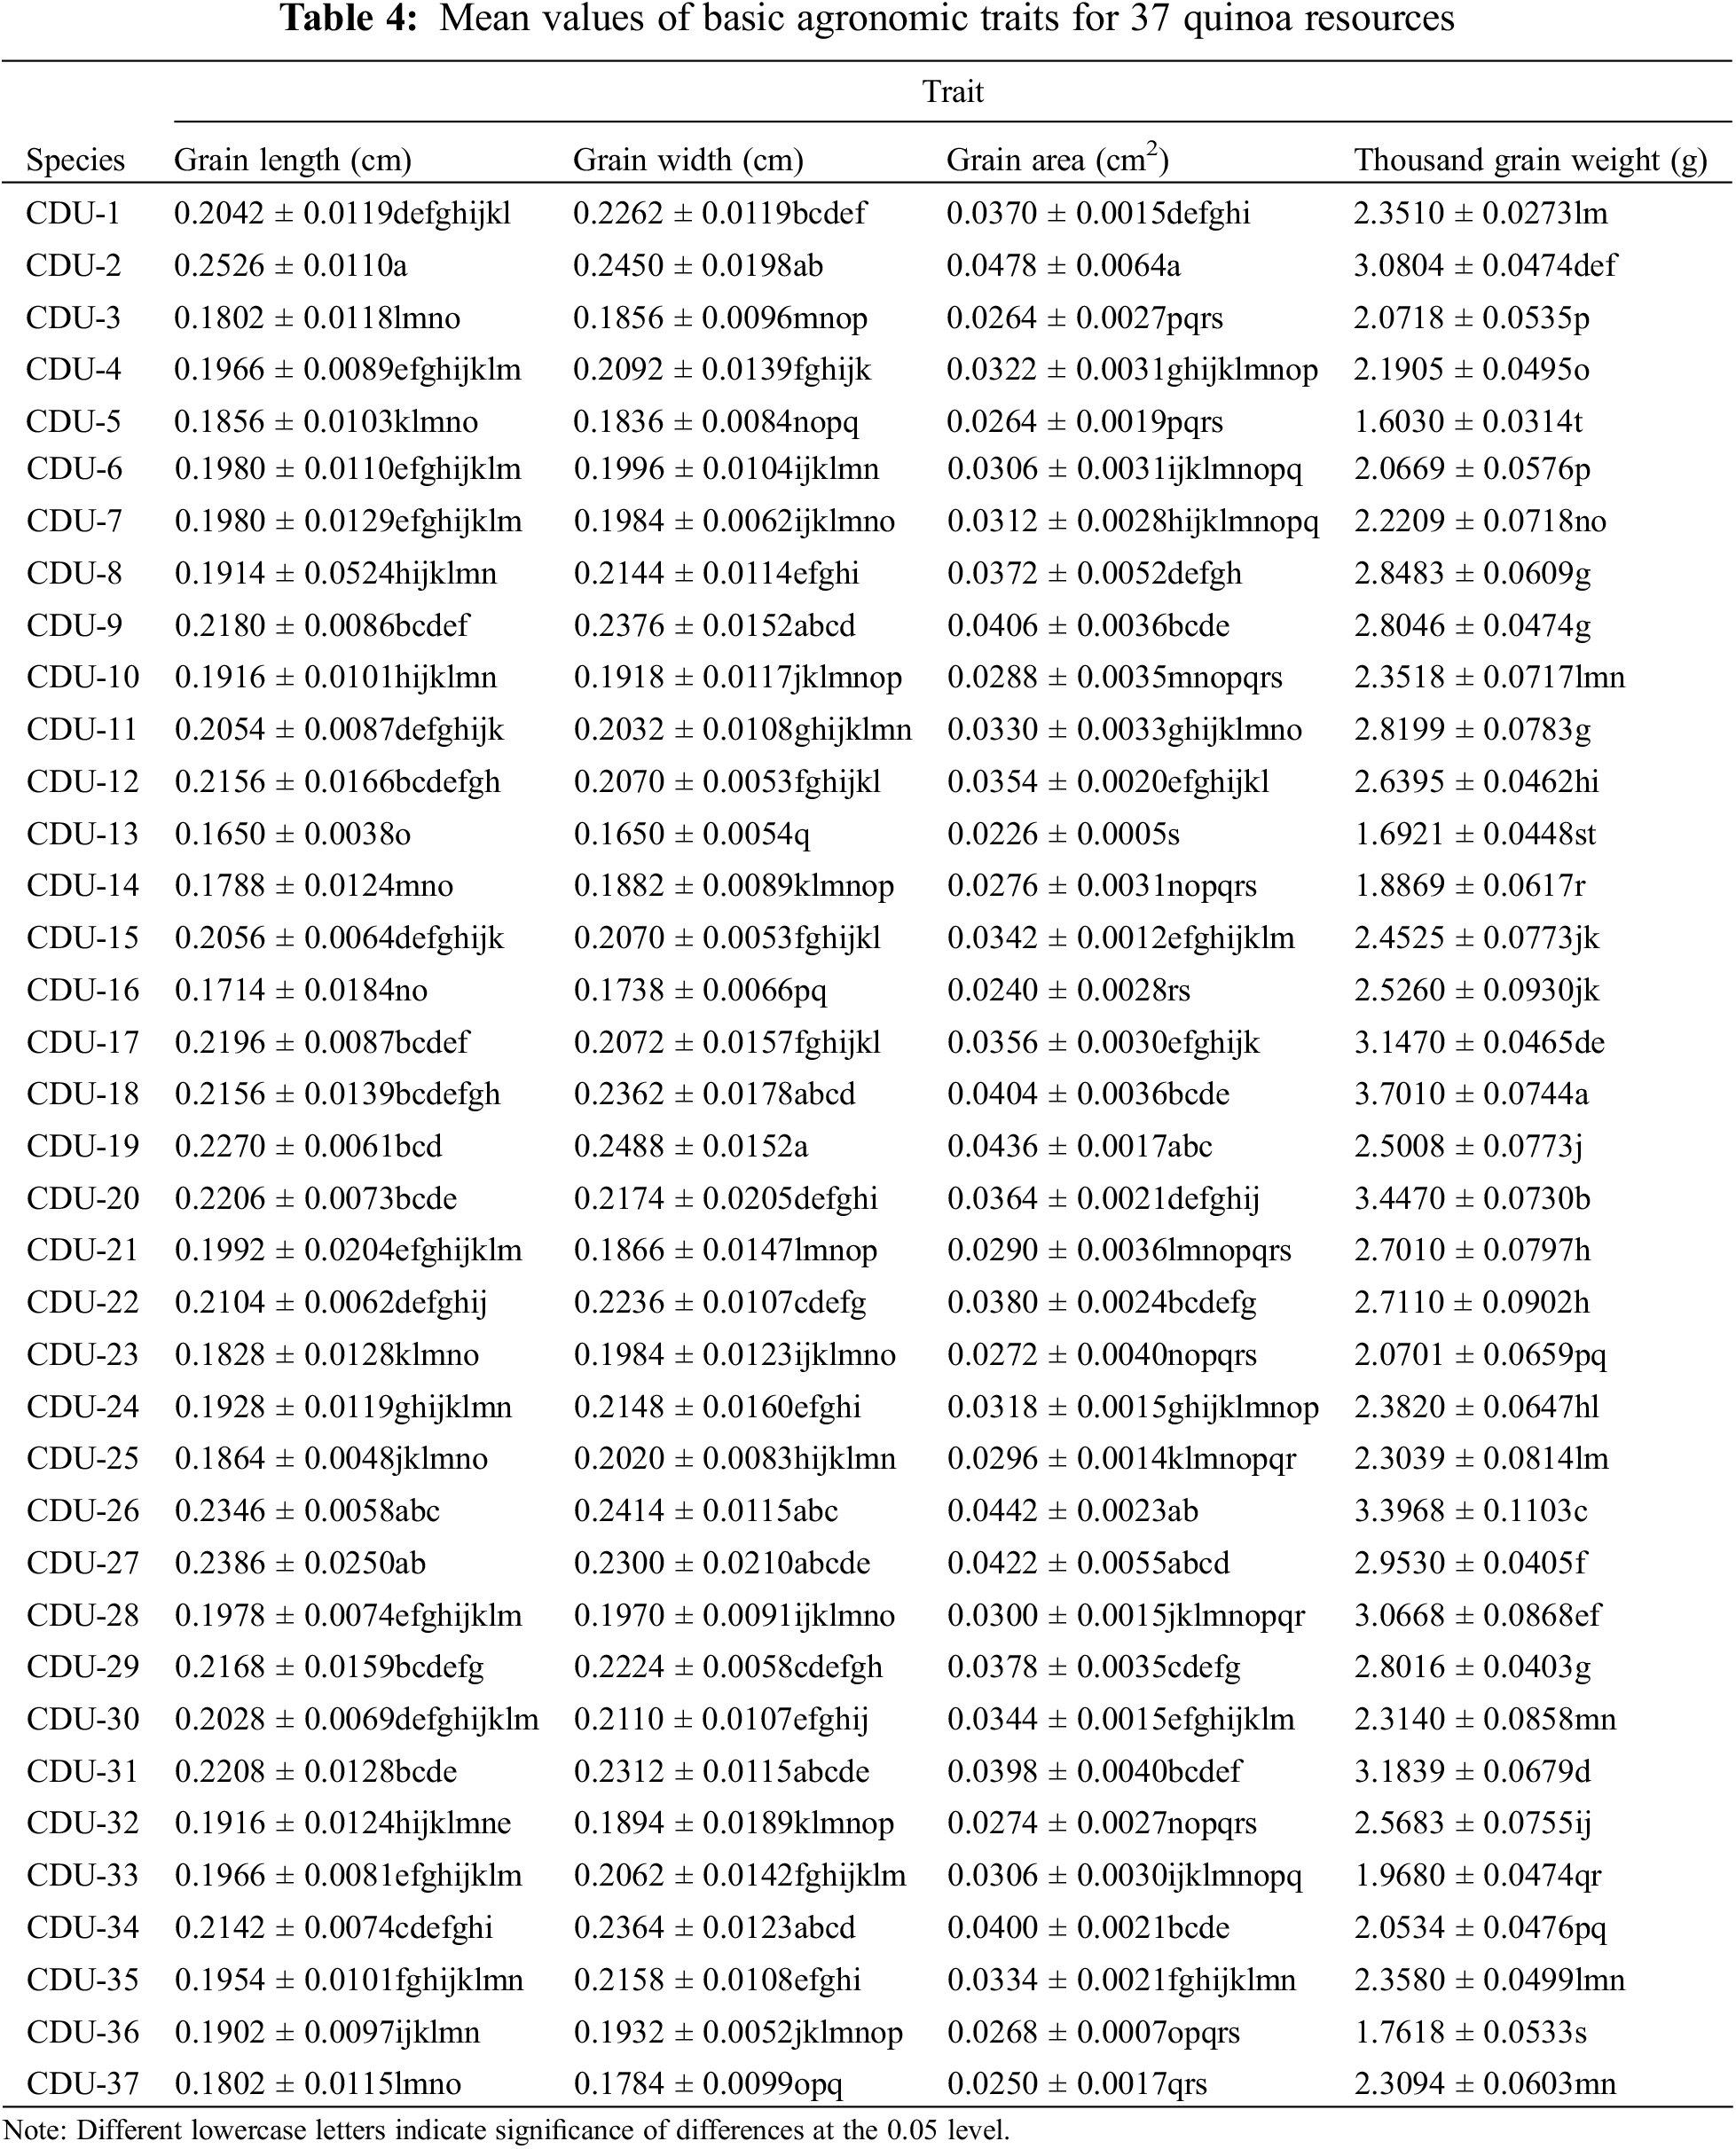
Agronomic statistics and analysis of quinoa grains were presented in Tables 4 and 5. According to the 37 quinoa varieties tested, variety CDU-18 had the maximum weight of 3.70 grams, while variety CDU-5 had the smallest weight of 1.60 grams, indicating there was a difference of 2.10 g between the two varieties. The CDU-2 variety had a maximum grain length of 0.25 cm and a maximum grain area of 0.05 cm2. There was a coefficient of variation of 19.79% for thousand grain weight, followed by a coefficient of variation of 18.35% for grain area. The results showed a high degree of dispersion in phenotypic data, indicating a large difference in yield between varieties. There was relatively little variation in grain length and width, both less than 10%, indicating that phenotypic traits were relatively stable in quinoa.
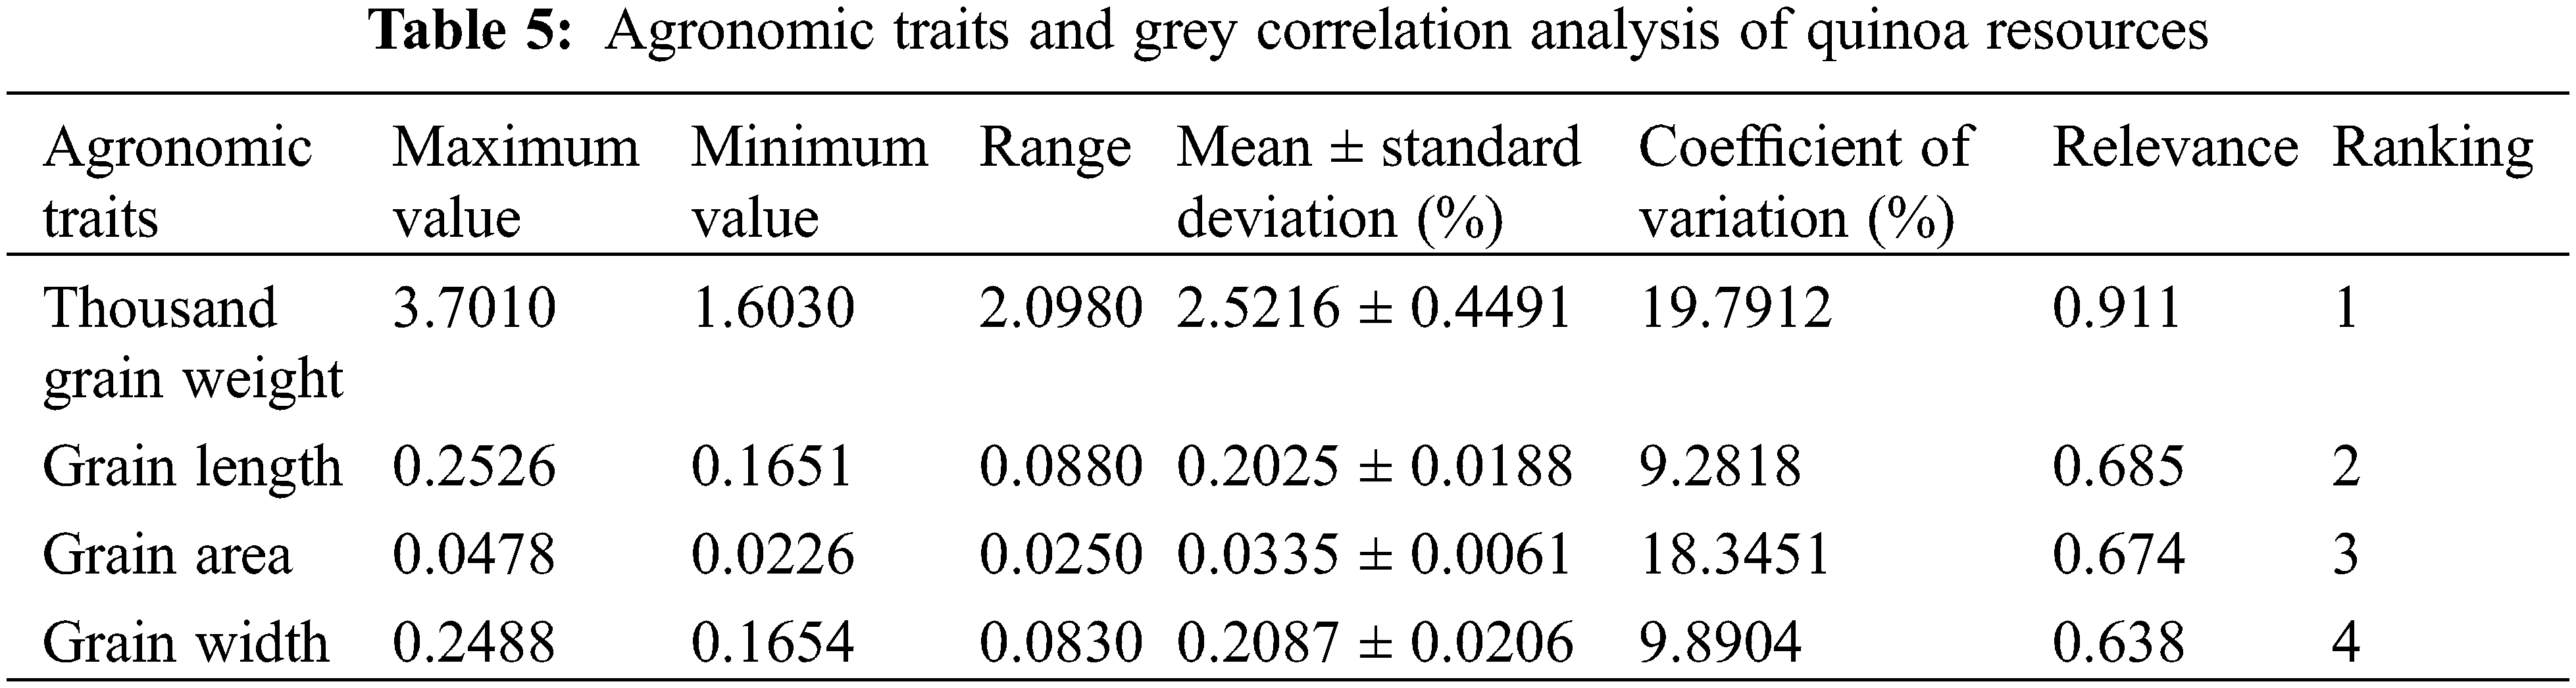
Based on the results of Table 5, it was apparent that agronomic traits were more closely related to quinoa yields. For each variety, thousand grain weight, grain length, grain area, and grain width correlated with yield, in descending order. According to the classification principle, the higher the correlation degree, the closer the relationship between the traits and the yield. Among phenotypic traits, thousand grain weight was a decisive factor for quinoa yield, while seed length and seed area had a weaker effect.
3.5 Correlation Analyses of Each Index of Quinoa Spike Germination with Agronomic Traits
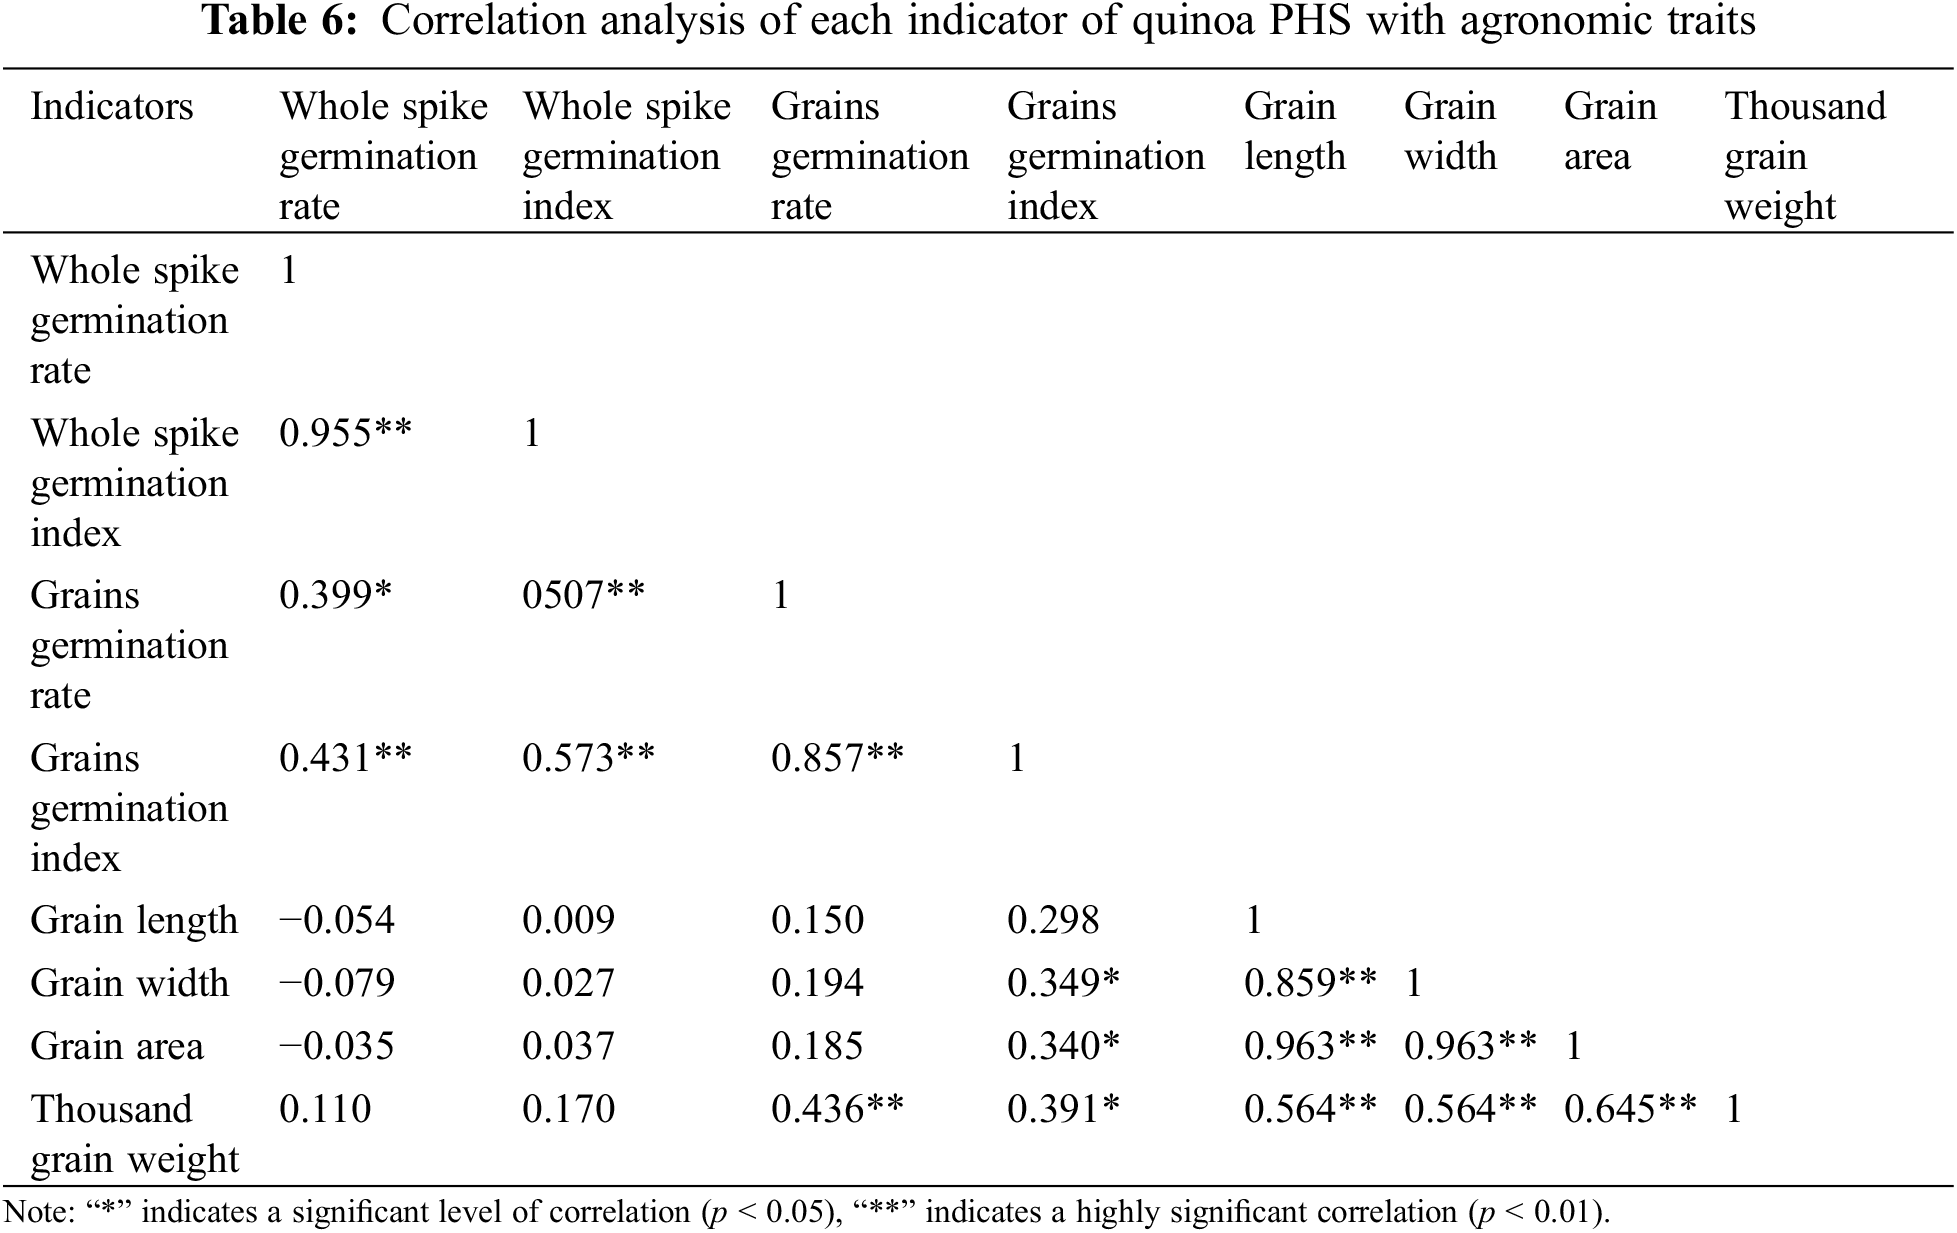
The correlation analysis results between the PHS indicators and agronomic traits of quinoa are shown in the Table 6. The indicators had degrees of correlation. Especially, each of the evaluation indices of spike germination was highly significant and positive correlated, only the whole spike germination rate and seed germination rate (r = 0.399) were significantly and positively correlated. All indicators of agronomic traits were highly significantly positively correlated. The correlation between different types of indicators was also evident. Grain germination rate was highly significantly positively correlated with thousand grain weight (r = 0.436), and grain germination index was significantly positively correlated with thousand grain weight (r = 0.391), grain area (r = 0.340), and grain width (r = 0.349). Seed area, seed length, and seed width negatively correlated with whole spike germination rate, correlations between the remaining indicators were not significant.
3.6 Cluster Analyses of PHS Indicators and Agronomic Traits of Quinoa Material
Results of the spike germination index by cluster analysis were shown in Fig. 2A. It was possible to divide the 37 quinoa resources into three major categories when the squared Euclidean distance was 9.66. First-class quinoa materials included CDU-2 and CDU-23, accounting for 5.41% of the test materials. The average spike and seed germination rate were 5.13% and 9.34%, and the average spike and seed germination index were 0.22 and 0.05. Based on the spike germination index, it was evident that a class of materials are highly resistant to spike germination. A total of 19 materials were included in the second category, representing 51.35 percent of the materials tested. According to the results, pre-harvest germination rate, grain germination rate, pre-harvest germination index, and grain germination index of these materials were 39.02%, 89.75%, 0.43% and 1.70%, respectively. All the relevant pre-harvest germination indices were high, belonging to the materials with low pre-harvest germination resistance, indicating that they were easy to sprout. The third category contained 16 materials that accounted for 43.24% of all test materials. It was 19.72%, 55.17%, 0.16% and 0.74% for the spike germination index, seed germination index, spike germination index, and seed germination index, respectively, and there was some resistance to PHS at the middle level.
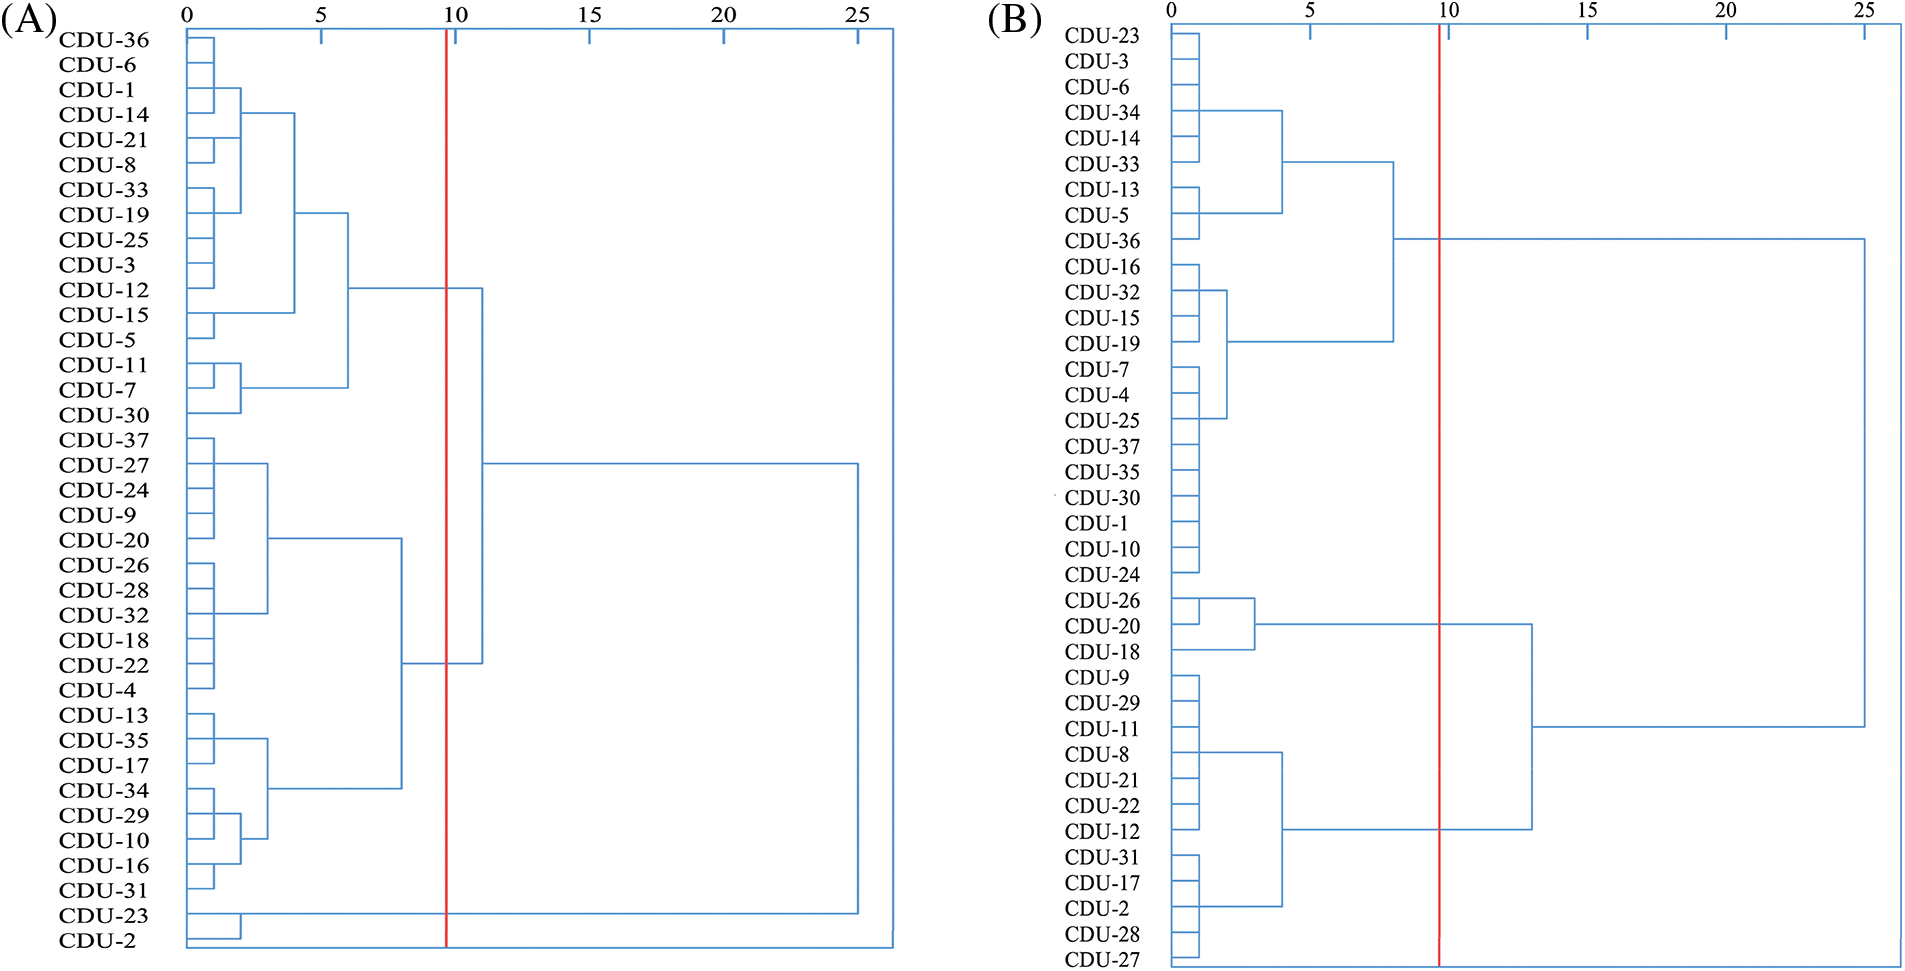
Figure 2: Cluster analysis of 37 quinoa resources. (A) Cluster analysis of PHS resistance indicators; (B) Cluster analysis of agronomic traits
Results of the agronomic traits by cluster analysis were shown in Fig. 2B. The 37 quinoa resources could be divided into three categories based on the squared Euclidean distance of 9.66. Three materials were in the first category, representing 8.11% of the test material, namely CDU-18, CDU-26, and CDU-19. There was an average grain length of 0.22, a grain width of 0.23, a grain area of 0.04 and a thousand grain weight of 3.52 g. It was a quinoa resource with yield and quality potential, as its agronomic traits were higher than the other two categories. A total of 12 materials were tested in the second category, representing 32.43 percent of all materials tested. In terms of grain length, grain width, grain area, and thousand grain weight, the average grain was 0.22, 0.228, 0.04, and 2.85, which was an excellent quinoa resource for transformation, all agronomic indexes place it slightly below the first category, but significantly higher than the third category. The third category contains another 22 materials, accounting for 59.46%. Approximately 0.18, 0.19, 0.03 and 2.11 grains were averaged for length, width, grain area and thousand grains.
PHS in grains is an irreversible and extremely damaging natural disaster, the imbalance between grain dormancy and germination is the main reason for cause of PHS [13,29,30], which can lead to a decrease in grain yields and quality. Agronomic traits of germplasm resources that can be used for estimating grain yield and quality. Grain yield is determined by thousand grain weight, while grain quality is determined by seed length, seed width, and seed area [28,31]. One of the most effective ways to reduce PHS and improve nutrition of grain is by selecting and breeding varieties that have excellent agronomic attributes and are resistant to PHS.
This study selected quinoa varieties with PHS resistance based on seed germination and whole spike germination test referring to the experimental methods for identifying PHS resistance in wheat, rice and barley [23,32–34] adjusted for quinoa germination characteristics. By analyzing thousand grain weight, seed length, seed width, and seed area, excellent agronomic traits were selected. Dormancy could explain seed PHS resistance, which is closely related to seed dormancy characteristics. The strength of seed dormancy characteristics could be determined by grain germination rate, grain germination index, whole spike germination rate and whole spike germination index. According to the seed germination rate and the whole spike germination index, PHS resistance of quinoa varieties were divided into five categories: high resistance (HR), medium resistance (MR), resistance (R), medium sensitivity (MS), and high sensitivity (HS). After analysis of variation coefficient, seed germination rate, whole spike germination rate, seed germination rate and whole spike germination index, it was found that the seed germination rate of 37 quinoa varieties was much higher than the germination rate of the whole spike, and the grain germination index was higher than the germination index of the whole spike, indicating that significant differences in PHS resistance among different varieties. Correlation analysis revealed that PHS resistance indexes of all varieties were significantly and positively correlated.
Furthermore, during the experimental process, it was found that the middle and bottom of the spike were the main germination sites. A first possibility is that there are substances in the peripheral perianth of grains that inhibit or promote grain germination, thus, the variety acquired PHS resistance, which was consistent with previous studies [35]. Secondly, water in the tissue at the top of the spike may flow downward due to gravity, the spike bottom stayed wet for a long time and provided the conditions for grain germination. The third reason might be that the seeds at the top of the spike were exposed to more sunlight and had lower water content, which dormancy of seed was enhanced and obtained stronger PHS resistance. The last reason might be that α-amylase activity and endogenous hormone content in the embryo of the seed dormancy [12,36–38]. This study of agronomic traits has been shown to follow a normal distribution. According to the coefficient of variation, there was a large difference between thousand grain weight and seed area. It was found that the traits were highly significantly correlated in the correlation analysis. Gray correlation analysis revealed that thousand grain weight, grain length, and grain area were the three most important traits affecting yield. Variations in genetic variation may lead to differences in yield and quality under the same treatment. Cluster analysis was used to classify 37 quinoa resources based on agronomic traits and PHS resistance at a squared Euclidean distance of 9.66. The germplasm resources with similar PHS resistance and genetic proximity were clustered into one category, for cultivation, PHS resistant varieties with excellent agronomic qualities (CDU-2) were selected to alleviate damage caused by quinoa PHS and to increase yield and quality, and promote the healthy development of quinoa industry.
In this study, 37 quinoa resources were tested for PHS resistance in 48 h, excellent agronomic traits and were compared. Five quinoa materials, CDU-2, CDU-11, CDU-12, CDU-21 and CDU-8, were selected from the comprehensive multiple comparison analysis, and all had better PHS resistance and excellent agronomic traits. The CDU-31 was selected as the most sensitive material to PHS. The photos of the 6 quinoa varieties were shown in Fig. 3. There was one material, CDU-2, which had the best PHS resistance and thousand grain weight, length, width, and area of seed. Besides screening high quality and PHS resistant quinoa varieties suitable for low altitude cultivation in Chengdu plain, this study also provides some theoretical support for the creation of subsequent quinoa germplasm resistant to PHS, which has important implications in regards to cultivation extension and production guidance.
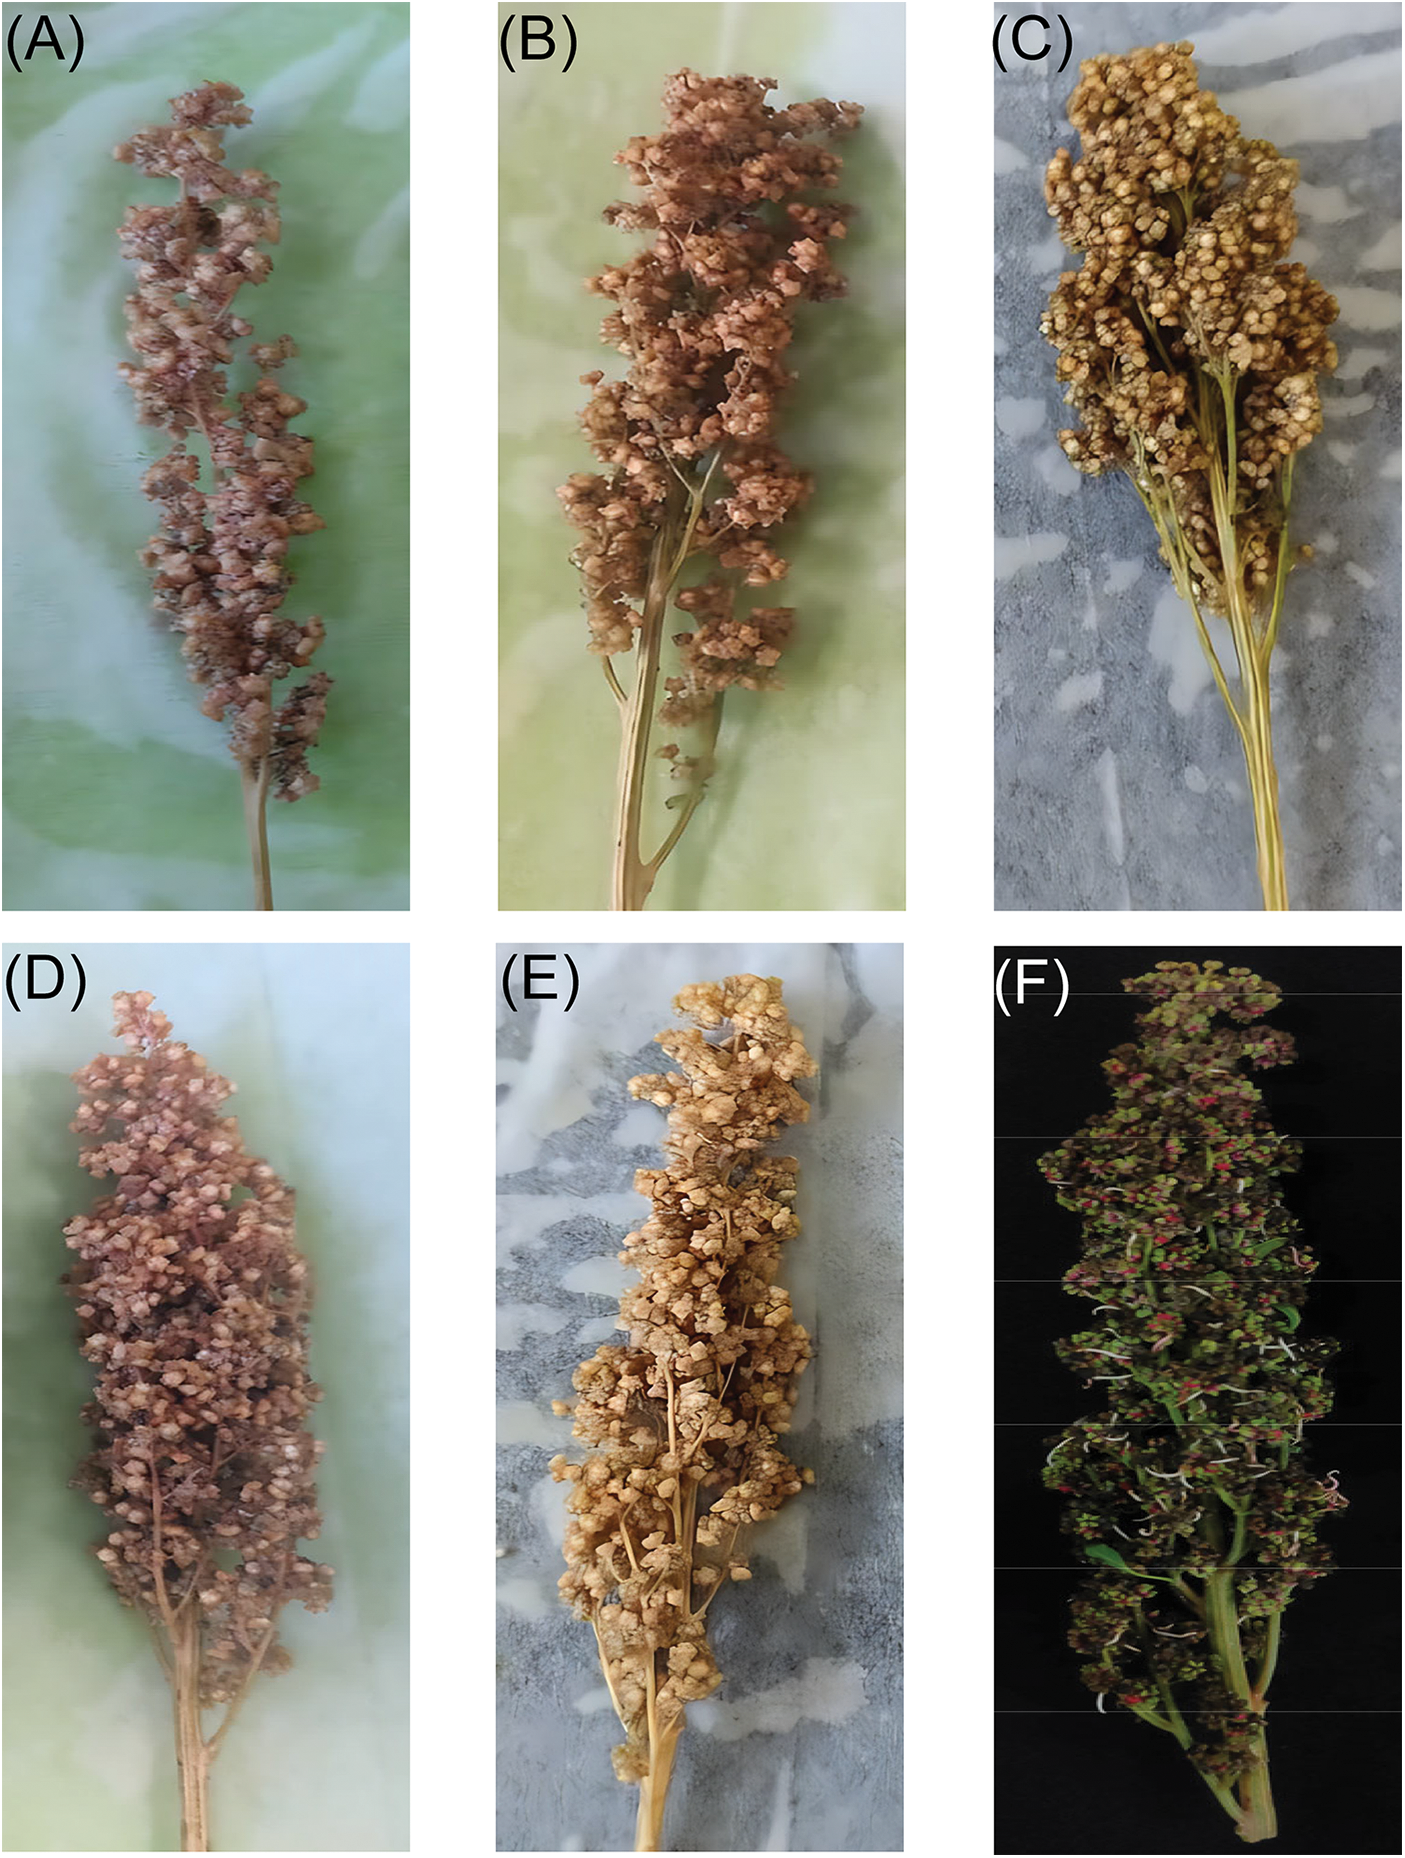
Figure 3: The picture of whole spike germination in 48 h. The excellent agronomic traits and PHS resistance of quinoa varieties were as follows: (A) represents CDU-2 with germination rate of 9.21%, (B) represents CDU-11 with germination rate of 36.85%, (C) represents CDU-12 with germination rate of 28.28%, (D) represents CDU-21 with germination rate of 21.51%, (E) represents CDU-8 with germination rate of 24.15%. (F) represents CDU-31 as the most sensitive variety to PHS, with germination rate of 76.43%
Acknowledgement: Not applicable.
Funding Statement: This study was supported by the Sichuan Science and Technology Program [Grant No. 2022YFQ0041].
Author Contributions: The authors confirm contribution to the paper as follows: study conception and design: Xiaoyong Wu, Yanxia Sun, Xin Pan; data collection: Fang Zeng, Ya Gao, Chunmei Zheng, Wenxuan Ge; analysis and interpretation of results: Xin Pan, Yan Wan; draft manuscript preparation: Xin Pan, Xiaoyong, Wu. All authors reviewed the results and approved the final version of the manuscript.
Availability of Data and Materials: The datasets used and/or analyzed during the current study are available from the author and/or corresponding author on reasonable request.
Ethics Approval: Not applicable.
Conflicts of Interest: The authors declare that they have no conflicts of interest to report regarding the present study.
References
1. Zurita-Silva, A., Fuentes, F., Zamora, P., Jacobsen, S. E., Schwember, A. R. (2014). Breeding quinoa (Chenopodium quinoa Willd.Potential and perspectives. Molecular Breeding, 34(1), 13–30. [Google Scholar]
2. Bazile, D., Pulvento, C., Verniau, A., Al-Nusairi, M. S., Ba, D. et al. (2016). Worldwide evaluations of quinoa: Preliminary results from post international year of quinoa FAO projects in nine countries. Frontiers in Plant Science, 7, 850–868. [Google Scholar] [PubMed]
3. Reguera, M., Conesa, C. M., Gil-Gomez, A., Haros, C. M., Perez-Casas, M. A. et al. (2018). The impact of different agroecological conditions on the nutritional composition of quinoa seeds. PeerJ, 6, e4442–e4462. [Google Scholar] [PubMed]
4. Vega-Galvez, A., Miranda, M., Vergara, J., Uribe, E., Puente, L. et al. (2010). Nutrition facts and functional potential of quinoa (Chenopodium quinoa willd.an ancient Andean grain: A review. Journal of the Science of Food and Agriculture, 90(15), 2541–2547. [Google Scholar] [PubMed]
5. Navruz-Varli, S., Sanlier, N. (2016). Nutritional and health benefits of quinoa (Chenopodium quinoa Willd.). Journal of Cereal Science, 69, 371–376. [Google Scholar]
6. Angeli, V., Miguel Silva, P., Crispim Massuela, D., Khan, M. W., Hamar, A. et al. (2020). Quinoa (Chenopodium quinoa Willd.An overview of the potentials of the “golden grain” and socio-economic and environmental aspects of its cultivation and marketization. Foods, 9(2), 216–247. [Google Scholar] [PubMed]
7. Hussain, M. I., Farooq, M., Syed, Q. A., Ishaq, A., Al-Ghamdi, A. A. et al. (2021). Botany, nutritional value, phytochemical composition and biological activities of quinoa. Plants, 10(11), 2258–2276. [Google Scholar] [PubMed]
8. Sohn, S. I., Pandian, S., Kumar, T. S., Zoclanclounon, Y. A. B., Muthuramalingam, P. et al. (2021). Seed dormancy and pre-harvest sprouting in rice--An updated overview. International Journal of Molecular Sciences, 22(21), 11804–11826. [Google Scholar] [PubMed]
9. Bhargava, A., Shukla, S., Ohri, D. (2006). Chenopodium quinoa—An Indian perspective. Industrial Crops and Products, 23(1), 73–87. [Google Scholar]
10. Pulvento, C., Riccardi, M., Lavini, A., D’Andria, R., Iafelice, G. et al. (2010). Field trial evaluation of two chenopodium quinoa genotypes grown under rain-fed conditions in a typical mediterranean environment in South Italy. Journal of Agronomy and Crop Science, 196(6), 407–411. [Google Scholar]
11. Zhang, X., Wang, S. (2020). Long-term trend of precipitation days for Southeast Tibetan Plateau China. Journal of Agricultural Meteorology, 76(2), 111–118. [Google Scholar]
12. Nonogaki, M., Sall, K., Nambara, E., Nonogaki, H. (2014). Amplification of ABA biosynthesis and signaling through a positive feedback mechanism in seeds. The Plant Journal, 78(3), 527–539. [Google Scholar] [PubMed]
13. Tai, L., Wang, H. J., Xu, X. J., Sun, W. H., Ju, L. et al. (2021). Pre-harvest sprouting in cereals: Genetic and biochemical mechanisms. Journal of Experimental Botany, 72(8), 2857–2876. [Google Scholar] [PubMed]
14. Simsek, S., Ohm, J. B., Lu, H., Rugg, M., Berzonsky, W. et al. (2014). Effect of pre-harvest sprouting on physicochemical properties of starch in wheat. Foods, 3(2), 194–207. [Google Scholar] [PubMed]
15. Nonogaki, H., Barrero, J. M., Li, C. (2018). Editorial: Seed dormancy, germination, and pre-harvest sprouting. Frontiers in Plant Science, 9, 1783–1786. [Google Scholar] [PubMed]
16. Li, C., Ni, P., Francki, M., Hunter, A., Zhang, Y. et al. (2004). Genes controlling seed dormancy and pre-harvest sprouting in a rice-wheat-barley comparison. Funct Integr Genomics, 4(2), 84–93. [Google Scholar] [PubMed]
17. Martinez, S. A., Godoy, J., Huang, M., Zhang, Z., Carter, A. H. et al. (2018). Genome-wide association mapping for tolerance to preharvest sprouting and low falling numbers in wheat. Frontiers in Plant Science, 9, 141–157. [Google Scholar] [PubMed]
18. Upadhyay, M. P., Morris, C. F., Paulsen, G. M. (1988). Characterization of preharvest sprouting resistance in clark’s cream white winter wheat. Euphytica, 38(1), 85–92. [Google Scholar]
19. George, D. W. (1967). High temperature seed dormancy in wheat (Triticum aestivum L.). Crop Science, 7(3), 249–253. [Google Scholar]
20. Daniel, I. O., Adeboye, K. A., Oduwaye, O. O., Porbeni, J. (2012). Digital seed morpho-metric characterization of tropical maize inbred lines for cultivar discrimination. International Journal of Plant Breeding and Genetics, 6(4), 245–251. [Google Scholar]
21. Evers, A. D., Cox, R. I., Shaheedullah, M. Z., Withey, R. P. (1990). Predicting milling extraction rate by image analysis of wheat grains. Aspects of Applied Biology, 25, 417–426. [Google Scholar]
22. Gu, Y., Qian, X., Sun, B., Ma, S., Tian, X. et al. (2022). Nutritional composition and physicochemical properties of oat flour sieving fractions with different particle size. LWT, 154, 112757–112767. [Google Scholar]
23. Hagemann, M. G., Ciha, A. J. (1984). Evaluation of methods used in testing winter wheat susceptibility to preharvest sprouting. Crop Science, 24(2), 249–254. [Google Scholar]
24. Ching, T. M., Foote, W. H. (1961). Post-harvest dormancy in wheat varieties. Agronomy Journal, 53(3), 183–186. [Google Scholar]
25. Mares, D. J. (1984). Temperature dependence of germinability of wheat (Triticum aestivum L.) grain in relation to pre-harvest sprouting. Australian Journal of Agricultural Research, 35(2), 115–128. [Google Scholar]
26. Reddy, L. V., Metzger, R. J., Ching, T. M. (1985). Effect of temperature on seed dormancy of wheat. Crop Science, 25(3), 455–458. [Google Scholar]
27. Yang, Y., Zhao, X. L., Xia, L. Q., Chen, X. M., Xia, X. C. et al. (2007). Development and validation of a Viviparous-1 STS marker for pre-harvest sprouting tolerance in Chinese wheats. Theoretical and Applied Genetics, 115(7), 971–980. [Google Scholar] [PubMed]
28. Gupta, P. K., Rustgi, S., Kumar, N. (2006). Genetic and molecular basis of grain size and grain number and its relevance to grain productivity in higher plants. Genome, 49(6), 565–571. [Google Scholar] [PubMed]
29. Penfield, S. (2017). Seed dormancy and germination. Current Biology, 27(17), R874–R878. [Google Scholar] [PubMed]
30. Ceccato, D. V., Daniel Bertero, H., Batlla, D. (2011). Environmental control of dormancy in quinoa (Chenopodium quinoa) seeds: Two potential genetic resources for pre-harvest sprouting tolerance. Seed Science Research, 21(2), 133–141. [Google Scholar]
31. Moles, A. T., Ackerly, D. D., Webb, C. O., Tweddle, J. C., Dickie, J. B. et al. (2005). Factors that shape seed mass evolution. Proceedings of the National Academy of Sciences of the United States of America, 102(30), 10540–10544. [Google Scholar] [PubMed]
32. Schwarz, P., Horsley, R., McNamara, H. (2018). Preharvest sprouting in the 2002 midwestern barley crop: Occurrence and assessment of methodology. Journal of the American Society of Brewing Chemists, 62(4), 147–154. [Google Scholar]
33. Shorter, S. C., Munro, C. A., Hodgkinson, J. (2005). Predicting pre-harvest sprouting susceptibility in New Zealand wheat cultivars. Euphytica, 143(3), 309–312. [Google Scholar]
34. Yanagisawa, A., Nishimura, T., Amano, Y., Torada, A., Shibata, S. (2005). Development of winter wheat with excellent resistance to pre-harvest sprouting and rain damage. Euphytica, 143(3), 313–318. [Google Scholar]
35. Liu, D. C., Lan, X. J., Wang, Z. R., Zheng, Y. L., Zhou, Y. H. et al. (1998). Evaluation of Aegilops tauschii Cosson for preharvest sprouting tolerance. Genetic Resources and Crop Evolution, 45(6), 495–498. [Google Scholar]
36. Suriyasak, C., Oyama, Y., Ishida, T., Mashiguchi, K., Yamaguchi, S. et al. (2020). Mechanism of delayed seed germination caused by high temperature during grain filling in rice (Oryza sativa L.). Scientific Reports, 10(1), 17378–17389. [Google Scholar] [PubMed]
37. Phan, P. D. T., Van Vu, B. (2021). Improving the pre-harvest sprouting resistance of rice cultivar IR36 using wild rice (Oryza rufipogon) W630. Cereal Research Communications, 50(1), 37–43. [Google Scholar]
38. Lee, J. S., Chebotarov, D., McNally, K. L., Pede, V., Setiyono, T. D. et al. (2021). Novel sources of pre-harvest sprouting resistance for japonica rice improvement. Plants, 10(8), 1709–1722. [Google Scholar] [PubMed]
Cite This Article
 Copyright © 2023 The Author(s). Published by Tech Science Press.
This work is licensed under a Creative Commons Attribution 4.0 International License , which permits unrestricted use, distribution, and reproduction in any medium, provided the original work is properly cited.
 Downloads
 Citation Tools