
 Submit a Paper
 Propose a Special lssue
 Open Access
ARTICLE
Physiological and Biochemical Characteristics and Response Patterns of Salinity Stress Responsive Genes (SSRGs) in Wild Quinoa (Chenopodium quinoa L.)
1
The Key Laboratory for Quality Improvement of Agricultural Products of Zhejiang Province, College of Advanced Agricultural
Sciences, Zhejiang A&F University, Hangzhou, 311300, China
2
College of Agriculture and Biotechnology, Zhejiang University, Hangzhou, 310058, China
* Corresponding Authors: Shuijin Zhu. Email: ; Guoquan Lu. Email:
(This article belongs to the Special Issue: Symbiotic Associations for Nutrients Management and Complexes Formation for Better Agricultural Crops Productivity under Biotic and Abiotic Stresses)
Phyton-International Journal of Experimental Botany 2023, 92(2), 399-410. https://doi.org/10.32604/phyton.2022.022742
Received 24 March 2022; Accepted 10 June 2022; Issue published 12 October 2022
 View Full Text
 Download PDF
Abstract
Cultivating salt-tolerant crops is a feasible way to effectively utilize saline-alkali land and solve the problem of underutilization of saline soils. Quinoa, a protein-comprehensive cereal in the plant kingdom, is an exceptional crop in terms of salt stress tolerance level. It seems an excellent model for the exploration of salt-tolerance mechanisms and cultivation of salt-tolerant germplasms. In this study, the seeds and seedlings of the quinoa cultivar Shelly were treated with different concentrations of NaCl solution. The physiological, biochemical characteristics and agronomic traits were investigated, and the response patterns of three salt stress-responsive genes (SSRGs) in quinoa were determined by real-time PCR. The optimum level of stress tolerance of quinoa cultivar Shelly was found in the range of 250–350 mM concentration of NaCl. Salt stress significantly induced expression of superoxide dismutase (SOD), peroxidase (POD), and particularly betaine aldehyde dehydrogenase (BADH). BADH was discovered to be more sensitive to salt stress and played an important role in the salt stress tolerance of quinoa seedlings, particularly at high NaCl concentrations, as it displayed upregulation until 24 h under 100 mM salt treatment. Moreover, it showed upregulation until 12 h under 250 mM salt stress. Taken together, these results suggest that BADH played an essential role in the salt-tolerance mechanism of quinoa. Based on the expression level and prompt response induced by NaCl, we suggest that the BADH can be considered as a molecular marker for screening salt-tolerant quinoa germplasm at the early stages of crop development. Salt treatment at different plant ontogeny or at different concentrations had a significant impact on quinoa growth. Therefore, an appropriate treatment approach needs to be chosen rationally in the process of screening salt-tolerant quinoa germplasm, which is useful to the utilization of saline soils. Our study provides a fundamental information to deepen knowledge of the salt tolerance mechanism of quinoa for the development of salt-tolerant germplasm in crop breeding programs.Keywords
Soil salinity is one of the most influential environmental factors limiting plant germination, growth, and development. Excessive salt forces plant roots to absorb large amounts of sodium (Na+) and chlorine (Cl−), thus interfering with potassium (K+) balance, cellular activity, metabolism, and photosynthesis, which leads to the accumulation of reactive oxygen species (ROS), osmotic stress and ionic toxicity [1]. Hyperionic and hyperosmotic stress disturbs the whole metabolic activities, limiting crop plant productivity [2]. Soil salinization is a serious problem that is causing crop yields to plummet and causing other problems [3]. Cultivating salt-tolerant crops, in addition to improving soil composition and structure, is a viable strategy to successfully utilize saline-alkali land and alleviate the problem of saline soil underutilization.
Chenopodium quinoa L., a protein-comprehensive cereal in the plant kingdom, can provide balanced nutrition for the human body, with a high protein content of 13%–23%, coupled with nine essential amino acids and minerals, such as calcium, iron, zinc, copper, manganese, and magnesium. Unsaturated fatty acids, flavonoids, vitamin B, E, and other beneficial ingredients make it a good adjuvant therapy for the high-risk population (hypertension, hyperlipidemia, hyperglycemia and diabetes mellitus) and post-disease rehabilitation. Furthermore, quinoa is regarded as one of the most promising crops for the future. Its resilience to biotic and abiotic challenges has earned it a prominent place in sustainable food production on marginal soils [4]. The salt-tolerant nature of quinoa provides an excellent research model for exploring salt tolerance mechanisms and the cultivation of salt-tolerant germplasms.
Shreds of evidence from previous reports have supported that superoxide dismutase (SOD), peroxidase (POD), and betaine aldehyde dehydrogenase (BADH) are core enzymatic antioxidants involved in different natural stress resistance mechanisms of plants. SOD plays a key role in protection against oxidative stress by scavenging superoxide radicals conversion into oxygen and hydrogen peroxide that is removed by POD and catalase in cells [5]. Concurrently, high expression of BADH promotes the accumulation of Glycine betaine (GB) in cells and improves plants’ tolerance to environmental stress [6–9]. These crucial enzymes effectively function in many plants, such as rice, cotton, poplar, and so on [10–13]. Several studies have paid close attention to the variation of seed germination and stress tolerance components under salt stress in quinoa crops. Experiments on seed germination and seedling growth revealed that salt stress had a significant effect on quinoa seeds and seedlings. Different sodium salts have a varying effect on germination and seedling growth [14]. The salt tolerance varied significantly in different cultivars, of which “Qinli 1” was well-tolerant to sodium salt solution of 300 mM, while “Gongzha 5” was only against 100 mM [15]. Overall, NaCl solution of 500 mM resulted in a lethal dose (LD) of seed and seedling of quinoa [15–17]. According to research on stress-tolerance components, such as antioxidant enzymes and Osmo-regulators, quinoa can adjust its soluble sugar and proline content, as well as the activities of SOD, POD, (catalase) CAT, and ascorbate peroxidase (APX), and decrease its Malondialdehyde (MDA) content, to adapt to the salt-stressed environment [17]. In general, a cultivar with higher stress-resistant components and a lower MDA content indicates an excellent ability to predict a plant’s salt stress tolerance. Yuan et al. [18] assessed the effects of different NaCl concentrations on quinoa seed germination and seedling growth. They evaluated the salt tolerance of three cultivars according to their performances of MDA, SOD, and POD linked with growth attributes [18]. The salt tolerance of “Longli 1”, the first domestically bred quinoa cultivar in China, was identified based on the response of chlorophyll II, soluble sugar, proline, MDA, and the activities of antioxidant enzymes to NaCl stress, which concluded that its salt threshold was 200–300 mmol/L. A quinoa BADH complete gene (CqBADH1) was first cloned and sequenced by Jiang et al. [19], who found that CqBADH1 was expressed only in root and depicted time-dependent expression profiles under NaCl-stress conditions. NaCl stress leads to increased levels of CqBADH1, accompanied by the accumulation of GB [19].
To date, few studies related to the molecular expression profile of quinoa are available; therefore, in this paper, we focused on the response patterns of three salt stress responsive genes (SSRGs) viz. (SOD, POD, and BADH) under NaCl stress as well as the physiological and biochemical characteristics in quinoa.
The quinoa variety Shelly (Shelly 23 Black) was originated from South America. The quinoa seedlings were grown in the growth chamber (Saifu, China) under a 16/8 h light/dark photoperiod at 25°C temperature. Seedlings were treated with NaCl concentrations (100, 150, 250, 350, and 450 mM) for 15 days after sowing. Another treatment was the 15th-day seedlings (non-NaCl-stressed) were shocked with NaCl solution (100 and 250 mM) for 1 to 24 h, respectively.
2.2 Identification of Physiological Indices
Germination energy (GE) was the proportion of the germinated seeds in four days to total seeds. Germination percentage (GP) was computed as the proportion of the germinated seeds in fifteen days to total number of seeds. Germination index (GI) was determined using the formula [∑(Gt/Dt)] where Gt refers to the number of germinated seeds every day, and Dt refers to the number of days to germination. Vigour index (VI) was determined by the formula (GI × seedling fresh weight). Ten seedlings were randomly selected to measure each replication’s plant height and fresh weight. All data are expressed as mean ± standard deviation. R software package ggplot2 was used to draw the figures, and a linear model was used to draw the shaded area to depict 95% confidence interval (CI).
2.3 Estimation of the MDA Content
On the fifteenth day after germination, the malondialdehyde (MDA) levels of leaf tissues were measured to estimate the extent of lipid peroxidation, in compliance with the report of Heath et al. [20]. R software package ggplot2 was used to draw the figure, and a linear model was used to draw the shaded area to depict 95% CI.
2.4 Activity Assay of SOD, POD, and BADH
SOD activity was assayed following the method of Giannopotitis et al. [21]. POD activity was assayed by measuring absorption change at 470 nm based on a previous description [22]. The BADH activity was tested by an ultraviolet spectrophotometer at 340 mm, as described by Guo et al. [23].
2.5 Quantitative Real-Time PCR (qPCR)
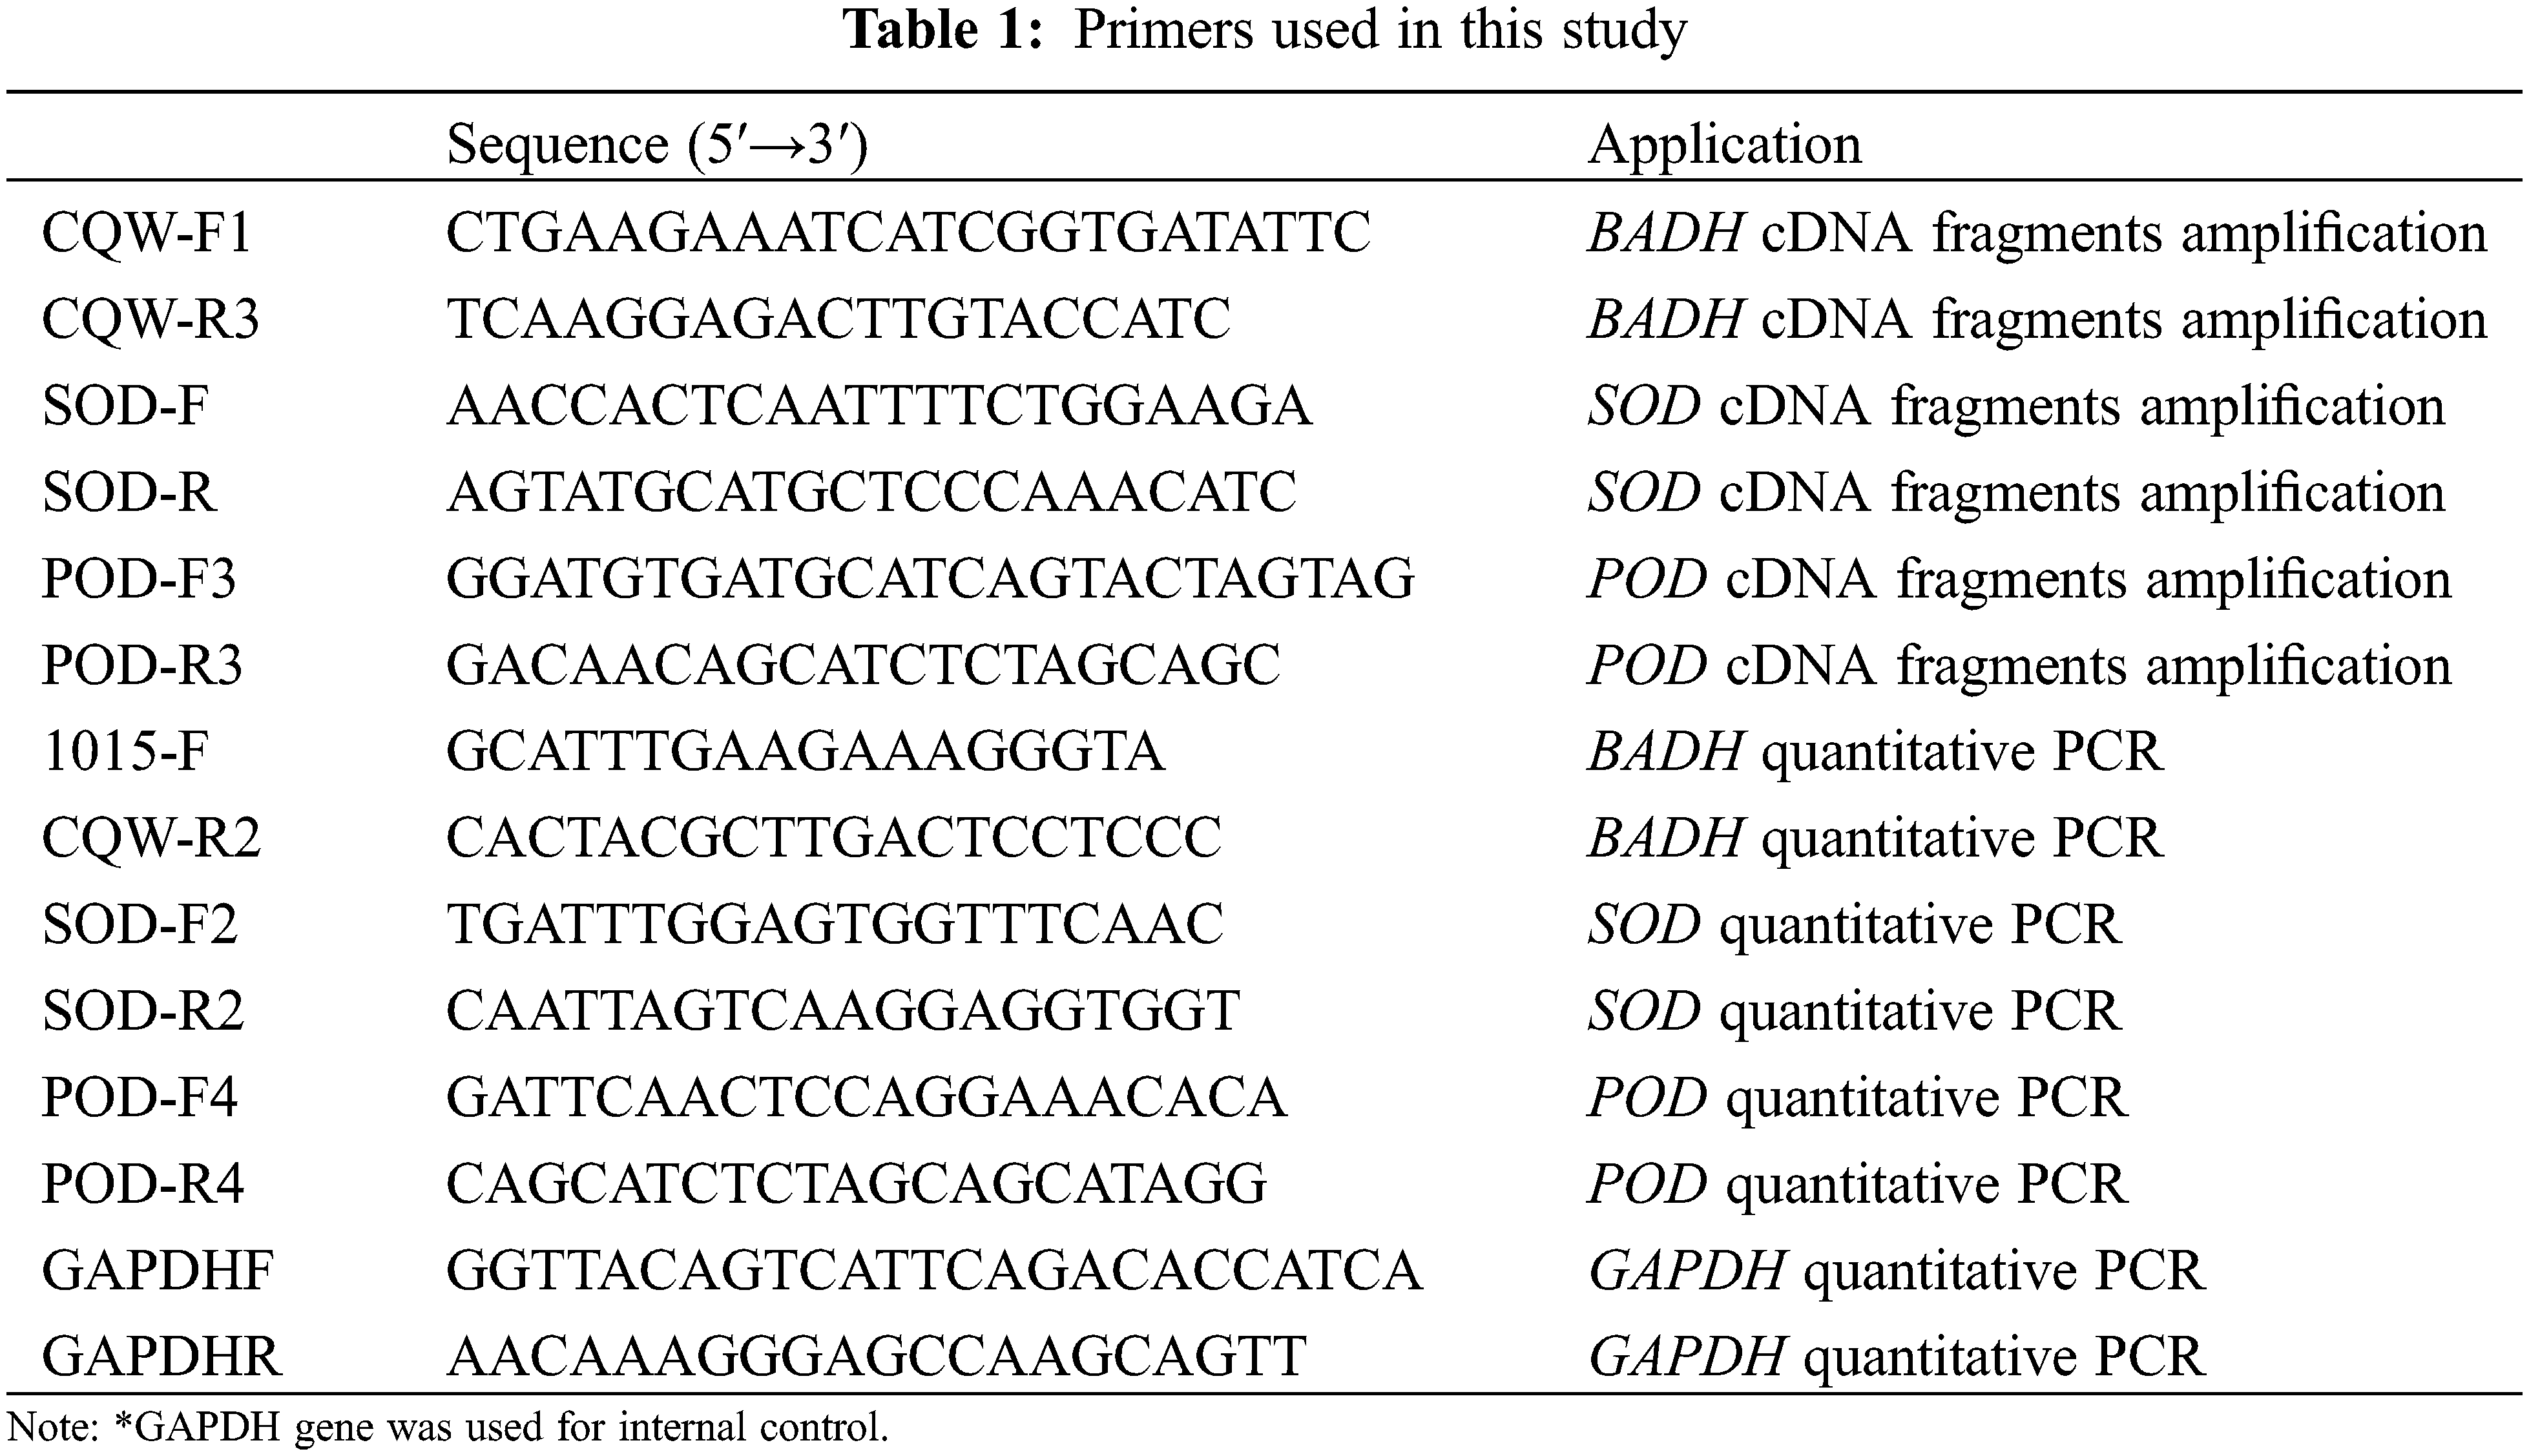
Total RNA was isolated from the root and leaf of 15-day old seedlings using TRIZOL reagent (Invitrogen, America) and then treated with Recombinant DNase I (TaKaRa, Japan) to remove the residual DNA. cDNA was synthesized by reverse transcriptase M-MLV (TaKaRa, Japan) according to the manufacturer’s instructions. The SuperReal Premix Plux with SYBR Green I (TIANGEN, China) was used for qPCR with expression primers. The glyceraldehyde-3-phosphate dehydrogenase (GAPDH) gene was amplified as an internal control [24]. qPCR amplification was in 20 μL reactions containing cDNA 50 ng, 10 uL IQ SYBR Green Super-mix, and 0.4 μM primer. The qPCR was performed with CFX connect Real-Time PCR System (Bio-Rad, America) under the following conditions: 94°C for 5 min, followed by 40 cycles of 94°C for 10 s, 57°C–60°C for 20 s, 72°C for 30 s and plate read, melt curve 65°C to 95°C with increment 0.5°C for 10 s and plate read. The Ct (cycle threshold) value was used as a measure for the starting copy numbers of the target gene. The relative expression level of each gene was standardized to the expression level of the GAPDH, calculated by the formula Y = 10 − (ΔCt/3) (ΔCt is the differences of Ct between the target gene and the control GAPDH products; ΔCt = Ct Target Gene−Ct GAPDH) [25]. Primers list have been given in the Table 1 below.
2.6 Bioinformatics and Statistical Analyses
Sequences were retrieved from GenBank databases (http://ncbi.nlm.nih.gov) using the BLASTN program. Multiple sequence alignments were performed by MEGA version 4.0 [26], and significance analysis was conducted by the Kruskal-Wallis test with a 95% confidence interval using IBM SPSS version 19.0 program. Differences were considered significant, that labelled by different lowercase letters when the p-value was less than 0.05. All experiments were repeated three times.
3.1 Identification of Salt Tolerance
Quinoa Seedlings were treated with five concentrations of NaCl solutions (100, 150, 250, 350, and 450 mM, the 0 mM as control) to assess the salt tolerance of quinoa. Then six indices, fresh weight, germination energy (GE), germination index (GI), germination percentage (GP), plant height, vigour index (VI), were measured. What can be clearly seen in (Fig. 1a) is that the fresh weight of seedlings was significantly higher than the control group (0 mM) at all treatment points except at 450 mM salt stress. It is evident from the (Fig. 1b) that GE remained unchanged at 100 and 150 mM stress treatment, however significant difference was found at 250, 350 and 450 mM stress treatments as compared to the control group. A continuously declining trend was observed at almost all treatments levels of NaCl stress for GI as compared to the control (Fig. 1c). There were no significant differences of GP at 0 mM, 100 and 150 mM salt stress levels however 250, 350 and 450 mM stress levels significantly decreased the GP as compared to the control group. These results depict that germination level of Shelly black quinoa cultivar can tolerate 350 mM salt stress, however 450 mM salt stress can reduce germination up to 40%. Plant height and VI are non-significantly affected until 350 and 250 mM salt stress as compared to the control group however higher concentrations significantly reduced both the parameters as compared to Ck (Figs. 1d and 1e).
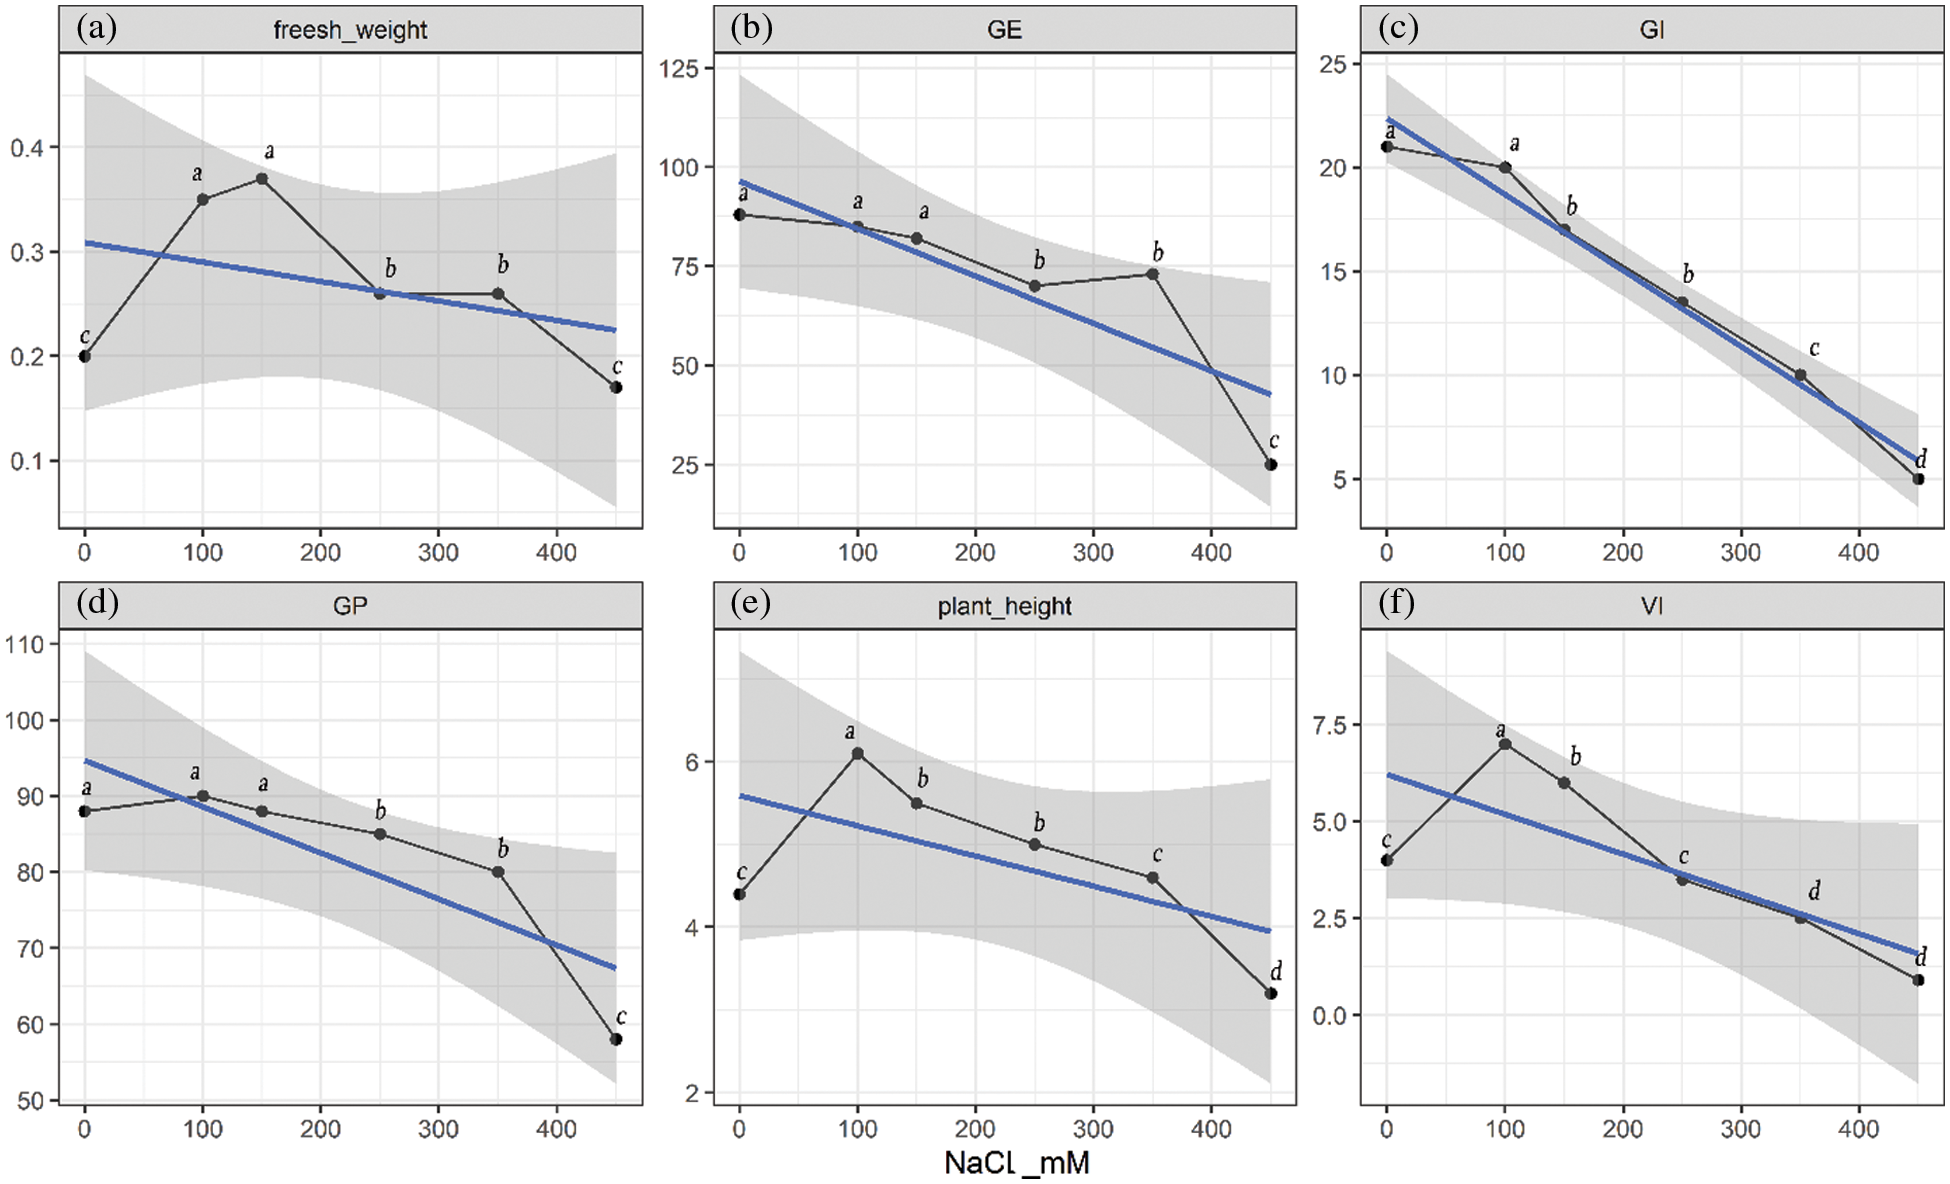
Figure 1: Quinoa physiological index of seed germination and seedling growth under different NaCl-concentration conditions. The grey shaded area shows 95% confidence interval, blue line is the trend line that shows overall decreasing trend of the parameters; black curved line shows the values of parameters at specific concentrations of NaCl (a) fresh weight (g), (b) GE represented germination energy, (c) GI represented germination index, (d) GP represented germination percentage, (e) plant height (cm), (f) VI represented vigour index. Different letters within each curved line represent statistically significant differences (p ≤ 0.05)
What stands out in these figures at 350 and 450 mM NaCl, the GI, VI, GE, and GP of quinoa were significantly lower than that of the control group, which showed that seedlings could not manage higher salt concentrations. In compliance with the data, the salt tolerance threshold of the quinoa Shelly was found to be 250–350 mM.
MDA content indicates the extent of oxidative stress and lipid peroxidation in the cell membrane [27]. What is striking in this (Fig. 2) is the continued increase in MDA content with the increase of salt concentration, which indicates that lipid peroxidation is triggered at the very onset of salt stress. But the increase starts at 150 mM because there is no increase in MDA content between 0 and 150 mM. The MDA content in the leaf increased gradually as the NaCl concentration increased (Fig. 2). At 250, 350, and 450 mM NaCl, the MDA content was significantly higher than that of the control (Fig. 2), indicating the occurrence of oxidative stress induced by NaCl stress.
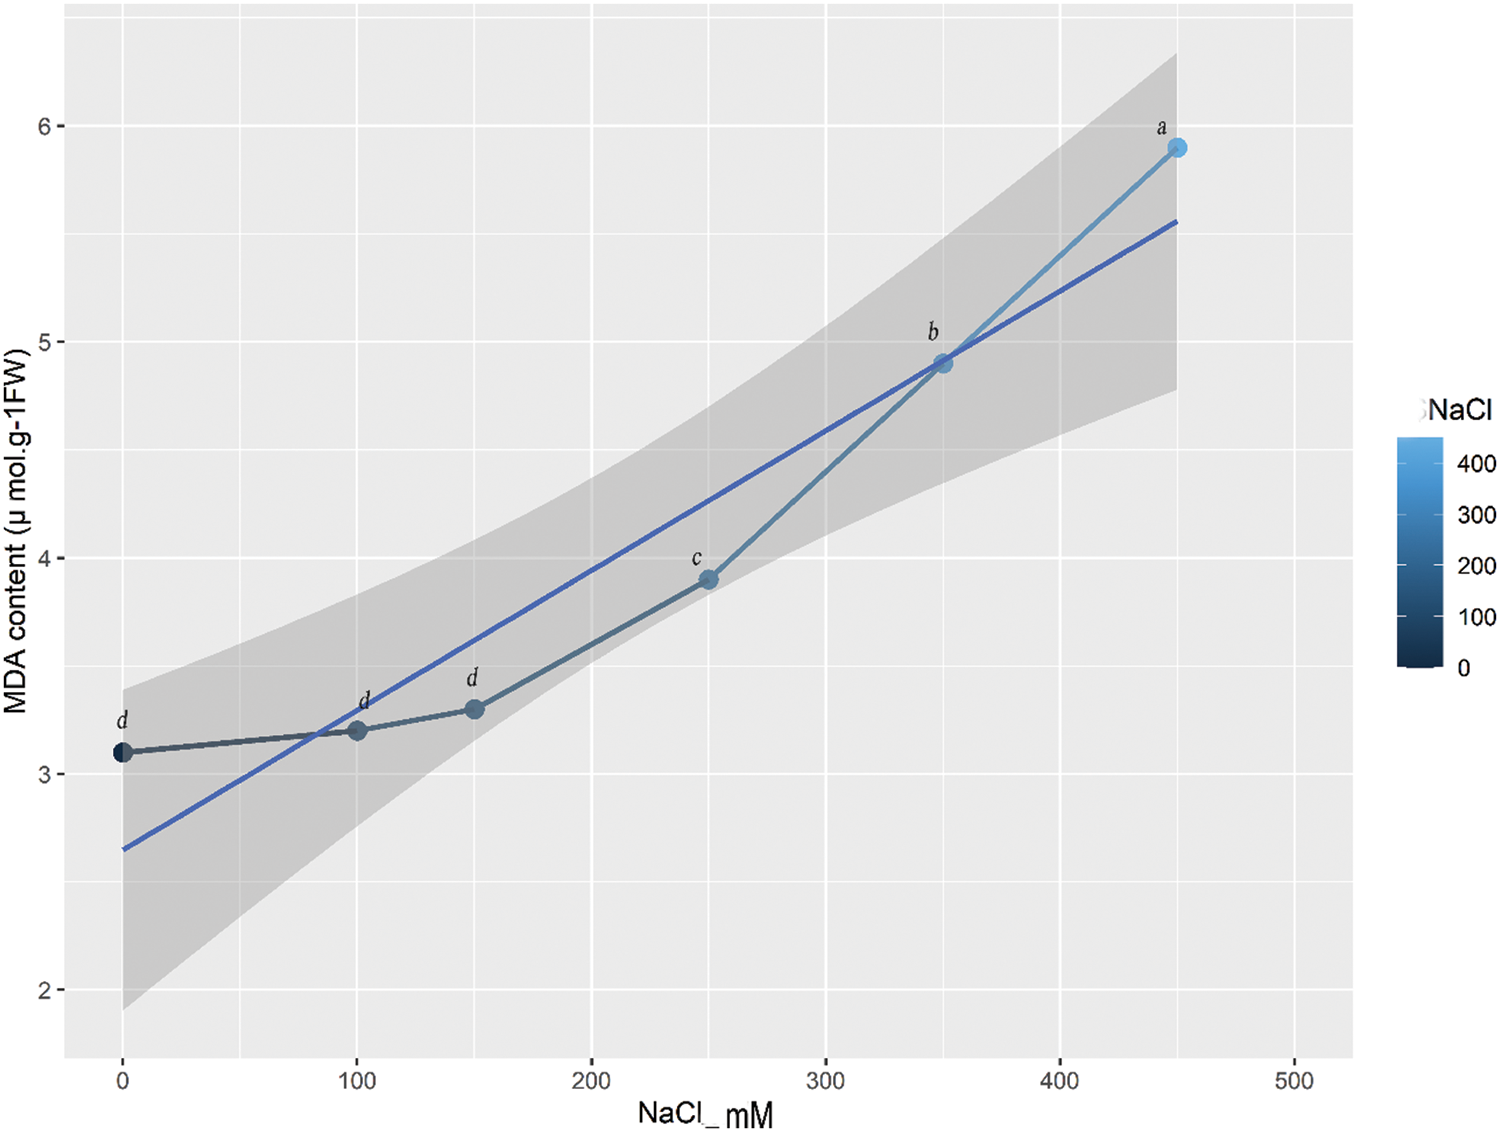
Figure 2: The MDA contents of quinoa under salt stress with different NaCl concentrations. The grey line with symbols shows a gradual increase in MDA content. Equalletters on symbols indicate that there are no significant differences among them. Different letters on symbols show the presence of significant differences among them at p ≤ 0.05
3.3 Enzymes Activities of SOD, POD, and BADH
The BADH activity boosted to the maximum at 38.8 nmolg−1min−1 at 350 mM NaCl, which was significantly higher than that of the control (7.6 nmolg−1min−1) (Fig. 3a). Interestingly, compared with SOD and POD, the activity of BADH, despite declining, still maintained a high level (27.3 nmolg−1min−1) at 450 mM NaCl. The variation trend of POD activity (Fig. 3b) was similar to that of SOD. When the NaCl concentration reached 250 mM, the POD activity rose to the highest level of 96.2 μg−1 FWmin−1, and there was a significant difference between the POD value at 250 mM and the control (Fig. 3b). The SOD activity increased to 129.3 μg−1 FWmin−1 at 100 mM NaCl and peaked at 154.9 μg−1 FW min−1 at 250 mM NaCl. The SOD activity at 250 mM NaCl was significantly higher than that of the control (125.8 μg−1 FWmin−1) (Fig. 3c). However, the activities of POD and SOD fell to the lowest value at 450 mM (Figs. 3b and 3c).
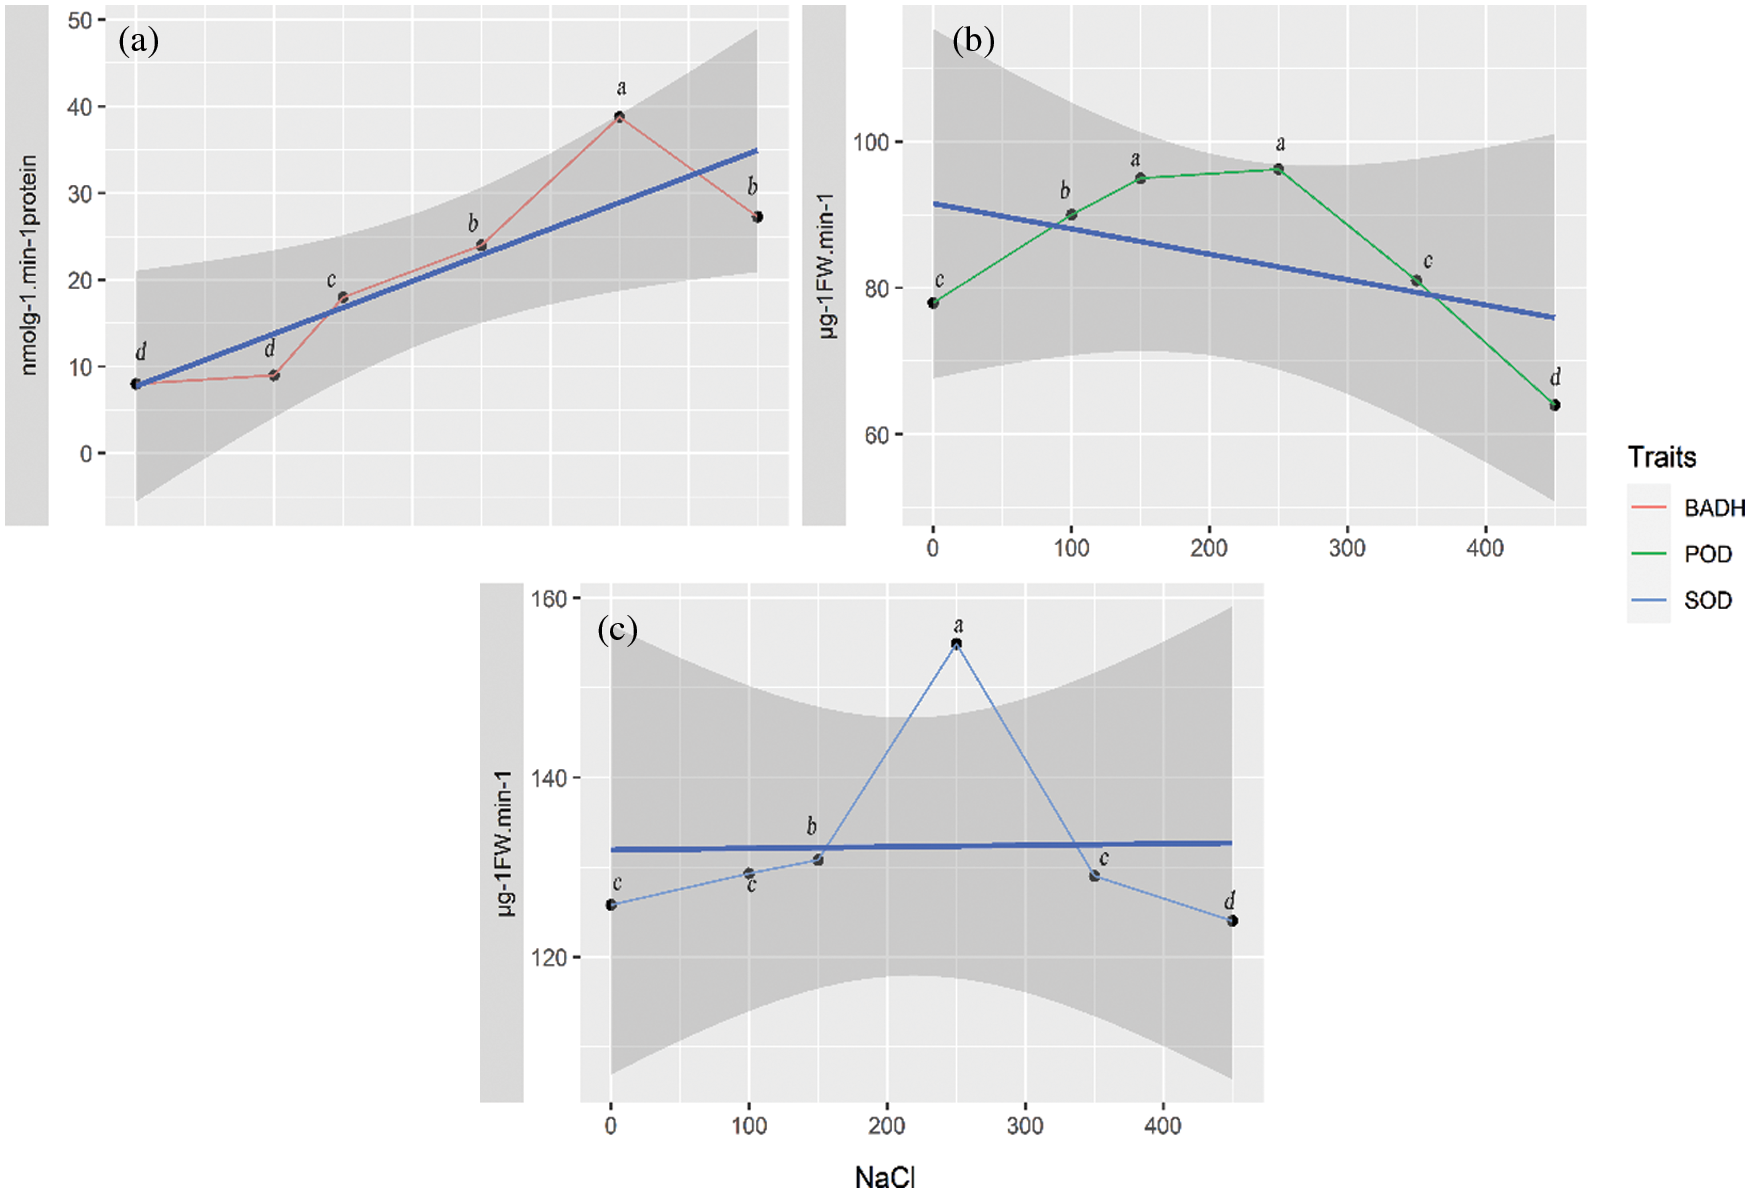
Figure 3: The BADH, POD and SOD activities (response) in quinoa under salt treatments with different NaCl concentrations. (a) BADH activity, (b) POD activity, (c) SOD activity. The thick blue line shows an overall trend for any trait by the linear model, and the grey shaded area shows 95% confidence interval CI. Symbols with the same letter are not significantly different and those with different letters are significantly different at p ≤ 0.05
3.4 Expression Patterns of SOD, POD, and BADH Genes
Analysis of gene expression profile can help reveal possible functions of genes in different tissues and conditions of the plant. To explore the potential function of SOD, POD, and BADH in quinoa, the tissue-specific expression profiles were analyzed in quinoa roots and leaves under different NaCl concentrations (0, 100 and 250 mM). The expression levels of BADH and SOD genes in roots were much higher than those in leaves, and their expression significantly increased in NaCl-stressed roots at different concentrations as compared to control (0 mM). In contrast, POD gene expression only increased in leaves, that depicts high lipids peroxidation in leaves than roots (Fig. 4b), proving that roots are the primary plant tissues that respond to the salt stress and maintain their osmolytes concentrations. Moreover, the genes showed temporal differential expression levels in the plants exposed to different levels of NaCl-stress at 0, 1, 2, 6, 12, and 24 h. The expression levels of BADH and POD genes increased from 6 to 24 h treatment, while the expression of SOD gene has upregulated at 6h under 100 mM NaCl solution (Fig. 5a). When the salt concentration reached 250 mM, the expression level of BADH gene reached the maximum at 12 h from the steady initiation and then started a gradual decrease with a dramatic fall at 24 h (Fig. 5b). However, it did not seem to be a clear difference between SOD and POD (Fig. 5b). Taken together, the expression results implied that BADH, SOD, and POD genes participated in the progressive tolerance to NaCl stress in quinoa, of which the BADH gene was more responsive to salt stress signalling and played a crucial role, especially under high NaCl concentrations.
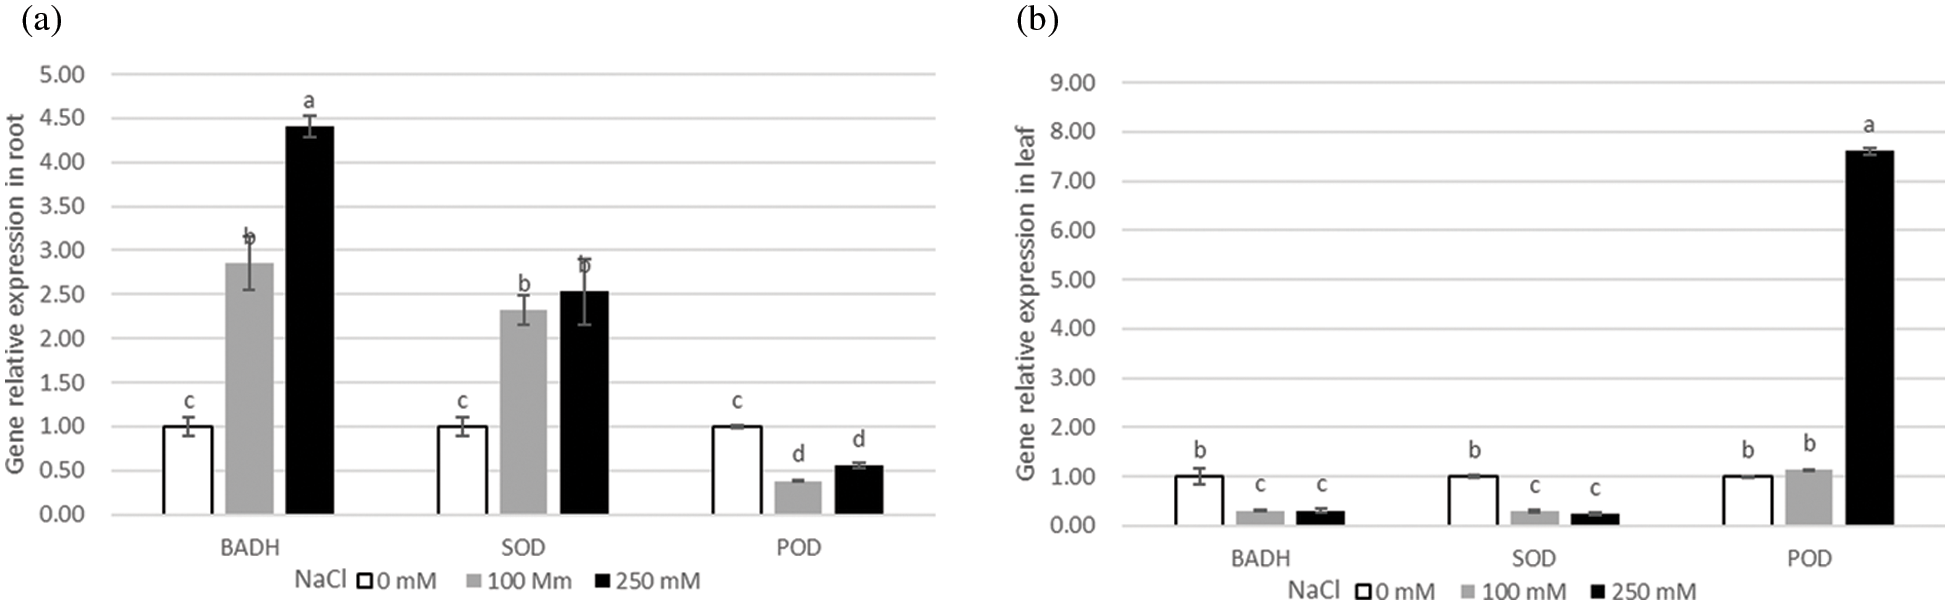
Figure 4: Relative expression of BADH, SOD, and POD genes under salt treatments with different NaCl concentrations (0, 100, 250 mM). (a) relative expression of BADH, SOD, and POD genes in roots, (b) relative expression of BADH, SOD, and POD genes in leaves
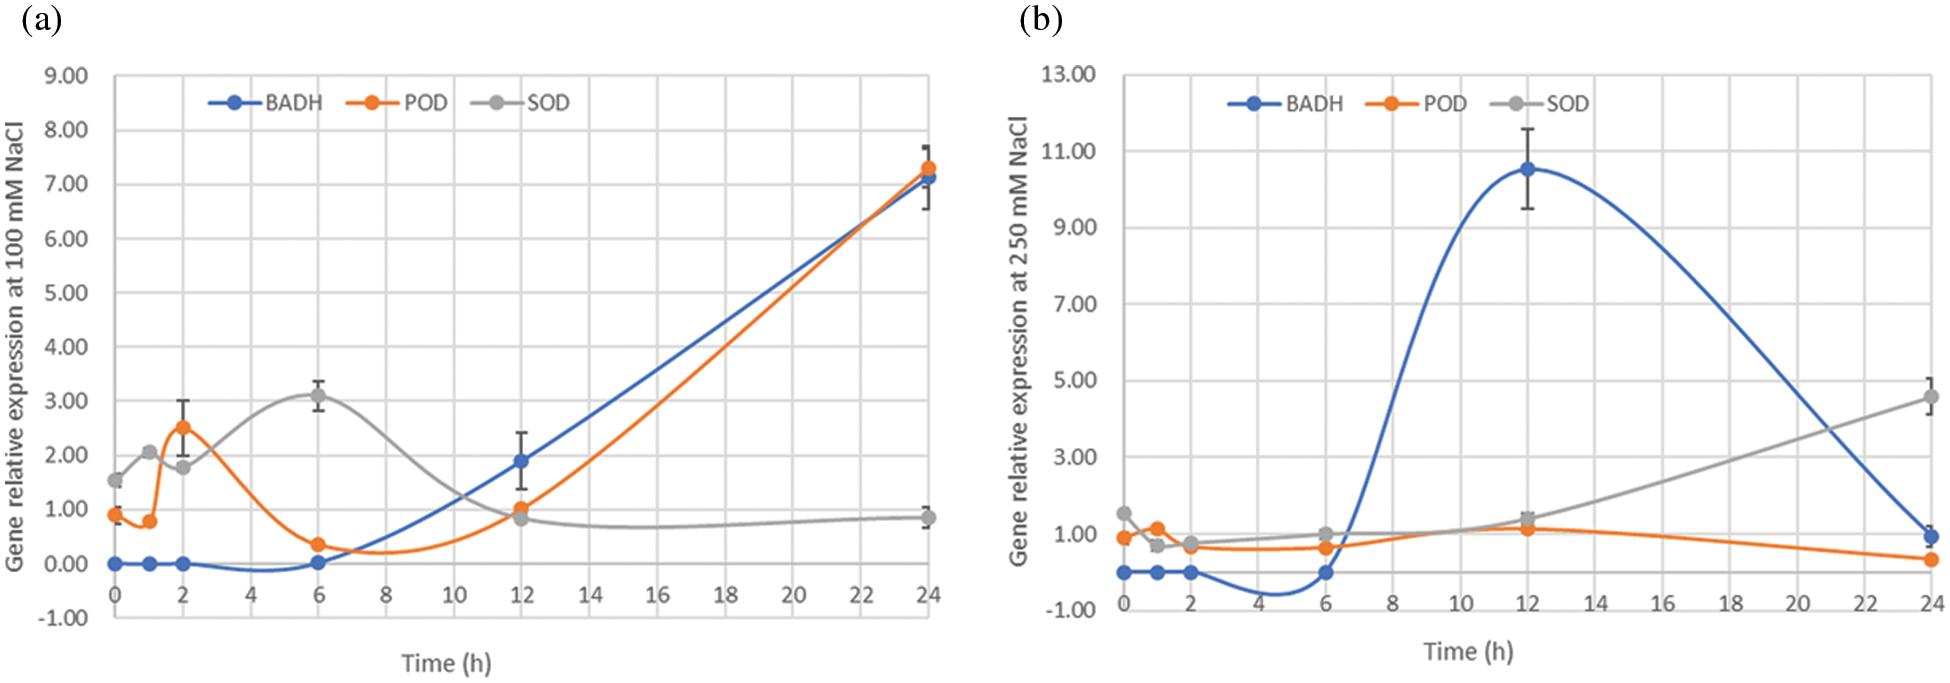
Figure 5: Relative expression of BADH, POD, and SOD genes in the 15-day quinoa seedlings treated with NaCl (100 or 250 mM) for 0, 1, 2, 6, 12, and 24 h. (a) Gene expression pattern in quinoa treated with 100 mM NaCl, (b) Gene expression pattern in quinoa treated with 250 mM NaCl
Quinoa has emerged as a promising crop for cultivation in salt-affected soils due to its high salt tolerance [28]. A study conducted by Panuccio et al. [29] suggested that the quinoa crop has evolved a special mechanism of salt exclusion strategy to avoid salinity stress under mild salt conditions. Our study found that low salt concentrations have minimum effects on the germination and growth of quinoa Shelly, which was well-tolerant to 250 mM NaCl. Our findings are consistent with a previous study on some similar traits [29]. This early-stage adaptation to salinity stress was a consequence of the low concentration of Na+ and Cl− in roots compared to the soil medium, suggesting that plants actively excluded Na+ and Cl− from their roots as described in a previous study [28]. According to this mechanism, plants face the potential challenge of active uptake of water against the concentration gradient. This mechanism was further supported by an in silico study conducted by Jarvis et al. [30]. An in silico assessment of ion transporters annotated in the quinoa genome discovered a high diversity and number of K+, Na+, and C− transporters in quinoa compared to other species reported in the literature.
However, a high concentration of NaCl solution (350 mM) significantly inhibited quinoa germination and seedling growth, resulting in a decrease in seed germination rate, germination energy, germination index, and vigor index when compared to the control.
It is found in the literature that when quinoa plants are subjected to a medium with elevated Na+ (salt treatment), plant [K+] level generally declines as [Na+] rises [31]. A major growth constraint of salt stress is a Na+ induced K+ deficiency that can disrupt cell metabolism.
The MDA content indicates the extent of oxidative stress in the cell membrane as well as plants’ osmolyte imbalance [27]. MDA levels increased rapidly in our study when the salt concentration was increased (Fig. 2), which depicts the occurrence of oxidative stress induced by NaCl stress. Cai et al. [32] discovered that the activities of each antioxidant enzyme (SOD, POD, and CAT) increased when compared to the control. Nonetheless, MDA did not accumulate significantly at the lowest salt level (100 mM NaCl), corroborating our findings that MDA contents accumulate under high salinity stress. Meanwhile, the activities of the antioxidant enzymes SOD and POD that could be destroyed by high salt concentrations went down significantly (Figs. 3b and 3c). A considerable increase in MDA content at higher salt levels is evidence of more membrane damage due to the high-level production of reactive oxygen species (ROS) [32]. Interestingly, a lower salt solution concentration (≤250 mM) significantly induced the activity of SOD, POD, and BADH, the seed vigour index and fresh weight of quinoa increased significantly (Figs. 1 and 3). This specified that the low salt condition contributed positively to the germination and growth of quinoa. This might be because of the early and non-lethal effect of the salt stress stimulus. As a result, the plant detects the stress signals and starts producing a maximum level of antioxidant enzymes to cope with the unsuitable conditions ahead. This ultimately positively upregulate the morpho-physiological functions of plants [32]. These phenomena were also observed in other reports, in which the growth of cultivar Kasala’s seedlings was promoted under NaCl concentrations ≤1.8% (w/v), equates to 300 mM [33]. The germination of other quinoa cultivars, like Yanli 47 and 48, was promoted by NaCl concentrations of 0.6% (w/v) that, equates to 100 mM.
There were differences in salt stress responses among the three stress-responsive genes, with BADH being the most sensitive to NaCl stress. According to our findings, the salt stress response of SOD and POD activity was greatest at about 250 mM NaCl, while BADH showed highly significant activity at 350 mM NaCl. (Fig. 3a). The possible reason for this response pattern of SOD, POD, and BADH is cited in literature that SOD and POD act as the first line of defense against salinity stress tolerance mechanism and send stress signals in different forms like elevated levels of H2O2 to protect themselves [31–34].
Tissue-specific expression patterns revealed that the expression levels of BADH and SOD genes were higher in the root than in the leaf tissues, while POD was lowest in the root and highest in the leaf, indicating the diversity of expression and participation of the genes in salt tolerance. The dynamic genes expression level in real-time under salt stress showed that BADH was more responsive to salt stress than POD and SOD (Fig. 5a). Salt stress treatment of 250 mM NaCl inhibited the POD and SOD gene expressions throughout the process as well as made the seedlings dehydrated, which indicated that the upstream enzymes on the synthesis pathway of the POD and SOD might prematurely be deactivated. Therefore, we consider that the osmotic regulator is more stable than the antioxidant enzymes in the NaCl tolerance mechanism of quinoa. The salt stress usually leads to the osmotic imbalance in plant cells [35]. GB is one of the most crucial cellular osmolytes that plays a critical role in osmotic adjustment and protection of enzyme activities from abiotic stresses, such as cold, heat, and salt [6,36,37]. It has been reported that GB stabilizes the quaternary structure of complex proteins such as antioxidant enzymes and oxygen-evolving PSII; genes encoding BADH catalyze the transformation of betaine aldehyde (BA) into GB and has a pivotal role in the synthesis of GB [38]. These findings corroborate the fact that expression level and response of the BADH gene induced by salt stress is one of the important indicators of salt stress tolerance in quinoa germplasm.
Quinoa depicted distinct patterns of response toward different levels of stress. One of the treatments, the salt-shocked one, under 250 mM NaCl concentration for 24 h, could lead to lethal destruction of the 15-day old seedlings. In comparison, plants with another treatment that cultivated under high salt stress environment beginning from seed germination could survive despite its inhibited growth. It implies that, during the whole plant ontogeny from germination to tissue differentiation, seeds have sufficient time for self-adjustment to acclimatize to a high salinity environment. Therefore, an appropriate treatment approach or transplanting time needs to be chosen reasonably in the process of introduction or cultivation of salt-tolerant quinoa. Our study is useful to deepen the knowledge of the salt tolerance mechanism of quinoa and breeding salt-tolerant germplasms for cultivation on saline-alkali land.
Authorship: Conceptualization, Yurong Jiang. Methodology, Guoquan Lu. Formal analysis, Yuefen Cao. The investigation, Tongli Yan. Data curation, Lijia Hu. Writing—original draft preparation editing and review, Muhammad Yasir. Supervision, Shuijin Zhu.
Funding Statement: The research was supported jointly by the Public Project of Science Technology Department of Zhejiang Province (Grant No. 2016C02050-9-9) to Y. Jiang and the Zhejiang Provincial Natural Science Foundation of China (Grant No. Y21C130006) to Y. Jiang, and the Key Research and Development Project of Zhejiang Province (Grant No. 2021C02057) to G. Luo.
Conflicts of Interest: The authors declare that they have no conflicts of interest to report regarding the present study.
References
1. Du, C., Zhao, P., Zhang, H., Li, N., Zheng, L. et al. (2017). The Reaumuria trigyna transcription factor RtWRKY1 confers tolerance to salt stress in transgenic Arabidopsis. Journal of Plant Physiology, 215, 48–58. DOI 10.1016/j.jplph.2017.05.002. [Google Scholar] [CrossRef]
2. Munns, R. (2002). Comparative physiology of salt and water stress. Plant, Cell & Environment, 25(2), 239–250. DOI 10.1046/j.0016-8025.2001.00808.x. [Google Scholar] [CrossRef]
3. Munns, R., James, R. A., Läuchli, A. (2006). Approaches to increasing the salt tolerance of wheat and other cereals. Journal of Experimental Botany, 57(5), 1025–1043. DOI 10.1093/jxb/erj100. [Google Scholar] [CrossRef]
4. Shi, Z., Yang, X., Yao, Y., Ren, G. (2017). Quality characters analysis of the seed of 60 domestic and overseas quinoa accessions. Journal of Plant Genetic Resources, 18(1), 88–93. DOI 10.13430/j.cnki.jpgr.2017.01.011. [Google Scholar] [CrossRef]
5. Hernandez, J., Olmos, E., Corpas, F., Sevilla, F., Del Rio, L. (1995). Salt-induced oxidative stress in chloroplasts of pea plants. Plant Science, 105(2), 151–167. DOI 10.1016/0168-9452(94)04047-8. [Google Scholar] [CrossRef]
6. Chen, T. H., Murata, N. (2008). Glycinebetaine: An effective protectant against abiotic stress in plants. Trends in Plant Science, 13(9), 499–505. DOI 10.1016/j.tplants.2008.06.007. [Google Scholar] [CrossRef]
7. Bao, Y., Zhao, R., Li, F., Tang, W., Han, L. (2011). Simultaneous expression of Spinacia oleracea chloroplast choline monooxygenase (CMO) and betaine aldehyde dehydrogenase (BADH) genes contribute to dwarfism in transgenic Lolium perenne. Plant Molecular Biology Reporter, 29(2), 379–388. DOI 10.1007/s11105-010-0243-8. [Google Scholar] [CrossRef]
8. Fitzgerald, T. L., Waters, D. L., Henry, R. J. (2009). Betaine aldehyde dehydrogenase in plants. Plant Biology, 11(2), 119–130. DOI 10.1111/j.1438-8677.2008.00161.x. [Google Scholar] [CrossRef]
9. Li, C., Zhang, T., Feng, P., Li, D., Brestic, M. (2021). Genetic engineering of glycinebetaine synthesis enhances cadmium tolerance in BADH-transgenic tobacco plants via reducing cadmium uptake and alleviating cadmium stress damage. Environmental and Experimental Botany, 191, 104602. DOI 10.1016/j.envexpbot.2021.104602. [Google Scholar] [CrossRef]
10. Chen, R., Ye, J., Wang, R. (2011). Research progress on salt-stress in rice. Chinese Journal of Tropical Agriculture, 21(3), 87–93. DOI 10.3969/j.issn.1009-2196.2011.03.019. [Google Scholar] [CrossRef]
11. Zhang, X. Y., Liang, C., Wang, G. P., Luo, Y., Wang, W. (2010). The protection of wheat plasma membrane under cold stress by glycine betaine overproduction. Biologia Plantarum, 54(1), 83–88. DOI 10.1007/s10535-010-0012-4. [Google Scholar] [CrossRef]
12. Zhou, J., Wang, J., Bi, Y., Wang, L., Tang, L. et al. (2014). Overexpression of PtSOS2 enhances salt tolerance in transgenic poplars. Plant Molecular Biology Reporter, 32(1), 185–197. DOI 10.1007/s11105-013-0640-x. [Google Scholar] [CrossRef]
13. Zhou, L., Wang, N. N., Gong, S. Y., Lu, R., Li, Y. et al. (2015). Overexpression of a cotton (Gossypium hirsutum) WRKY gene, GhWRKY34, in Arabidopsis enhances salt-tolerance of the transgenic plants. Plant Physiology and Biochemistry, 96, 311–320. DOI 10.1016/j.plaphy.2015.08.016. [Google Scholar] [CrossRef]
14. Toderich, K. N., Mamadrahimov, A. A., Khaitov, B. B., Karimov, A. A., Soliev, A. A. et al. (2020). Differential impact of salinity stress on seeds minerals, storage proteins, fatty acids, and squalene composition of new quinoa genotype, grown in hyper-arid desert environments. Frontiers in Plant Science, 11, 607102. DOI 10.3389/fpls.2020.607102. [Google Scholar] [CrossRef]
15. Yuan, F., Quan, Y., Chen, Z. (2018). Effects of sodium stress on seed germination of Chenopodium quinoa Wild. Journal of Arid Land Resources and Environment, 32(11), 182–187. DOI 10.13448/j.cnki.jalre.2018.353. [Google Scholar] [CrossRef]
16. Fghire, R., Anaya, F., Issa, O. A., Wahbi, S. (2017). Physiological and growth response traits to water deficit as indicators of tolerance criteria between quinoa genotypes. Journal of Materials and Environmental Sciences, 8(6), 2084–2093. [Google Scholar]
17. Yang, H. W., Liu, W. Y., Shen, B. Y., Li, C. Z. (2017). Seed germination and physiological characteristics of Chenopodium quinoa under salt stress. Acta Prataculturae Sinica, 26(8), 146–153. [Google Scholar]
18. Yuan, J., Jiang, Y., Lv, K., Lu, G., Mao, Q. (2015). Effects of different salt stress on quinoa seed vigor and seedling physiological traits. Seed, 10(8), 9–17. DOI 10.16590/j.cnki.1001-4705.2015.08. [Google Scholar] [CrossRef]
19. Jiang, Y., Zhu, S., Yuan, J., Chen, G., Lu, G. et al. (2016). A betaine aldehyde dehydrogenase gene in quinoa (Chenopodium quinoaStructure, phylogeny, and expression pattern. Genes & Genomics, 38(11), 1013–1020. DOI 10.1007/s13258-016-0445-z. [Google Scholar] [CrossRef]
20. Heath, R. L., Packer, L. (1968). Photoperoxidation in isolated chloroplasts: I. Kinetics and stoichiometry of fatty acid peroxidation. Archives of Biochemistry and Biophysics, 125(1), 189–198. DOI 10.1016/0003-9861(68)90654-1. [Google Scholar] [CrossRef]
21. Giannopolitis, C. N., Ries, S. K. (1977). Superoxide dismutases: I. Occurrence in higher plants. Plant Physiology, 59(2), 309–314. DOI 10.1104/pp.59.2.309. [Google Scholar] [CrossRef]
22. Putter, J., Becker, R. (1974). Methods of enzymatic analysis, 2nd edition, vol. 2. New York: Academic Press. [Google Scholar]
23. Guo, Y., Zhang, L., Xiao, G., Cao, S., Gu, D. et al. (1997). Expression of betaine aldehyde dehydrogenase gene and salinity tolerance in rice transgenic plants. Science in China Series C: Life Sciences, 40(5), 496–501. DOI 10.1007/BF03183588. [Google Scholar] [CrossRef]
24. Maughan, P. J., Turner, T. B., Coleman, C. E., Elzinga, D. B., Jellen, E. N. et al. (2009). Characterization of salt overly sensitive 1 (SOS1) gene homoeologs in quinoa (Chenopodium quinoa Willd.). Genome, 52(7), 647–657. DOI 10.1139/G09-041. [Google Scholar] [CrossRef]
25. Chen, A., He, S., Li, F., Li, Z., Ding, M. et al. (2012). Analyses of the sucrose synthase gene family in cotton: Structure, phylogeny and expression patterns. BMC Plant Biology, 12(1), 85. DOI 10.1186/1471-2229-12-85. [Google Scholar] [CrossRef]
26. Kumar, S., Stecher, G., Tamura, K. (2016). MEGA7: Molecular evolutionary genetics analysis version 7.0 for bigger datasets. Molecular Biology and Evolution, 33(7), 1870–1874. DOI 10.1093/molbev/msw054. [Google Scholar] [CrossRef]
27. Hegedüs, A., Erdei, S., Horváth, G. (2001). Comparative studies of H2O2 detoxifying enzymes in green and greening barley seedlings under cadmium stress. Plant Science, 160(6), 1085–1093. DOI 10.1016/s0168-9452(01)00330-2. [Google Scholar] [CrossRef]
28. Gómez-Pando, L. R., Álvarez-Castro, R., Eguiluz-de la Barra, A. (2010). Effect of salt stress on peruvian germplasm of Chenopodium quinoa Wild.: A promising crop. Journal of Agronomy and Crop Science, 196(5), 391–396. DOI 10.1111/j.1439-037X.2010.00429.x. [Google Scholar] [CrossRef]
29. Panuccio, M. R., Jacobsen, S. E., Akhtar, S. S., Musculo, A. (2014). Effect of saline water on seed germination and early seedling growth of the halophyte quinoa. AoB Plants, 6, plu047. DOI 10.1093/aobpla/plu047. [Google Scholar] [CrossRef]
30. Jarvis, D. E., Ho, Y. S., Lightfoot, D. J., Schmöckel, S. M., Li, B. et al. (2017). The genome of Chenopodium quinoa. Nature, 542(7641), 307–312. DOI 10.1038/nature21370. [Google Scholar] [CrossRef]
31. Flowers, T. J., Colmer, T. D. (2008). Salinity tolerance in halophytes. The New Phytologist, 179(4), 945–963. DOI 10.1111/j.1469-8137.2008.02531.x. [Google Scholar] [CrossRef]
32. Cai, Z. Q., Gao, Q. (2020). Comparative physiological and biochemical mechanisms of salt tolerance in five contrasting highland quinoa cultivars. BMC Plant Biology, 20(1), 70. DOI 10.1186/s12870-020-2279-8. [Google Scholar] [CrossRef]
33. Yang, F., Liu, W., Huang, J., Wei, Y., Jin, Q. (2017). Physiological responses of different quinoa varieties to salt stress and evaluation of salt tolerance. Acta Prataculturae Sinica, 26, 77–88. DOI 10.11686/cyxb2016412. [Google Scholar] [CrossRef]
34. Bose, J., Rodrigo-Moreno, A., Shabala, S. (2014). ROS homeostasis in halophytes in the context of salinity stress tolerance. Journal of Experimental Botany, 65(5), 1241–1257. DOI 10.1093/jxb/ert430. [Google Scholar] [CrossRef]
35. Peng, Y. L., Gao, Z. W., Gao, Y., Liu, G. F., Sheng, L. X. et al. (2008). Eco-physiological characteristics of alfalfa seedlings in response to various mixed salt-alkaline stresses. Journal of Integrative Plant Biology, 50(1), 29–39. DOI 10.1111/j.1744-7909.2007.00607.x. [Google Scholar] [CrossRef]
36. Khan, M. S., Yu, X., Kikuchi, A., Asahina, M., Watanabe, K. N. (2009). Genetic engineering of glycine betaine biosynthesis to enhance abiotic stress tolerance in plants. Plant Biotechnology, 26(1), 125–134. DOI 10.5511/plantbiotechnology.26.125. [Google Scholar] [CrossRef]
37. Sakamoto, A., Murata, N. (2001). The use of bacterial choline oxidase, a glycinebetaine-synthesizing enzyme, to create stress-resistant transgenic plants. Plant Physiology, 125(1), 180–188. DOI 10.1104/pp.125.1.180. [Google Scholar] [CrossRef]
38. Tian, F., Wang, W., Liang, C., Wang, X., Wang, G. et al. (2017). Overaccumulation of glycine betaine makes the function of the thylakoid membrane better in wheat under salt stress. The Crop Journal, 5(1), 73–82. DOI 10.1016/j.cj.2016.05.008. [Google Scholar] [CrossRef]
Cite This Article
 Copyright © 2023 The Author(s). Published by Tech Science Press.
This work is licensed under a Creative Commons Attribution 4.0 International License , which permits unrestricted use, distribution, and reproduction in any medium, provided the original work is properly cited.
 Downloads
 Citation Tools