 Open Access
ARTICLE
An Improved YOLOv8-Based Method for Real-Time Detection of Harmful Tea Leaves in Complex Backgrounds
College of Computer and Control Engineering, Northeast Forestry University, Harbin, 150040, China
* Corresponding Author: Jianping Huang. Email:
# Xin Leng and Jiakai Chen are listed as co-first authors
Phyton-International Journal of Experimental Botany 2024, 93(11), 2963-2981. https://doi.org/10.32604/phyton.2024.057166
Received 09 August 2024; Accepted 21 October 2024; Issue published 30 November 2024
Abstract
Tea, a globally cultivated crop renowned for its unique flavor profile and health-promoting properties, ranks among the most favored functional beverages worldwide. However, diseases severely jeopardize the production and quality of tea leaves, leading to significant economic losses. While early and accurate identification coupled with the removal of infected leaves can mitigate widespread infection, manual leaves removal remains time-consuming and expensive. Utilizing robots for pruning can significantly enhance efficiency and reduce costs. However, the accuracy of object detection directly impacts the overall efficiency of pruning robots. In complex tea plantation environments, complex image backgrounds, the overlapping and occlusion of leaves, as well as small and densely harmful leaves can all introduce interference factors. Existing algorithms perform poorly in detecting small and densely packed targets. To address these challenges, this paper collected a dataset of 1108 images of harmful tea leaves and proposed the YOLO-DBD model. The model excels in efficiently identifying harmful tea leaves with various poses in complex backgrounds, providing crucial guidance for the posture and obstacle avoidance of a robotic arm during the pruning process. The improvements proposed in this study encompass the Cross Stage Partial with Deformable Convolutional Networks v2 (C2f-DCN) module, Bi-Level Routing Attention (BRA), Dynamic Head (DyHead), and Focal Complete Intersection over Union (Focal-CIoU) Loss function, enhancing the model’s feature extraction, computation allocation, and perception capabilities. Compared to the baseline model YOLOv8s, mean Average Precision at IoU 0.5 (mAP0.5) increased by 6%, and Floating Point Operations Per second (FLOPs) decreased by 3.3 G.Keywords
Tea is one of the most important crops globally and is widely cultivated in various regions [1]. The health and sustainable development of the tea industry is of great significance to many countries and regions. As economic levels continue to rise, the demand for tea continues to grow, and consumers’ expectations for tea quality are also increasing [2]. In the process of tea cultivation and growth, tea diseases are an important factor affecting yield and quality, and severe tea diseases can cause huge economic losses [3]. If tea diseases are accurately and quickly identified in the early stages, and infected leaves are promptly removed or insecticides are sprayed, it can effectively block the source of the diseases and prevent the spread and outbreak of the diseases [4].
In recent years, the development of artificial intelligence has significantly improved the accuracy of disease detection and strengthened the resilience and sustainability of agriculture [5]. Currently, the use of pesticides not only impacts the natural ecological environments but also has implications for the health of consumers [6]. In contrast, although manual pruning of diseased leaves is safer [7], it requires a lot of labor and is not as efficient as using pesticides, resulting in higher costs. The adoption of robotic pruning presents a solution to these challenges [8]. Yet, the success of such robots hinges on their ability to detect targets, which is crucial to accurately avoid crop damage and potential collisions [9]. Therefore, the main challenge addressed in this paper is how to rapidly and accurately detect harmful tea leaves in complex environments, providing effective guidance for subsequent robot cutting of these harmful tea leaves.
With the rapid advancement of computer technology, machine learning, and deep learning have gradually replaced traditional manual detection methods for detecting tea leaf diseases [1]. Nath et al. achieved an accuracy of 99.28% on the constructed tea leaf dataset by combining attention mechanisms with SVM [10]. Sun et al. successfully extracted tea tree diseases from images by combining SLIC with SVM, applying the SVM classifier to the superpixels generated by SLIC [11]. However, machine learning is time-consuming in feature extraction, and its recognition performance in complex environments still has limitations.
Deep learning has garnered widespread attention in academia due to its significant advantages in automatic learning and feature extraction. In the study of plant disease identification, deep learning has achieved many significant advancements [12]. Image detection networks can be categorized into two classes based on the detection stage: two-stage and one-stage object detection networks. Two-stage object detection networks, exemplified by Faster R-CNN [13], operate in two steps: first, they generate candidate regions, and then they classify and perform bounding box regression on these regions. Faster R-CNN stands out as a representative model in the realm of two-stage detection networks. Zhou et al. proposed a rice disease detection algorithm based on the fusion of Faster R-CNN and FCM-KM, achieving satisfactory performance [14]. Lee et al. used the convolutional neural network Faster R-CNN model for tea disease detection, achieving a detection accuracy of 77.5% [15]. Wang et al. improved Faster R-CNN and VGG16, enhancing the accuracy of tea leaves detection [16]. While these networks exhibit excellent accuracy in detection, their processing speed is relatively slow, rendering them less suitable for real-time applications. In contrast, one-stage networks, such as You Only Look Once (YOLO) [17] and Single Shot MultiBox Detector (SSD) [18], directly predict both bounding boxes and class labels on images. The YOLO series, known for its balance of efficiency and accuracy, has been extensively used in agriculture. Sun et al. modified YOLOv4 by replacing the backbone network and convolutions to reduce the model’s parameter count and inserted a convolutional attention module to improve the accuracy of tea tree disease spot detection [19]. Bao et al. enhanced YOLOv5 by adding 2D mixed attention and multi-scale RFB modules and trained the model using RCAN-reconstructed images of tea tree wilt disease. The improved model’s mean average precision increased to 76.6% compared to the original model [20]. Xue et al. presented the YOLO-Tea method, utilizing YOLOv5 for detecting tea leaves diseases and achieving an mAP of 79.7% [21]. Lin et al. introduced the TSBA-YOLO model, which focused on detecting withering disease in tea leaves, with an improved mAP of 85.35% [22]. Dai et al. developed a method for detecting crop leaves diseases based on YOLOv5. However, this method exhibits lower accuracy in complex environments [23]. Soeb et al. were the first to apply YOLOv7 to detect tea tree diseases, achieving outstanding results with an mAP of 98.2%, surpassing previous plant disease detection algorithms [24]. Yu et al. developed the TTLD-YOLOv7 model based on YOLOv7-Tiny by integrating CoordConv and ECA channel attention mechanisms, achieving an improved mAP of 93% [1]. Additionally, Roy et al. made enhancements to YOLOv4, proposing a high-performance, real-time, fine-grained object detection framework capable of addressing challenges such as dense distribution and irregular shapes [25]. Sun et al. introduced a novel concept, utilizing the YOLO-v4 deep learning network collaboratively for ITC segmentation and refining the segmentation results involving overlapping tree crowns using computer graphics algorithms [26]. Furthermore, Du et al. proposed a tomato pose detection algorithm based on YOLOv5, aiming to detect the three-dimensional pose of individual tomato fruits, achieving a mAP of 93.4% [27]. Nan et al. developed WGB-YOLO based on YOLOv7 for harvesting ripe dragon fruits, further classifying them based on different growth poses, achieving a mAP of 86.0% [28]. Therefore, in practical applications, simply classifying harmful tea leaves into one category cannot fully address the issues of robotic harvesting strategy and occlusion. For a cluster of leaves with only one harmful leaves, the whole bundle cutting is not rational; for clustered growing harmful leaves, cutting them one by one would significantly reduce operational efficiency; for occluded harmful leaves, the robotic arm needs to be rotated to another angle before cutting.
Current research on harmful leaves detection primarily focuses on simple environments, neglecting the complexities encountered in real-world robotic applications. When pruning harmful leaves, robots must navigate intricate environmental elements, pruning strategies, and occlusion challenges. In densely planted tea gardens, the target of harvesting harmful leaves is challenging to detect accurately due to mutual contact with other leaves and obstruction by tree branches. In real-time field operations, robots need to ensure high FPS and accuracy and also require low FLOPs for the model. Compared to RCNN and SSD, YOLO exhibits higher efficiency and performance. Therefore, this study chooses YOLO as the benchmark model. To further refine YOLO’s performance, we propose the YOLO-DBD algorithm.
To address the issue of detecting harmful tea leaves, this paper proposes the YOLO-DBD detection model. The main contributions are as follows:
(1) By integrating C2f and DCNv2 into the backbone network, we can better capture the shape and position of the target, as well as adaptively alter feature weights during context semantic fusion of the target.
(2) A Bi-Level Routing Attention mechanism that employs dynamic sparse attention with double-layer routing, ensuring flexible, content-aware computation while reducing computational demands.
(3) A dynamic head detection framework at the network’s end to enhance the perception of spatial position, scale, and task regions.
(4) To address the imbalance of the target samples and distinguish between easy and hard samples to reduce the impact of easily separable samples on network training, this paper incorporates Focal on top of CIOU.
This study concentrated on the images of tea leaves. These images are from the Dayuan Tea Garden in Jinyun County, Zhejiang Province, China. The images were taken using an ONEPLUS8T on 11 July 2023, and captured in RGB format. The images, with a resolution of 640 × 640 pixels, totaled 1108 and were divided into training and validation sets at an 8:2 ratio. This allocation resulted in 887 images for training and 221 for validation. The image was carried out using labeling software.
In practical applications, merely classifying harmful tea leaves into a single category falls short of addressing the challenges associated with robot harvesting strategies and occlusion. For clusters with a single harmful leaf, cutting the entire bundle is not rational; for clusters of growing harmful leaves, cutting them individually would significantly reduce operational efficiency; for obscured harmful leaves, the robotic arm must rotate to different angles before cutting. Consequently, harmful leaves are classified into three primary categories. The first category is individual harmful leaves (referred to as IHL), as illustrated in Fig. 1a. The second category is clustered harmful leaves (referred to as CHL), shown in Fig. 1b. The third category is obscured harmful leaves (referred to as OHL), depicted in Fig. 1c. We obtained a total of 1108 images of harmful tea leaves, comprising 595 images of IHL, 161 images of CHL, and 681 images of OHL.
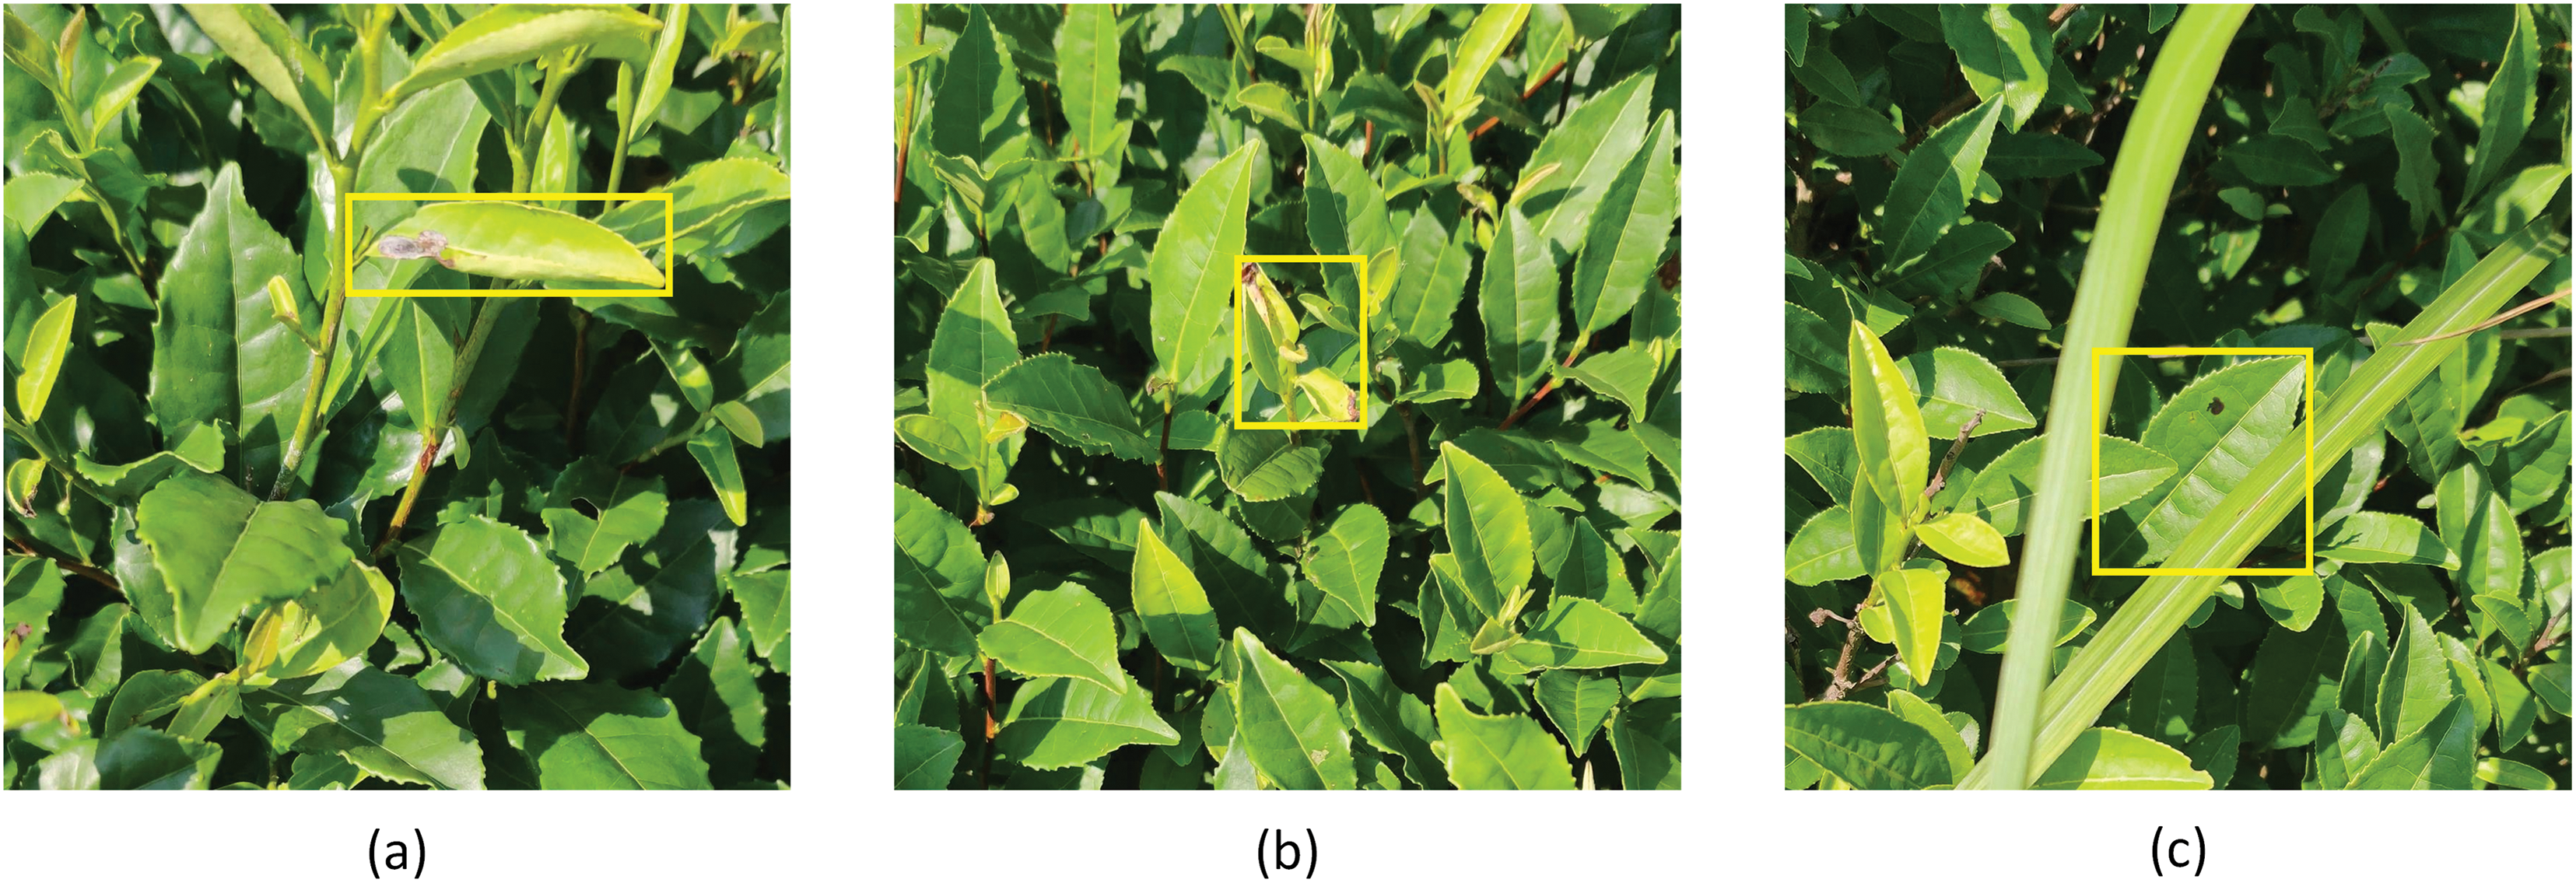
Figure 1: Categories of harmful leaves: (a) Individual harmful leaves (IHL), (b) Clustered harmful leaves (CHL), (c) Obscured harmful leaves (OHL)
To enhance the robustness of the model and prevent overfitting, both the images and bounding boxes were strengthened. 1) Image-level augmentation includes four data enhancement methods: rotation, noise addition, cutout, and mosaic, as shown in Fig. 2. To enhance the model’s ability to recognize objects in different orientations, the original image was rotated clockwise by 90°, 180°, and 270°. In addition, noise was added to simulate real images in complex environments, with 5% and 10% noise added to simulate adverse conditions such as rainy weather. Mask augmentation randomly cropped 10% of the image to simulate partial occlusion. Mosaic augmentation randomly selected four images, randomly cropped them, and combined them to generate new composite images, helping the model learn from complex visual patterns. 2) Bounding box augmentation primarily involves applying noise to the target object, adding 5% and 10% noise to enhance the model’s generalization ability for subtle changes in the object’s position and size. Through the above data augmentation methods, the training set was eventually expanded to 8870 images.
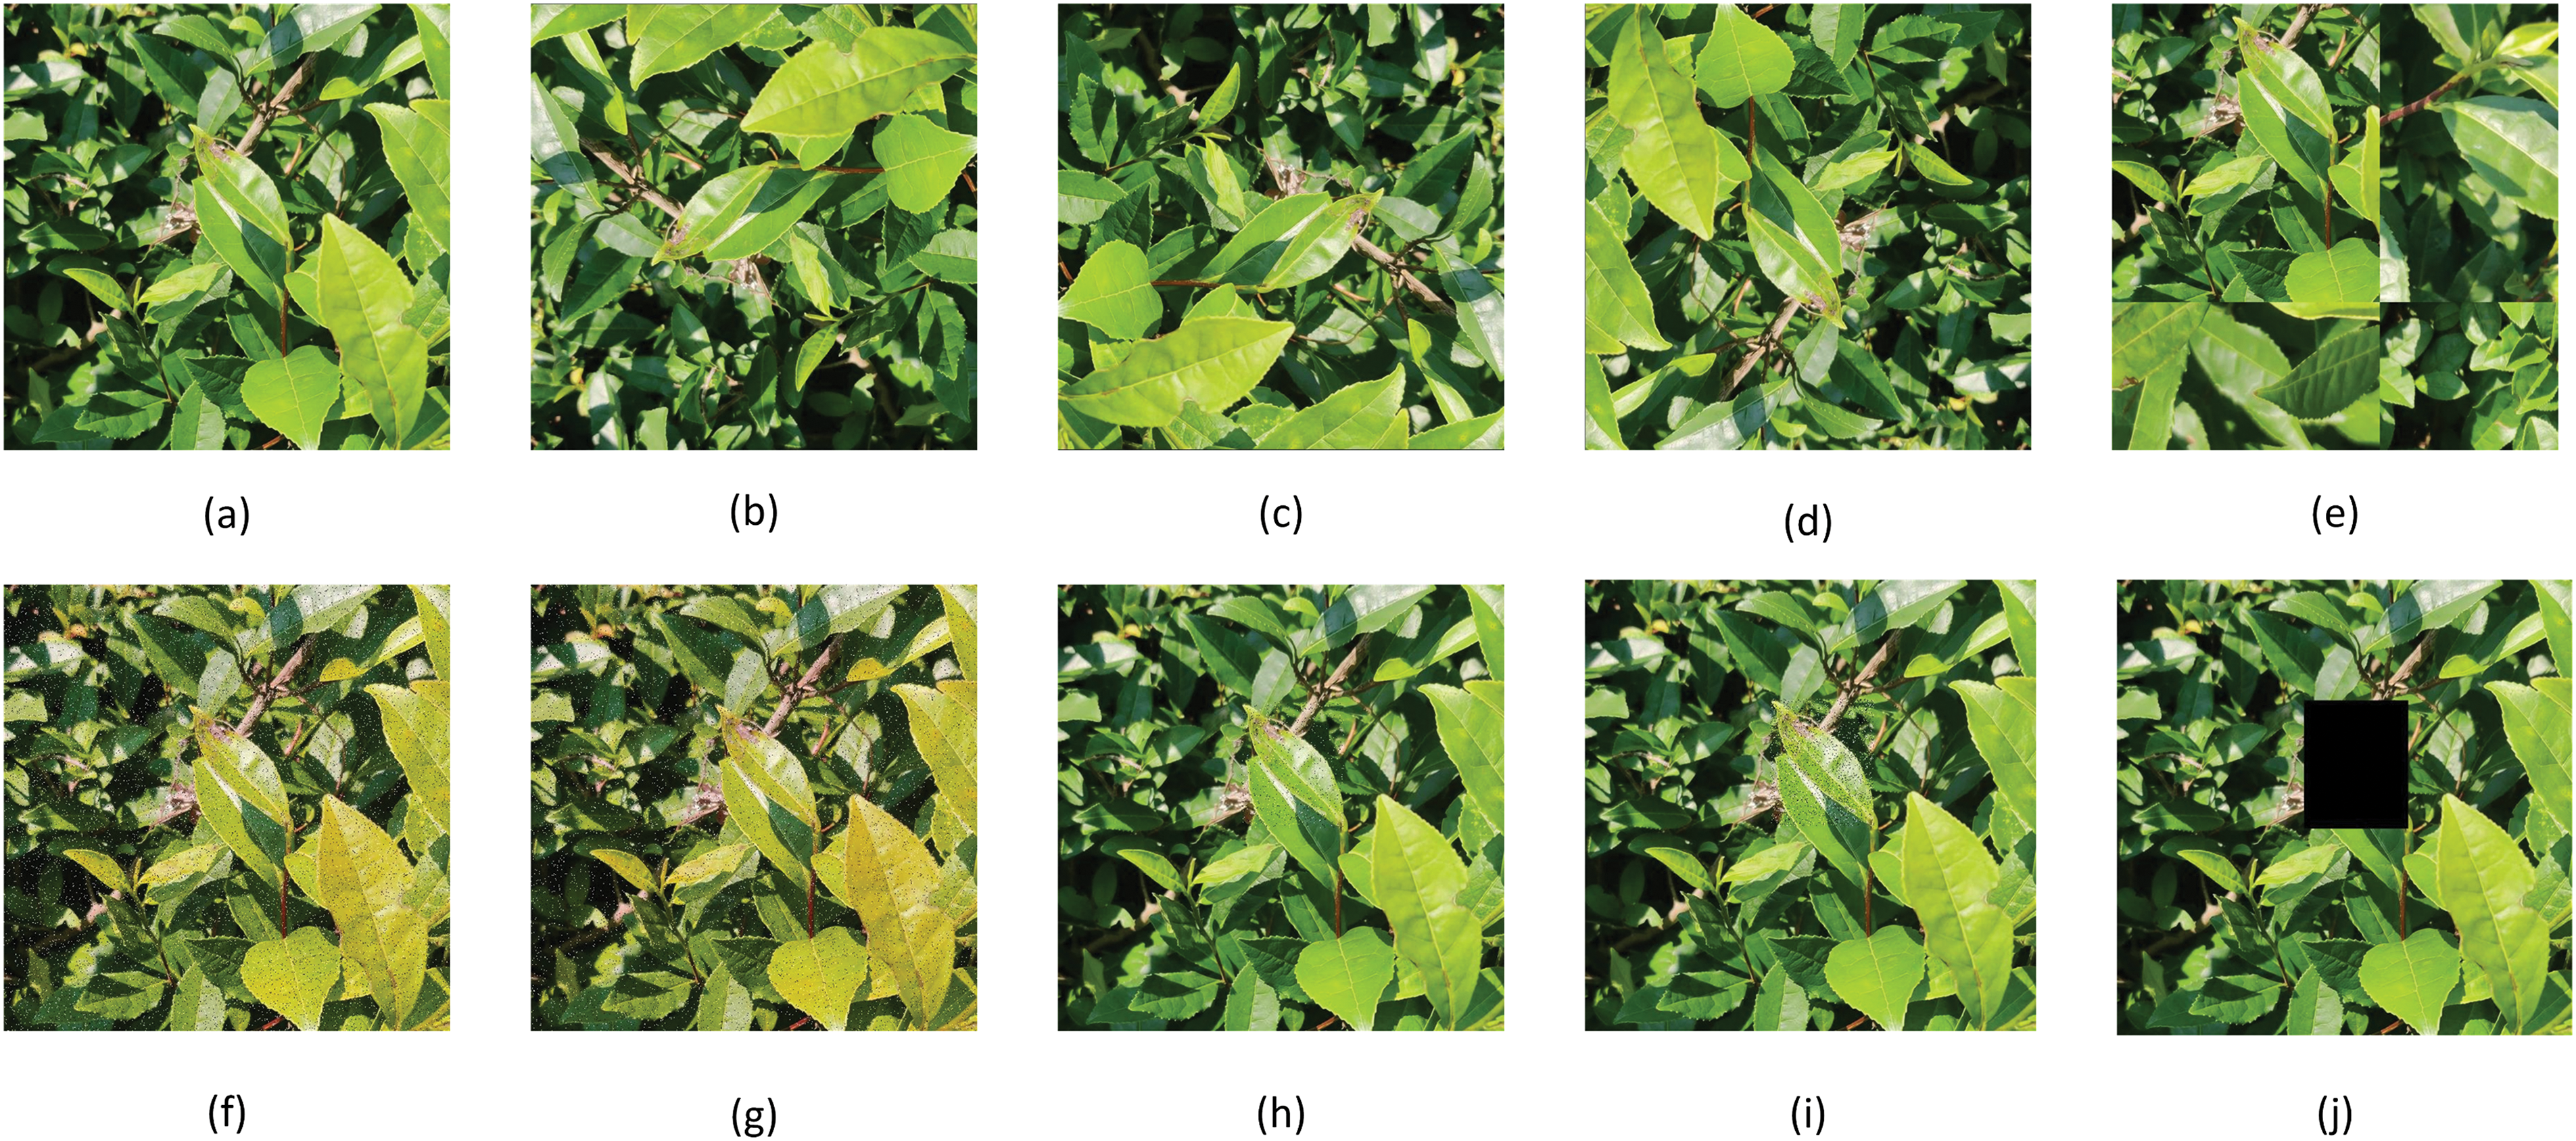
Figure 2: Different image augmentation methods: (a) Original image, (b) 90° rotation, (c) 180° rotation, (d) 270° rotation, (e) Stitching, (f) 5% noise was added to the entire image, (g) 10% noise was added to the entire image, (h) 5% noise was added to the targets, (i) 10% noise was added to the targets, (j) Masking
The YOLO series of deep learning detection algorithms, especially YOLOv8, is widely acclaimed in the field of object detection for its outstanding performance in detecting large-scale, and sparse targets. Nevertheless, when applied in complex tea garden environments with numerous interfering factors such as complex image backgrounds, overlapping and occlusion of leaves, and small and dense defects in harmful leaves sizes, the performance of YOLOv8s is not satisfactory. To address this issue, this paper proposes an improved YOLOv8s network framework named YOLO-DBD. Extensive experiments demonstrate that this model significantly enhances the overall performance of detecting harmful leaves in complex environments, including accuracy and efficiency.
The network architecture of YOLO-DBD is illustrated in Fig. 3. The enhancements encompass four key areas. Firstly, the integration of C2f and DCNv2 into a new C2f-DCNv2 module, coupled with a residual structure, bolsters the network’s ability to discern the shapes and positions of the target and refine feature accuracy. Second, the BRA mechanism, following the SPPF module, employs dynamic sparse attention for more efficient computational resource allocation, thus augmenting feature extraction while reducing computational demands. Third, the incorporation of the DyHead framework at the network’s head merges object detection with self-attention mechanisms, significantly improving the detection head’s perceptual and expressive capabilities. Finally, to address sample imbalance, the CIOU Loss function in YOLOv8 is combined with the Focal Loss function to form Focal-CIOU. These advancements collectively elevate the accuracy of YOLO-DBD in detecting targets in challenging environments.
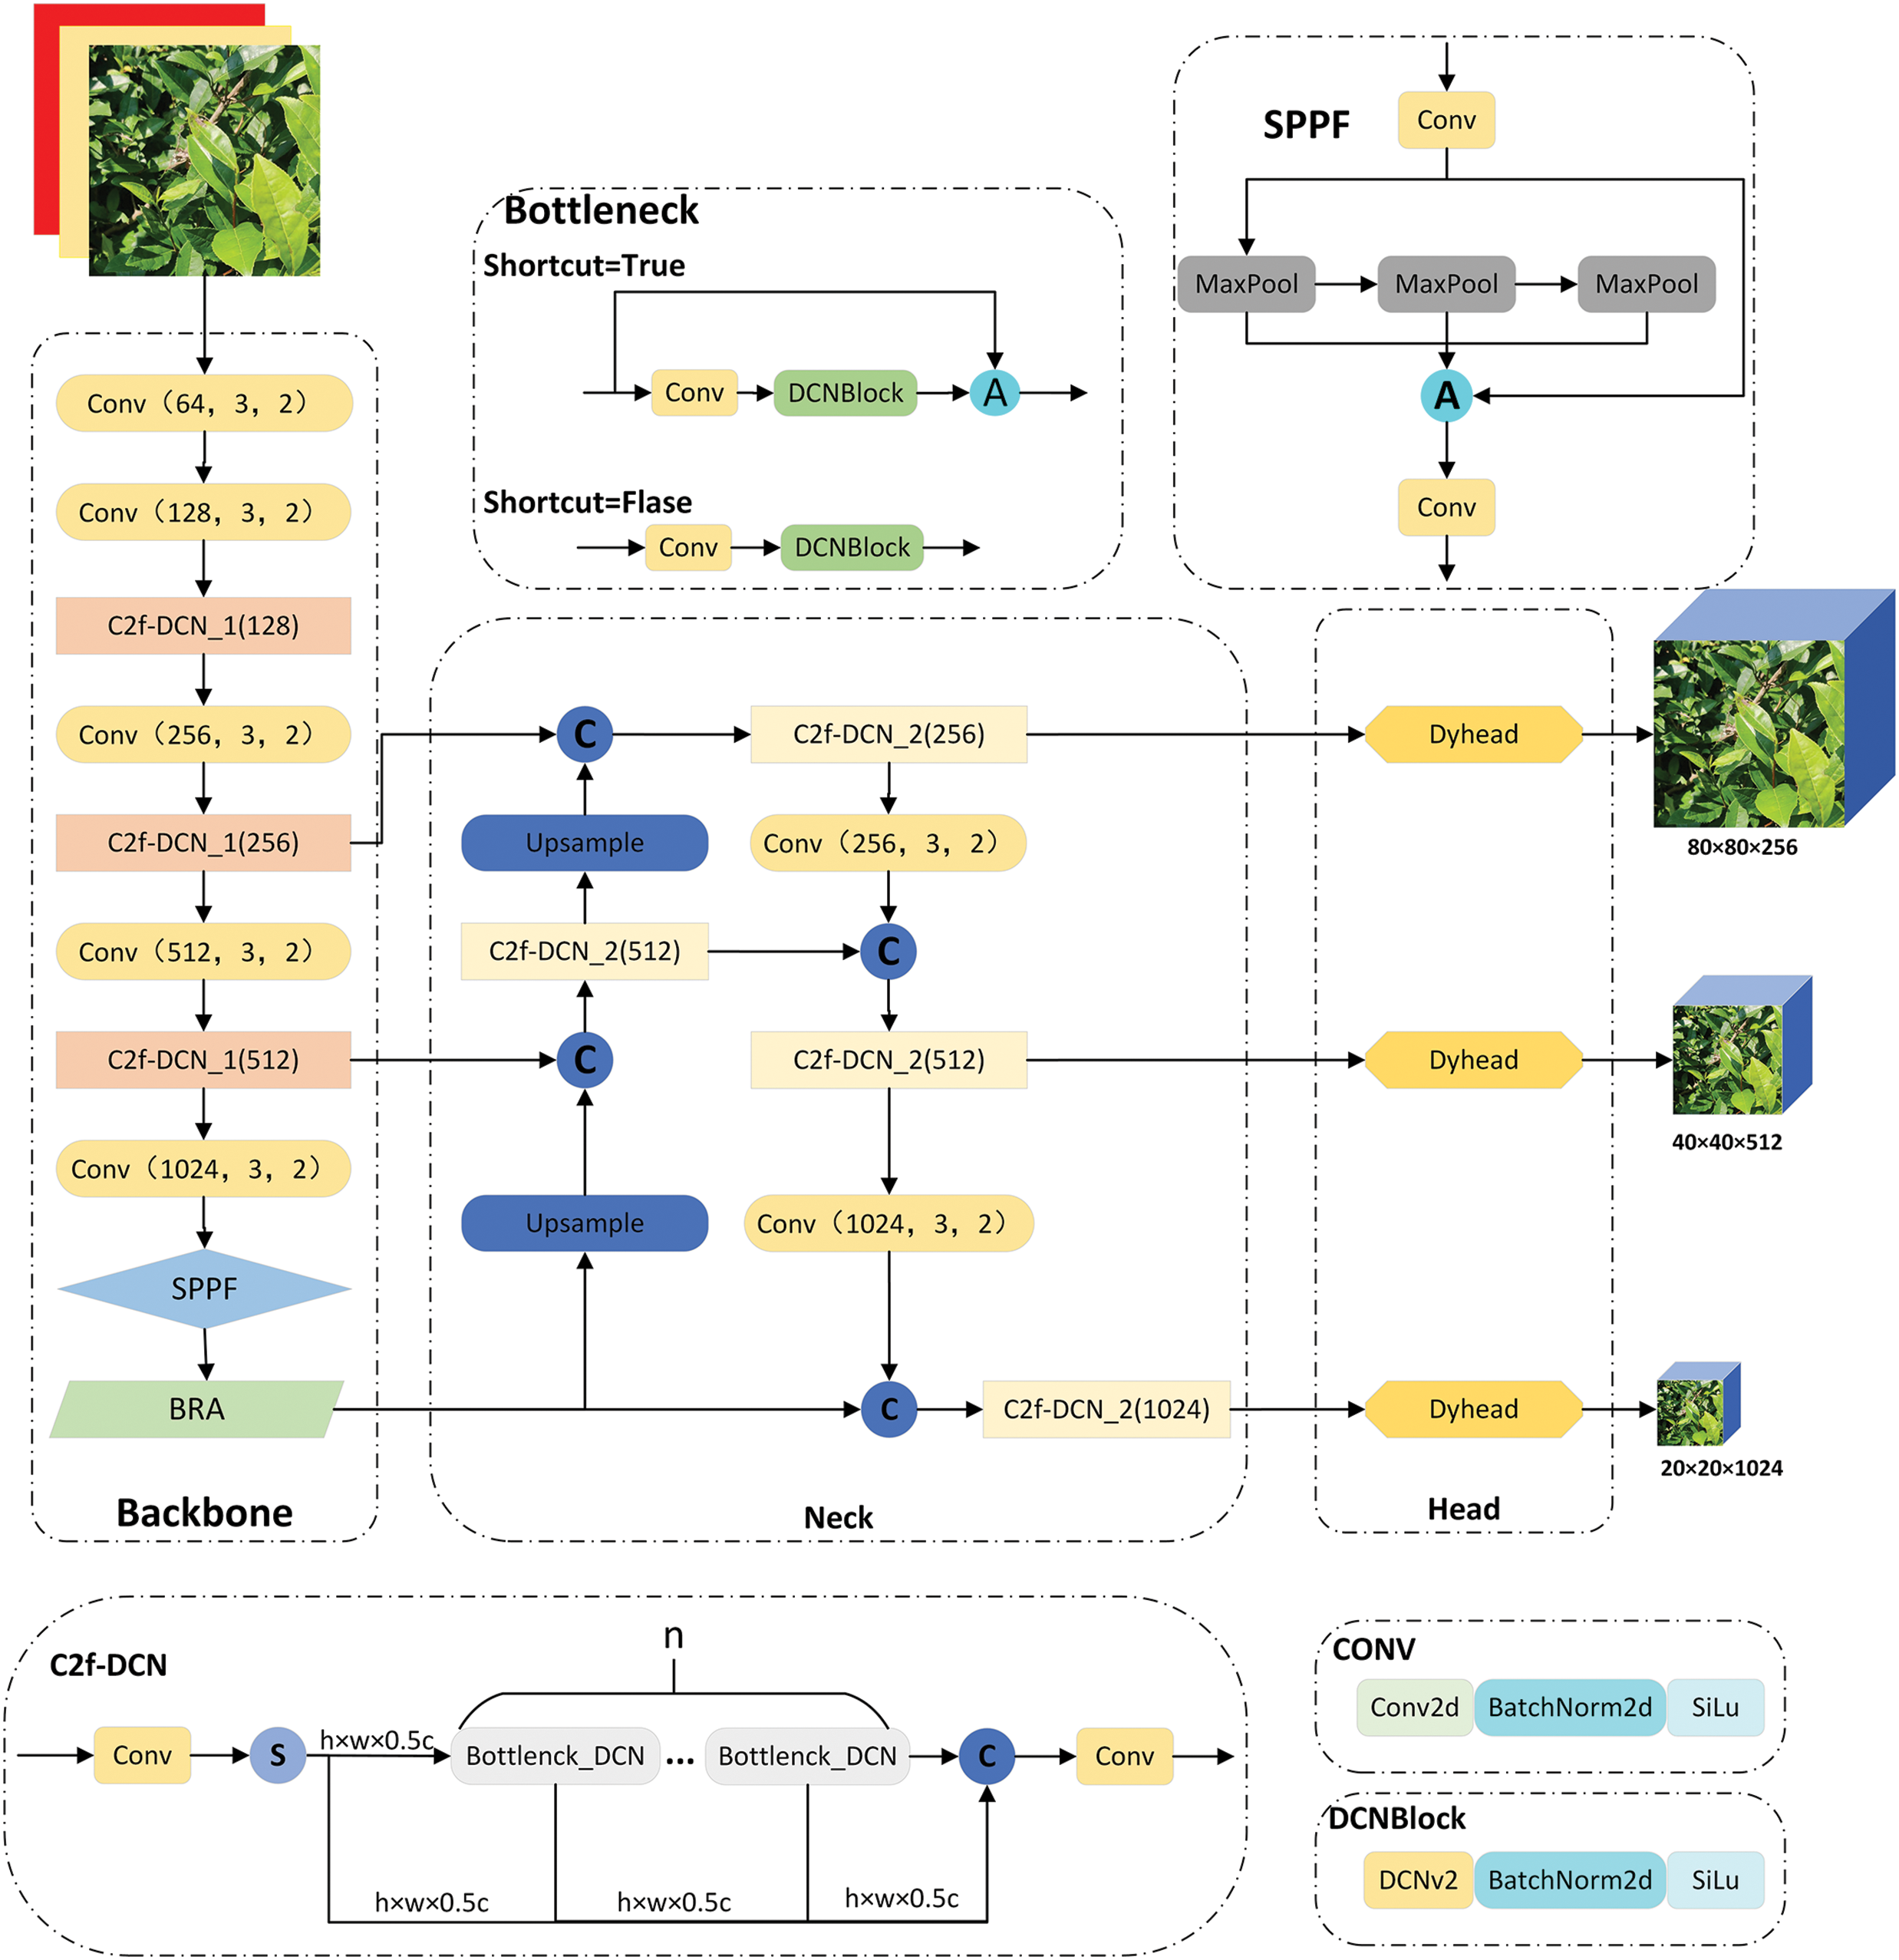
Figure 3: YOLO-DBD network structure diagram
Deformable Convolutional Networks (DCNv1) is a Convolutional Neural Network (CNN) architecture that effectively handles geometric transformations [29]. In traditional CNN modules, the sampling positions of convolutional kernels on input feature maps are fixed, restricting the network’s adaptability to geometric transformations. Pooling layers also reduce spatial resolution by a fixed ratio, and Region of Interest Pooling divides the region of interest into a fixed number of spatial units, both of which are unable to flexibly handle geometric changes in targets. DCNv1 enhances convolutional operations by introducing learnable offsets, allowing the sampling positions of convolutional kernels to dynamically adjust based on input features. This implies that the network can adaptively adjust the size and shape of its receptive field, thus better capturing the geometric changes in targets. DCNv2 improves upon this by adding extra convolutional layers to predict offsets for each convolutional kernel position, and these offsets are then used to guide the sampling positions in the main convolutional layer [30]. This design allows DCNv2 to partially overcome the limitations of traditional CNN modules in handling geometric transformations, thereby improving the model’s capability and accuracy in recognizing objects with diverse shapes. The architecture of DCNv2 is depicted in Fig. 4.
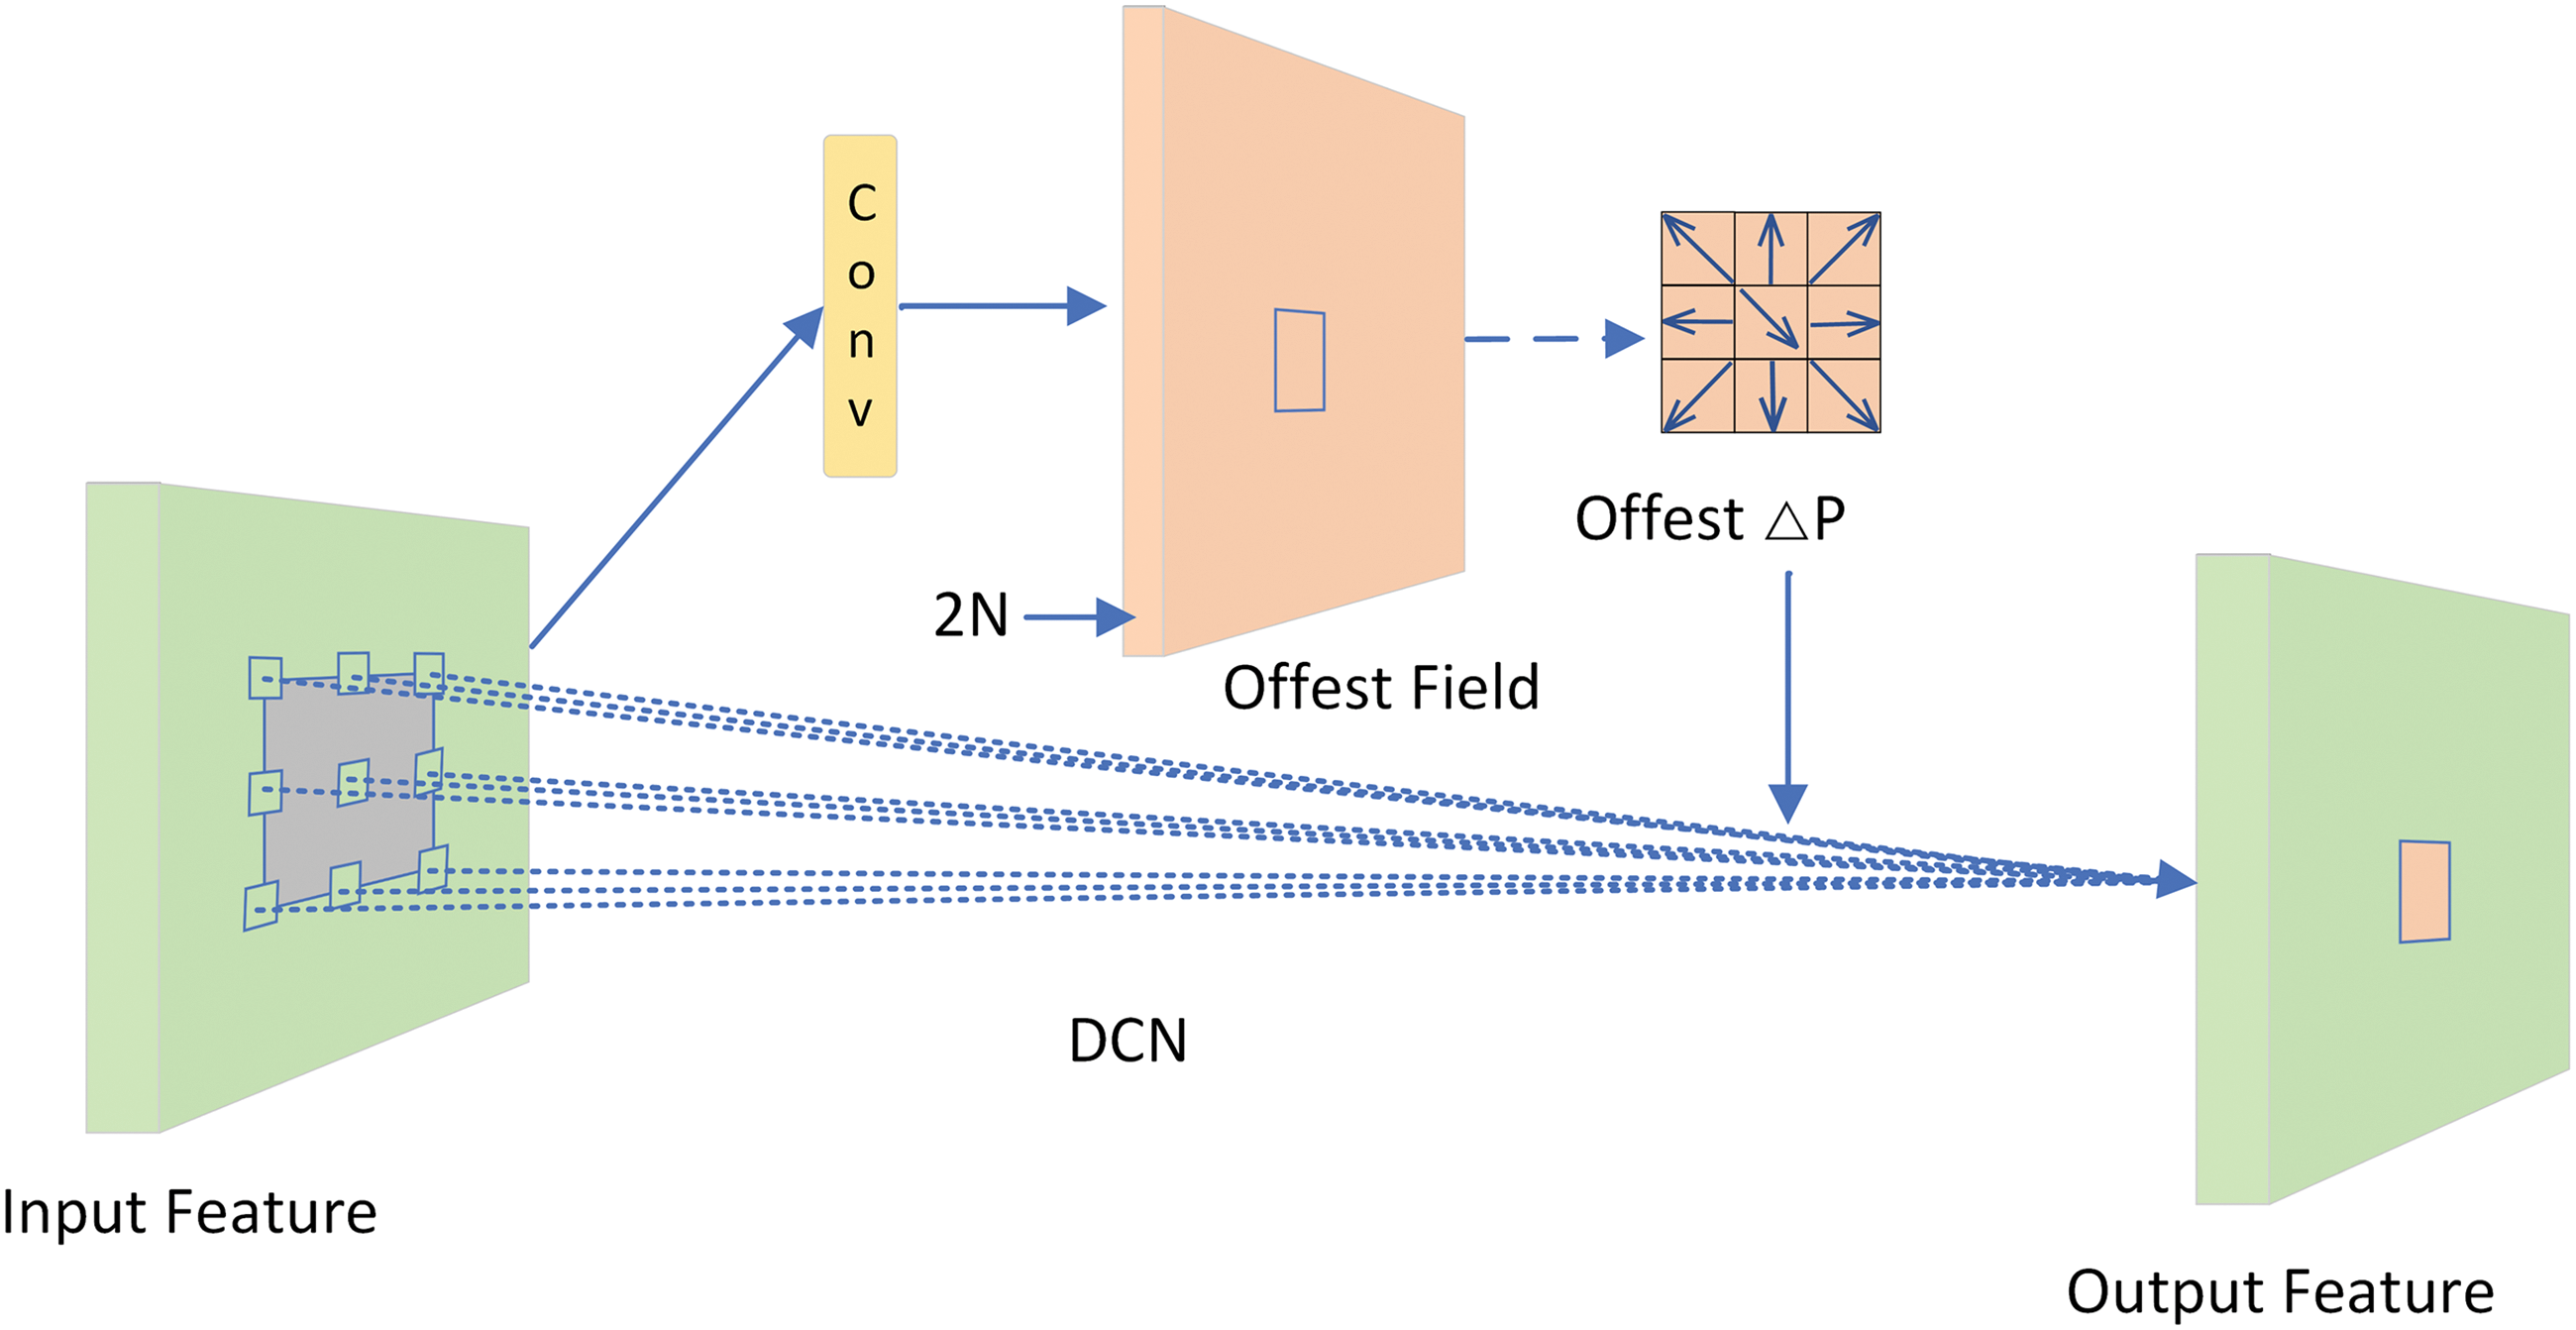
Figure 4: DCNv1 network diagram
Additionally, DCNv2 incorporates weight coefficients alongside offsets at each sampling point, effectively discerning relevant areas from irrelevant areas. These coefficients assign a weight to every sampling point, ensuring that points in irrelevant areas (those not of interest) receive a weight of zero, effectively excluding them from feature extraction. The computation formula is as shown in Eq. (1):
In our study, we have fused the C2f module with the modulation mechanism of DCNv2, adopting a multi-branch and residual structure to more effectively capture the shape and position features of the target, as illustrated in Fig. 5. The DCNv2 modulation mechanism plays a pivotal role, as it learns the offsets and feature amplitudes of samples to precisely control sample space and impact. This enhances the accuracy of the model in locating targets and its adaptability to varying target shapes. Consequently, the model demonstrates high precision and robustness, even in complex environments. The multi-branch structure of the C2f-DCN module follows efficient aggregation network principles, enriching the gradient flow of the model by adding layers and connections. This structure, with consistent input-output channels across branches and concat operations for feature concatenation, ensures a stable and effective gradient path, maintaining network efficiency at deeper levels. To prevent the problem of gradient vanishing as the network depth increases, the C2f-DCN module introduces a residual structure in the backbone network. This design not only ensures that the network can extract finer-grained features but also prevents the degradation of network performance, ensuring the stability and effectiveness of training.
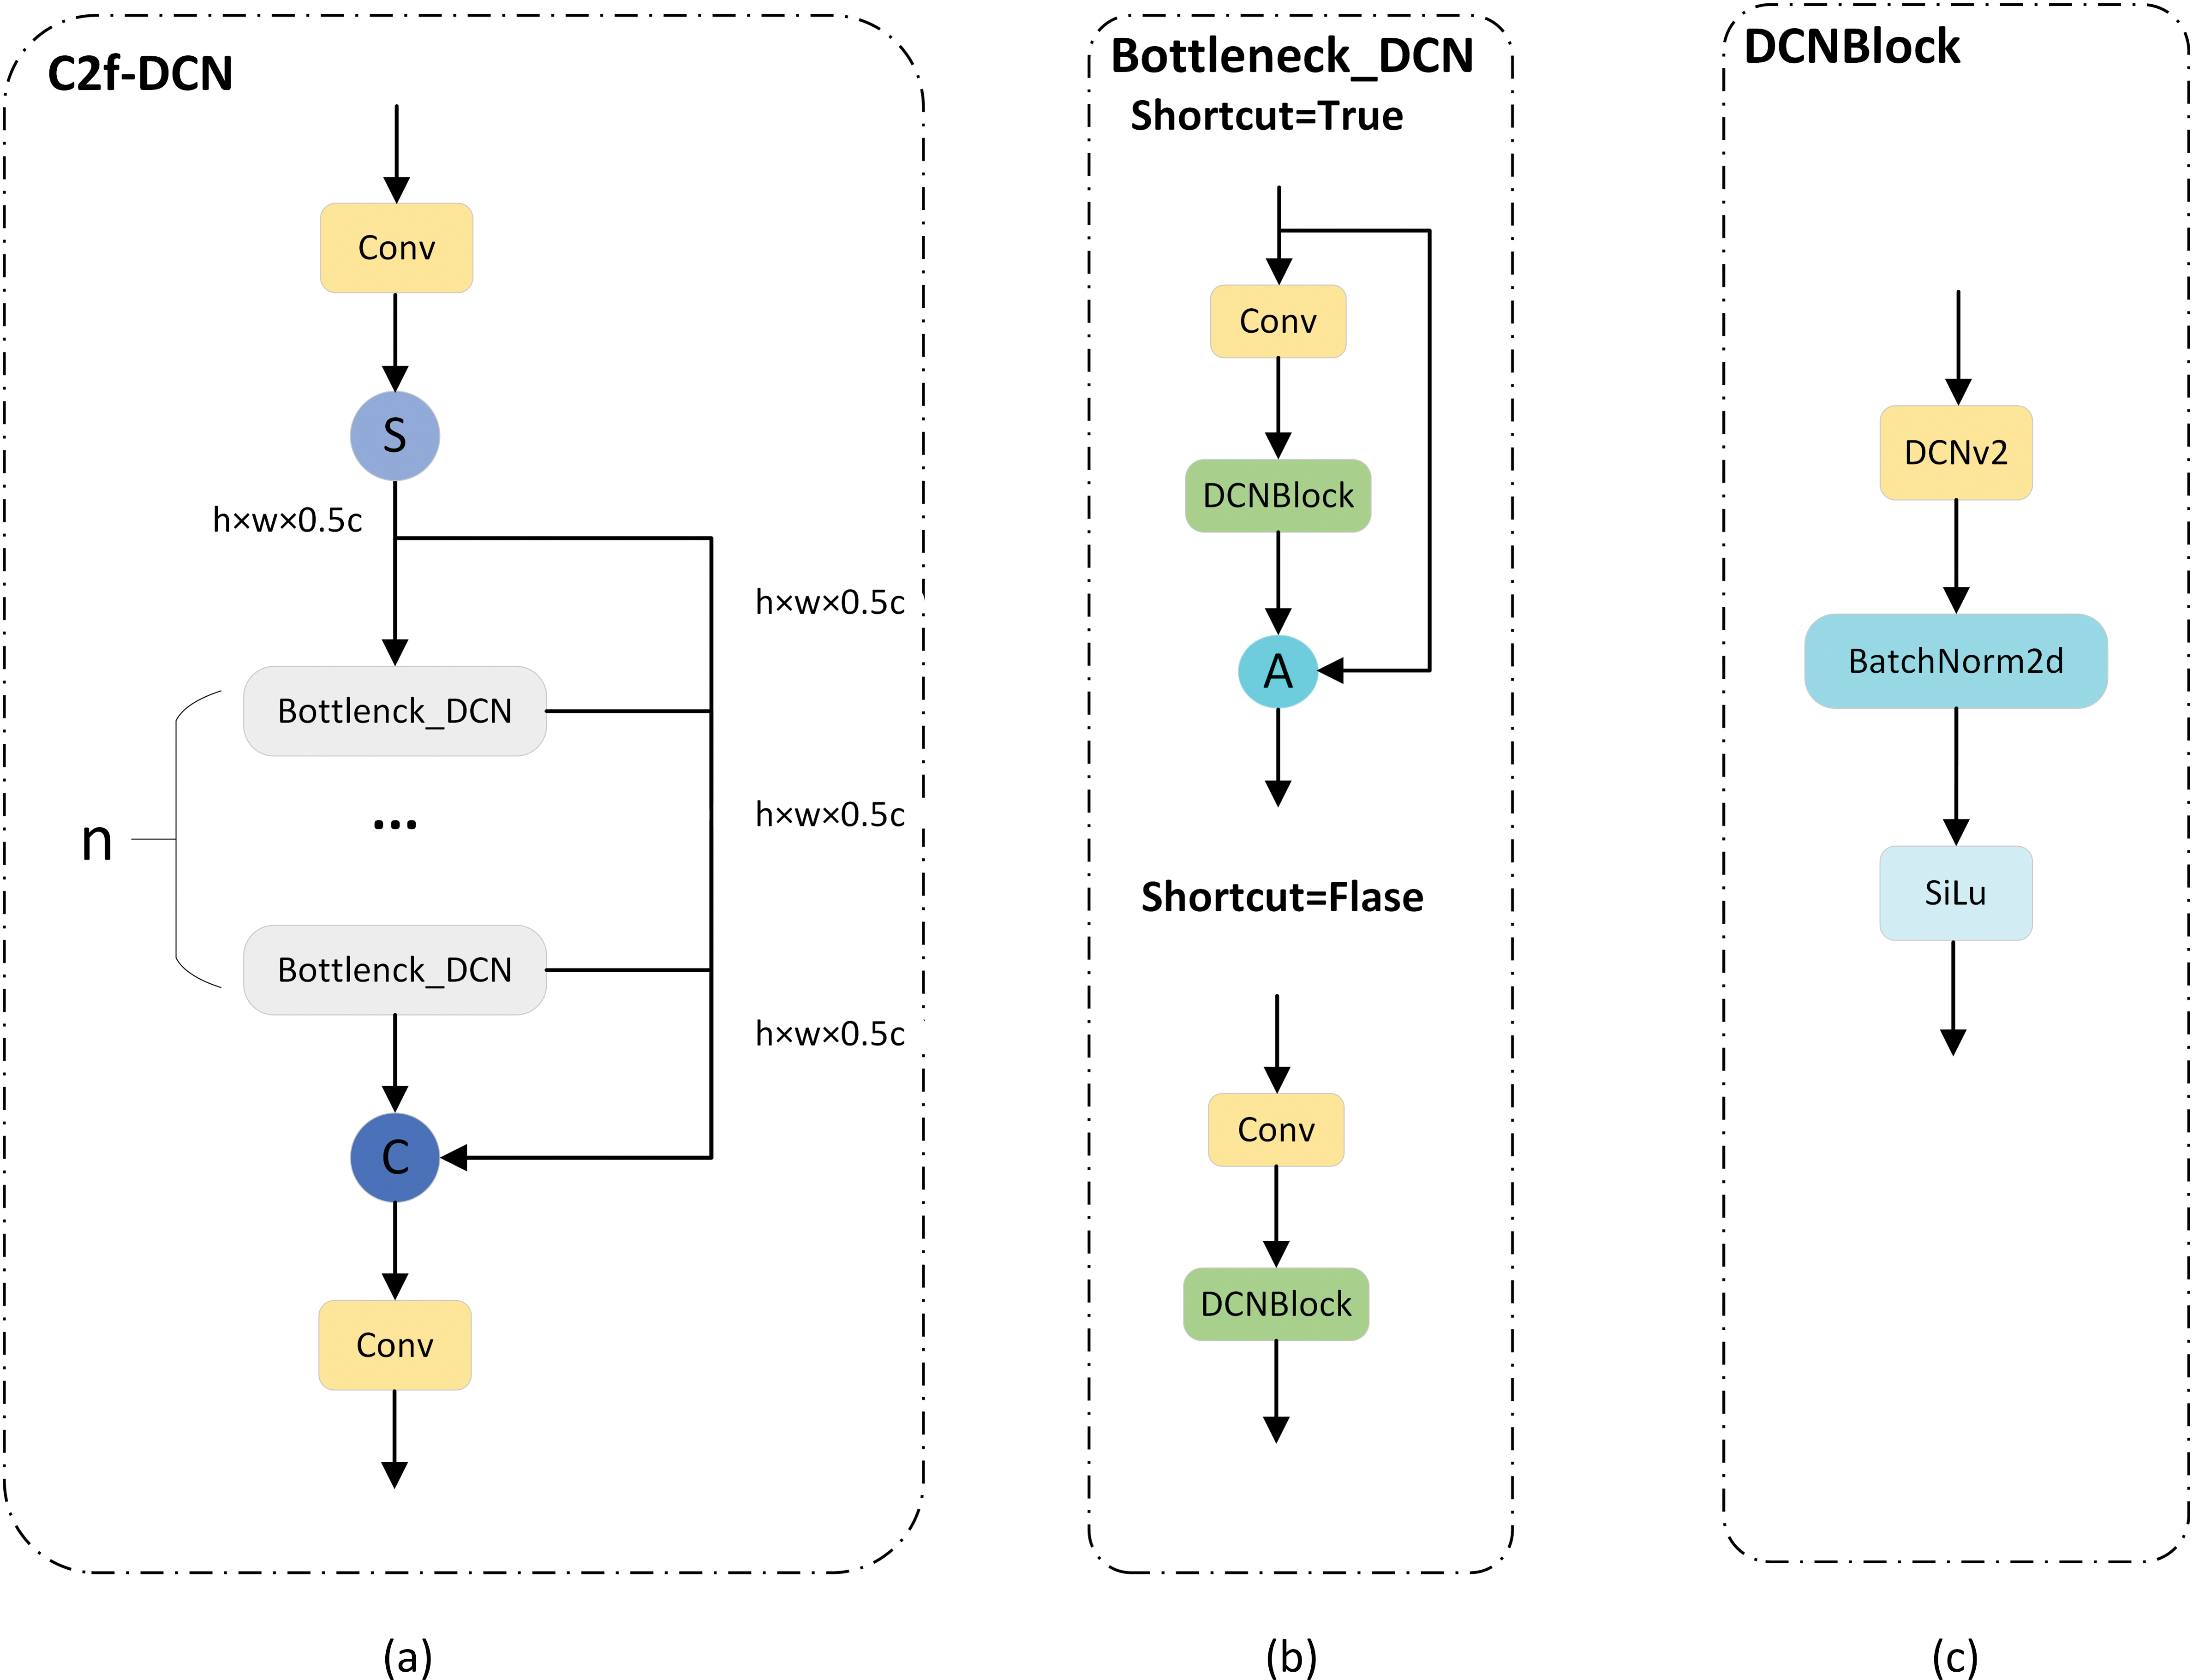
Figure 5: (a) C2f-DCN network diagram, (b) Bottleneck_DCN network diagram, (c) DCNBlock network diagram
3.2 Bi-Level Routing Attention
YOLOv8 is a convolutional neural network model primarily focused on local processing, making it challenging to capture complex relationships among global features. On the other hand, the complexity of the background often makes it difficult for detection models like YOLOv8 to accurately identify targets, leading to excessive reliance on background information and neglect of crucial details. In contrast, Transformers, with their unique attention mechanism, can capture global correlations among data, constructing a more powerful and flexible data-driven model. However, while Transformers excel in enhancing a model’s ability to handle complex data, their high computational complexity and large memory footprint pose challenges, especially when dealing with large-scale data. Directly integrating traditional attention mechanisms into the model consumes significant computational and storage resources, thereby reducing inference efficiency. To alleviate this burden, researchers suggest adopting a sparse query approach, focusing only on specific key-value pairs to reduce resource usage. Following this line of thinking, a series of related research outcomes have emerged, such as local attention, deformable attention, and expansive attention, all of which employ manually configured static patterns and content-unrelated sparsity. To overcome these limitations, Zhu et al. proposed a new dynamic sparse attention mechanism [31]: BRA. This novel approach, illustrated in Fig. 6, offers a more efficient and effective method for attention-based processing.
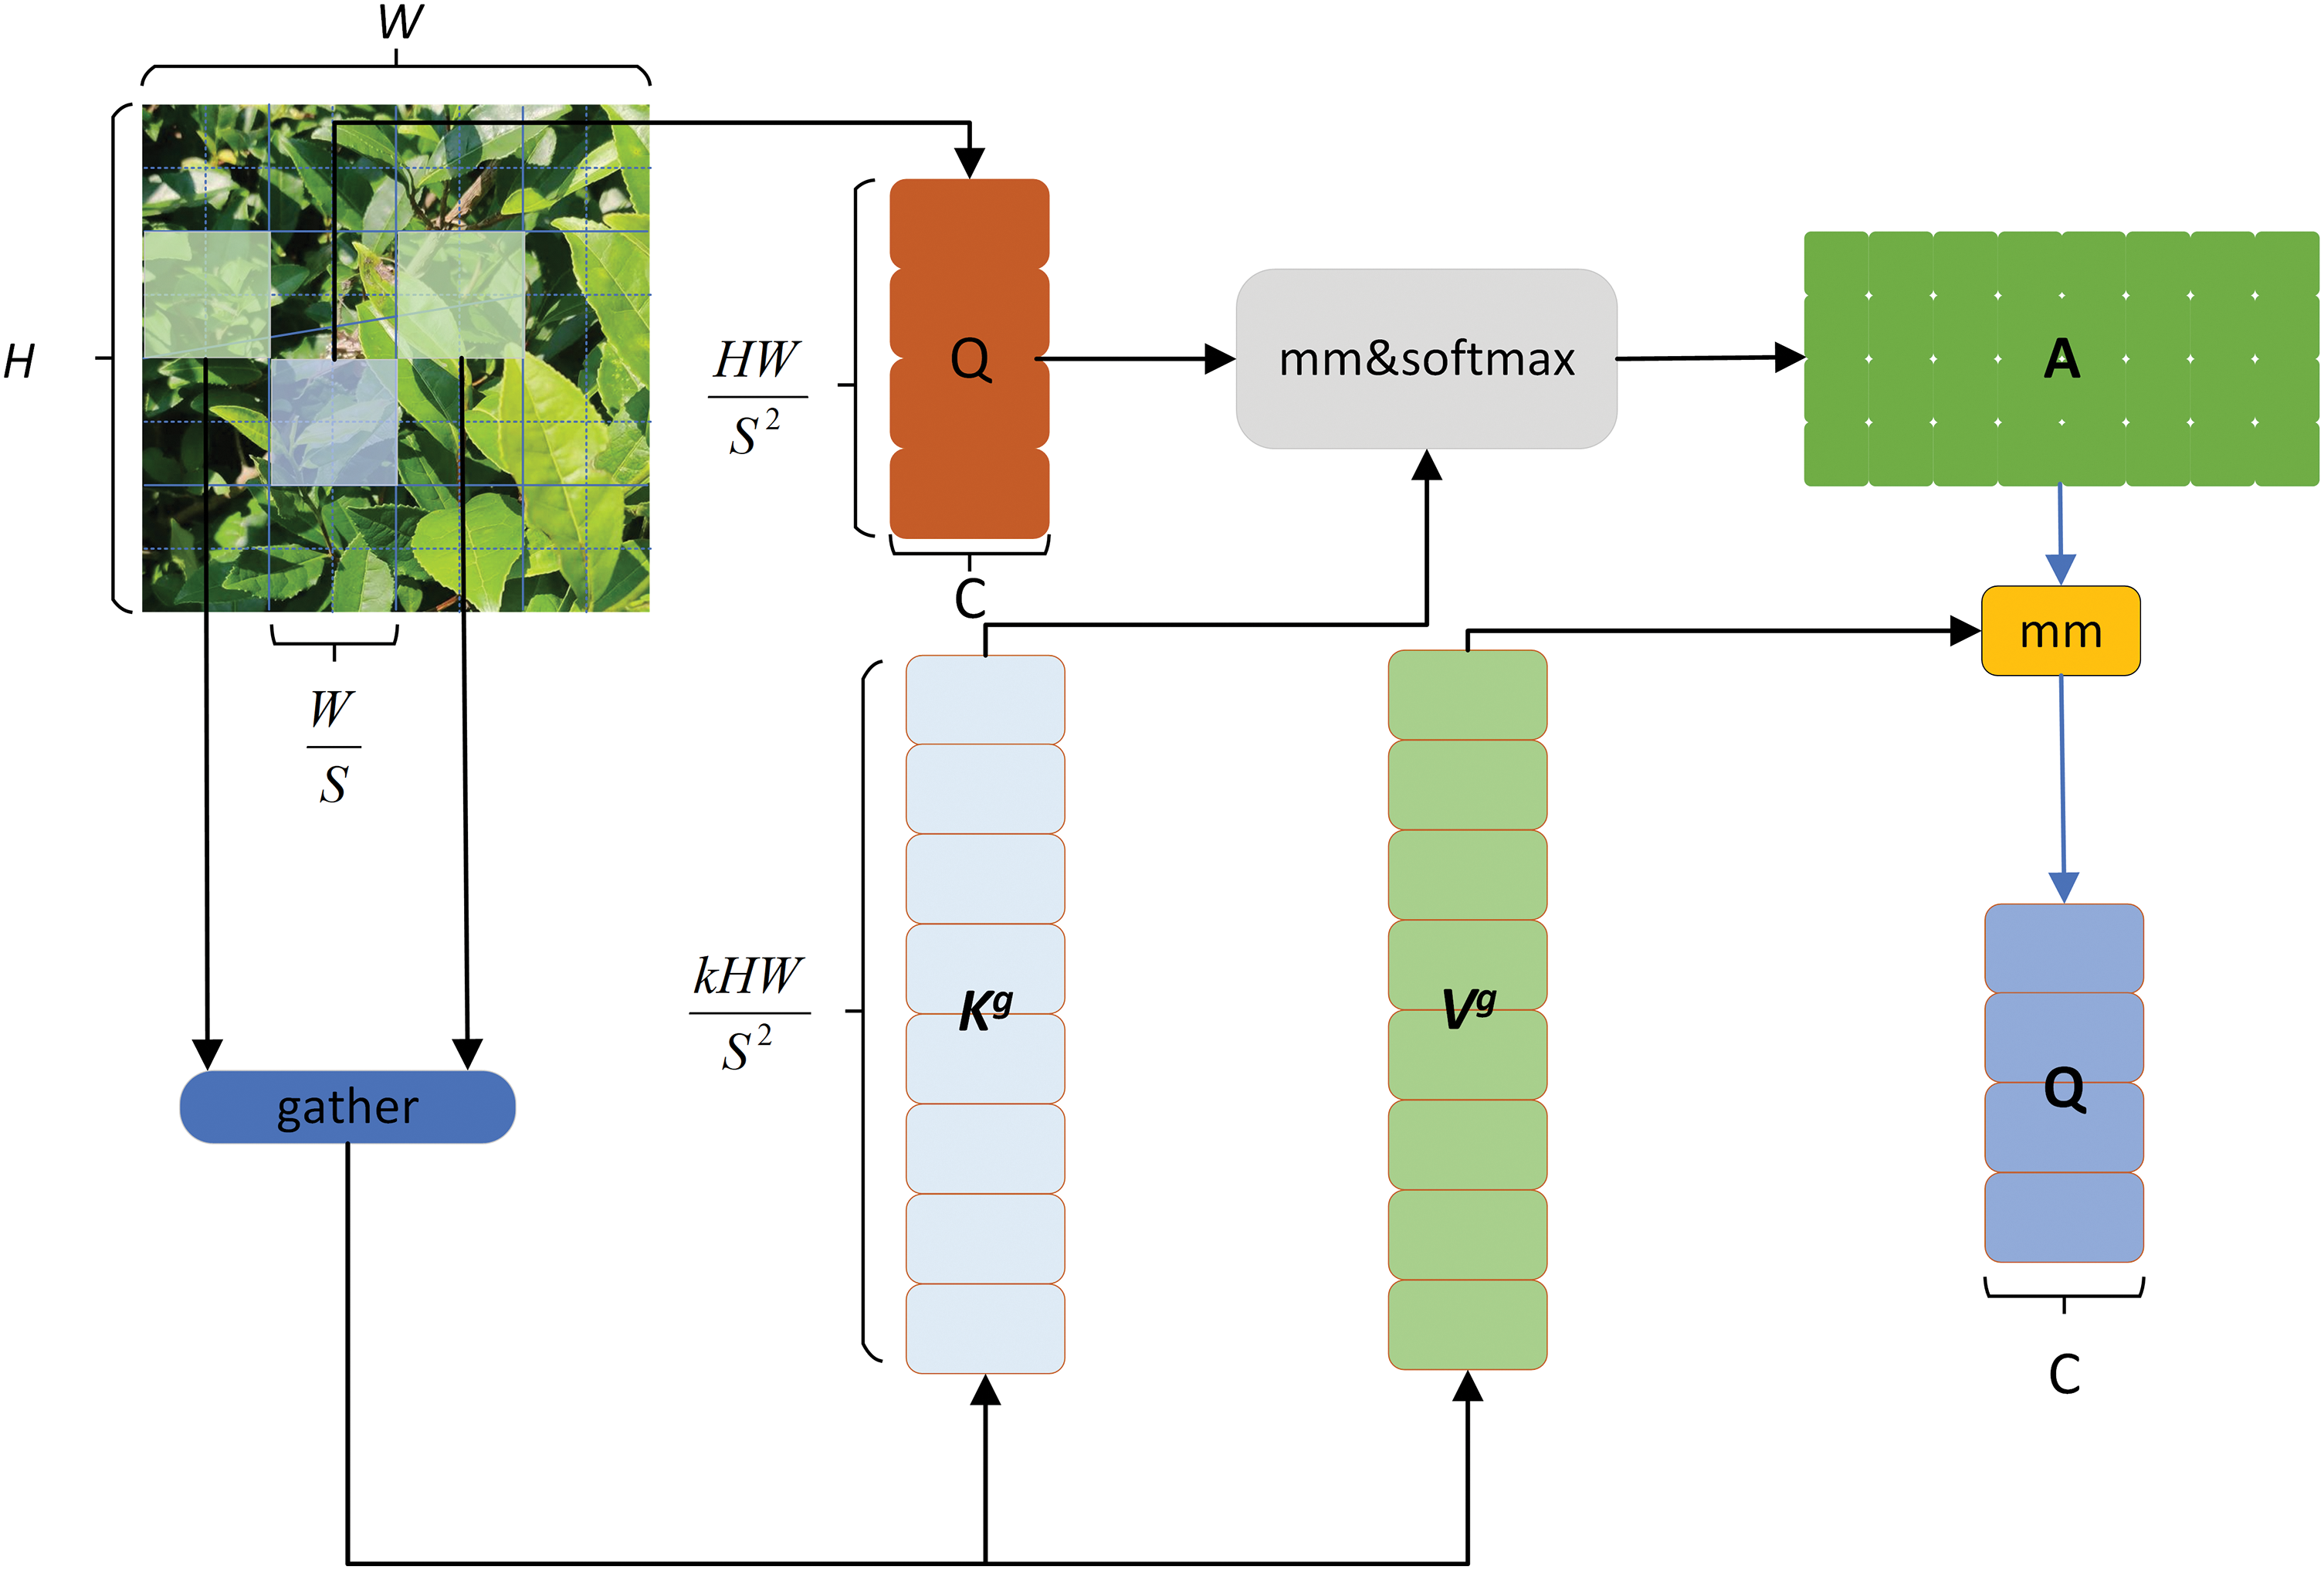
Figure 6: Bi-Level routing attention
The primary function of BRA is to enhance the model’s attention to key information while suppressing dependence on background information. BRA can adaptively filter out the least relevant key-value pairs in the coarse-grained region of the input feature map. This means it can concentrate the model’s computational resources on the information most relevant to the target, thereby more effectively extracting crucial features. In this way, BRA ensures that the model maintains high sensitivity and accurate recognition ability to the target, even in complex backgrounds. BRA enhances the model’s detection performance with a minimal increase in computational cost. In summary, BRA plays a crucial role in the YOLO-DBD network by improving sensitivity to key information through precise information filtering and attention calculation, reducing reliance on complex background information. This makes the YOLO-DBD network perform exceptionally well, more efficiently, and accurately in handling object detection tasks in complex backgrounds.
The process begins with the input feature map
Subsequently, a directed graph is constructed to locate the related areas within a given region, thereby determining the attention relationships between different regions. The specific steps are as follows: Firstly, the
Then, the adjacency matrix
Next, token-to-token attention is applied at a finer granularity level. For the queries located in region i, attention is only paid to the k regions specified by the routing index matrix
Finally, the aggregated
In order to enhance the perceptual capabilities of the model, this paper introduces a new dynamic detection framework called Dynamic Head (DyHead) [32], DyHead ingeniously integrates the spatial scale, spatial position information, and task awareness of objects, and utilizes a multi-head self-attention mechanism to enhance the expressive power of the model. This not only allows DyHead to adapt more flexibly to defects of different shapes but also significantly improves the model’s detection accuracy. Compared to the original head structure, DyHead demonstrates significantly enhanced expressive power and detection accuracy, showcasing its effectiveness and superiority in complex defect detection tasks.
DyHead enriches the target detection model’s perception by incorporating a unique attention mechanism with three distinct components: spatial-aware attention, scale-aware attention, and task-aware attention. Each component plays a crucial role in enhancing the model’s overall performance across different tasks, scales, and spatial locations:
(1) Spatial-Aware Attention: Using deformable convolution techniques, precise positional information of the targets is extracted from the feature map, ensuring the model accurately focuses on the spatial region where the targets are located.
(2) Scale-Aware Attention: By combining 1 × 1 convolution, ReLU activation function, and sigmoid activation function, features of different scales are merged, thereby obtaining spatial scale information of the target. This ensures the model’s robustness to targets of varying sizes.
(3) Task-Aware Attention: A fully connected network is used as a ‘classifier’ to expand and categorize input information, ensuring the model can extract the most relevant feature information according to different task requirements.
The application process of DyHead in the YOLOv8-DBD model is illustrated in Fig. 7: Firstly, feature extraction is performed on the input image as shown in Fig. 7a, generating three different scales of feature maps temp1, temp2, and temp3. These feature maps correspond to targets of different sizes in the image, where temp1 corresponds to large-sized targets, temp2 to medium-sized targets, and temp3 to small-sized targets. Subsequently, to facilitate feature fusion, temp1, temp2, and temp3 undergo up/down-sampling operations to achieve a uniform scale. This step ensures that feature maps of different scales can be effectively merged at the same spatial dimension. In this way, a new three-dimensional tensor
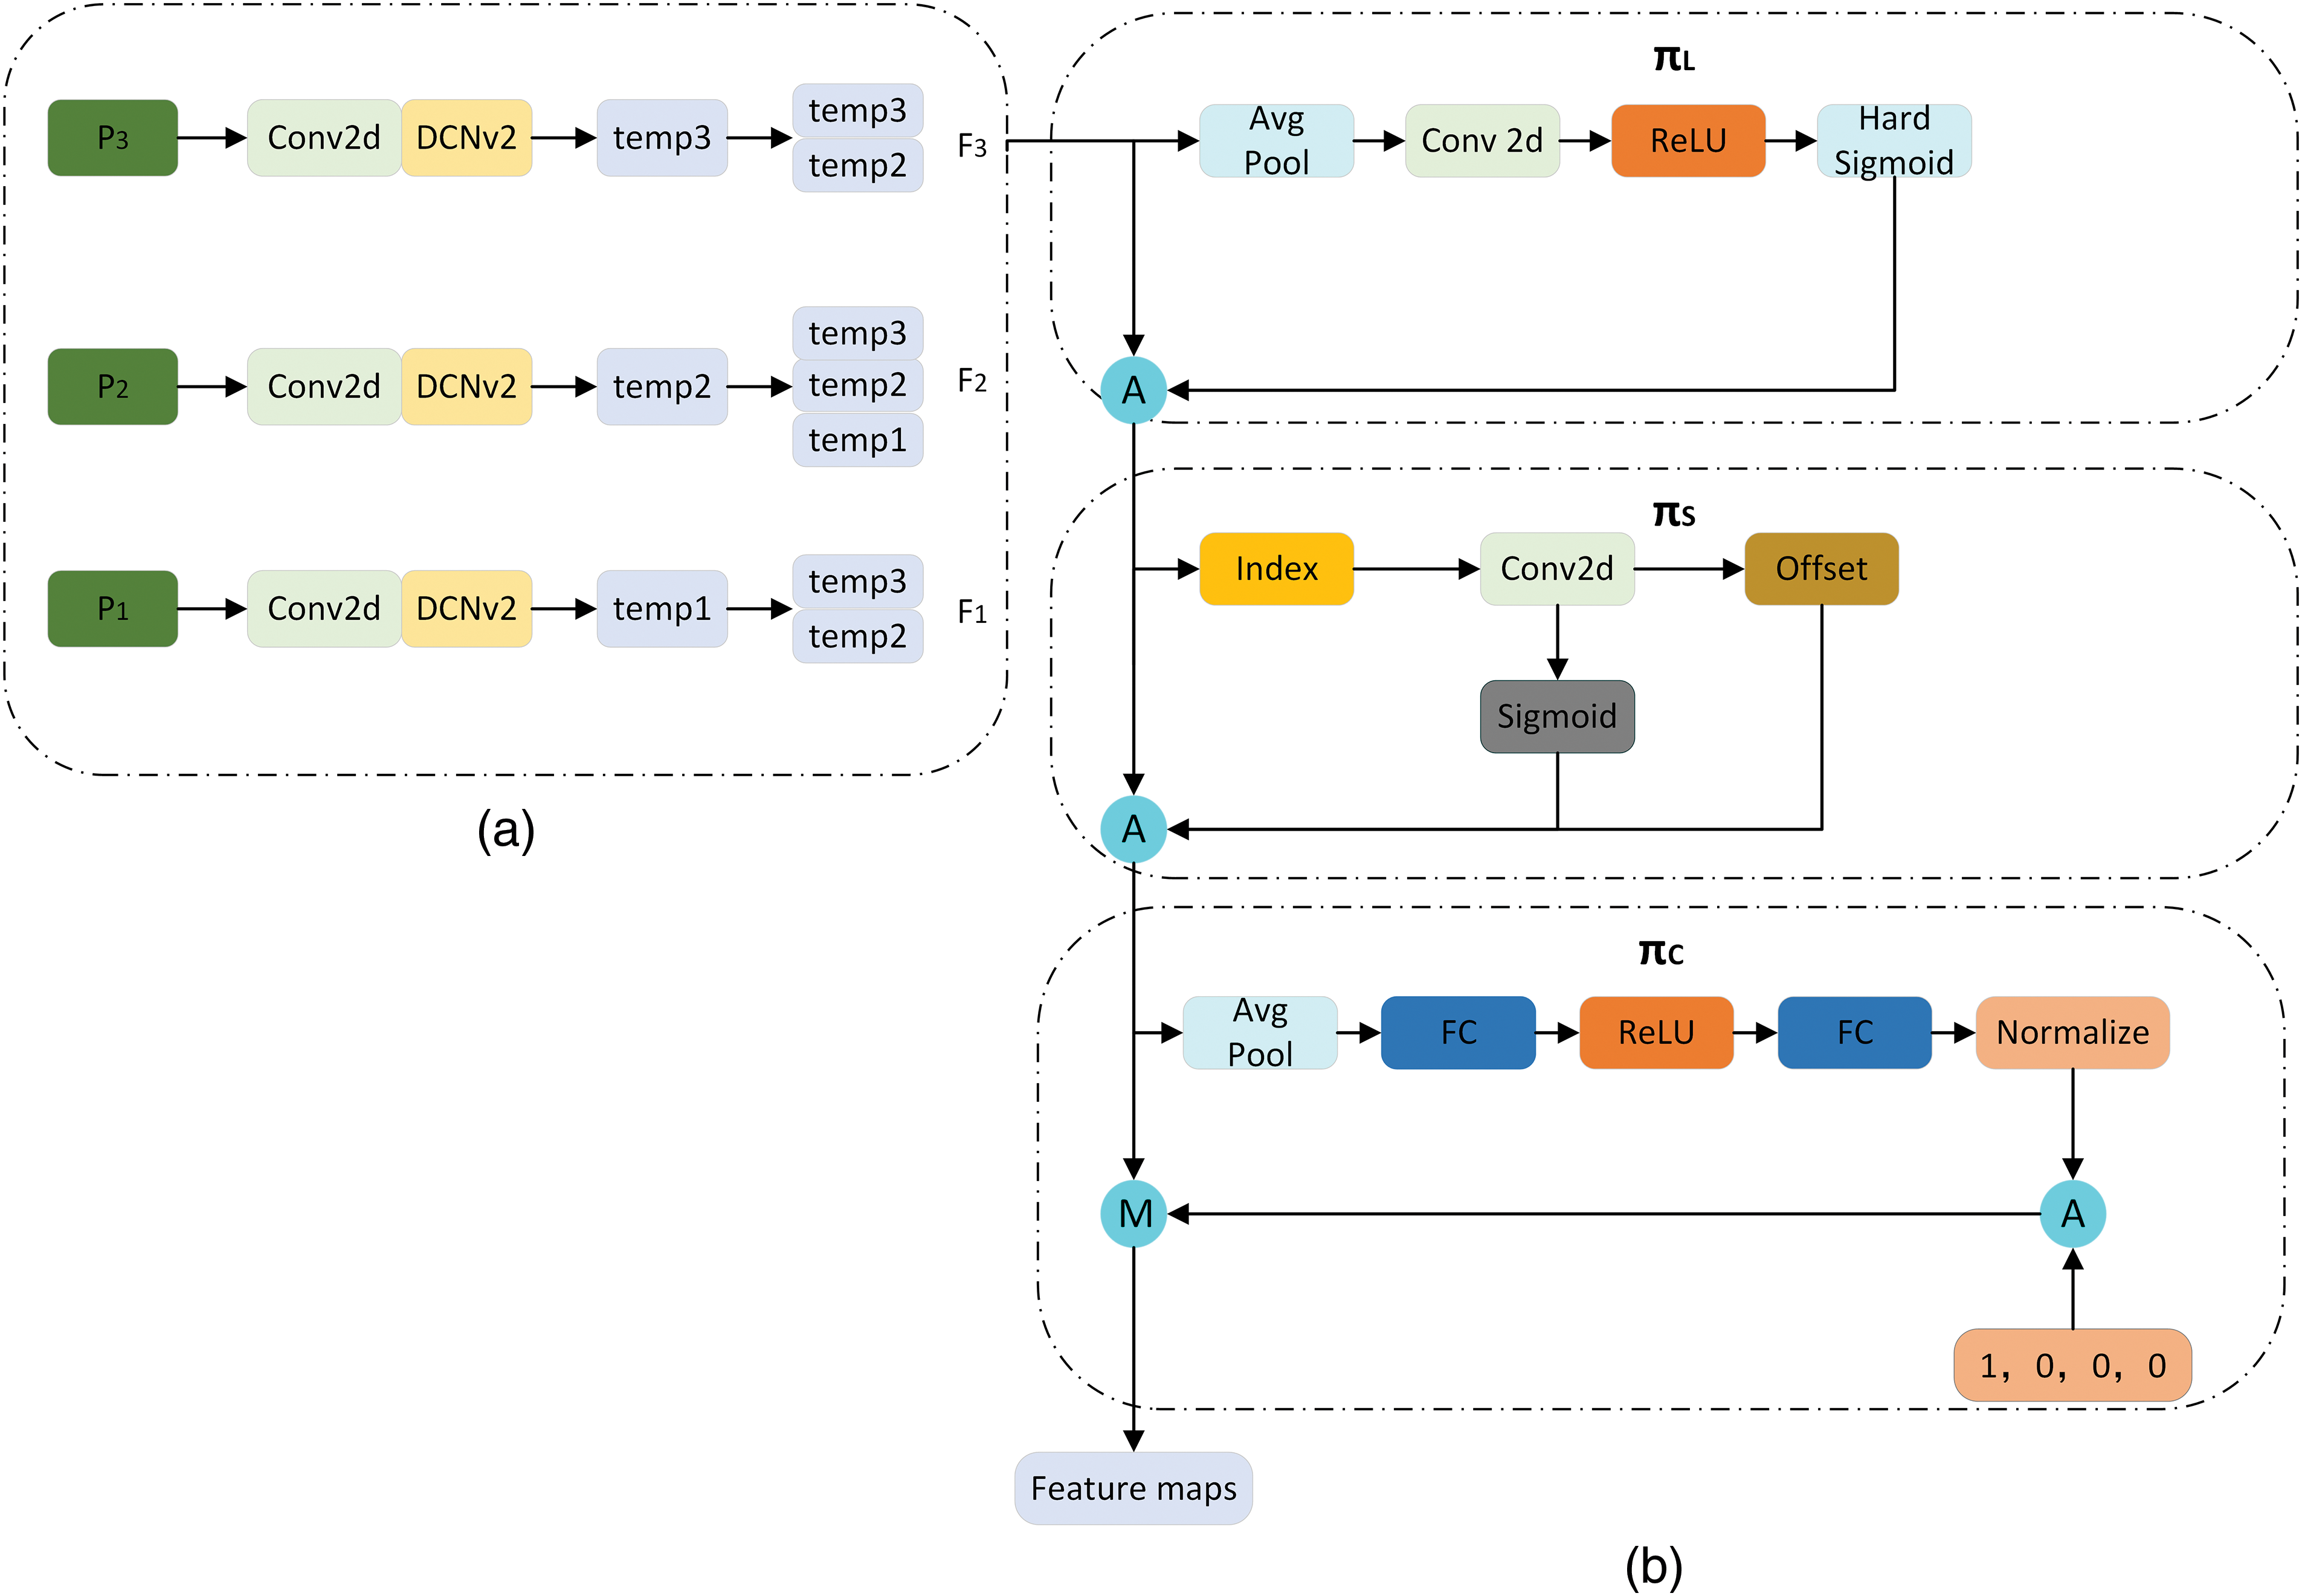
Figure 7: DyHead detection framework structure diagram
Subsequently, these three feature tensors
where
From the above expression, it is evident that significant enhancement in object detection tasks is achieved through in-depth learning of the tensor
By implementing the attention mechanism as fully connected layers, it is possible to perform complex attention operations on high-dimensional tensors, thereby capturing and enhancing the model’s capabilities for feature representation. However, this approach, when applied directly to high-dimensional tensors, incurs substantial computational costs, especially at higher dimensions, making it impractical in real-world applications. To address this issue, a decomposition strategy is employed, which breaks down the overall attention function into three consecutive sub-attention operations, each of which focuses on a single dimension of the tensor. This decomposition strategy significantly reduces computational costs while still maintaining the effectiveness of the attention mechanism. The computation formula is shown in Eq. (11):
In the equation,
The spatial-aware attention, as denoted by
Herein,
Scale-aware attention, as indicated by
Herein,
In the equation, Fc represents the feature segment of the c-th channel and
The three attention mechanism modules are sequentially applied. The detailed structure of the dynamic sealing module is illustrated in Fig. 7. Initially, the input image is processed to extract features at different scales,
YOLOv8 employs the CIOU Loss function to estimate the dissimilarity between the predicted values of the network model and the actual values [33]. The CIOU Loss function takes into account not only the overlap area between the predicted and the actual bounding boxes but also the distance between their centers and the similarity in aspect ratio. This provides a more comprehensive and precise evaluation method for object box regression. The computational formulas are presented in Eqs. (16)–(20):
In Eq. (16),
However, the process of predicting target bounding box regression often faces the issue of imbalanced training samples. Specifically, in an image, the number of high-quality anchor boxes with small regression errors is typically far less than that of low-quality anchor boxes with large errors. These low-quality anchor boxes, due to their significant regression errors, generate excessive gradients, adversely affecting the training process. Direct use of CIoU Loss often does not yield optimal results. To address this issue, this paper introduces Focal Loss, a loss function specifically designed to tackle sample imbalance problems. By combining CIoU Loss with Focal Loss [34], Focal-CIoU Loss is proposed. Focal-CIoU Loss approaches the issue from a gradient perspective, adjusting the form of the loss function to impose varying degrees of penalty on high and low-quality anchor boxes. Thus, even with a higher number of low-quality anchor boxes, their impact on the overall training process is effectively mitigated, while high-quality anchor boxes receive more attention and optimization. In this way, Focal-CIoU Loss better balances the impact of anchor boxes of varying qualities, thereby enhancing the performance of object detection. The formula is presented in Eq. (21):
In the formula,
4 Experimental Results and Analysis
The experimental setup for this study is as follows: Windows 10 operating system, CPU is AMD EPYC 7543 with 32 cores, turbo frequency is 3.7 GHz, GPU is NVIDIA RTX 3090 (24 GB), CUDA 11.3, training conducted in PyTorch 1.11 and Python 3.8 environments. Model training parameters include a batch size of 64 for each training iteration, 200 epochs, 16 worker threads, and a learning rate of 0.001.
To evaluate the performance of the YOLO-DBD model, the study selected 10 commonly used deep learning algorithms for multi-class harmful leaves detection experiments and compared their performance with that of the YOLO-DBD. From the comparison results in Table 1, it can be seen that the YOLOv8-DBD network has achieved a significant improvement in mAP compared to the YOLOv8s network, indicating more accurate recognition of different classes of harmful leaves. Simultaneously, the FLOPs of the YOLO-DBD, indicating the model’s computational complexity, were also reduced, signifying increased efficiency. However, the detection speed of the YOLO-DBD is lower, which may be due to a more complex model structure or the use of a more refined feature extraction mechanism. Additionally, there was a slight increase in the number of parameters of the model.

In multi-class harmful leaf detection tasks, the YOLO-DBD network demonstrated significant performance advantages, particularly when compared with several popular deep learning models. Specifically, compared to Faster-RCNN and SSD, the YOLO-DBD’s mAP0.5 improved by 12.4% and 14.1%, respectively. Additionally, the mAP and FPS of IHL, CHL, and OHL were significantly improved, while the model’s parameter count, and FLOPs were notably reduced. Compared to YOLOv5s and YOLOv7-Tiny, the YOLO-DBD’s mAP0.5 increased by 11.1% and 10.3%, respectively. Although FPS slightly decreased, the mAP 0.5 of IHL, CHL, and OHL improved significantly. Further comparison of the YOLO-DBD with YOLOv9s and YOLOv10s showed that the YOLO-DBD’s mAP0.5 increased by 8.4%, with significant gains in CHL and OHL’s mAP0.5, although the detection speed was slower than these two models. Additionally, compared to YOLOv8m, YOLOv8l, and YOLOv8x, YOLO-DBD’s mAP0.5 increased by 3.3%, 1.7%, and 2.8%, respectively, while showing advantages in computational complexity and FPS. Overall, the YOLO-DBD effectively optimized model efficiency and computational load while improving detection accuracy. Although detection speed decreased slightly, it demonstrated significant competitiveness among many deep learning models.
Fig. 8 provides a visual comparison, showcasing the performance of the YOLO-DBD and 10 other deep-learning models in detecting multiple harmful leaf targets after cropping. The results show that the YOLO-DBD excelled in this task, accurately detecting all targets, while the other models exhibited varying degrees of detection errors. Specifically, models like SSD, YOLOv5s, YOLOv8m, and YOLOv10s incorrectly classified non-harmful leaves as harmful. Additionally, models such as Faster-RCNN, SDD, YOLOv5s, YOLOv7-Tiny, YOLOv7, YOLOv8s, YOLOv8m, YOLOv8x, and YOLOv9s missed at least one target detection. Moreover, Faster-RCNN, SDD, YOLOv7-Tiny, YOLOv8s, YOLOv8m, and YOLOv9 models encountered at least one instance of target misclassification. These results highlight the advantages of YOLO-DBD in handling target detection tasks in complex scenarios, particularly in applications where accurate identification of different target categories is essential. The high accuracy and robustness of YOLO-DBD make it a deep-learning model with significant advantages in practical agricultural applications.
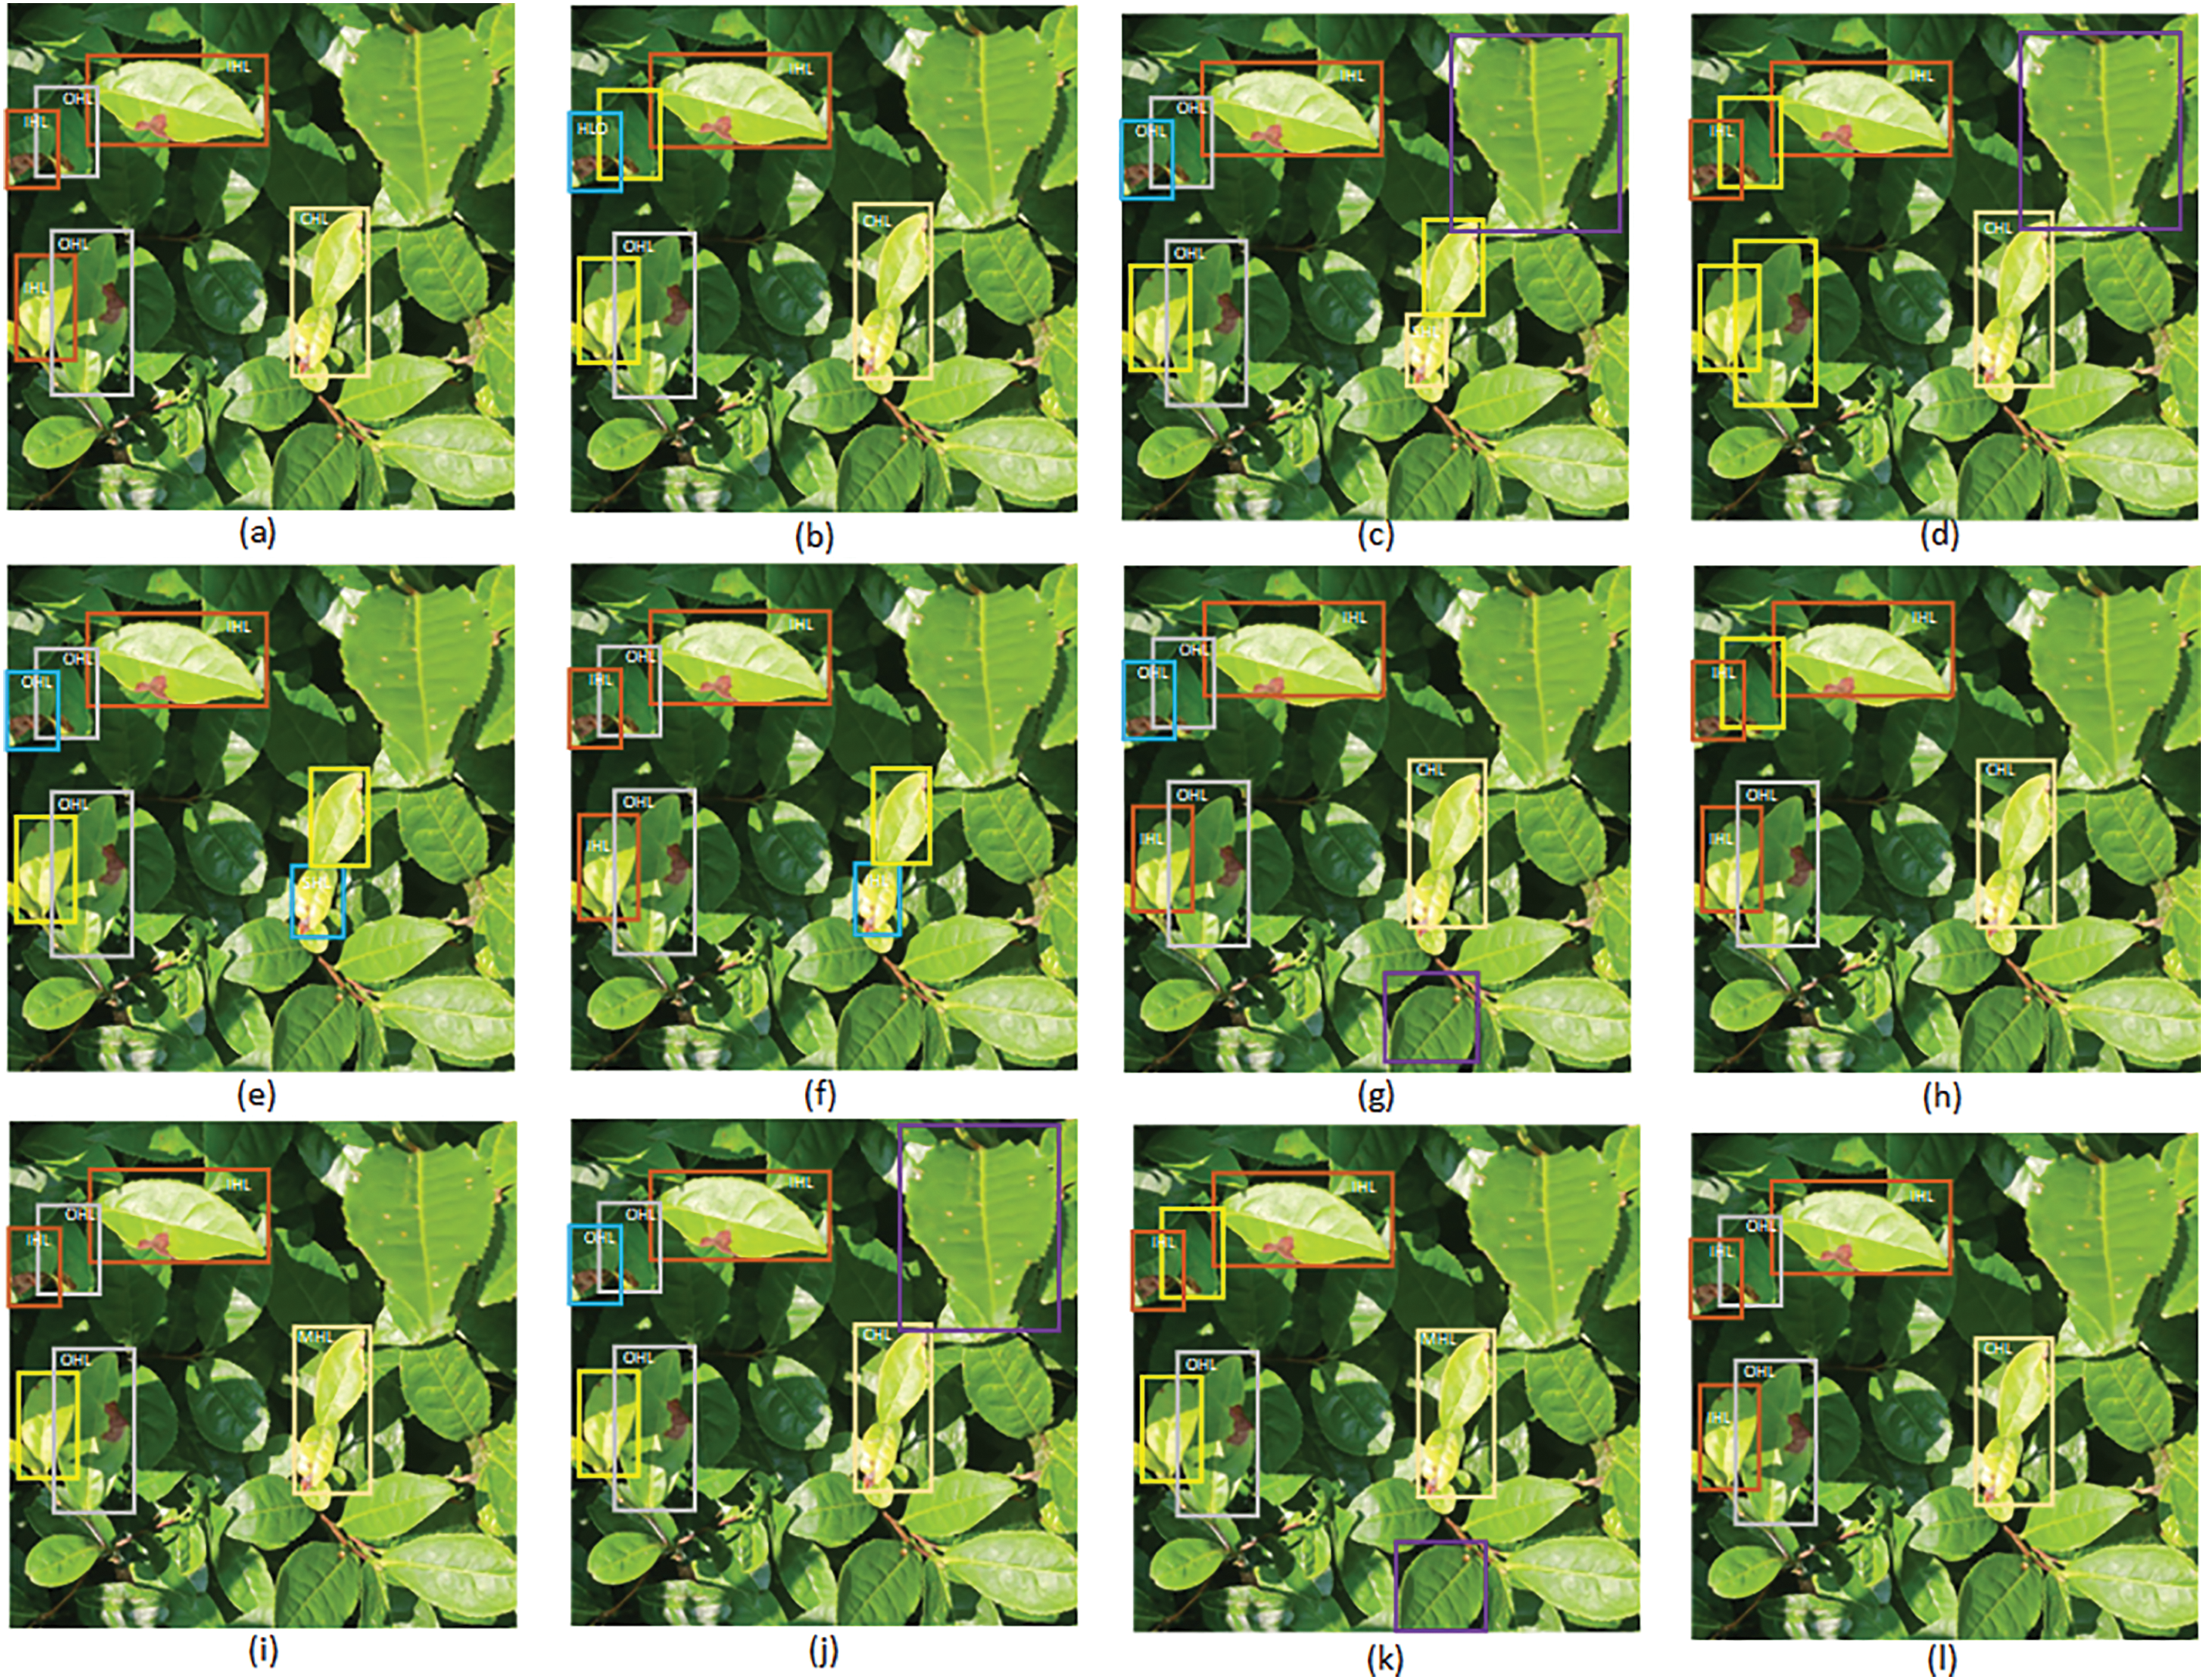
Figure 8: To detect harmful leaves using various deep learning models: (a) manually annotated image; (b) Faster-RCNN, (c) SSD; (d) YOLOv5s; (e) YOLOv7-Tiny; (f) YOLOv8s; (g) YOLOv8m; (h) YOLOv8l; (i) YOLOv8x; (j) YOLOv9s; (k) YOLOv10s; (l) YOLOv8-DBD. Yellow boxes indicate undetected harmful leaves, blue boxes represent misclassified categories, and purple boxes indicate detection errors in the bounding box
To verify the effectiveness of the improved modules proposed in this paper, a comparative analysis was conducted on the network performance of different improved modules. The performance test results of different networks are shown in Table 2. As can be seen from Table 2, different improvement methods have certain impacts on network performance. An analysis of the performance after various network structural improvements was conducted, demonstrating the effects of different network structural improvements on the model’s ability to detect harmful leaves.

By conducting experimental comparisons, improvement 1 added DCNv2 to the basic C2f model, resulting in a 1.4% increase in mAP0.5 compared to the initial model. This enhancement more effectively captures the shape and position characteristics of targets, better adapting the network’s perception capabilities in complex environments. Improvement 2 involved modifications to the detection head, replacing the original with Dyhead, which further enhanced the perception of spatial location, scale, and task regions in the head. This not only increased the mAP0.5 by 2.1% but also reduced FLOPs by 10.4%, making it more suitable for deployment on embedded mobile terminals. Users can choose a less expensive processor with minimal sacrifice in detection performance. Improvement 3 introduced a BRA mechanism at the end of the backbone network, slightly increasing computational demands but enhancing feature extraction capabilities, with a 0.9 increase in mAP0.5 and a 13.1% increase in detection speed over the original. Improvement 4 incorporated Focal Loss on top of CIOU, significantly addressing the issue of sample imbalance and resulting in a 1.6% increase in mAP0.5.
The confusion matrices of the YOLOv8-DBD and YOLOv8-s are shown in Fig. 9a,b. Here, True represents the true distribution of categories, and Predict represents the predicted distribution of categories. The confusion matrix reveals that YOLOv8-DBD achieves a higher true positive rate for each category compared to YOLOv8s, indicating that the YOLOv8-DBD performs better in terms of both precision and recall.
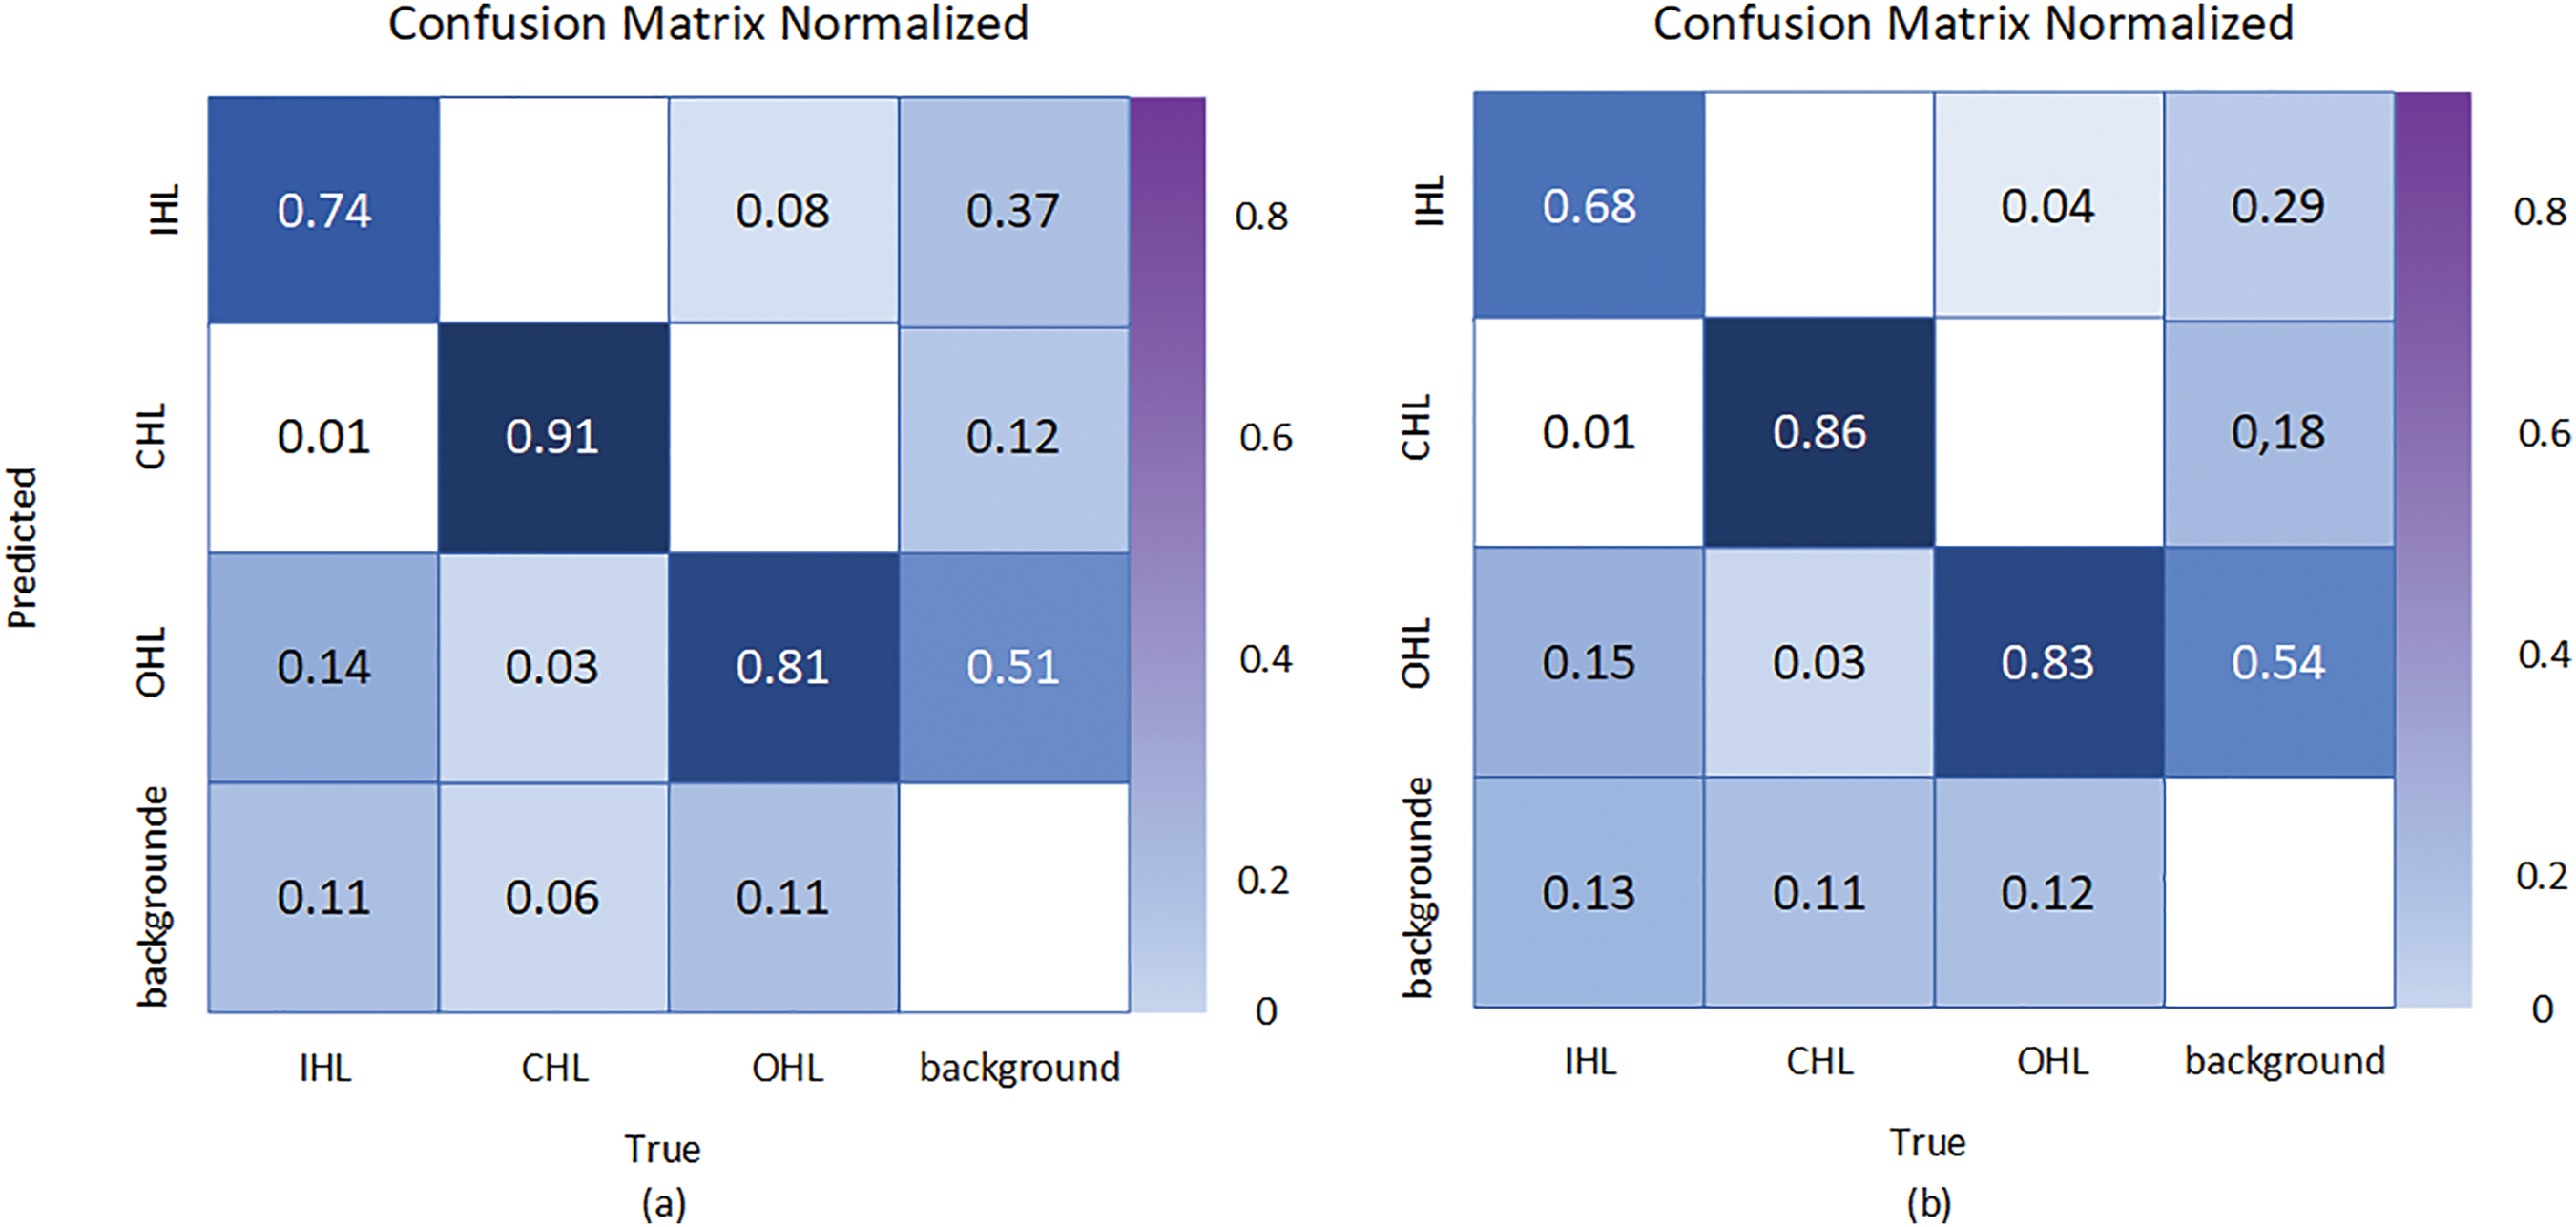
Figure 9: Results of ablation experiments
This paper proposes a method for detecting multiple classes of harmful leaves in target harvesting on the YOLO-DBD network model. The YOLO-DBD network comprises C2f-DCN, BRA, SPP, PAN-FPN, and Dyhead. C2f-DCN effectively captures target features and enhances detail perception. BRA enhances feature extraction and reduces computational overhead. Additionally, Dyhead enhances spatial, scale, and task area perception, thereby improving detection accuracy. Finally, CIOU-Focal Loss effectively addresses sample imbalance issues, enhancing the accuracy and stability of the model.
Experiments conducted in complex and dense tea plantation environments indicate that the YOLO-DBD achieves a mAP0.5 value of 86.8% for the detection of multiple categories of harmful leaves. The mAP0.5 values for single harmful leaves, clustered harmful leaves, and occluded harmful leaves are 85.5%, 91.5%, and 83.2%, respectively. Compared to the other 10 commonly used deep learning networks, including Faster-RCNN, the YOLO-DBD model attains the highest mAP0.5 in detecting tea leaves while maintaining commendable detection speed. It can offer crucial guidance for robotic arms during pruning processes related to posture and obstacle avoidance.
Acknowledgement: We would like to express our sincere gratitude to all those who contributed to the success of this study.
Funding Statement: The authors received no specific funding for this study.
Author Contributions: The authors confirm contribution to the paper as follows: study conception and design: Jiakai Chen, Xin Leng, Jianping Huang; data collection: Lei Zhang, Zongxuan Li, Jiakai Chen; analysis and interpretation of results: Jiakai Chen, Xin Leng; draft manuscript preparation: Jiakai Chen, Xin Leng, Jianping Huang. All authors reviewed the results and approved the final version of the manuscript.
Availability of Data and Materials: The datasets produced and analyzed during the present study can be obtained from the corresponding author upon request.
Ethics Approval: Not applicable.
Conflicts of Interest: The authors declare that they have no conflicts of interest to report regarding the present study.
References
1. Yu S, X. DU, Feng H, li Y. TTLD-YOLOv7: tea plant disease detection algorithm in unstructured environment. J Tea Sci. 2024;44(3):453–68. [Google Scholar]
2. Du M, Li X, Cai D, Zhao Y, Li Q, Wang J, et al. In-silico study of reducing human health risk of POP residues’ direct (from tea) or indirect exposure (from tea garden soilimproved rhizosphere microbial degradation, toxicity control, and mechanism analysis. Ecotoxicol Environ Saf. 2022;242:113910. doi:10.1016/j.ecoenv.2022.113910 [Google Scholar] [PubMed] [CrossRef]
3. Ahmed S, Griffin T, Cash SB, Han W-Y, Matyas C, Long C, et al. Global climate change, ecological stress, and tea production. In: Stress physiology of tea in the face of climate change. Berlin: Springer Nature Link; 2018. p. 1–23. [Google Scholar]
4. Yang N, Yuan M, Wang P, Zhang R, Sun J, Mao H. Tea diseases detection based on fast infrared thermal image processing technology. J Sci Food Agric. 2019;99(7):3459–66. doi:10.1002/jsfa.2019.99.issue-7. [Google Scholar] [CrossRef]
5. Zhang C, Wang B, Li W, Li D. Incorporating artificial intelligence in detecting crop diseases: agricultural decision-making based on group consensus model with MULTIMOORA and evidence theory. Crop Protection. 2024;179:106632. doi:10.1016/j.cropro.2024.106632. [Google Scholar] [CrossRef]
6. Damalas CA, Eleftherohorinos IG. Pesticide exposure, safety issues, and risk assessment indicators. Int J Environ Res Public Health. 2011;8(5):1402–19. doi:10.3390/ijerph8051402 [Google Scholar] [PubMed] [CrossRef]
7. Li W. Key points for prevention and control of tea leaf blight. Fortune World. 2018;58:58–62. [Google Scholar]
8. Arad B, Balendonck J, Barth R, Ben-Shahar O, Edan Y, Hellström T, et al. Development of a sweet pepper harvesting robot. J Field Robot. 2020;37(6):1027–39. doi:10.1002/rob.21937. [Google Scholar] [CrossRef]
9. Wu Z, Chen Y, Zhao B, Kang X, Ding Y. Review of weed detection methods based on computer vision. Sensors. 2021;21(11):3647. doi:10.3390/s21113647 [Google Scholar] [PubMed] [CrossRef]
10. Nath M, Mitra P, Kumar D. A novel residual learning-based deep learning model integrated with attention mechanism and SVM for identifying tea plant diseases. Int J Comput Appl. 2023;45(6):471–84. doi:10.1080/1206212X.2023.2235750. [Google Scholar] [CrossRef]
11. Sun Y, Jiang Z, Zhang L, Dong W, Rao Y. SLIC_SVM based leaf diseases saliency map extraction of tea plant. Comput Electron Agric. 2019;157(2):102–9. doi:10.1016/j.compag.2018.12.042. [Google Scholar] [CrossRef]
12. Yin C, Zeng T, Zhang H, Fu W, Wang L, Yao S. Maize small leaf spot classification based on improved deep convolutional neural networks with a multi-scale attention mechanism. Agronomy. 2022;12(4):906. doi:10.3390/agronomy12040906. [Google Scholar] [CrossRef]
13. Fu L, Majeed Y, Zhang X, Karkee M, Zhang Q. Faster R-CNN–based apple detection in dense-foliage fruiting-wall trees using RGB and depth features for robotic harvesting. Biosyst Eng. 2020;197(6):245–56. doi:10.1016/j.biosystemseng.2020.07.007. [Google Scholar] [CrossRef]
14. Zhou G, Zhang W, Chen A, He M, Ma X. Rapid detection of rice disease based on FCM-KM and faster R-CNN fusion. IEEE Access. 2019;7:143190–206. doi:10.1109/ACCESS.2019.2943454. [Google Scholar] [CrossRef]
15. Lee SH, Lin SR, Chen SF. Identification of tea foliar diseases and pest damage under practical field conditions using a convolutional neural network. Plant Pathol. 2020;69(9):1731–9. doi:10.1111/ppa.13251. [Google Scholar] [CrossRef]
16. Wang H. Tea disease detection and severity estimation in natural scene images based on deep learning (Ph.D. Thesis). Anhui University: China; 2021. [Google Scholar]
17. Redmon J, Divvala S, Girshick R, Farhadi A. You only look once: unified, real-time object detection. In: Proceedings of the IEEE Conference on Computer Vision and Pattern Recognition, Jun 26–Jul 1; Las Vegas, NV, USA. [Google Scholar]
18. Liu W, Anguelov D, Erhan D, Szegedy C, Reed S, Fu C-Y, et al. Ssd: single shot multibox detector. In: Computer Vision–ECCV 2016: 14th European Conference, Proceedings, Part I 14, 2016 Oct 11–14; Amsterdam, The Netherlands: Springer. [Google Scholar]
19. Sun D, Liu H, Liu J, Ding Z, Xie J, Wang W. Tea disease recognition based on improved YOLOv4 modeling. J Northwest A&F Univ (Nat Sci Ed). 2023;51(9):145–54 (In Chinese). [Google Scholar]
20. Bao W, Zhu Z, Hu G, Zhou X, Zhang D, Yang X. UAV remote sensing detection of tea leaf blight based on DDMA-YOLO. Comput Electron Agric. 2023;205:107637. doi:10.1016/j.compag.2023.107637. [Google Scholar] [CrossRef]
21. Xue Z, Xu R, Bai D, Lin H. YOLO-Tea: a tea disease detection model improved by YOLOv5. Forests. 2023;14(2):415. doi:10.3390/f14020415. [Google Scholar] [CrossRef]
22. Lin J, Bai D, Xu R, Lin H. TSBA-YOLO: an improved tea diseases detection model based on attention mechanisms and feature fusion. Forests. 2023;14(3):619. doi:10.3390/f14030619. [Google Scholar] [CrossRef]
23. Dai G, Fan J. An industrial-grade solution for crop disease image detection tasks. Front Plant Sci. 2022;13:921057. doi:10.3389/fpls.2022.921057 [Google Scholar] [PubMed] [CrossRef]
24. Soeb MJA, Jubayer MF, Tarin TA, Al Mamun MR, Ruhad FM, Parven A, et al. Tea leaf disease detection and identification based on YOLOv7 (YOLO-T). Sci Rep. 2023;13(1):6078. doi:10.1038/s41598-023-33270-4 [Google Scholar] [PubMed] [CrossRef]
25. Roy AM, Bose R, Bhaduri J. A fast accurate fine-grain object detection model based on YOLOv4 deep neural network. Neural Comput Appl. 2022;34(5):3895–921. doi:10.1007/s00521-021-06651-x. [Google Scholar] [CrossRef]
26. Sun C, Huang C, Zhang H, Chen B, An F, Wang L, et al. Individual tree crown segmentation and crown width extraction from a heightmap derived from aerial laser scanning data using a deep learning framework. Front Plant Sci. 2022;13:914974. doi:10.3389/fpls.2022.914974 [Google Scholar] [PubMed] [CrossRef]
27. Du X, Meng Z, Ma Z, Lu W, Cheng H. Tomato 3D pose detection algorithm based on keypoint detection and point cloud processing. Comput Electron Agric. 2023;212(2):108056. doi:10.1016/j.compag.2023.108056. [Google Scholar] [CrossRef]
28. Nan Y, Zhang H, Zeng Y, Zheng J, Ge Y. Intelligent detection of multi-class pitaya fruits in target picking row based on WGB-YOLO network. Comput Electron Agric. 2023;208(6):107780. doi:10.1016/j.compag.2023.107780. [Google Scholar] [CrossRef]
29. Dai J, Qi H, Xiong Y, Li Y, Zhang G, Hu H, et al. Deformable convolutional networks. In: Proceedings of the IEEE International Conference on Computer Vision, 2017 Oct 22–29; Venice, Italy. [Google Scholar]
30. Wang R, Shivanna R, Cheng D, Jain S, Lin D, Hong L, et al. DCN V2: improved deep & cross network and practical lessons for web-scale learning to rank systems. In: Proceedings of the Web Conference 2021, 2021 Apr 19–23; Ljubljana, Slovenia. [Google Scholar]
31. Zhu L, Wang X, Ke Z, Zhang W, Lau RW. Biformer: vision transformer with bi-level routing attention. In: Proceedings of the IEEE/CVF Conference on Computer Vision and Pattern Recognition, 2023 Jun 18–22; Vancouver, BC, Canada. [Google Scholar]
32. Dai X, Chen Y, Xiao B, Chen D, Liu M, Yuan L, et al. Dynamic head: unifying object detection heads with attentions. In: Proceedings of the IEEE/CVF Conference on Computer Vision and Pattern Recognition, 2021 Jun 19–25. [Google Scholar]
33. Zheng Z, Wang P, Liu W, Li J, Ye R, Ren D. Distance-IoU loss: faster and better learning for bounding box regression. In: Proceedings of the AAAI Conference on Artificial Intelligence, 2020 Feb 7–12; New York, NY, USA. [Google Scholar]
34. Lin T-Y, Goyal P, Girshick R, He K, Dollár P. Focal loss for dense object detection. In: Proceedings of the IEEE International Conference on Computer Vision, 2017 Oct 22–29; Venice, Italy. [Google Scholar]
Cite This Article
 Copyright © 2024 The Author(s). Published by Tech Science Press.
This work is licensed under a Creative Commons Attribution 4.0 International License , which permits unrestricted use, distribution, and reproduction in any medium, provided the original work is properly cited.


 Submit a Paper
 Propose a Special lssue
 View Full Text
 Download PDF
 Downloads
 Citation Tools