 Open Access
ARTICLE
Development of Spectral Features for Monitoring Rice Bacterial Leaf Blight Disease Using Broad-Band Remote Sensing Systems
1 College of Artificial Intelligence, Hangzhou Dianzi University, Hangzhou, 310018, China
2 School of Information Engineering, Zhejiang University of Water Resources and Electric Power, Hangzhou, 310018, China
3 Key Laboratory of Digital Earth Science, Aerospace Information Research Institute, Chinese Academy of Sciences, Beijing, 100094, China
* Corresponding Author: Lin Yuan. Email:
Phyton-International Journal of Experimental Botany 2024, 93(4), 745-762. https://doi.org/10.32604/phyton.2024.049734
Received 16 January 2024; Accepted 19 March 2024; Issue published 29 April 2024
Abstract
As an important rice disease, rice bacterial leaf blight (RBLB, caused by the bacterium Xanthomonas oryzae pv. oryzae), has become widespread in east China in recent years. Significant losses in rice yield occurred as a result of the disease’s epidemic, making it imperative to monitor RBLB at a large scale. With the development of remote sensing technology, the broad-band sensors equipped with red-edge channels over multiple spatial resolutions offer numerous available data for large-scale monitoring of rice diseases. However, RBLB is characterized by rapid dispersal under suitable conditions, making it difficult to track the disease at a regional scale with a single sensor in practice. Therefore, it is necessary to identify or construct features that are effective across different sensors for monitoring RBLB. To achieve this goal, the spectral response of RBLB was first analyzed based on the canopy hyperspectral data. Using the relative spectral response (RSR) functions of four representative satellite or UAV sensors (i.e., Sentinel-2, GF-6, Planet, and Rededge-M) and the hyperspectral data, the corresponding broad-band spectral data was simulated. According to a thorough band combination and sensitivity analysis, two novel spectral indices for monitoring RBLB that can be effective across multiple sensors (i.e., RBBRI and RBBDI) were developed. An optimal feature set that includes the two novel indices and a classical vegetation index was formed. The capability of such a feature set in monitoring RBLB was assessed via FLDA and SVM algorithms. The result demonstrated that both constructed novel indices exhibited high sensitivity to the disease across multiple sensors. Meanwhile, the feature set yielded an overall accuracy above 90% for all sensors, which indicates its cross-sensor generality in monitoring RBLB. The outcome of this research permits disease monitoring with different remote sensing data over a large scale.Keywords
Rice bacterial leaf blight (RBLB, caused by the bacterium Xanthomonas oryzae pv. oryza) is a foliar disease that causes 10%–50% yield loss, and its prevalence has been increasing in recent years [1]. Given the disease tends to disperse over the field rapidly, timely monitoring of RBLB is crucial to the control and prevention of the disease at a regional scale [2].
Traditional visual inspection of crop diseases and pests is time-consuming and subjective, which makes it difficult to achieve effective and rapid monitoring within a large area. As remote sensing (RS) technology can obtain spatially continuous information over a large area efficiently, it is of great potential to be applied in the monitoring of crop diseases and pests [3]. Considering the diversity of the symptoms of crop diseases and pests, it is essential to understand the spectral response of a certain pest or disease before its RS monitoring [4]. Zhang et al. [5] diagnosed the rice sheath blight disease by in-situ hyperspectral data and selected 494, 666, and 842 nm as sensitive wavelengths, which achieved an overall accuracy of 95.92%. To detect and discriminate the southern corn rust disease, Meng et al. [6] identified 572, 766, and 1445 nm wavelengths from the in-situ leaf reflectance spectra to develop a specific index. Based on this index, the disease detection model achieved an overall accuracy of 87%. In detecting rice blast disease, Mandal et al. [7] found that the Triangular Vegetation Index (TVI) can serve as an effective surrogate, and the accuracy of the regression model reached R2 of 0.85. The spectral characteristics of crop diseases and pests can provide important reference information for developing the RS monitoring models at a large scale.
Despite recent studies concerning spectral analysis on crop diseases or pests relying mainly on leaf/canopy level hyperspectral data, the satellite-based hyperspectral data is of insufficient spatial resolution, swath width and revisit period. While for the unmanned aerial vehicle (UAV) based hyperspectral data, the cost of collecting and processing is relatively high [8,9]. By contrast, the multispectral satellite and UAV data are superior in spatial/temporal resolutions and data availability. Some recent multispectral remote sensors also have optimized channel settings and many of them include red-edge channels which are critical in crop stress monitoring [10]. Chen et al. [11] mapped wheat rust using the ZY-3 satellite imageries with indices like the Soil Adjusted Vegetation Index (SAVI) and Modified Triangular Vegetation Index (MTVI), and the overall accuracy achieved higher than 90%. Based on the UAV multispectral data, Gu et al. [12] assessed the severity of the rice narrow brown leaf spot disease according to the indices such as the Visible-band Difference Vegetation Index (VDVI), Excess Green minus excess Red index (ExGR) and an inversion model, which generated an accuracy as R2 of 0.93. In detecting the European spruce bark beetle, Abdullah et al. [13] compared Sentinel-2 with Landsat-8, and found that the Red Edge Normalized Difference Vegetation Index (RENDVI) from the Sentinel-2 was more effective in mapping the pest at the green-attack stage with a detection rate of 67%. The above study cases showed that broad-band sensors have great potential in monitoring crop diseases and pests. However, given different multispectral sensors have varied channel settings, before the monitoring, it is necessary to assess the feasibility of the sensors according to their relative spectral response (RSR) function and the spectral response characteristics of the disease or pest. By taking the RSR function simulation and statistical analysis, Yuan et al. [14] conducted a feasibility study for several representative sensors to evaluate the capability to detect some important wheat diseases and pests.
It is noteworthy that recent investigations focusing on Remote Sensing (RS) features and models for monitoring crop diseases and pests primarily rely on data from a single sensor [15–17]. However, certain crop diseases and pests, such as RBLB, exhibit outbreak and rapid spread, presenting a limited time window for RS monitoring. This temporal constraint raises concerns about the ability of a single sensor to capture the disease occurrence event effectively. Consequently, addressing this challenge necessitates the development of spectral features and models that are robust and transferable across different sensors. This attempt not only enhances the effectiveness of RS monitoring but also significantly increases the likelihood of capturing and tracking crop diseases and pests promptly, particularly when they manifest swiftly. To achieve this goal, further exploration and refinement of features with cross-sensor applicability are crucial for the advancement of robust RS-based monitoring systems in agriculture. In this study, the cross-sensor spectral features were constructed for four representative satellite and UAV broad-band sensors, including commonly employed Sentinel-2 and GF-6 data with relatively large swath width, high-resolution Planet, and a widely-utilized UAV sensor, Rededge-M.
To facilitate the RS monitoring of the RBLB over a large area, the overarching objectives of this study are: (1) to analyze the spectral response characteristics of the RBLB based on the canopy hyperspectral data, which provided a foundation of spectral feature development; (2) by conducting the spectral simulation of four representative satellite and UAV broad-band sensors (i.e., Sentinel-2, GF-6, Planet, and Rededge-M) based on their RSR functions, to develop the cross-sensor disease sensitive spectral features; (3) by utilizing two classic machine learning algorithms, Support Vector Machines (SVM) and Fisher’s Linear Discriminant Analysis (FLDA), to evaluate the capabilities of the aforementioned features in cross-sensor disease monitoring systematically. This comprehensive approach contributes to the establishment of a robust foundation for the remote sensing monitoring of crop diseases and pests on a broad scale.
2.1 Study Sites and Data Acquisition
The field experiment was conducted in Fenghua, Zhejiang Province (121.474925E, 29.687503N) from 6–7 September 2022. The rice was in the filling stage and infected with naturally occurring RBLB. Spectral observations and disease severity assessments were carried out in areas with uniform disease incidence. According to the Chinese national standard of RBLB severity investigation (GB/T 17980.19-2000), the damage caused by RBLB was classified into three levels: healthy (HE), mild (MI), and severe (SE) (Fig. 1). The specific criteria for categorizing diseases at each level are provided in Table 1. Given the varied infection status of the RBLB, two fields were chosen to experiment. Mild and severe infection samples were situated in one field, whereas the healthy samples were situated in another field, and the infection levels of these fields were consistently aligned. Canopy spectra collection and infection level measurement were conducted at 200 plots from these fields simultaneously, and the number of plots for each infection level is shown in Table 1. Each plot was in the size of 1 m * 1 m.
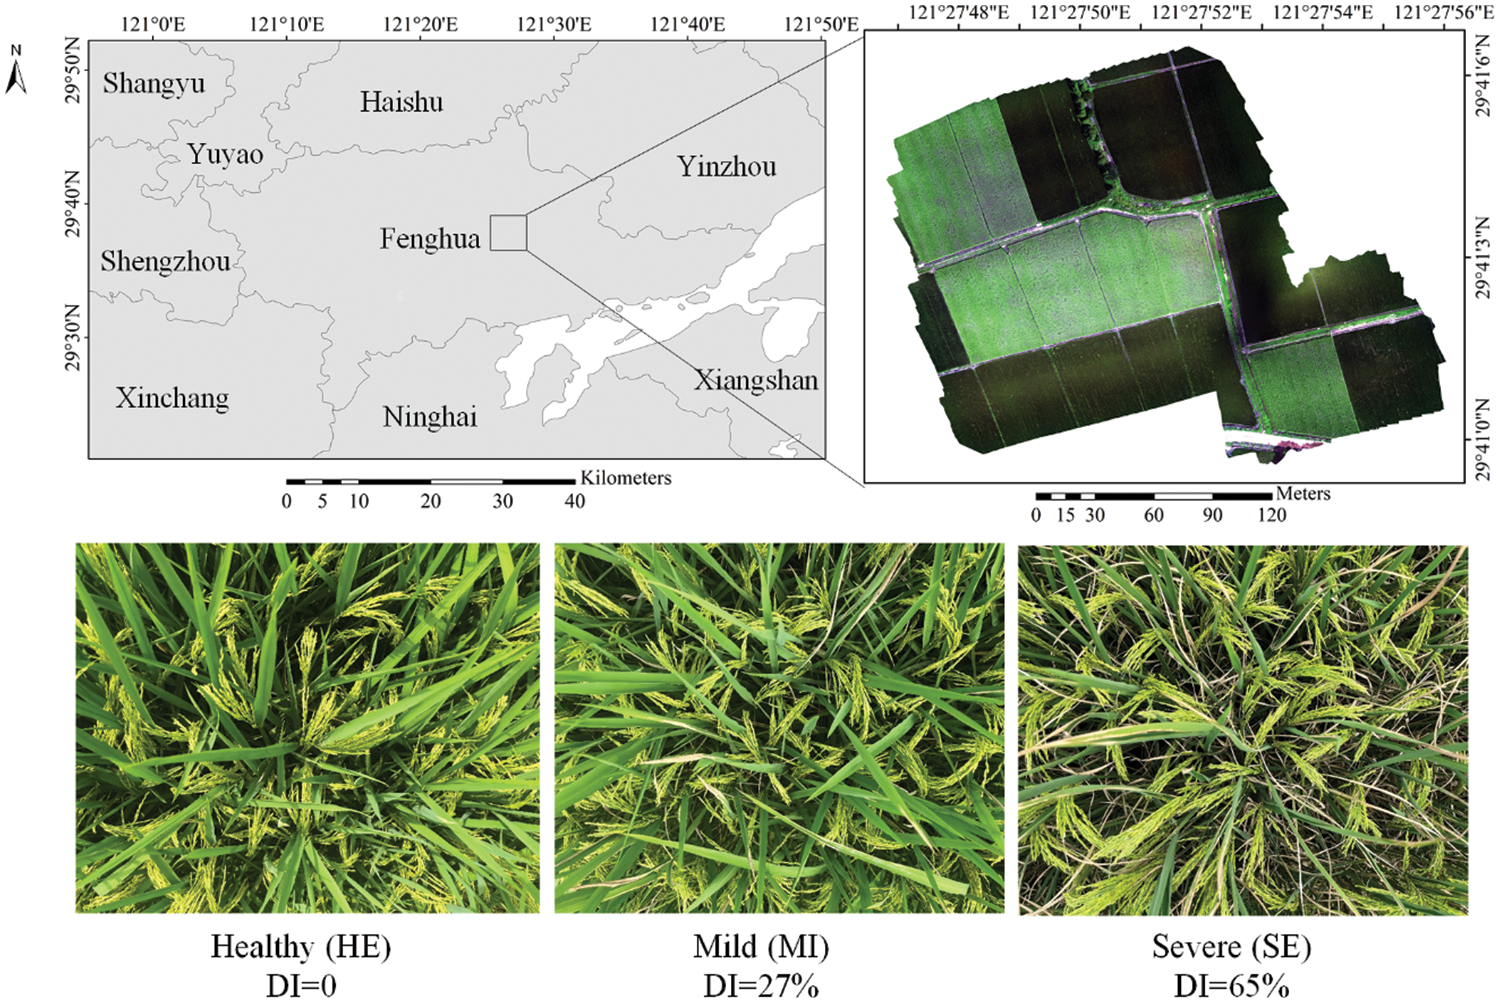
Figure 1: Overview of the study area and RBLB-infected canopies with different infection levels

Canopy hyperspectral reflectance was collected by a FieldSpec 4 spectroradiometer (Analytical Spectral Devices, Boulder, USA) under wind-free and cloud-free weather from 10:00 to 14:00. The ASD spectroradiometer had a spectral range of 350–2500 nm with varied spectral resolutions (3 nm at 700 nm, 10 nm at 1400 and 2100 nm), and was coupled with a fiber-optic cable (1.5 m, with a field of view FOV of 25°). At each experimental plot, ten replicates were measured at nadir positions from a height of 1 m above the top of rice plants and then averaged to represent the plot reflectance. The spectrum of a white reference panel was measured once before every measurement, and then the radiance signals were converted to spectral reflectance by the white reference panel according to the following formula:
where
2.2 Data Analysis and Processing
In this study, data processing and analysis were carried out in three parts (Fig. 2): spectral analysis of RBLB, construction and optimization of an RBLB-sensitive feature set with cross-sensor applicability based on simulated broad-band sensor data, and assessment of broad-band sensors’ capability in monitoring RBLB.
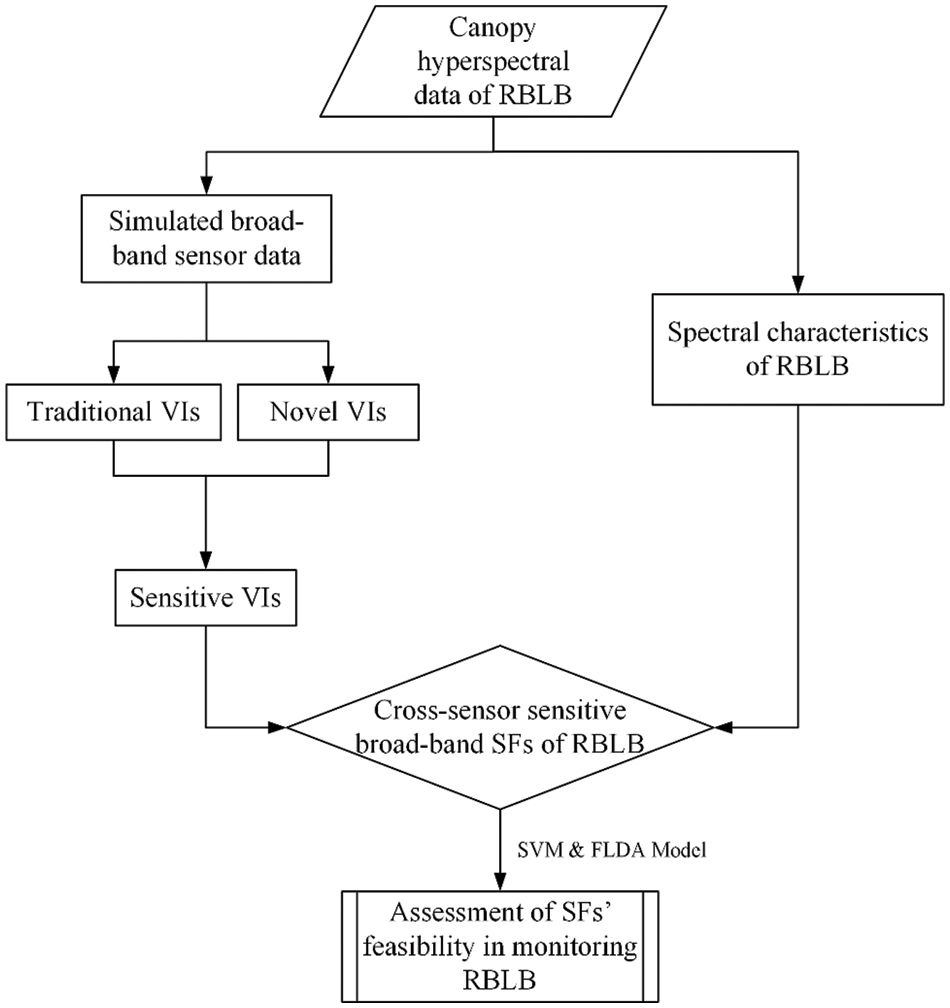
Figure 2: Flowchart of data analysis and processing
Note: SF is the abbreviation of spectral features.
2.2.1 Analysis of Spectral Response Based on Canopy Hyperspectral Reflectance
The analysis of spectral response conducted on a canopy scale forms the foundational basis for subsequent large-scale remote sensing monitoring. To reduce random errors stemming from factors like solar elevation angle and mitigate noise introduced by soil background, a spectral ratio procedure was conducted to identify specific wavelengths that demonstrate a significant response to the disease. The spectral ratio analysis served to mitigate background noise and enhance distinctions among spectra from different samples [18], which divided the averaged spectra of stressed samples by the averaged spectra of healthy samples:
where
Apart from the ratio analysis, an independent t-test was adopted to assess the significance of spectra among different infection levels. The t-test was conducted between each pair of infection levels (HE vs. MI, HE vs. SE, MI vs. SE), and wavelengths with significance of p-value < 0.001 were selected. Based on the selected wavelengths, the overlapped significant wavelengths of all the pairs of infection levels were recognized as sensitive wavelengths of RBLB.
2.2.2 Parameters of Broad-Band Sensors and Simulation of Multispectral Data
Broad-band sensor data was simulated by RSR function and hyperspectral data to construct RBLB-sensitive features with cross-sensor applicability [19]. The RSR function of a sensor’s channel describes its range and response at different wavelengths. The simulated multispectral reflectance of different infection levels was calculated by:
where
In the context of selecting broad-band sensors, given the acknowledged advantages of the red-edge band in indicating crop health in vegetation remote sensing [20], this study opted for four broad-band sensors equipped with red-edge channels. These sensors encompass the satellite-based Sentinel-2, GF-6, and Planet sensors, as well as the UAV-based Rededge-M sensor. These sensors are highly representative since they are commonly used in agricultural remote sensing. Their basic parameters are summarized in Table 2, and their RSR functions are displayed in Fig. 3. Based on the simulated data of the four sensors, the cross-sensor sensitive broad-band vegetation indices for detecting RBLB were then constructed. The vegetation indices (VIs) were derived from the common channels shared among these sensors, encompassing the blue, green, red, red-edge, and near-infrared (NIR) channels. These channels were specifically chosen for their potential to detect both crop physiological status and stress. The same independent t-test method as Chapter 2.2.1 was applied to evaluate the sensitivity of each channel from the four sensors to RBLB.

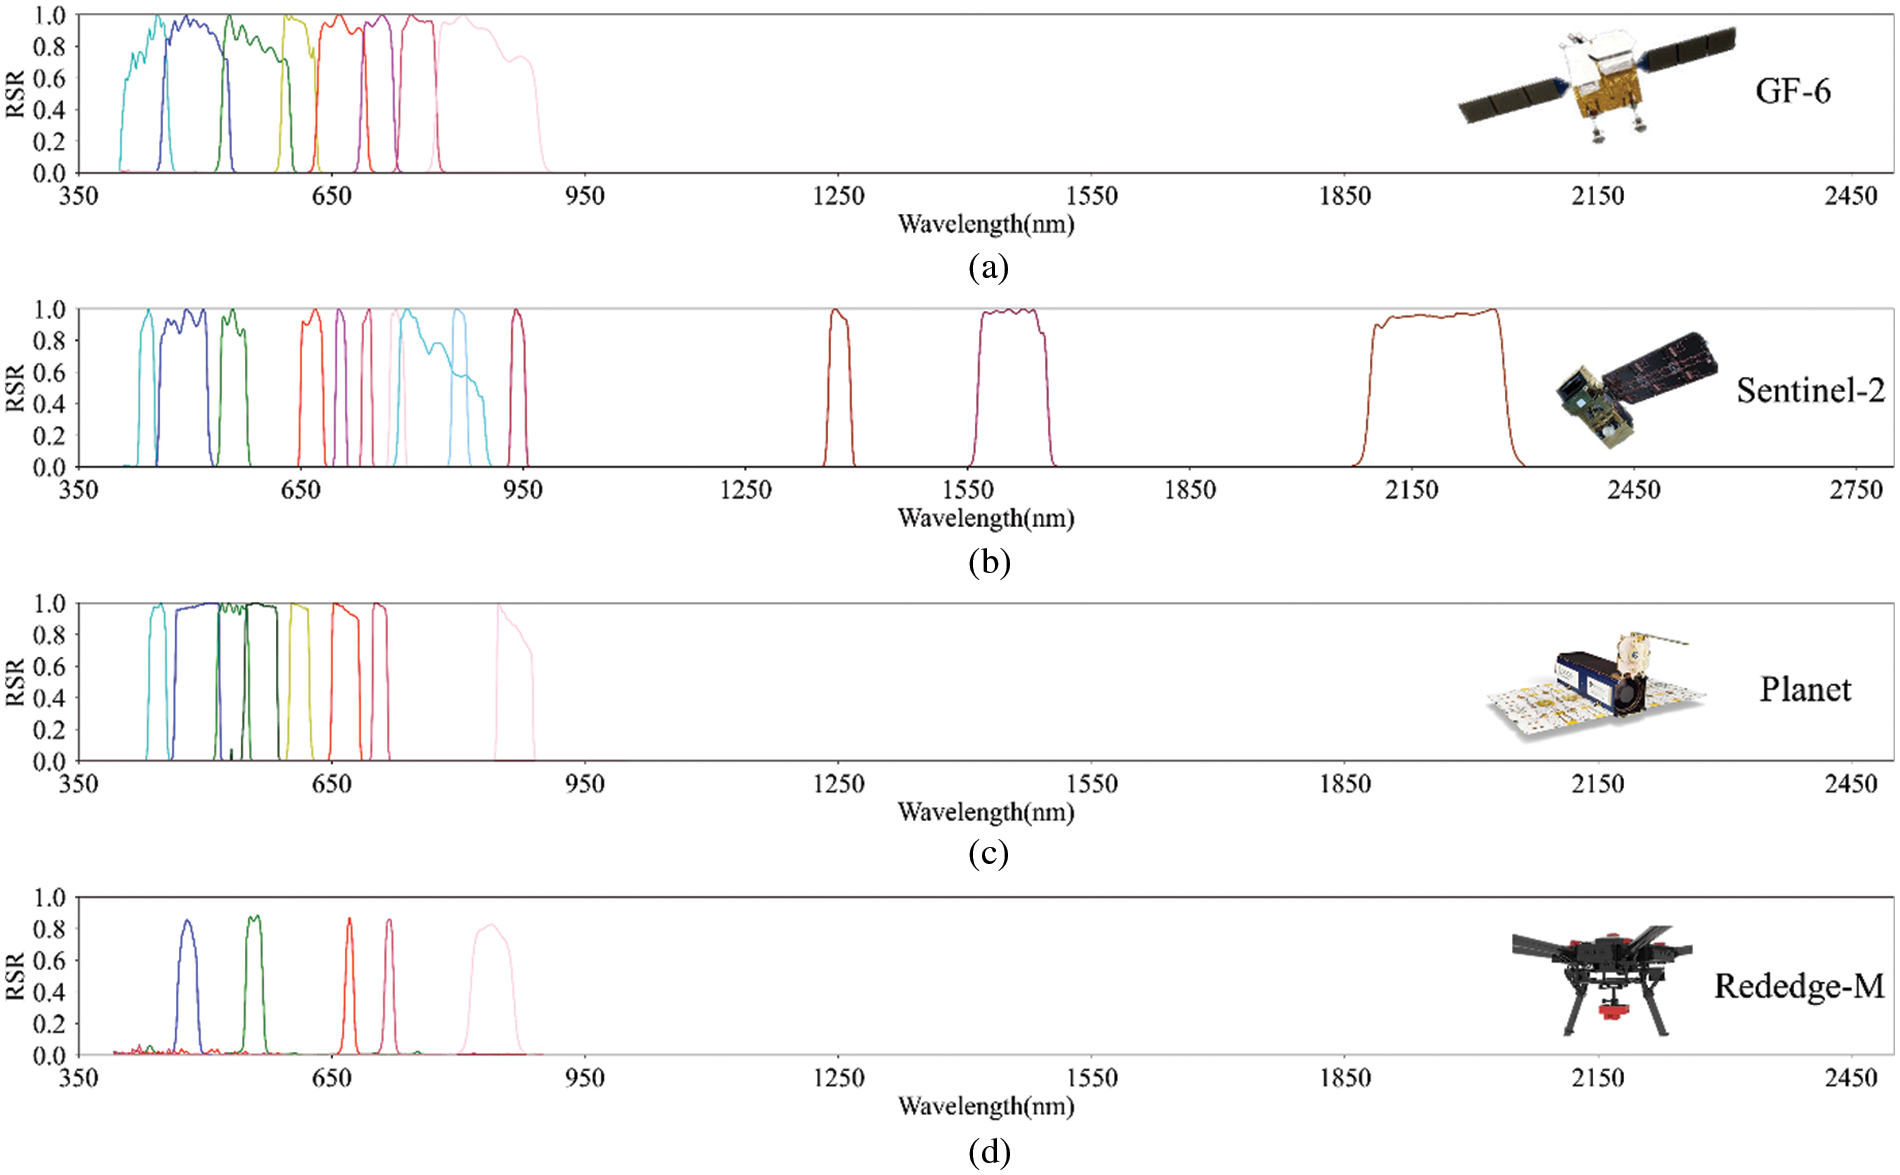
Figure 3: RSR functions of 4 broad-band sensors (a) GF-6, (b) Sentinel-2, (c) Planet, (d) Rededge-M
2.2.3 Construction of Cross-Sensor Broadband RBLB Sensitive VI
To facilitate cross-sensor monitoring of RBLB, this study aims to develop a universally applicable broad-band vegetation index set using simulated datasets from the aforementioned broad-band sensors. Utilizing the common channels across the previously mentioned four sensors, indices were constructed in a simple and generalized applicable format to facilitate their practical application in real-world scenarios. The selected formats encompassed the ratio spectral index (RSI), difference spectral index (DSI), and normalized difference spectral index (NDSI). The DSI and RSI exploit additive and multiplicative combinations to accentuate disparities between spectral bands, providing an effective means to mitigate background noise. This approach proves particularly valuable when dealing with complex agricultural scenarios, enhancing the clarity of relevant signals. On the other hand, the Normalized Difference Spectral Index (NDSI) strategically integrates the advantages of both DSI and RSI while ensuring that the resulting values are constrained within a specific range. This not only facilitates effective noise reduction but also maintains the interpretability of the data. The formulas for these indices are depicted in Eqs. (4)–(6):
where band1 and band2 represent different channels from a sensor, respectively.
The specific methodology for constructing and selecting RBLB-sensitive VIs involves a pairwise combination of the simulated channel data from each sensor in the three aforementioned forms. This process results in the creation of broad-band VIs based on various channel combinations. Based on these newly constructed VIs, the same sensitivity analysis, as described in Chapter 2.2.1, was applied to select VIs capable of distinguishing among all the infection levels. Subsequently, their sensitivity was ranked based on the averaged p-value obtained from three independent t-tests conducted between each pair of infection levels. The top three VIs with the smallest p-value were recognized as the sensor-specific features sensitive to RBLB. The common sensitive features across all four sensors were then selected as cross-sensor RBLB-sensitive features.
In addition to the newly constructed VIs, several classical VIs were incorporated to form a cross-sensor feature set for monitoring RBLB. Some of these indices are sensitive to pigment content, such as modified anthocyanin reflectance index (mARI), red-edge chlorophyll index (RECI), chlorophyll vegetation index (CVI), structure-intensive pigment index (SIPI), and pigment-specific simple ratio (PSSRb). Other indices reflect crop health status and canopy structure, including normalized difference vegetation index (NDVI), enhanced vegetation index (EVI), green-red normalized difference vegetation index (GRNDVI), infrared percentage vegetation index (IPVI), and greenness index (GI). The formulas of these indices are provided in Table 3.
The sensitivity analysis and selection process for cross-sensor classical vegetation indices are identical to those employed for novel vegetation indices. Moreover, a correlation analysis was conducted among the novel and classical sensitive vegetation indices to mitigate information redundancy. Combined with the result of the t-test and correlation analysis, features with smaller p-value were prioritized, and sensitive features with R2 < 0.8 were retained as the disease-sensitive feature set for each sensor. Building upon this, the intersection was taken among the sensitive feature sets of each sensor, forming the ultimate cross-sensor feature set for remote sensing monitoring of RBLB.
2.2.4 Assessment of Sensors’ Capability in Monitoring RBLB
Utilizing the cross-sensor RBLB monitoring feature set, the sensors’ capability in monitoring RBLB was assessed through the adoption of two representative machine learning algorithms, namely Fisher Linear Discriminant Analysis (FLDA) and Support Vector Machine (SVM). In constructing the SVM model, a linear kernel function was utilized, with the regularization parameter set to 1. To minimize random errors related to sample division and avoid overfitting, modeling was conducted using a 5-fold cross-validation method. Within each fold, samples were randomly divided into two parts for training (60%) and validation (40%). The assessment of capability relied on the median values of overall accuracy (OAA) and Kappa.
3.1 Spectral Response of RBLB across Different Infection Levels
To compare the spectral response at different infection levels of RBLB, the averaged reflectance curves for each infection level (Fig. 4a), ratio curves (Fig. 4b), and p-value curves (Fig. 4c) for each pair of infection levels (HE vs. MI, HE vs. SE, MI vs. SE) are presented in Figs. 4a–4c, respectively. It can be observed from Fig. 4a that there are noticeable differences among the infection levels, with the most significant wavelengths located at 750–1300 nm of the NIR plateau.
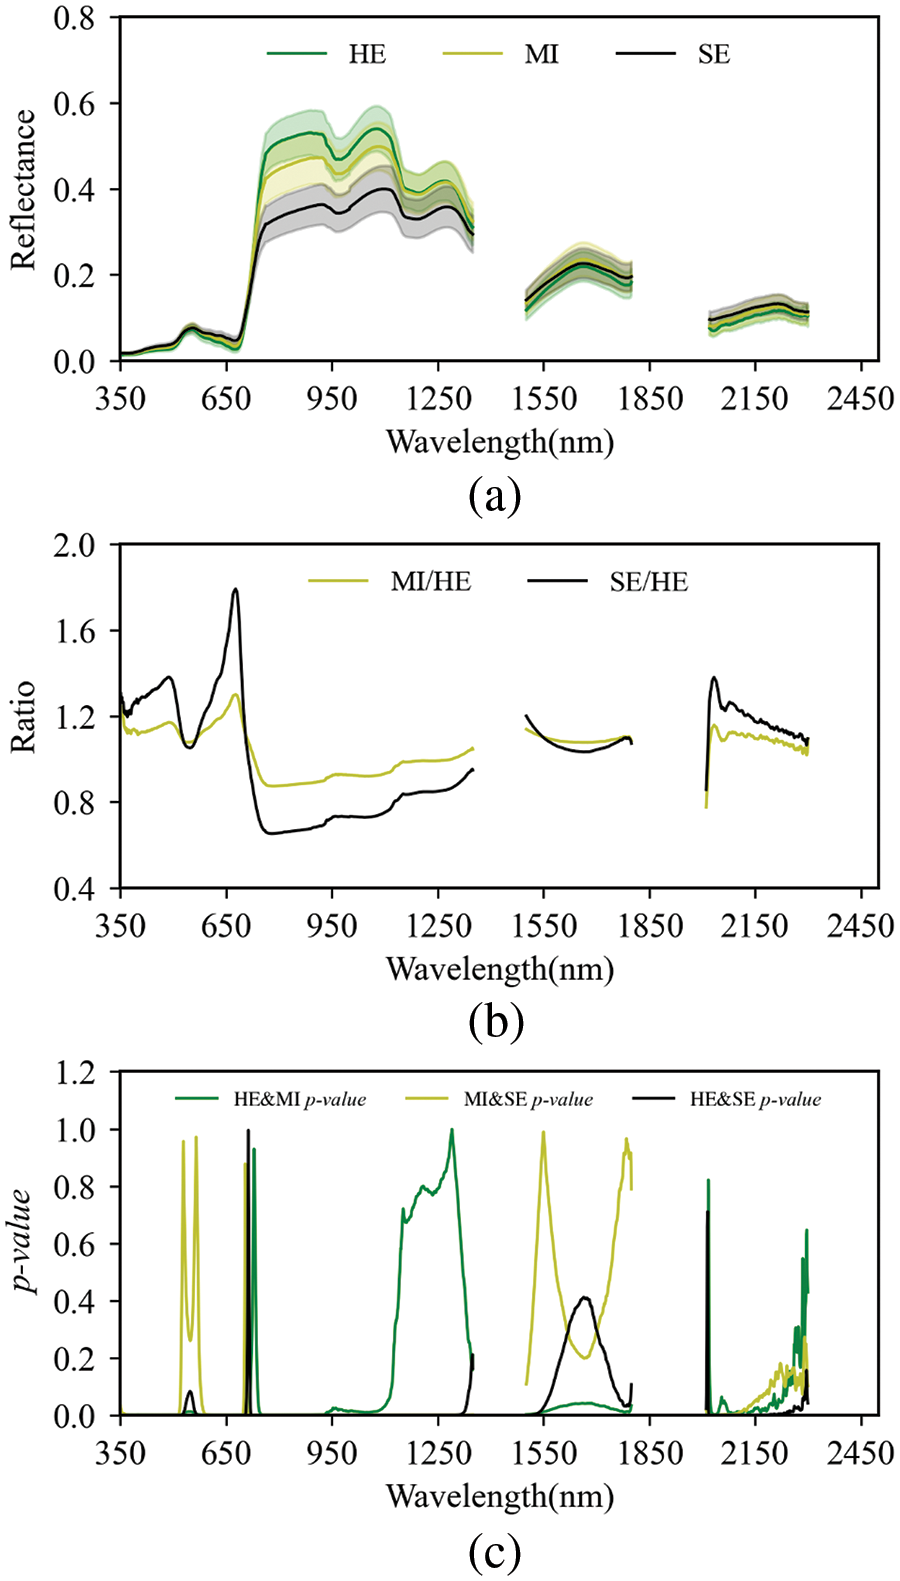
Figure 4: Comparison of the spectral response of different pairs of infection levels (a) canopy hyperspectral reflectance curves, (b) spectral ratio curves (Stressed/healthy), (c) p-value of independent t-test of different pairs of infection levels
Note: Fig. 4a illustrates the mean (line) and standard deviation (shaded area) of spectral reflectance for rice canopy groups at different infection levels. The wavelengths of 1351–1500, 1801–2009, and 2301–2500 nm have been omitted due to significant water vapor absorption.
The reflectance of the stressed samples exhibited a decrease across this spectral region. Simultaneously, an elevated infection level led to an increase in reflectance within the 600–700 nm range, accompanied by a reduced slope over the red-edge region. This pattern is also evident in the ratio curves, as illustrated in Fig. 4b. The curves of stressed samples exhibited an increase in the regions spanning from 380 to 500, 600 to 700, and 2010 to 2200 nm, as well as a decrease in the NIR region from 750 to 1000 nm. The extent of these changes intensified with the rising infection levels. In comparison to healthy samples, stressed samples demonstrated the most pronounced response in the regions of 630–700 and 780–900 nm. The reflectance of SE and MI increased by 56% and 24% in the red region of 630–700 nm, while the reflectance of SE and MI decreased by 33% and 12% in the NIR region of 780–900 nm.
Moreover, Fig. 4c reveals noticeable significance between HE and SE, MI and SE across various spectral regions, whereas the distinction between HE and MI appears more subtle. The spectral regions demonstrating significance across all infection levels are at 368–514, 600–697, 752–917, and 2027–2044 nm, with a p-value threshold less than 0.001.
3.2 Construction of Cross-Sensor RBLB Sensitive Vegetation Indices
Table 4 illustrates the discriminative capability of simulated broad-band channels of the sensor for various levels of RBLB. In general, the blue, red, and NIR channels exhibited heightened sensitivity to the disease, while the green and red-edge channels displayed a comparatively weaker response. Sensitivity matrices of DSI, RSI, and NDSI derived from these channels are presented in Fig. 5. Because the majority of VIs resulting from channel combinations exhibited an exceedingly significant level (p-value < 0.001), illustrating the sensitivity differences using p-value matrices becomes intricate. To address this challenge, this study employed t-values to construct sensitivity matrices for these VIs. A higher t-value serves as an indicator of the heightened sensitivity of the VI to RBLB. It can be observed from Figs. 5a–5l that VIs derived from various combinations of channels (i.e., DSI, RSI, NDSI) generally demonstrated consistent sensitivity. Nonetheless, subtle differences existed among these VIs. Specifically, RSI exhibited relatively high sensitivity, followed by NDSI, while DSI registered the lowest sensitivity. Simultaneously, it is noteworthy that the sensitivity matrices of normalized and difference indices exhibit favorable symmetry, i.e., the results are largely consistent when interchanging the R1 and R2 bands. However, for certain combinations of bands in ratio indices, there are noticeable differences in feature sensitivity between the original configuration and the one formed by exchanging the R1 and R2 bands. In terms of specific results for different band combinations, indices involving the near-infrared band combined with other bands generally exhibit higher overall sensitivity.

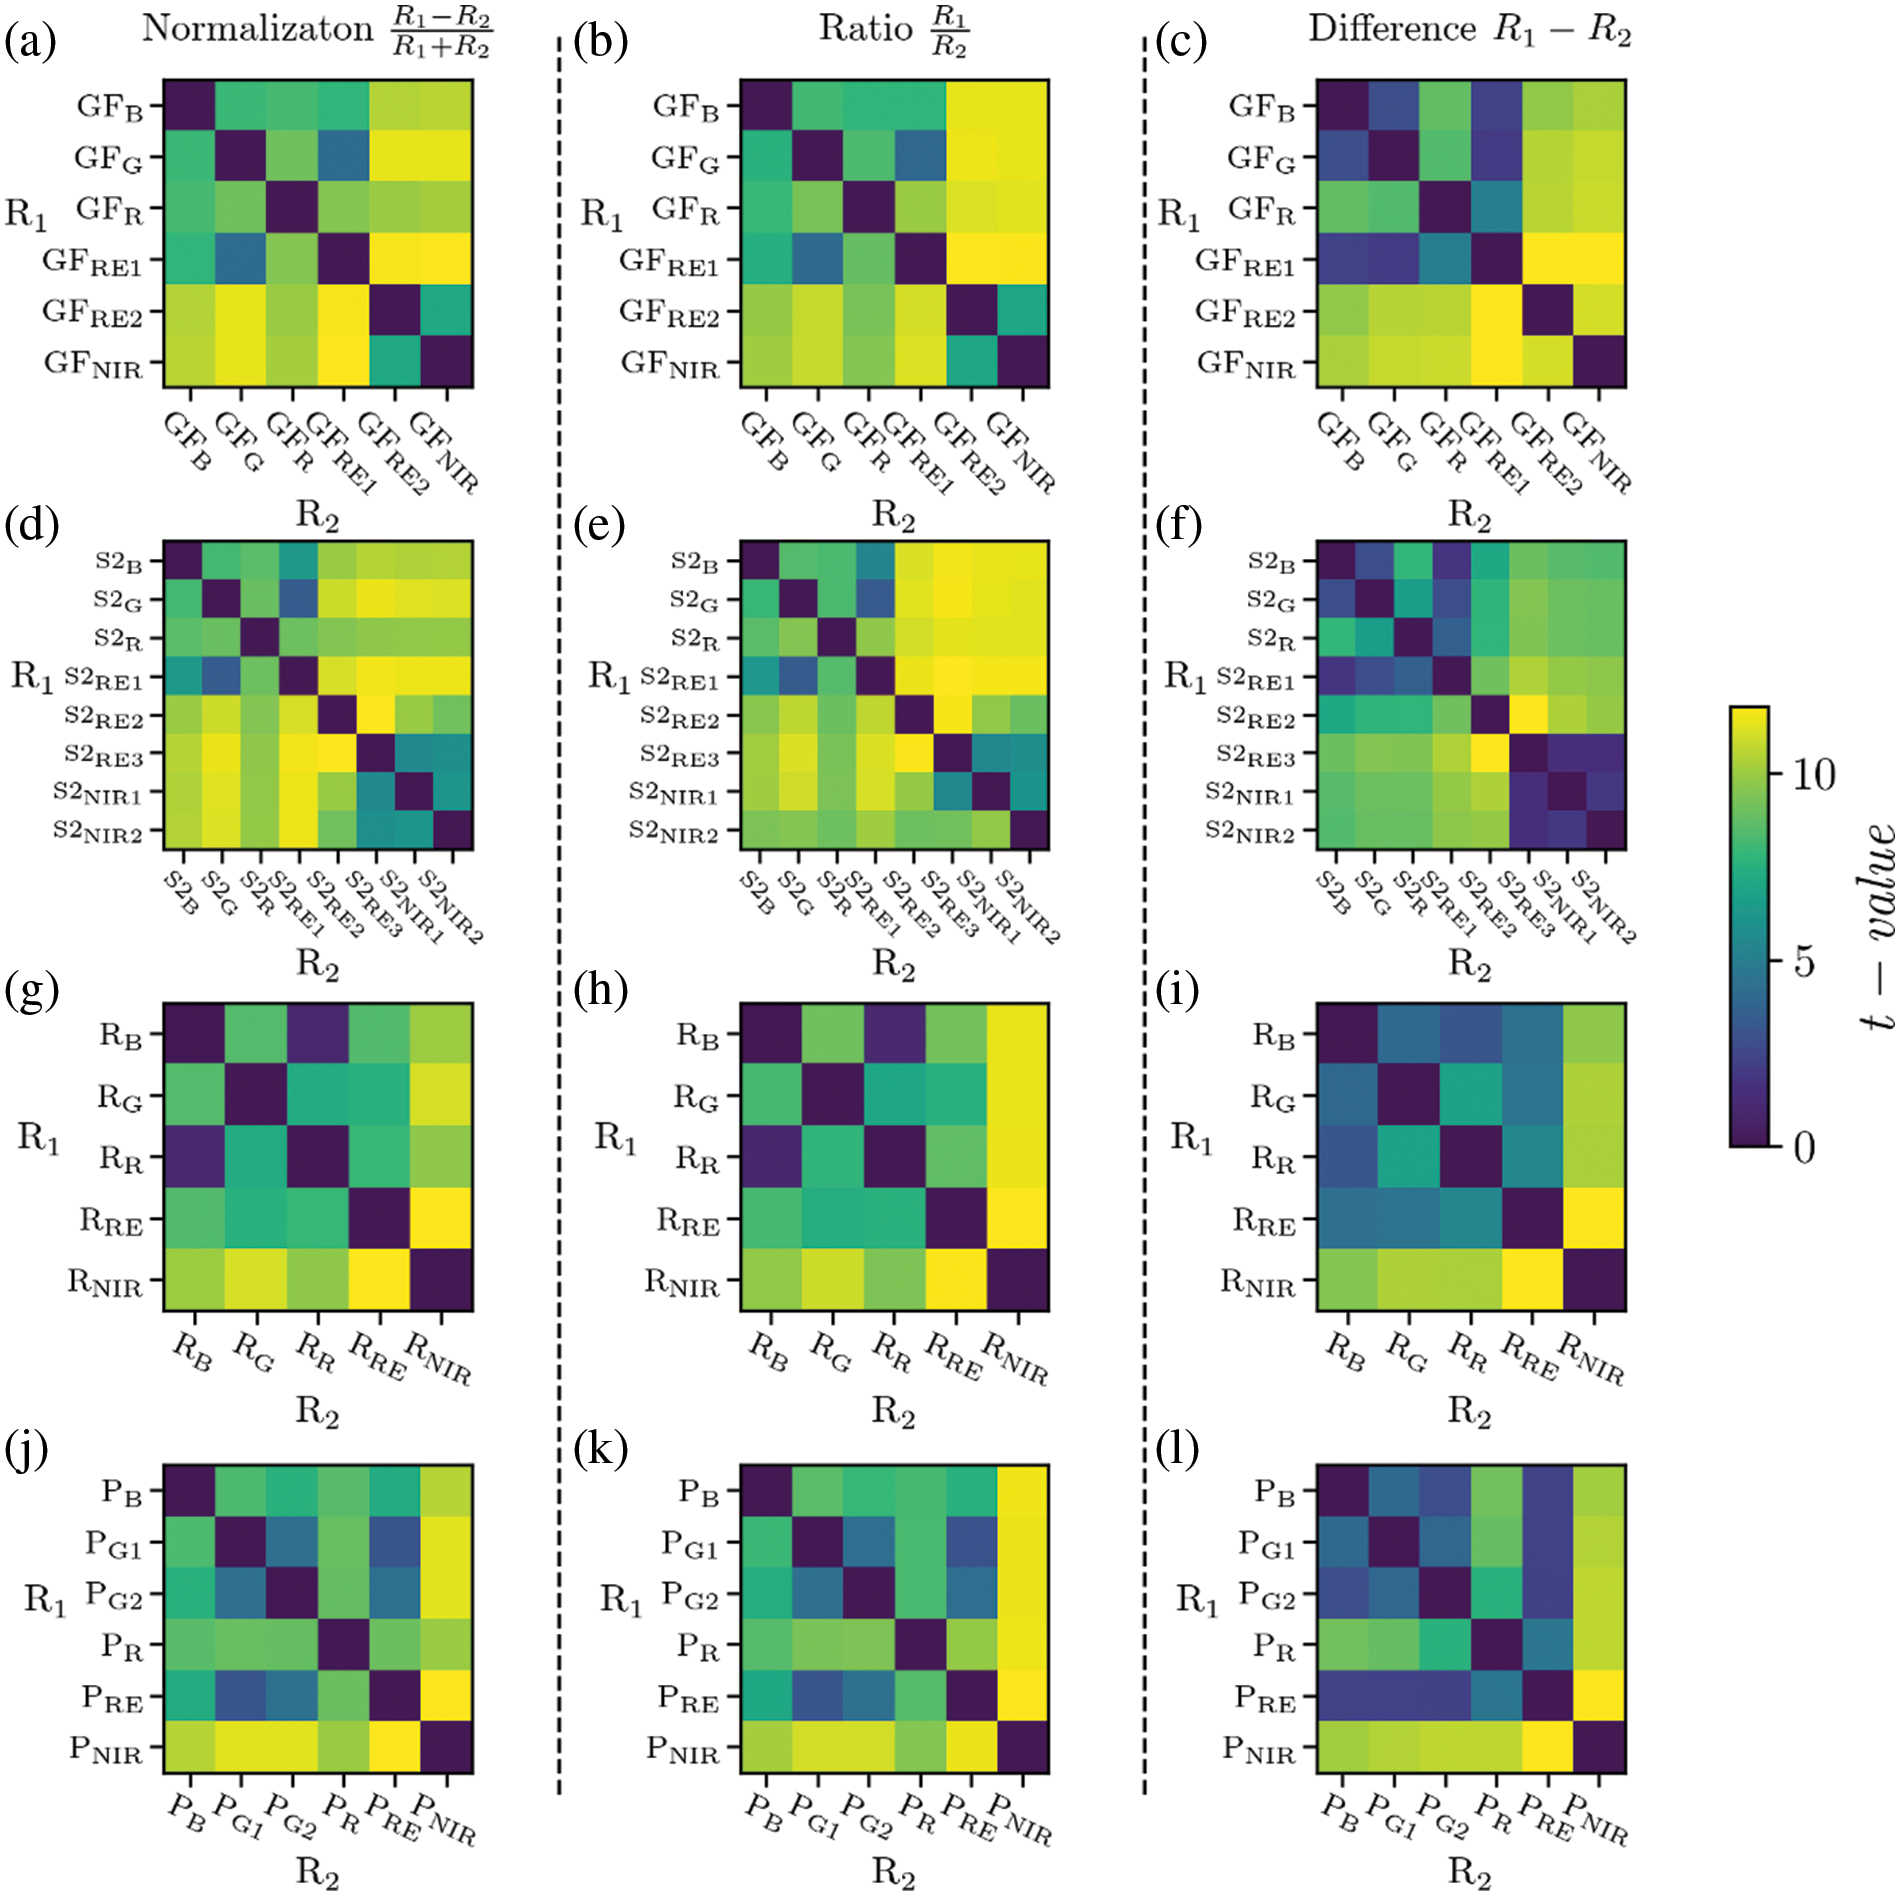
Figure 5: t-value matrices for vegetation indices constructed from combinations of sensor channels
Note: The color in the matrices represents the results of the independent t-test based on the averaged t-values of vegetation indices corresponding to the respective channels. (a)–(c) Represent t-values of GF-6 channels’ normalization, ratio and difference combinations, (d)–(f) represent t-values of Sentinel-2 channels’ normalization, ratio and difference combinations, (g)–(i) represent t-values of Rededge-M channels’ normalization, ratio and difference combinations, and (j)–(l) represent t-values of Planet channels’ normalization, ratio and difference combinations. GF, S2, R and P are the abbreviations for GF-6, Sentinel-2, Rededge-M and Planet.
Another important observation is that features derived from the combination of two highly sensitive channels (i.e., blue, red, or NIR channels) often show less sensitivity compared to features obtained by combining channels with both high and low sensitivities. In essence, the combination of “strong-weak” channels tends to outperform the “strong-strong” combination in the majority of scenarios, despite the latter exhibiting excellence in specific situations. Among all the VIs considered, combinations involving the NIR and red-edge channels demonstrated the highest sensitivity, attaining a statistically significant level with t-values > 10. The sensitivity of VIs based on the NIR and red-edge combination consistently ranked within the top three across all sensors. Notably, some of these indices emerged as the most sensitive across multiple sensors, as detailed in Table 5. Consequently, the newly proposed VIs derived from the ratio and difference combination of NIR and red-edge channels have been designated as the Rice Bacterial Blight Ratio Index (RBBRI) and Rice Bacterial Blight Difference Index (RBBDI). The normalized difference combination of the two channels was exactly in the same form as the Red Edge Normalized Difference Vegetation Index (RENDVI), thereby considered as a candidate for the cross-sensor feature set. It is noteworthy that Sentinel-2, Planet, and GF-6 are equipped with multiple channels in the NIR, green, and red-edge regions. The sensitivity of their combinations varies due to the distinct spectral positions of these channels. The most sensitive VIs were calculated via using the NIR1 and RE2 (red-edge2) channels of Sentinel-2. In the case of GF-6, the optimal VIs were derived from the RE1 and NIR channels.

The sensitivity (t-value) of classical VIs is illustrated in Fig. 6. It is evident that most VIs exhibited a high level of significance (p-value < 0.001). Among the classical VIs, those associated with pigment and crop health status demonstrated higher sensitivity. While RECI and RENDVI maintained consistent sensitivity across sensors, their sensitivity was weaker compared to the novel index RBBDI. To minimize information redundancy, a correlation analysis was conducted among the novel and classical VIs. This analysis identified three optimal features: RBBRI, RBBDI, and GI, which exhibited high consistency and low redundancy across sensors. These three VIs were recognized as the cross-sensor feature set to further investigate their capability in monitoring RBLB across different sensors.
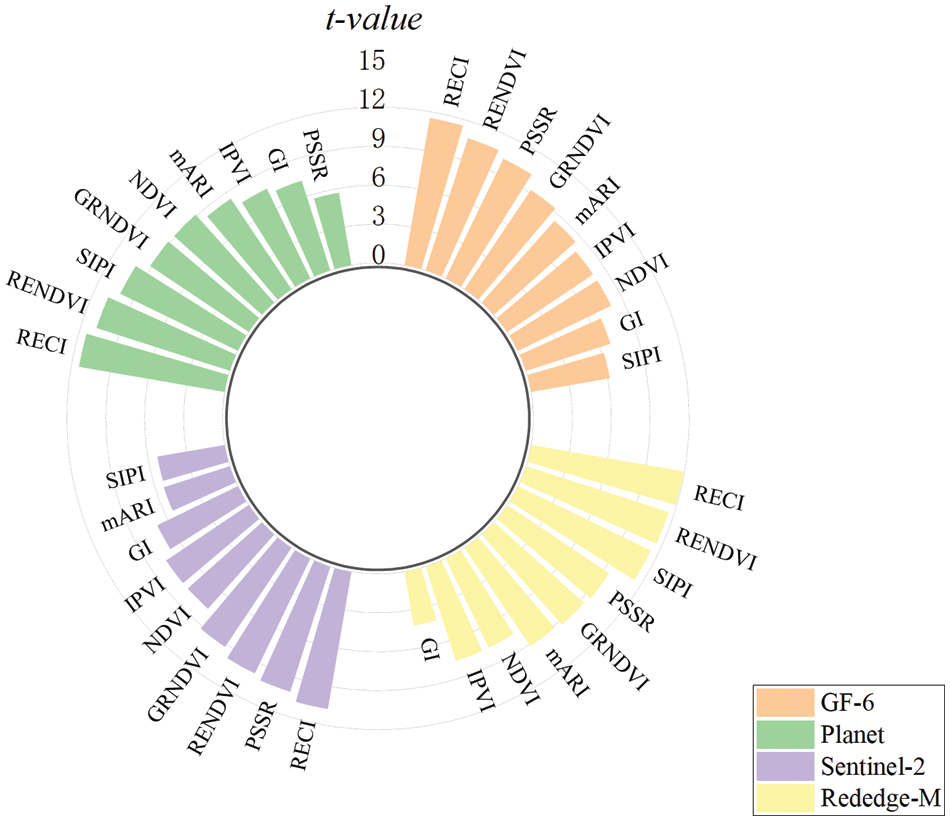
Figure 6: Sensitivity (t-value) of classical VI to RBLB
Note: The color bar in this figure indicates the averaged t-value of the independent t-test between each pair of infection levels.
3.3 Assessment of Sensors’ Capability in Monitoring RBLB Based on the Cross-Sensor Feature Set
Based on the above-mentioned optimized feature set including RBBRI, RBBDI, and GI, RBLB monitoring models were established by using SVM and FLDA to assess the feature set’s capability across different sensors. The results of the 5-fold cross-validation are presented in Fig. 7, indicating that the robust capability of the optimized feature set. Furthermore, the models based on FLDA achieved a higher Overall Accuracy (OAA) compared to SVM. The Overall Accuracy (OAA) medians of FLDA models based on data from the four sensors ranged from 89.0% to 94.0%, while the Kappa medians ranged from 82.0% to 91.0%. The model utilizing Sentinel-2 data achieved the highest accuracy with an OAA median of 94.0% and a Kappa median of 90.0%. Following closely, the Planet model attained an OAA median of 93.0% and Kappa of 88.0%. The GF-6 and Rededge-M models achieved OAA medians of 91.0% and 90.0%, and Kappa medians of 86.0% and 84.0%, respectively. In conclusion, the results from the four sensors displayed high consistency across all folds of cross-validation, with interquartile ranges (IQR) of OAA and Kappa below 10.0%. Notably, the model based on Planet data demonstrated the highest consistency across all folds of cross-validation, with OAA IQR of 2.8% and Kappa IQR of 3.5%.
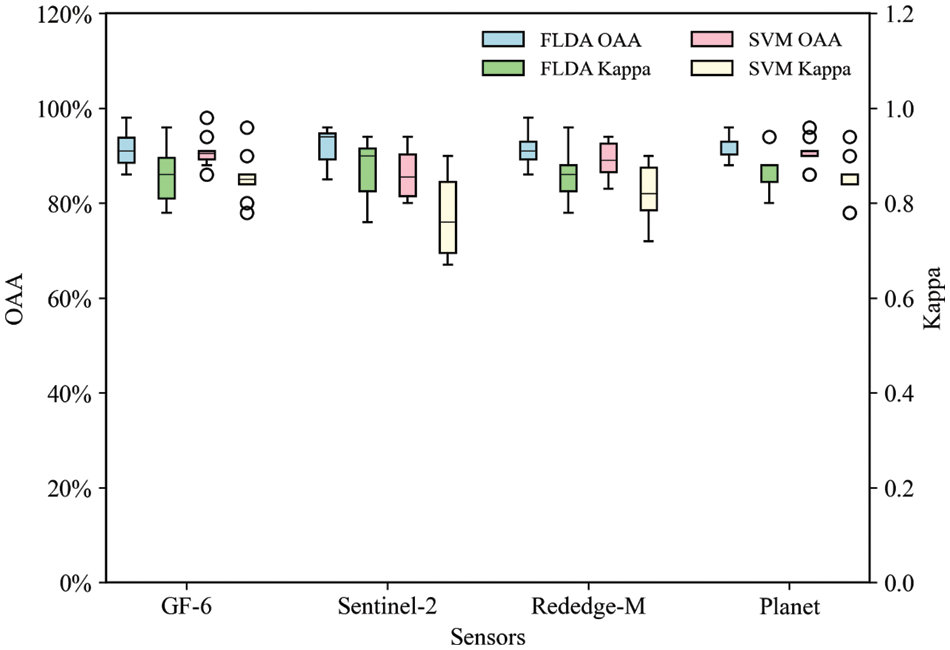
Figure 7: OAA and Kappa of simulated broadband sensor RBLB monitoring models based on FLDA and Kappa
Note: In each boxplot, the top edge, center line, and bottom edge of the box represent the upper (Q3), median (Q2), and lower (Q1) quartiles, respectively. The whiskers represent the maximum (Q3 + 1.5 * IQR) and minimum (Q1–1.5 * IQR) valid values defined by the interquartile ranges (IQR = Q3 − Q1), respectively.
For SVM models using data from the four sensors, OAA medians ranged from 85.0% to 91.0%, while Kappa medians ranged from 76.0% to 86.0%. The accuracy ranking of the sensor models showed slight variations compared to the FLDA models. Models based on the three sensors, excluding Sentinel-2, achieved OAA medians of 91.0% and Kappa medians of 86.0%, while the Sentinel-2-based model yielded an OAA median of 85.0% and a Kappa median of 76.0%. Despite the lower OAA based on SVM, it still demonstrated high consistency, with interquartile ranges (IQR) lower than 10.0% for all sensors.
These results highlight that the RBLB monitoring models based on the cross-sensor feature set produce stable and consistent OAA and Kappa results under different channel settings.
The results of the spectral response analysis of RBLB indicate that the spectral characteristics are related to changes in canopy chlorophyll content, cell, and canopy structure. Infections caused by RBLB lead to reduced chloroplast synthesis, resulting in a decrease in chlorophyll content. This manifests as initial water-soaked spots and subsequent brown or white lesions on leaves. Additionally, it causes damage to photosynthesis and triggers secondary systemic symptoms [30,31]. The notable variation in chlorophyll content accounts for the rise in reflectance in the red spectral region. Furthermore, as the pathogen multiplies within the xylem, its secretion obstructs xylem vessels, impeding water transport and causing the collapse of cell structure, which, in turn, results in a decrease in reflectance in the NIR region [32]. Meanwhile, as outlined by Onohata et al. [33], the physiological response of rice to the bacterium influences the synthesis of lignin, potentially contributing to spectral changes in the NIR region. Additionally, within rice canopies affected by RBLB, the dehydration of plants and heightened vulnerability of stem tissues to breakage result in an increased heterogeneity in canopy structure. This effect may potentially impact the near-infrared segment of canopy spectra at a larger scale. Moreover, a notable advantage is that symptoms of RBLB are predominantly visible in the upper leaves of the rice canopy, resulting in a higher proportion of exposed surfaces. Consequently, the reflectance in the visible-NIR region of the canopy spectrum could potentially increase by up to 56%. The field propagation of the disease can give rise to substantial, contiguous infection areas, making it feasible for the large-scale remote sensing monitoring of the disease. Another notable characteristic of the spectral response is the substantial and consistent variation in the red-edge position (Fig. 4a). This may reflect the comprehensive impact of the disease on pigments, plant structure, and other factors in the spectrum. As a result, the red-edge channel, renowned for its robust detection capabilities in plant stress, may play a pivotal role in disease monitoring.
In the process of establishing a cross-sensor sensitive index for RBLB, a sensitivity analysis was initially conducted on various broad-band sensors’ original channels. The results in Table 4 indicate that the spectral response induced by the disease not only exhibits significant changes in the spectral curves but also demonstrates highly significant responses in broad bands such as blue, red, and NIR. Importantly, the sensitivity of these channels is highly consistent across different sensors, making them suitable for developing cross-sensor sensitive features for RBLB. While channels spanning from the visible to NIR regions demonstrate significant sensitivity to the disease, a noteworthy observation from the sensitivity analysis of VIs comprising these simulated channels is that the most sensitive features, derived from thorough combinations, consistently involve NIR and red-edge channels. It can be observed from the sensitivity ranking result of VIs (Fig. 5) that VIs based on the two channels are highly sensitive to RBLB, and their sensitivity is consistent across various sensors. The spectral response of RBLB indicates significant differences among varied infection levels in the NIR region, whereas the red-edge spectra serve as an indicator of crop stress influenced by both pigment and cell structure. Due to its positioning between the red and near-infrared channels, the variations in the red-edge channel are related to changes in both of these channels. Within a defined range, the increase of red spectral reflectance and decrease of NIR spectral reflectance observed in infected rice can lead to the dampening of variations in the red-edge channel [34]. This, to some extent, functions as a reference channel, thereby enhancing the stability of index features in response to RBLB when combined with the near-infrared channel. On the other hand, variations such as the shifting of the red-edge position and changes in slope observed under different plant stress conditions offer more comprehensive information for disease monitoring. This supplementary information, coupled with data from the NIR band, elucidates why both the NIR and red-edge bands are consistently chosen as optimal band combinations during the construction of indices in different forms.
The findings of this study emphasize the importance of incorporating red-edge channels in contemporary satellites and UAV multispectral sensors, such as Sentinel-2, GF-6, Planet, and Rededge-M. However, it is worth noting that some multispectral remote sensing satellites, such as Sentinel-2 and GF-6, feature more than one red-edge channel. Further analysis in this study reveals that index features formed by different red-edge channels exhibit varying sensitivity in disease monitoring. For instance, concerning Sentinel-2, the RBBRI and RBBDI computed based on the RE2 channel demonstrate higher sensitivity. Spectral changes of samples with different disease levels at the red-edge channels (Fig. 8) reveal that the RE2 channel can better distinguish various disease-level samples compared to the RE1 channel. Additionally, it exhibits more significant differences in spectral slope compared to the RE3 channel. Therefore, the monitoring capability of RBBRI and RBBDI, which utilize the RE2 channel, are the strongest. This underscores the importance of not only maximizing the role of red-edge channels through channel combinations but also considering the selection of different red-edge channels in index construction when monitoring crop disease using multispectral remote sensing satellites. The red-edge channels that are most sensitive and stable for monitoring should be chosen in the construction of features.
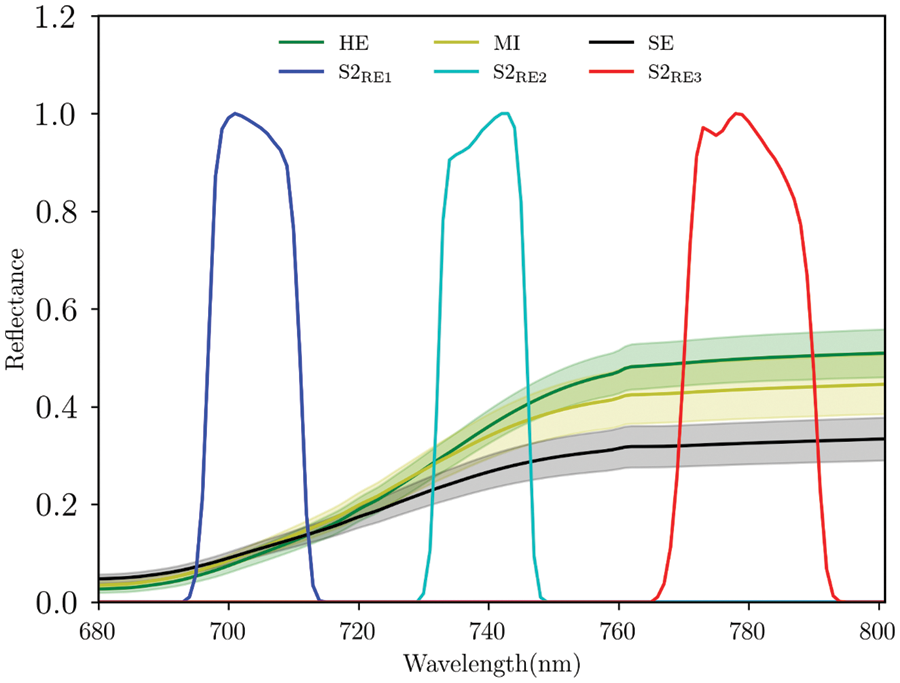
Figure 8: RBLB canopy spectra and RSR functions of Sentinel-2’s red-edge channels
Utilizing the cross-sensor RBLB sensitive feature set, the monitoring models, based on various simulated remote sensing sensors, the FLDA model demonstrated superior performance compared to the SVM model, potentially attributed to the fewer variables and relatively modest sample size in this study. Specifically, both of the models attained an overall accuracy above 90%, which affirms the effectiveness of these features in RBLB monitoring across diverse sensors. It is noteworthy that the study does not account for variations in spatial resolution among these satellite sensors. Consequently, remote sensing data sources with suitable resolution should be accounted for in the next step of validation and implementation of the RBLB monitoring. In practical applications, due to the significant randomness in the occurrence scale and range of RBLB, it is necessary to choose different remote sensing data sources with suitable resolutions and swath widths, such as Sentinel-2, GF-6, or Planet, depending on different scenarios like large-scale outbreaks or scattered occurrences in small areas. Additionally, considering the rapid progression of RBLB under favorable conditions, it is crucial to select remote sensing data sources flexibly based on the satellite transit schedule. Moreover, heightened attention is essential for fields with a high potential for RBLB occurrence, such as those experiencing annual outbreaks with abundant bacterial sources or facing a heightened risk of imported infection. In such scenarios, UAV multispectral remote sensing emerges as a suitable choice to monitor the distribution and severity of RBLB at a finer resolution. Given the transmission of RBLB through agricultural activities, the deployment of UAV sensors is pivotal for the detection and control of RBLB, particularly in the smallholder farms of southern China. Apart from spatial resolution, atmospheric effects should be considered when validating the results via satellite imageries. Atmospheric-insensitive features, such as the perpendicular vegetation index should be taken into account.
In general, the development of cross-sensor RBLB monitoring features proves advantageous for leveraging the capabilities of diverse satellite and UAV sensors. This enhances the comparability and consistency of monitoring results, providing crucial information for regional disease control and prevention. In terms of feasibility, this study relies on canopy hyperspectral data. To further refine stable RBLB monitoring methods across multiple sensors, imagery from typical scenarios should be employed to validate the features. Apart from features, attention should also be paid to issues such as cross-calibration methods for data and the model’s substitutability. Regarding the prevention and control of crop diseases and pests, pesticides are conventionally applied in fixed doses. Nevertheless, the optimal utilization of these chemicals should be adapted to the severity and scale of crop diseases and pests. In this vein, our research offers a nuanced approach to precisely monitor and assess the dynamics of crop diseases and pests, presenting a valuable option that holds instructive potential for enhancing the efficiency of pesticide usage. This insight contributes to the broader goal of optimizing pest management strategies in agriculture, aligning chemical applications more closely with the specific conditions of crop health. Moreover, these methods can be extended beyond RBLB to address other crop diseases and pests, offering technical support for rapid, accurate investigation, and environment-friendly prevention and control of crop pests and diseases on a larger scale.
In this study, the spectral response of RBLB was analyzed based on canopy hyperspectral reflectance measured at different infection levels. Moreover, simulated broad-band sensor data for satellites such as Sentinel-2, GF-6, Planet, and the UAV-carried Rededge-M was generated using their RSR functions and hyperspectral data. The sensitivity of their five common channels—blue, green, red, red-edge, and NIR—was assessed. Based on the optimized combinations of these channels, both novel and classical VIs capable of monitoring RBLB across multiple sensors were constructed and selected, forming a cross-sensor RBLB monitoring feature set. Furthermore, the capability of the sensors to monitor RBLB was assessed using FLDA and SVM machine learning algorithms. The major conclusions can be summarized as follows:
(1) The analysis of canopy hyperspectral data revealed that visible bands (368–514, 600–697 nm), NIR bands (752–917 nm), and SWIR bands (2027–2044 nm) are sensitive to RBLB. Broad-band sensors’ blue, red, and NIR channels exhibited consistent sensitivity to RBLB among different sensors, forming the basis for constructing RBLB-sensitive VI.
(2) Through a comprehensive analysis of different channel combinations, two novel VIs based on NIR and red-edge channels, namely RBBRI and RBBDI, were constructed. An optimal feature set was formed by combining these novel VIs with a classical VI (GI), guided by correlation analysis.
(3) The results of the RBLB monitoring model indicated the high consistency of the cross-sensor feature set’s capability among different sensors. The overall accuracy of FLDA models ranged from 89.0% to 94.0%, illustrating that the optimal features are suitable for accurately and stably monitoring RBLB across various satellite and UAV sensors.
The methods proposed by this study should be further tested and validated using airborne imagery. This approach could serve as an exemplary model for monitoring crop diseases and pests on a large scale using multi-source remote sensing data.
Acknowledgement: The authors sincerely appreciate Mrs. Jing Zhai, an expert from the Ningbo Agricultural Technology Extension Station, for her support in data acquisition.
Funding Statement: This research was funded by the Strategic Priority Research Program of the Chinese Academy of Sciences (Grant No. XDA28010500), National Natural Science Foundation of China (Grant Nos. 42371385, 42071420), and Zhejiang Provincial Natural Science Foundation of China (Grant No. LTGN23D010002).
Author Contributions: The authors confirm their contribution to the paper as follows: Jingcheng Zhang and Yingying Dong conceived and designed the study. Lin Yuan supervised the project and designed the research. Xingjian Zhou and Qimeng Yu analyzed the data and wrote the initial manuscript. Xingjian Zhou and Dong Shen conducted the experiments. Jingcheng Zhang reviewed and edited the final version of the manuscript. All authors have read and agreed to the published version of the manuscript.
Availability of Data and Materials: All data in this study are provided in this published article and its supplementary data can be provided upon a reasonable request.
Ethics Approval: Not applicable.
Conflicts of Interest: The authors declare that they have no conflicts of interest to report regarding the present study.
References
1. Zhai J, Wu S, Zhao L, Wang X, Zhang X, Xu L. Analysis of the reasons for the re-emergence of rice leaf blight in Ningbo and thoughts on prevention and control countermeasures. China Plant Prot. 2022;42(8):4. [Google Scholar]
2. Cao Y, Yuan P, Xu H, Martínez-Ortega F, Feng J, Zhai Z. Detecting asymptomatic infections of rice bacterial leaf blight using hyperspectral imaging and 3-dimensional convolutional neural network with spectral dilated convolution. Front Plant Sci. 2022;13:963170. [Google Scholar] [PubMed]
3. Xu T, Wang F, Yi Q, Xie L, Yao X. A bibliometric and visualized analysis of research progress and trends in rice remote sensing over the past 42 years (1980–2021). Remote Sens. 2022;14(15):3607. [Google Scholar]
4. Tian L, Wang Z, Xue B, Li D, Zheng H, Cheng T, et al. A disease-specific spectral index tracks Magnaporthe oryzae infection in paddy rice from ground to space. Remote Sens Environ. 2023;285:113384. [Google Scholar]
5. Zhang J, Tian Y, Yan L, Wang B, Wang L, Xu J, et al. Diagnosing the symptoms of sheath blight disease on rice stalk with an in-situ hyperspectral imaging technique. Biosyst Eng. 2021;209:94–105. [Google Scholar]
6. Meng R, Lv Z, Yan J, Chen G, Zhao F, Zeng L, et al. Development of spectral disease indices for southern corn rust detection and severity classification. Remote Sens. 2020;12(19):3233. [Google Scholar]
7. Mandal N, Adak S, Das D, Sahoo R, Kumar A, Chinnusamy V, et al. Assessment of rice blast disease using hyperspectral vegetation indices. J Agric Sci. 2022;22(1):89–98. [Google Scholar]
8. Guillaume L. Monitoring natural and anthropogenic plant stressors by hyperspectral remote sensing: recommendations and guidelines based on a meta-review. Sci Total Environ. 2021;788:147758. [Google Scholar]
9. Kuswidiyanto L, Noh H, Han X. Plant disease diagnosis using deep learning based on aerial hyperspectral images: a review. Remote Sens. 2022;14(23):6031. [Google Scholar]
10. Abdullah H, Andrew S, Roshanak D, Marco H. Timing of red-edge and shortwave infrared reflectance critical for early stress detection induced by bark beetle (Ips typographus, L.) attack. Int J Appl Earth Obs Geoinform. 2019;82:101900. [Google Scholar]
11. Chen D, Shi Y, Huang W, Zhang J, Wu K. Mapping wheat rust based on high spatial resolution satellite imagery. Comput Electron Agr. 2018;152:109–16. [Google Scholar]
12. Gu C, Cheng T, Cai N, Li W, Zhang G, Zhou X, et al. Assessing narrow brown leaf spot severity and fungicide efficacy in rice using low altitude UAV imaging. Ecol Inform. 2023;77:102208. [Google Scholar]
13. Abdullah H, Skidmore A, Darvishzadeh R, Heurich M. Sentinel-2 accurately maps the green-attack stage of the European spruce bark beetle (Ips typographus, L.) compared with Landsat-8. Remote Sens Ecol Conserv. 2019;5(1):87–106. [Google Scholar]
14. Yuan L, Zhang H, Zhang Y, Xing C, Bao Z. Feasibility assessment of multi-spectral satellite sensors in monitoring and discriminating wheat diseases and insects. Optik. 2017;131:598–608. [Google Scholar]
15. Wang J, Zhao J, Sun H, Lu X, Huang J, Wang S, et al. Satellite remote sensing identification of discolored standing trees for pine wilt disease based on semi-supervised deep learning. Remote Sens. 2022;14(23):5936. [Google Scholar]
16. Xiao D, Pan Y, Feng J, Yin J, Liu Y, He L. Remote sensing detection algorithm for apple fire blight based on UAV multispectral image. Comput Electron Agr. 2022;199:107137. [Google Scholar]
17. Zeng T, Zhang H, Li Y, Yin C, Liang Q, Fang J, et al. Monitoring the severity of rubber tree infected with powdery mildew based on UAV multispectral remote sensing. Forests. 2023;14(4):717. [Google Scholar]
18. Carter G. Ratios of leaf reflectance in narrow wavebands as indicators of plant stress. Int J Remote Sens. 1994;15(3):697–703. [Google Scholar]
19. Chemura A, Mutanga O, Dube T. Separability of coffee leaf rust infection levels with machine learning methods at Sentinel-2 MSI spectral resolutions. Precis Agric. 2017;18(5):859–81. [Google Scholar]
20. Baret F, Vanderbilt V, Steven M, Jacquemoud S. Use of spectral analogy to evaluate canopy reflectance sensitivity to leaf optical properties. Remote Sens Environ. 1994;48(2):253–60. [Google Scholar]
21. Rouse J, Haas R, Schell J, Deering D. Monitoring vegetation systems in the Great Plains with ERTS. NASA Spec Publ. 1974;351(1):309. [Google Scholar]
22. Huete A, Didan K, Miura T, Rodriguez E, Gao X, Ferreira LG. Overview of the radiometric and biophysical performance of the MODIS vegetation indices. Remote Sens Environ. 2002;83(1):195–213. [Google Scholar]
23. Blackburn A. Spectral indices for estimating photosynthetic pigment concentrations: a test using senescent tree leaves. Int J Remote Sens. 1998;19(4):657–75. [Google Scholar]
24. Peñuelas J, Filella I. Visible and near-infrared reflectance techniques for diagnosing plant physiological status. Trends Plant Sci. 1998;3(4):151–6. [Google Scholar]
25. Gitelson A, Keydan G, Merzlyak M. Three-band model for noninvasive estimation of chlorophyll, carotenoids, and anthocyanin contents in higher plant leaves. Geophys Res Lett. 2006;33(11):L11402. [Google Scholar]
26. le Maire G, François C, Dufrêne E. Towards universal broad leaf chlorophyll indices using PROSPECT simulated database and hyperspectral reflectance measurements. Remote Sens Environ. 2004;89(1):1–28. [Google Scholar]
27. Crippen R. Calculating the vegetation index faster. Remote Sens Environ. 1990;34(1):71–3. [Google Scholar]
28. Wang F, Huang J, Tang Y, Wang X. New vegetation index and its application in estimating leaf area index of rice. Rice Sci. 2007;14(3):195–203. [Google Scholar]
29. Vincini M, Frazzi E, D’Alessio P. A broad-band leaf chlorophyll vegetation index at the canopy scale. Precis Agric. 2008;9(5):303–19. [Google Scholar]
30. Atta B, Saleem M, Ali H, Arshad H, Ahmed M. Chlorophyll as a biomarker for early disease diagnosis. Laser Phys. 2018;28(6):656–64. [Google Scholar]
31. Cao Y, Xu H, Song J, Yang Y, Hu X, Wiyao K, et al. Applying spectral fractal dimension index to predict the SPAD value of rice leaves under bacterial blight disease stress. Plant Methods. 2022;18(1):67. [Google Scholar] [PubMed]
32. Amin T, Gupta V, Sharma A, Rai P, Razdan V, Sharma S, et al. Distribution of Xanthomonas oryzae pv. oryzae pathotypes in basmati-rice-growing areas of Jammu and Kashmir, India. Agronomy. 2023;13(3):713. [Google Scholar]
33. Onohata T, Gomi K. Overexpression of jasmonate-responsive OsbHLH034 in rice results in the induction of bacterial blight resistance via an increase in lignin biosynthesis. Plant Cell Rep. 2020;39(9):1175–84. [Google Scholar] [PubMed]
34. Pu R. Hyperspectral remote sensing: fundamentals and practices. Boca Raton: CRC Press; 2017. [Google Scholar]
Cite This Article
 Copyright © 2024 The Author(s). Published by Tech Science Press.
This work is licensed under a Creative Commons Attribution 4.0 International License , which permits unrestricted use, distribution, and reproduction in any medium, provided the original work is properly cited.


 Submit a Paper
 Propose a Special lssue
 View Full Text
 Download PDF
 Downloads
 Citation Tools