
 Submit a Paper
 Propose a Special lssue
 Open Access
ARTICLE

Orchestrating the Phytochemical Content and Bioactivities in the Leaf, Bark, and Fruit Extracts of Cornus capitata Wall
1 Department of Biochemistry, Hemvati Nandan Bahuguna Garhwal University, Srinagar Garhwal, Uttarakhand, 246174, India
2 Department of Biomedical, Surgical and Dental Sciences, University of Milan, via L. Vanvitelli 32, Milan, 20129, Italy
3 National Interuniversity Consortium of Materials Science and Technology, via G. Giusti 9, Firenze, 50121, Italy
4 Cosmetics and Natural Products Research Center (CosNat), Faculty of Pharmaceutical Sciences, Naresuan University, Phitsanulok, 65000, Thailand
* Corresponding Authors: Manisha Nigam. Email: ; Marcello Iriti. Email:
(This article belongs to the Special Issue: Advances in Molecular Insights of Plant Secondary Metabolites: Biosynthesis, Regulation, and Applications)
Phyton-International Journal of Experimental Botany 2025, 94(3), 1007-1027. https://doi.org/10.32604/phyton.2025.061270
Received 20 November 2024; Accepted 24 January 2024; Issue published 31 March 2025
 View Full Text
 Download PDF
Abstract
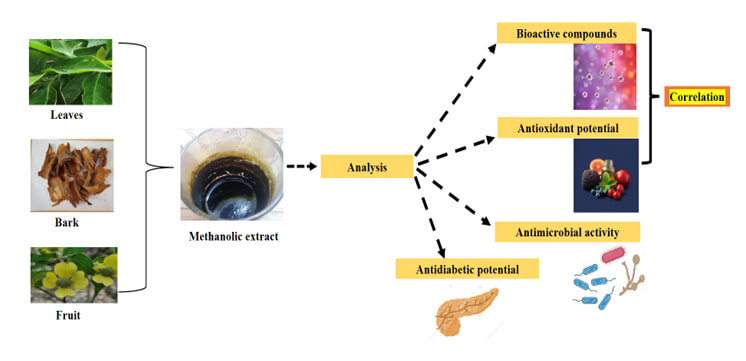
Cornus capitata, commonly known as the Himalayan strawberry, is a dogwood species from the family Cornaceae. Dogwood plants have been used extensively to practice conventional medicine due to their biological activities; however, the mechanisms behind these activities, particularly in C. capitata, remain largely unexplored. This study focuses on the preliminary phytochemical screening, antioxidant activity, anti-diabetic potential, and antimicrobial profiling of different extracts (i.e., leaves, bark, and fruit) from C. capitata to evaluate its potential pharmaceutical and medicinal applications. The in-vitro antioxidant activity was evaluated using 1,1-diphenyl-2-picrylhydrazyl (DPPH) scavenging assay, Ferric-reducing antioxidant power (FRAP) assay, and Superoxide Anion Scavenging assay. The anti-diabetic potential was assessed using α-Glucosidase, α-Amylase, and Pancreatic lipase inhibition assay. The anti-microbial activity was evaluated using the Kirby-Bauer method and Minimal Inhibitory Concentration (MIC). According to the quantitative investigation, the most substantial quantities of flavonoids and phenolic compounds were identified in the leaves of C. capitata. Antioxidant activity results corroborated this conclusion, demonstrating that methanolic leaf extract had strong antioxidant activity, with the lowest IC50 values recorded for the DPPH (32.4 ± 0.19 µg/mL) and Superoxide Radical Scavenging (37.10 ± 0.21 µg/mL) assays. Furthermore, the methanolic leaf extract displayed the highest α-Glucosidase inhibitory potential (IC50 = 6.09 ± 0.52 µg/mL), while the methanolic bark extract exhibited the highest α-Amylase inhibitory activity (IC50 = 49.10 ± 0.38 µg/mL). Regarding antimicrobial potential, the paper disc diffusion assay showed that none of the extracts demonstrated antibacterial effects against E. coli. However, the MIC assay revealed that the leaves and bark extracts exhibited antibacterial properties with MIC values of 80 and 500 µg/mL against E. coli, respectively. The paper disc diffusion assay against C. albicans indicated the antimicrobial potency of all three extracts. The crude methanolic extract of C. capitata shows strong antioxidant and antidiabetic potential, highlighting its therapeutic value. This is the first comparative investigation of leaf, bark, and fruit extracts of C. capitata to orchestrate the phytochemical profile and evaluate the antioxidant, antidiabetic, and antimicrobial activities. Nevertheless, further studies are needed to understand its biological implications.Graphic Abstract
Keywords
Plants have been used as medicines for centuries across various cultures worldwide. They have long been the foundation of conventional medicine and have led to the discovery of numerous naive metabolites with remarkable pharmacological effects [1]. Nevertheless, there is insufficient scientific data regarding the chemical components and biological attributes of the various natural resources employed in traditional medicine. It is widely acknowledged that plants might include various bioactive substances, including vitamins, terpenoids, nitrogen compounds, phenolic compounds, and some other endogenous metabolites [2] that may be utilized for disease prevention and health maintenance [3]. For instance, phenolic compounds have been documented to exhibit diverse biological implications owing to their antioxidant properties [4]. Their redox characteristics are primarily responsible for this action, which can be crucial in absorbing and mitigating free radicals, absorbing singlet or triplet oxygen, and splitting down peroxides [5]. Numerous naturally existing plant-based antioxidants, whether in crude extract or dietary supplements, have been researched for their potential to treat inflammatory disorders, antibacterial properties, and diabetes. Natural suppliers of antimicrobials are medicinal plants and their metabolites. Secondary metabolites prevalent in many plant species can ward off pathogenic microbes. These substances include alkaloids, terpenes, tannins, steroids, glycosides, saponins, and flavonoids [6] that exhibit remarkable pharmacological potential, making them pivotal in drug discovery and therapeutic applications. Alkaloids, such as morphine and vinblastine, are renowned for their analgesic, anticancer, and antimicrobial properties [7]. Interestingly, terpenes like taxol and limonene demonstrate anticancer, antiviral, and anti-inflammatory activities [8]. Tannins, effective as antioxidants and antimicrobials, also aid in wound healing and glucose regulation [9]. Moreover, steroids, including corticosteroids and phytosterols, are critical in managing inflammation, cholesterol levels, and hormonal balance. Glycosides like digoxin and stevioside are essential in cardiology and diabetes management [10]. Saponins possess immunomodulatory, anticancer, and antioxidant properties [11], while flavonoids, including quercetin and kaempferol, offer cardioprotective, anti-inflammatory, and anticancer benefits [12].
Microbial infections, encompassing bacterial, fungal, and viral pathogens, present significant global health challenges, particularly with the rise of antibiotic-resistant strains. Several studies have documented the use of plant-derived chemicals against bacterial infections, including food-borne diseases [13]. Recent studies have highlighted the potential of plant-based extracts as alternative antimicrobial agents. For instance, a study on Amazon rainforest plants demonstrated inhibitory effects against various human pathogens, suggesting a rich source of bioactive compounds [14]. Additionally, a study evaluated the antibacterial activity of leaf extracts from Calpurnia aurea, indicating effectiveness against multiple bacterial strains [15]. These findings underscore the promise of plant-derived substances in combating microbial infections and addressing antibiotic resistance. Traditional healing practices usually use a single plant species to treat multiple illnesses or infections [16].
Interestingly, the bioactive substances from these plants are believed to act synergistically, which could be particularly beneficial in treating long-lasting, multifaceted conditions involving distinct signaling pathways. Diabetes is a chronic metabolic disorder characterized by elevated blood sugar levels due to impaired insulin secretion or action. Key enzymes such as alpha-amylase and alpha-glucosidase play vital roles in carbohydrate digestion and glucose absorption, making them important targets for managing diabetes. Inhibiting these enzymes can delay glucose absorption and help control blood sugar spikes after meals [17]. Plant extracts like fenugreek, bitter melon, and ginseng have been shown to exhibit alpha-amylase and alpha-glucosidase inhibitory effects, offering a natural alternative to improve glycemic control [17,18]. Combined with conventional treatments, these natural compounds hold promise for managing diabetes and preventing related complications. Studies have suggested a significant involvement of oxidative stress in the pathophysiology of diabetes; however, the precise mechanisms remain unclear given oxidative stress’s dual function as both a signaling molecule and a damaging agent in biological systems [19].
Cornus capitata, a member of the genus Cornus, commonly known as the Himalayan dogwood, has long been used in conventional medicine, particularly in Asia. Extensive research on other species within the Cornus genus suggests that these plants possess significant medicinal potential, warranting further investigation for their potential in treating various diseases. The Cornus fruits are traditionally employed to manage gastrointestinal disorders like diarrhoea and dysentery due to their astringent properties, while the leaves are used for fever reduction and wound healing [20]. The bark has antibacterial and anti-inflammatory effects, making it useful for treating skin infections and inflammatory conditions [21]. The roots are believed to treat digestive issues and respiratory ailments. Comparing the different parts of the plant helps identify the most potent bioactive constituents responsible for its medicinal properties and validate its traditional uses. This approach not only supports ethnobotanical applications but also provides a scientific basis for the plant’s therapeutic potential [22]. To uncover prospective new treatments, extracts from plants with an extended history of traditional use should be assessed for their ability to treat human illnesses utilizing contemporary technologies. Therefore, pharmacological studies and therapeutic investigations on diverse Cornus species have been in demand recently. C. mas and C. officinalis are the two widely explored species of the genus Cornus that have reported various biological activities against diseases, for instance, antidiabetic, antimicrobial, and anti-inflammatory [22,23]. Among the various species of the Cornus genus, Cornus capitata remains relatively unexplored in terms of its biological potential. The research addresses the lack of comparative data on the biological properties of the different plant parts. To the greatest of our knowledge, this represents the first study to compare the biological activity of C. capitata’s leaves, bark, and fruits and discuss potential medical uses for each.
Our primary goal is to quantify the total phenolic and flavonoid content in the methanolic extracts from the leaves, bark, and fruits of C. capitata. Additionally, we aim to assess their antioxidant, antidiabetic, and antimicrobial activities.
2.1 Collection of the Plant Material
Cornus capitata plants were sampled from the Khirsu region (latitude-30.182082°, longitude-78.880982°) of Pauri Garhwal, Uttarakhand. Plant verification was done at the Botanical Survey of India (BSI), Dehradun, Uttarakhand (Reference number: BSI/NRC. Herb (Ident.)/2023-24/489).
2.2 Preparation of the Samples
The different plant parts-leaves, bark, and fruit were thoroughly washed using distilled water before dried in the shade for three weeks at room temperature. These shade-dried plant parts were coarsely powdered. Three different solvent systems (Petroleum ether, Methanol and water) were used for the extraction. 60 ml of each solvent was added to 30 g of the plant material’s coarse powder in a Soxhlet thimble separately. The apparatus was operated for 24 h with continuous monitoring. The extract of each separate solvent was subsequently centrifuged to eliminate the particles or suspensions mixed during extraction for 15 min at 2795× g. After collecting the supernatant, the solvent was removed with a rotary evaporator, resulting in a final volume that was one-fifth of the initial volume. Before being used, each concentrated component from various solvent systems was kept at –20°C.
2.3 Preliminary Screening of the Phytochemicals
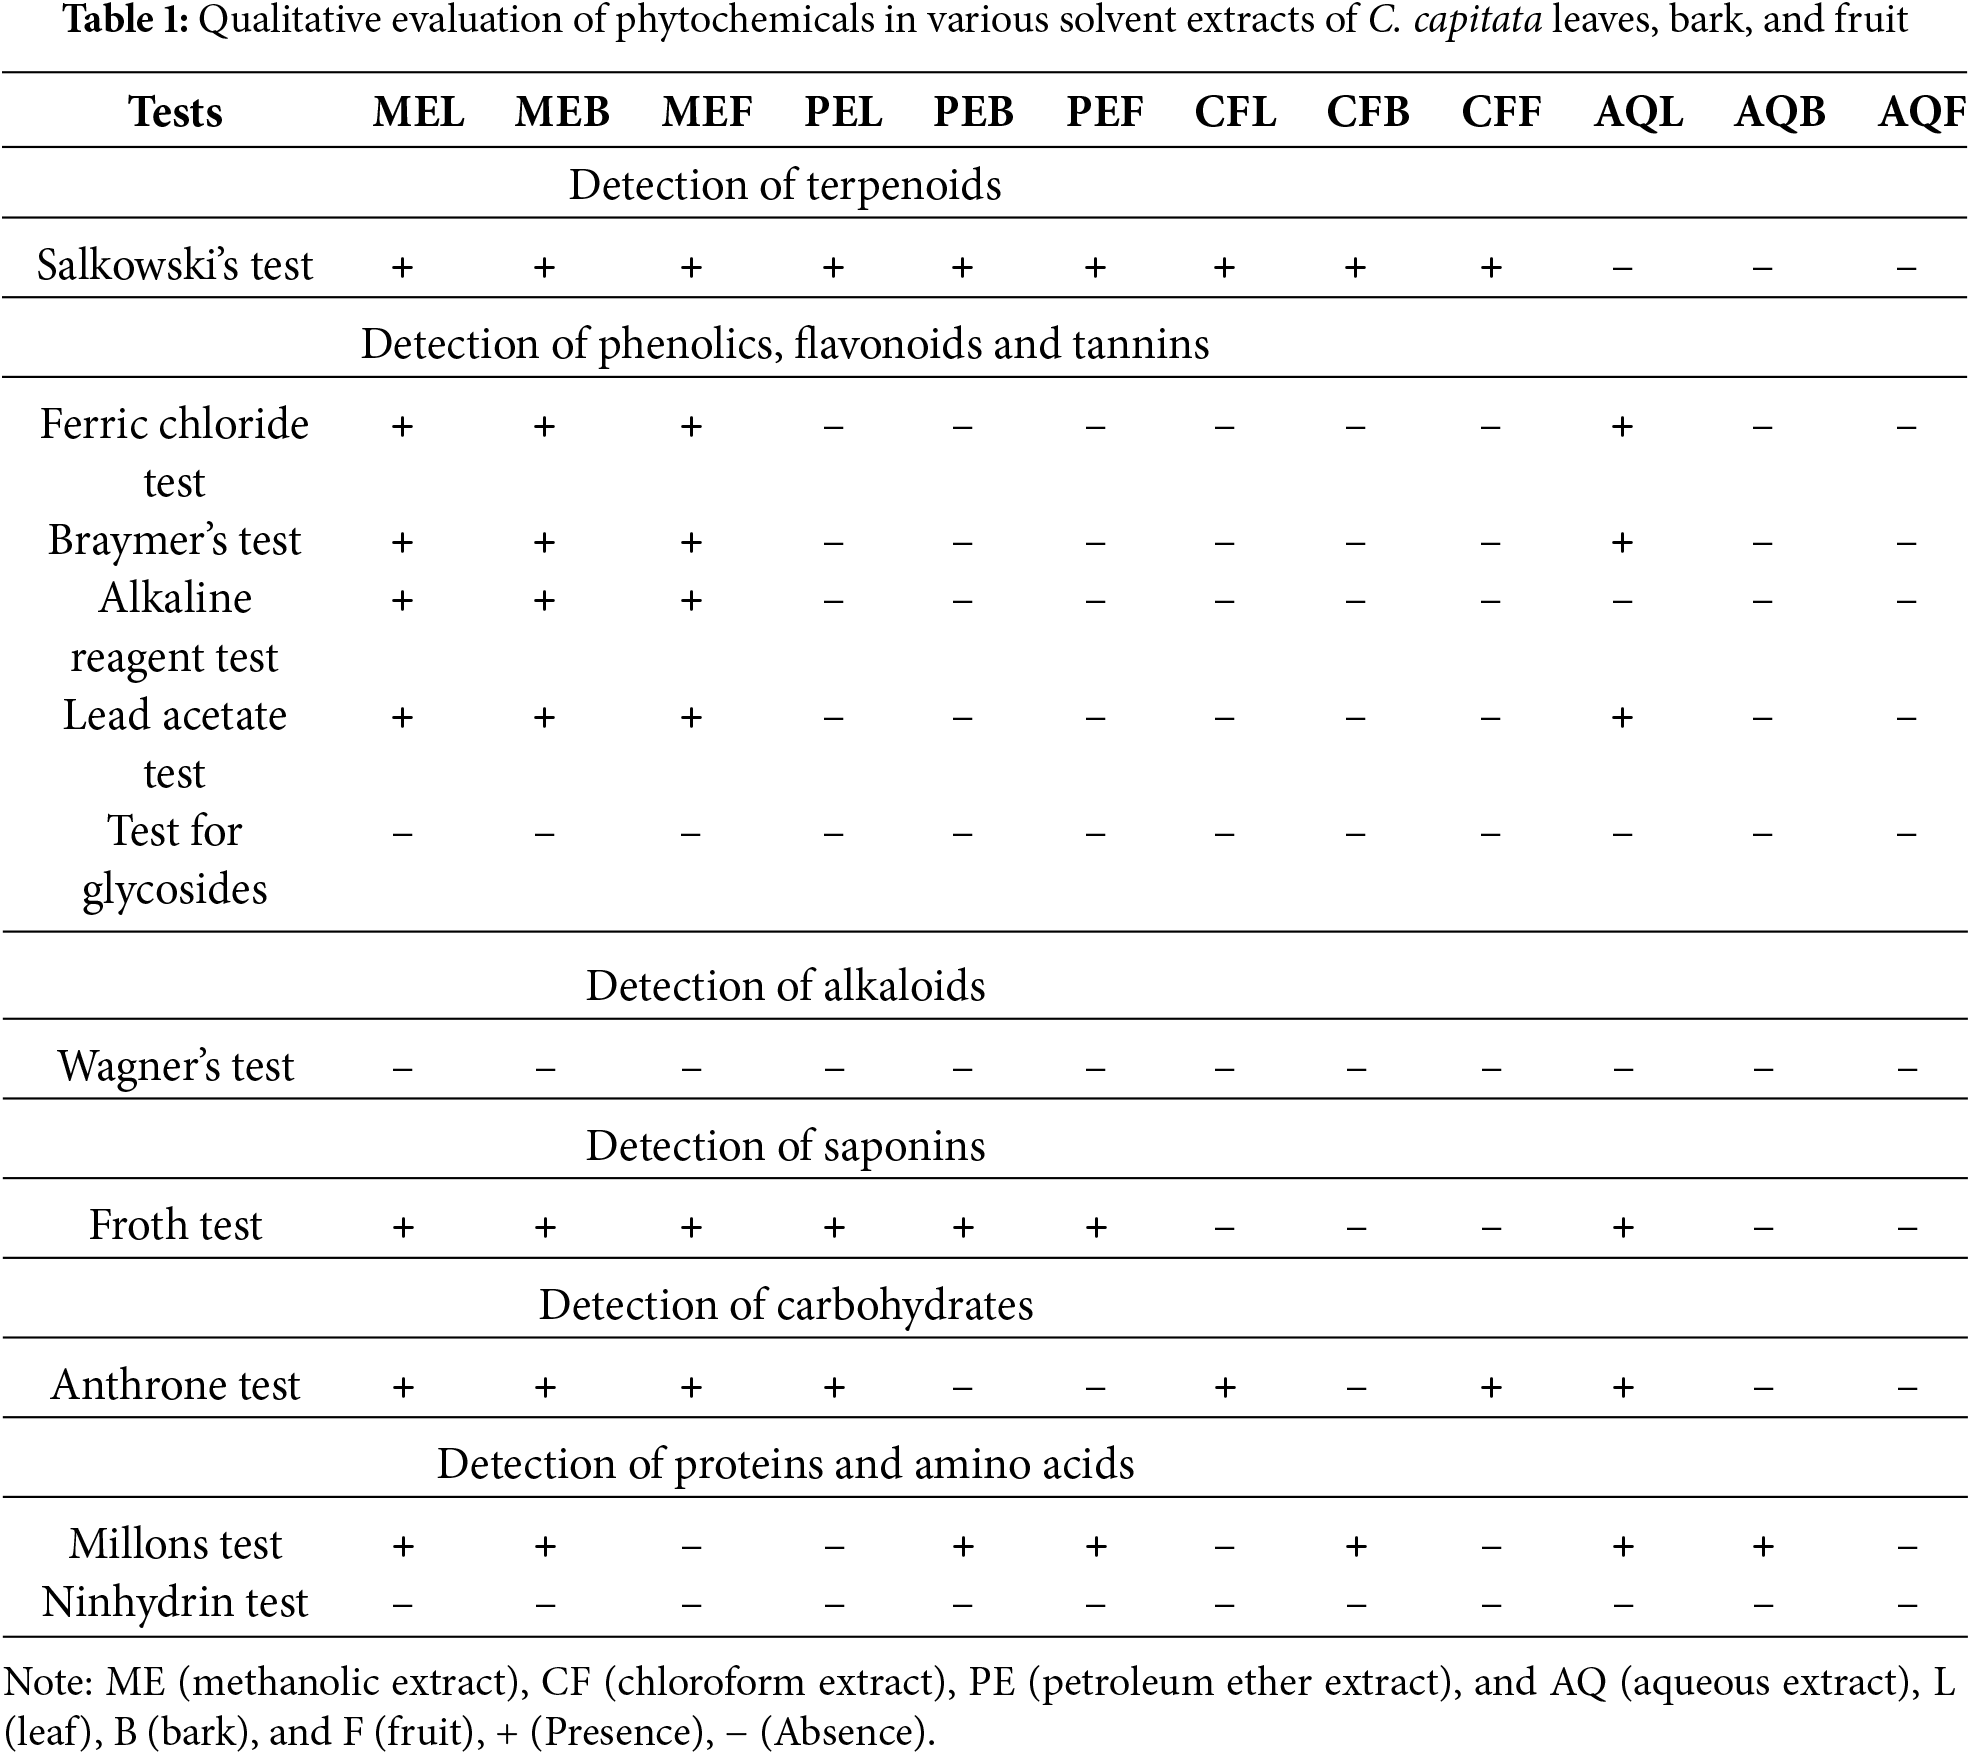
C. capitata extracts were screened for the phytochemicals performed as per the method employed by Gusain et al. in 2023 [24] such as proteins, carbohydrates, alkaloids, flavonoids, phenolics, saponins, tannins, terpenoids, and anthocyanins. The brief description is as follows:
Test for Carbohydrates
Anthrone’s Test: To 2–3 mL of extract, a few drops of anthrone reagent (20 mg of Anthrone in 10 mL of concentrated H2SO4) were added and mixed thoroughly. The mixture was then heated in a boiling water bath for 10 min and then cooled to room temperature. The appearance of a bluish-green color indicated the presence of carbohydrates.
Test for Proteins and Amino Acids
Millon’s Test: To 3 mL of extract, 5 mL of Millon’s reagent was added. A white precipitate formed, which, upon warming, either turned brick-red or dissolved to yield a red-coloured solution, confirming the presence of proteins.
Test for Amino Acids
Ninhydrin Test: To 3 mL of extract, 3 drops of 5% Ninhydrin solution were added. The mixture was heated in a boiling water bath for 10 min. The development of a purple or bluish colour indicated the presence of amino acids.
Test for Saponins
Froth Test:
To 2–3 mL of extract, 5 mL of distilled water was added, and the mixture was vigorously shaken for about 2 min. The formation of a stable, persistent froth indicated the presence of saponins.
Test for Alkaloids:
Wagner’s Test:
Two drops of Wagner reagent were added to 2 mL of extract and mixed well. The appearance of a reddish colour indicates the presence of alkaloids.
Test for Glycosides
Borntrager’s Test (Anthraquinone Glycosides):
To 3 mL of the extract, 3 mL of dilute sulfuric acid was added, and the mixture was boiled for 5 min, then cooled and filtered. The filtrate was shaken with 3 mL of chloroform, and the chloroform layer was separated and shaken with an equal volume of dilute ammonia. The appearance of a pink, red, or violet color in the ammoniacal layer confirmed the presence of anthraquinone glycosides.
Test for Phenolic Compounds
a) Ferric Chloride Test:
To 2–3 ml of the extract, a few drops of 5% ferric chloride solution were added. The appearance of a deep blue-black colouration confirmed the presence of phenolic compounds.
b) Lead Acetate Test:
A small amount of the extract was mixed with 3 mL of 1% lead acetate solution. The formation of a bulky precipitate indicated the presence of phenolic compounds.
Test for flavonoids
Alkaline reagent test:
To 0.5 mL of the extract, 2–3 drops of sodium hydroxide were added. The appearance of a deep yellow color indicated the presence of flavonoids. This coloration was decolorised upon the addition of acid.
Test for tannins
Braymer's test:
To the 1 mL of extract, 2–3 drops of 0.1% ferric chloride solution were added. The formation of a brownish-green or blue-black precipitate indicated the presence of tannins.
Test for terpenoids
Salkowski’s test:
3 mL of the extract was mixed with 2 mL of chloroform. Subsequently, 3 mL of concentrated sulfuric acid was added carefully to form a layer. The appearance of a reddish-brown coloration at the interface indicated the presence of terpenoids.
2.4 Total Content of Phenolics
The total content of phenolics was quantified employing the Folin-Ciocalteu procedure, using gallic acid as the standard [24]. A final concentration of 1.0 mg/mL was obtained by dissolving plant extracts in DMSO. 0.5 mL of each extract and standard solution, 2.5 mL of diluted 1:10 Folin-Ciocalteu reagent, and 4 mL of a 7.5% Na2CO3 solution were all added into separate test tubes. Following a 60-min incubation period at room temperature, the tubes were covered. Afterwards, a UV-visible spectrophotometer was used to measure absorbance at 760 nm. Following calculation, the total phenolic content was reported as milligrams of gallic acid equivalents (GAEs) per gram of extract. The experiment was performed in triplicate for each concentration.
2.5 Total Content of Flavonoids
Using quercetin as the standard for comparison, the colourimetric technique utilising aluminium chloride was employed to calculate the total amount of flavonoids [25]. A final concentration of 1.0 mg/mL was obtained by dissolving plant extracts in DMSO. In distinct test tubes, 0.5 mL of each standard and extract solution was combined with 1 mL of 10% AlCl3, incubated for 6 min, and mixed with 1 mL of 1M CH3COOK solution. The final volume was then adjusted to 5 mL using distilled water after adding 2 mL of a 4% NaOH solution. Absorbance was measured with a UV-visible spectrophotometer at 520 nm. Milligrams of quercetin equivalents (QEs) per gram of extract denote the total flavonoid concentration. For every concentration, the experiment was conducted in triplicate.
2.6 DPPH Radical Scavenging Analysis
The free radical scavenging activity of the plant extract against 1,1-diphenyl-2-picrylhydrazyl (DPPH) was assessed using a standard method [25] with slight modifications. The extracts’ ability to donate hydrogen atoms was assessed by observing the decolourisation of a methanol solution of DPPH, which appears violet/purple and transitions to yellow in the presence of antioxidants. In brief, a stock solution of the plant extract was made in methanol at 1 mg/mL. Serial dilutions were then made for both the plant extract (ranging from 50 to 1000 μg/mL) and the positive control, ascorbic acid.
For each sample, 0.1 mL of the solution was combined with 0.2 mL of 0.1 mmol/L DPPH solution in a 96-well plate and incubated in the dark at 37°C for 30 min. Following incubation, absorbance was measured at 490 nm using a microplate reader (iMark, BioRad) to assess the extent of DPPH radical reduction. The results were expressed as IC50 values (mg/mL), representing the concentration required to inhibit 50% DPPH radicals. Deionized water was used in place of the sample solution to serve as a control. The percentage of inhibition compared to the control was used to compute the radical scavenging activity. IC50 values were derived using GraphPad Prism 6 software and reported in mg/mL.
ATest denotes the absorbance of plant extract, and AControl stands for the absorbance of control.
2.7 Ferric-Reducing Antioxidant Power (FRAP) Analysis
The FRAP assay, with certain modifications, was employed to assess the antioxidative activity of methanolic plant extracts [26]. 0.04 mL of 0.2 M sodium phosphate buffer (pH 6.6) and 0.05 mL of 1% K3Fe(CN)6 [potassium ferricyanide] solution were mixed with 10 μl of different stocks of the methanolic plant extract (50 to 1000 μg/mL) and positive control Ascorbic Acid. For 20 min, the reaction mixture was then incubated at 50°C in the dark. Subsequently, the test tubes were centrifuged at 3000 rpm for 10 min after adding 0.5 mL of 10% trichloroacetic acid. A mixture of 0.5 mL of ferric chloride (0.1% w/v) and 2.5 mL of distilled water was prepared using roughly 2.5 mL of the supernatant. The absorbance was noted at 750 nm using a microplate reader (iMark, BioRad). The reaction mixture’s increased absorbance evidenced the plant extract’s substantial reducing power.
2.8 Superoxide Radical Scavenging Analysis
The superoxide radical scavenging assay evaluated the extract’s capacity to prevent formazan formation by inhibiting the reduction of nitroblue tetrazolium (NBT) radicals, which are generated by superoxide radicals in the riboflavin-light-NBT system [27]. Different concentrations of methanolic plant extract (50–1000 μg/mL) were mixed with the riboflavin solution and were incubated for 30 min under light at room temperature. After incubation, the reaction mixture (potassium pyrophosphate buffer, PMS, NBT, and GSH) was added to the above-incubated mixture and mixed thoroughly. Gallic acid at various concentrations (1–50 μg/mL) served as a positive control. Absorbance was recorded using an Elisa plate reader (iMark, Biorad, USA) at 560 nm. The inhibition percentage was calculated using Eq. (1) and IC50 using Software Graph Pad Prism 6.
2.9 Inhibition of α-Glucosidase
The analysis of the α-glucosidase inhibition potential of extracts was done as per the standard procedure with minor alterations [28]. In a 96-well plate, the reaction mixture contained 50 μl of phosphate buffer (100 mM, pH 6.8), 10 μl of α-glucosidase (1 U/ml), and 20 μl of varying concentrations of extract (10 to 1000 μg/ml) was preincubated at 37°C for 15 min. Subsequently, 20 μl of p-nitrophenyl-α-D-glucopyranoside (p-NPG, 5 mM) was mixed as a substrate and incubated at 37°C for 20 min. The reaction was terminated by the addition of 50 μL of sodium carbonate (Na2CO3, 0.1 M). The released p-nitrophenol was assessed by recording the absorbance at 405 nm using a microplate reader (iMark, Biorad, USA). Acarbose at various concentrations (0.1–0.5 mg/mL) served as a positive control. Each investigation was conducted in triplicate, with a separate control setup devoid of the test substance. Using the following formula, the results were reported as a percentage of inhibition:
As = absorbance in the presence of the test substance, Ac = absorbance of the control. IC50 values were calculated with the help of Graph Pad Prism 6 software.
The inhibition of α-amylase activity by the extracts was assessed using a standard procedure with minor changes [28]. A reaction mixture comprising 50 μL of phosphate buffer (100 mM, pH 6.8), 10 μL of α-amylase (2 U/mL), and 20 μL of extract at different concentrations (10 to 1000 μg/mL) was preincubated in a 96-well plate for 20 min at 37°C. Subsequently, as a substrate, 20 μL of 1% soluble starch (made in 100 mM phosphate buffer, pH 6.8) was added, and the mixture was incubated for an additional half-hour at 37°C. 100 μL of the DNS colour reagent was added after the mixture had been incubated, and it was then boiled for ten minutes. A microplate plate reader was used to measure the absorbance of the resultant solution at 540 nm (iMark, Biorad, USA). Acarbose served as a positive control in a range of concentrations (0.1–0.5 mg/mL). Each experiment was conducted in triplicate, with a parallel control setup lacking the test extracts. The following formula was used to compute the percentage inhibition of the results:
As = absorbance in the presence of the test substance, Ac = absorbance of the control. IC50 values were calculated with the help of Graph Pad Prism 6 software.
2.11 Inhibition of Pancreatic Lipase
The potential of the C. capitata methanolic extracts to hinder the porcine pancreatic lipase action was employed to assess their lipase inhibitory efficacy [29] with slight modifications. Varying concentrations of methanolic plant extract, ranging from 10 to 1000 μg/mL, were prepared in lipase reaction buffer. In a 96-well plate, 10 μL of pancreatic lipase solution containing 1 mg/mL enzyme was poured into the desired well. After adding 10 μL of C. capitata methanolic extract, the mixture was incubated for ten minutes. A control comprised the reaction mixture devoid of extract. After adding 80 μL of p-nitrophenyl palmitate to each reaction mixture, the plate was incubated for five minutes at room temperature. At 415 nm, the absorbance was recorded with a microplate reader (iMark, BioRad). An inhibitor called orlistat (50 μg/mL) served as a positive control.
% inhibition was computed employing Eq. (1).
The zone inhibition approach (Kirby-Bauer method) was used to evaluate the antibacterial activity. After spreading 100 µL of bacterial culture (E. coli MTCC452) adjusted to 0.5 McFarland Units, or roughly 1.5 × 10⁸ CFU/mL, onto the MHA (Mueller-Hinton Agar) plates, the discs containing 10 µL of various concentrations (0 to 100 mg/mL) of the methanolic plant extract dissolved in DMSO were placed. To obtain the required load on the disc, 10% of each extract was taken and serially diluted in DMSO. The Ciprofloxacin disc (10 µg) was used as the positive control, while one disc in each plate was filled with DMSO as a vehicle control. The plates were then incubated at 37°C for twenty-four hours. The disc’s surrounding clear zones were measured to the nearest millimeter using a ruler and noted [30].
Likewise, 100 µL of fungal culture (C. albicans MTCC 854) tailored to 0.5 McFarland Units, or an approximate density of 1.5 × 10⁸ CFU/mL, was spread out on SDA (Sabouraud Dextrose Agar) plates to inoculate for antifungal activity. A disc containing 10 µl of various concentrations (0 to 50 mg/mL) of the samples was subsequently placed. As a vehicle control, one disk in each plate was filled with DMSO only, while the positive control was an Amphotericin B disc containing 50 µg. The C. albicans plates were incubated for twenty-four hours at 48°C. The disc’s surrounding clean zones were evaluated and reported.
Minimal inhibition concentration (MIC) values were determined for bacterial (E. coli – MTCC 452) and fungal strains (C. albicans – MTCC 854) used in this study. The broth microdilution method was used to determine the MIC [31]. Various concentrations of the methanolic extract were prepared using serial dilutions directly in a 96-well microtiter plate containing Mueller Hinton Broth (MHB) and Sabouraud Dextrose Broth (SDB). Standard dilution of microbes (0.5 McFarland) was employed for the analysis. 100 µl of the diluted log cultures of bacterial (E. coli) and fungal strain (C. albicans) were added to the microtiter plate containing 5 µL of diluted plant extract of different concentrations (10 to 1000 µg/mL) and incubated for 24 h and 48 h, respectively. After incubation, turbidity was measured at 630 nm by Elisa Plate Reader (iMark Biorad). Ciprofloxacin (10 µg) and Amphotericin B (50 µg) provided positive controls for E. coli and C. albicans.
All the experiments were performed in triplicate. Each sample of the extracts was tested in triplicate in three independent experiments. The results are expressed as a mean ± SD. Statistical analysis and IC50 were calculated using Software Graph Pad Prism 6. Microsoft Excel 2007 was used to calculate Pearson’s correlation coefficient. Statistical significance was depicted as p-values below 0.05.
3.1 Preliminary Screening of the Phytochemicals
A range of bioactive compounds, like flavonoids, phenols, tannins, saponins, and anthocyanins were identified in the various extracts of Cornus capitata leaves, bark, and fruit (Table 1). These phytochemicals are frequently found in various plants and are widely recognised for their therapeutic benefits. Given that C. capitata comprises such compounds, it may be valuable in treating several ailments. Among the different extracts tested, the methanolic extract showed promising results, leading to its selection for further in-depth analysis.
Similar findings have been reported in other Cornus species. For example, Cornus officinalis is known for its high content of iridoid glycosides, flavonoids, and triterpenoids, which contribute to its use in traditional Chinese medicine for treating liver and kidney ailments [32]. Likewise, Cornus mas has been extensively explored for its antioxidant and anti-inflammatory potential, attributed mainly to its phenolic and anthocyanin-rich content [33]. These findings across the Cornus genus highlight the potential of C. capitata for further exploration in pharmaceutical applications, as it shares a similar phytochemical profile with other medicinally valuable species.
3.2 Total Content of Phenolics
According to the quantitative analysis, C.capitata’s leaves have the highest quantities of phenolic compounds (12.28 mg GAE/gm), followed by the bark (10.06 mg GAE/gm). On the other hand, the fruits had the lowest amounts of phenolics (7.01 mg GAE/gm). These outcomes are consistent with earlier studies [34,35], which demonstrated that various plant parts, including leaves, flowers, bark, and fruits, tend to have different phytochemical profiles. In a similar study, Cornus officinalis leaves were also reported to have higher phenolic content than the fruit and bark. The phenolics in C. officinalis have been documented to account for their antioxidant and anti-inflammatory potential, making the leaves a particularly rich source of therapeutic compounds [36]. Likewise, Cornus mas has been found to possess a higher concentration of phenolics in its leaves compared to its fruits [37], which aligns with the findings for C. capitata (Table 2).
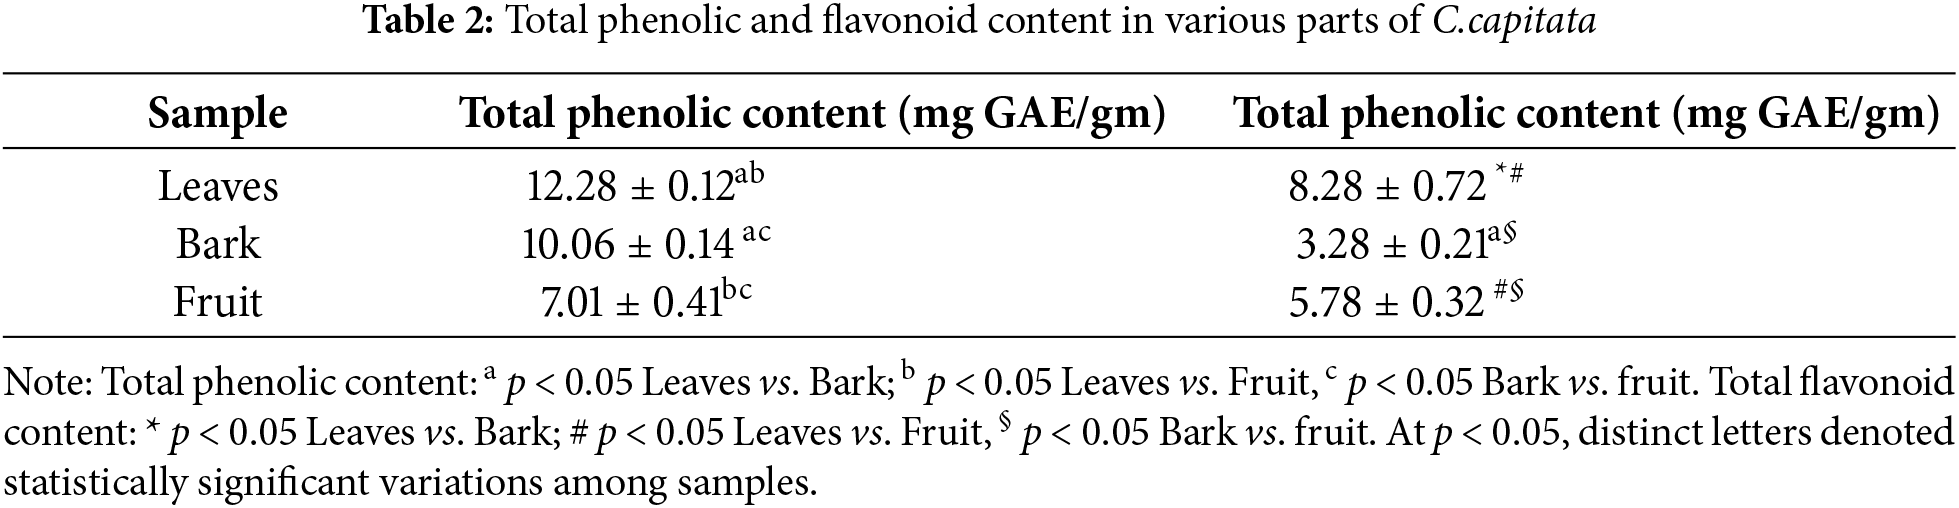
3.3 Total Content of Flavonoids
Quantitative analysis demonstrated that the leaves of C. capitata contained the highest concentration of flavonoids (8.28 mg GAE/g), a value comparable to the phenolic content. In contrast, the fruit showed a higher flavonoid content (5.78 mg GAE/g) than the bark, which had the lowest concentration (3.28 mg GAE/g). This pattern of flavonoid distribution aligns with findings in other Cornus species. For instance, Cornus mas have also exhibited higher flavonoid concentrations in their leaves compared to their fruits and bark. Studies have shown that the flavonoid content in C. mas leaves is notably high, contributing to its strong antioxidant properties, while the fruits, though rich in flavonoids, contain comparatively lower amounts [38]. Similarly, in Cornus officinalis, the leaves displayed significantly higher concentrations of flavonoids than other plant parts, reinforcing that leaves are often the richest source of flavonoids in Cornus species [39].
These consistent findings across different species of Cornus suggest that leaves are a critical repository of bioactive phenolics and flavonoids, which play a crucial role in the plant’s antioxidant and medicinal properties. Therefore, the elevated flavonoid content in C. capitata leaves underscores its potential therapeutic value, paralleling the medicinal benefits of other species within the genus.
3.4 DPPH Radical Scavenging Analysis
A standard method for measuring antioxidant activity in intricate biological systems is the DPPH test. The % inhibition and IC50 (μg/mL) values of three distinct extracts from C. capitata’s leaves, bark, and fruits indicate their antioxidant activity.
The DPPH radical scavenging analysis of C. capitata (leaves, bark, and fruit) methanolic extracts at different concentrations is shown in Fig. 1. The methanolic leaves and bark extracts demonstrated significant scavenging activity at 100 µg/mL concentrations, with inhibition rates of 94.41% and 86.35%, respectively. In contrast, the fruit sample exhibited a linear increase in DPPH radical scavenging with increasing concentrations, reaching a maximum inhibition of 83.16% at 500 µg/mL. The documented IC50 values for various extracts are mentioned in Table 3.
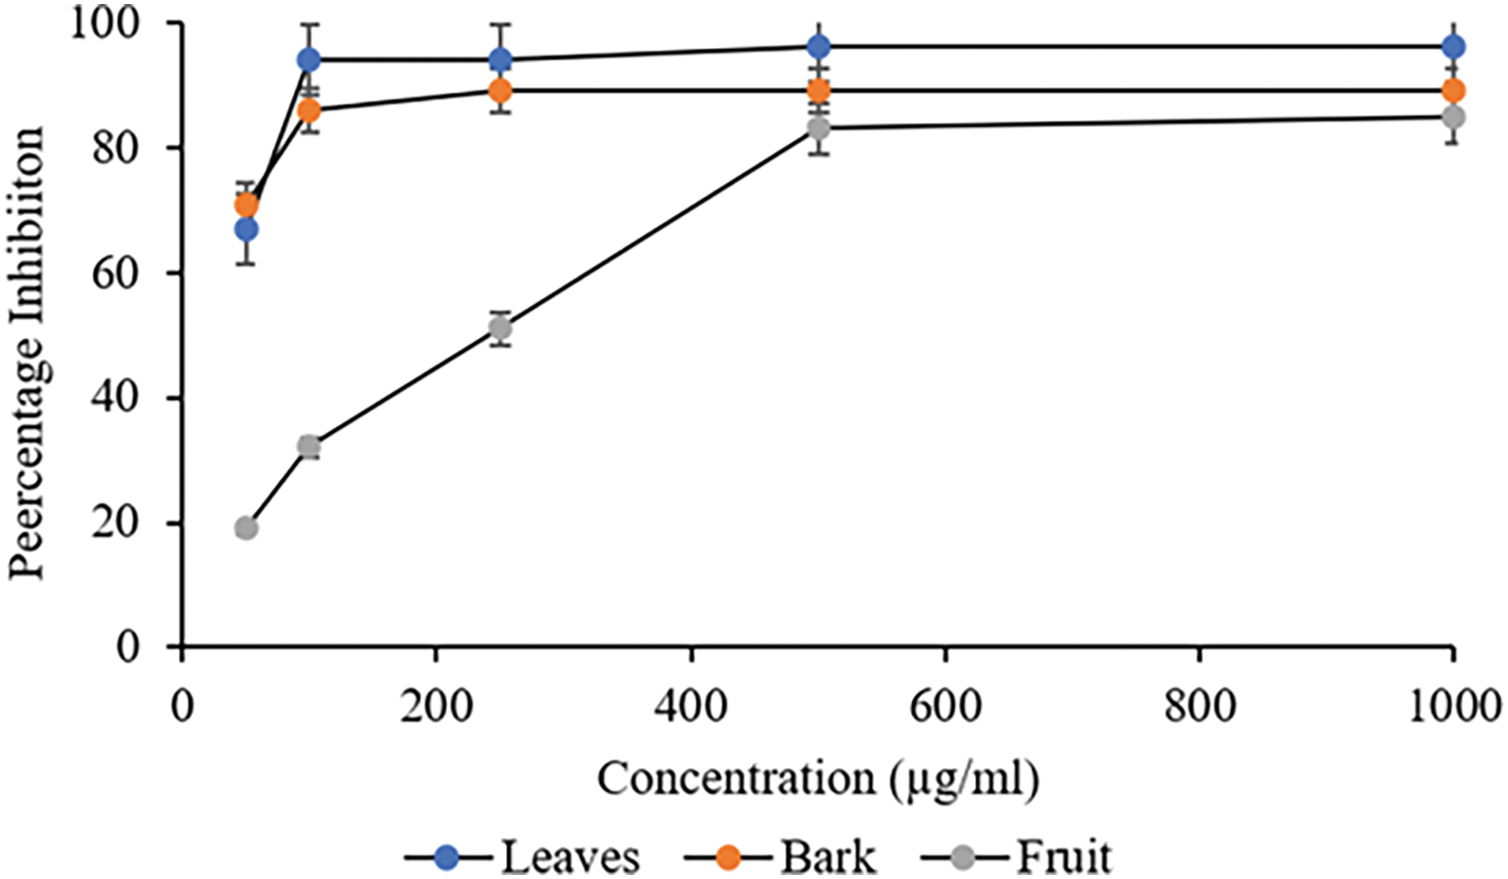
Figure 1: DPPH radical scavenging analysis on different plant parts of C. capitata. p < 0.05 leaves vs. bark (at 100 μg/mL and beyond); p < 0.05 leaves vs. fruit (at all the studied concentrations), p < 0.05 Bark vs. fruit (at all the studied concentrations)
A good correlation (R2) between TPC and DPPH scavenging potential was documented, demonstrating that phenolics are significantly responsible for antioxidant action [40,41]. Studies in other Cornus species have also shown a strong correlation between phenolic content and antioxidant potential, with the leaves showing higher antioxidant activity than the fruits owing to their higher phenolic concentrations. This relationship between phenolic content and antioxidant activity coincides with those findings [38].
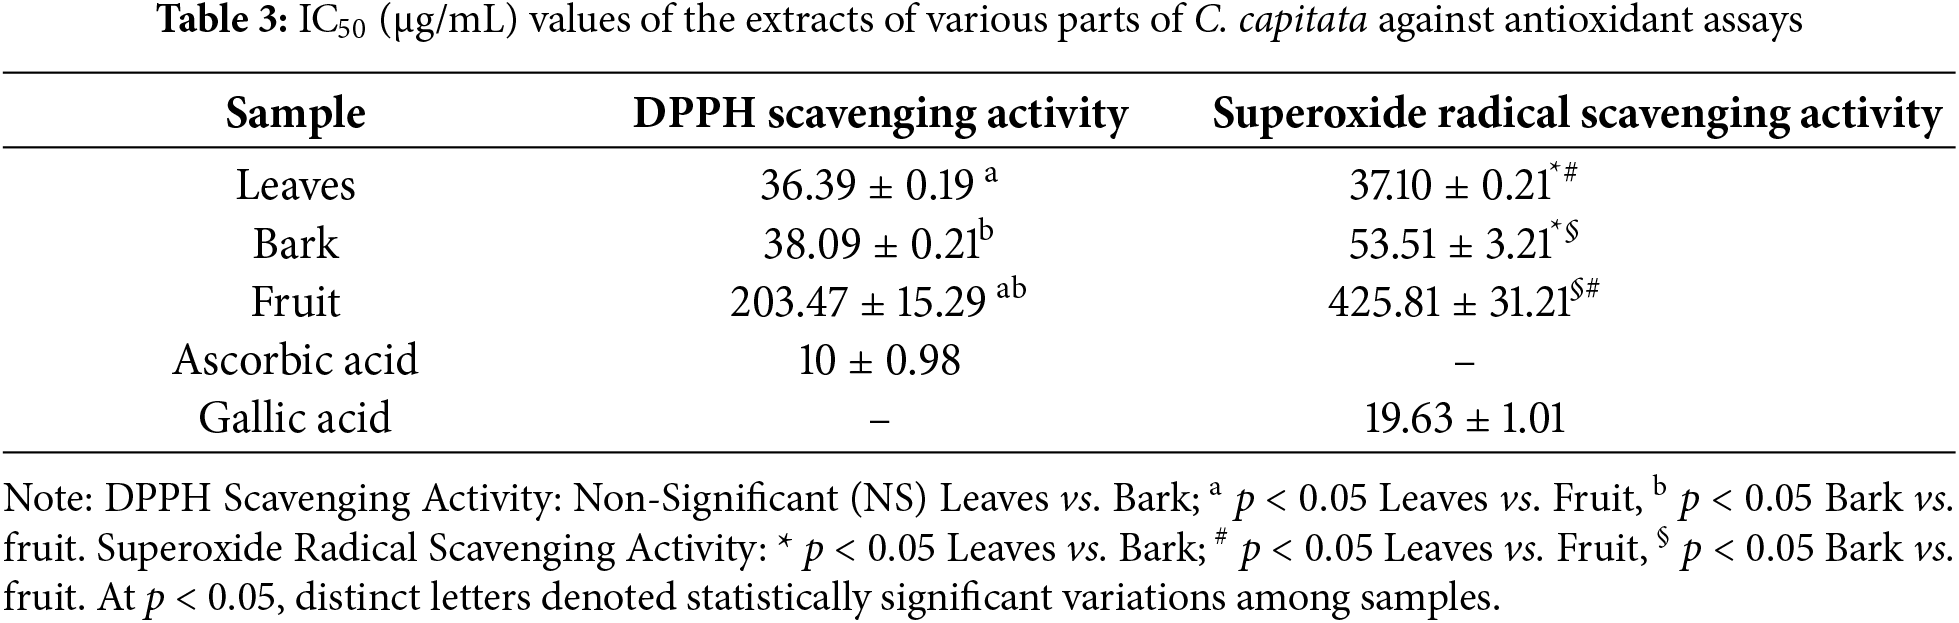
The reduction of the Fe3+ to Fe2+ ion in a complex of the 2,4,6-tri(2-pyridyl)-1,3,5-triazine (TPTZ) radical with the Fe3+ ion is the foundation for the spectrometric approach known as the FRAP method [24]. With increasing concentration, the extract's and standards’ reducing power—directly correlated with absorbance—increased. Plant extracts have a high reducing capacity, which indicates their potential antioxidants. The highest FRAP value was observed in bark (A750 = 1.08 absorption units), followed by fruit (A750 = 0.42 absorption units) and leaves (A750 = 0.321 absorption units) (Fig. 2). A significant difference (p < 0.05) between bark vs. leaves and fruit samples was documented. However, there was no significance between the leaves and fruit samples. The positive control Ascorbic acid demonstrated significantly highest absorbances among the three plant extracts. These results align with findings from other Cornus species, where the bark extract also showed higher FRAP values than leaf and fruit extracts, reinforcing that the bark tends to possess superior antioxidant capacity in various Cornus species [42,43].
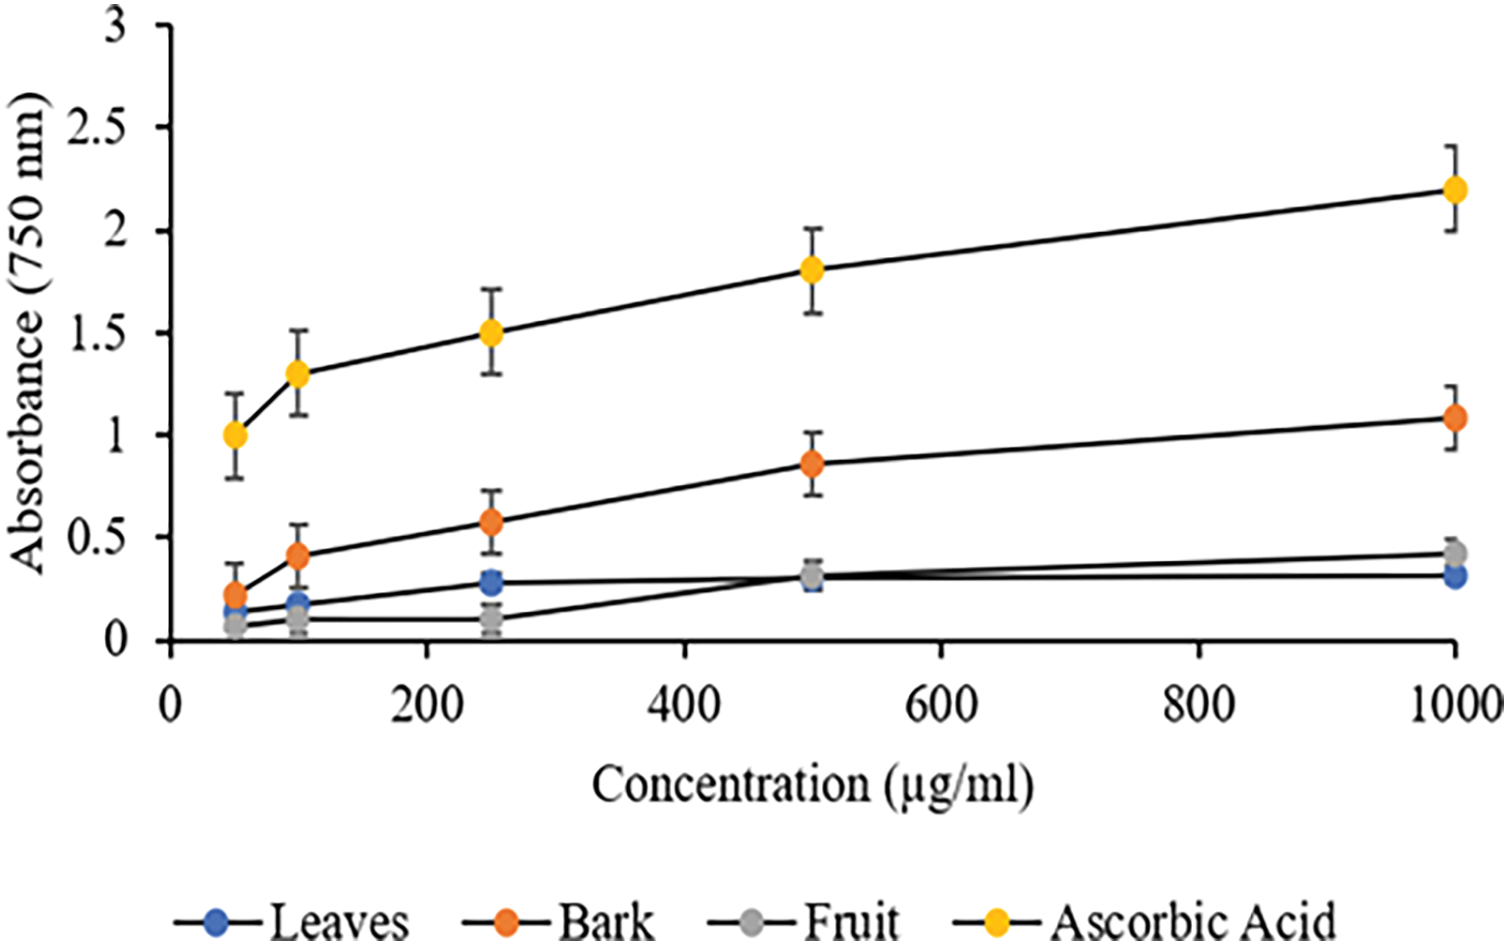
Figure 2: FRAP Assay of different plant parts of C. capitata. p < 0.05 Leaves vs. Bark (at all the studied concentrations); Leaves vs. Fruit (Non-Significant), p < 0.05 Bark vs. fruit (at all the studied concentrations)
3.6 Superoxide Radical Scavenging Analysis
The presence of antioxidant compounds leads the absorbance at 560 nm to decrease in the superoxide (SO) scavenging assay, which signifies that the reaction mixture’s produced superoxide anion has been quenched. The plant extract’s phenolic and tannin components can scavenge the superoxide radicals. Likewise, the natural antioxidant enzyme superoxide dismutase (SOD) may inhibit the effects of superoxide radicals. The results demonstrated that C. capitata methanolic leaves, bark, and fruit extracts effectively removed superoxide radicals.
The superoxide radical scavenging potential of C. capitata methanolic extracts at different concentrations is shown in Fig. 3. The methanolic leaves and bark extracts demonstrated significant scavenging activity at 100 µg/mL, with 86% and 71% inhibition, respectively. In contrast, the methanolic fruit extract documented a maximum inhibition of 50% at 1000 µg/mL. The IC50 values for various extracts are mentioned in Table 3.
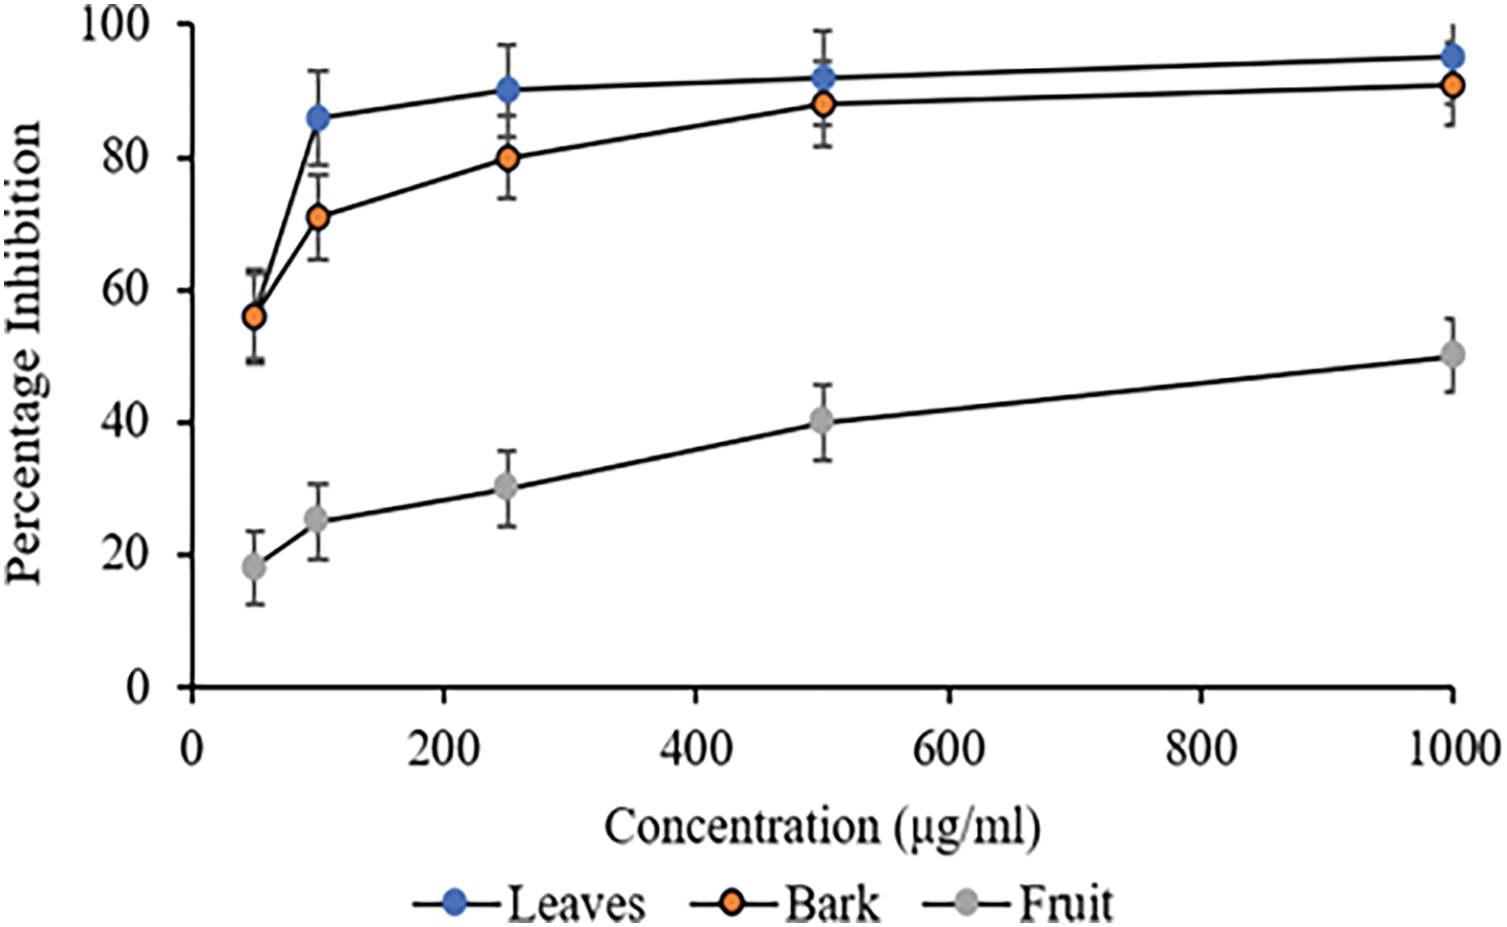
Figure 3: Superoxide radical scavenging analysis on different plant parts of C. capitata. p < 0.05 Leaves vs. Bark (at 100 μg/mL and beyond); p < 0.05 Leaves vs. Fruit (at all the studied concentrations), p < 0.05 Bark vs. fruit (at all the studied concentrations)
Extracts with the greatest amounts of phenolic compounds exhibit considerable antioxidant activity, as evidenced by comparing their phenolic content and antioxidant activity [40]. These findings indicate that all three C. capitata methanolic extracts showed phenol concentration-dependent scavenging activities, although the leaf extract had the highest antioxidant activity.
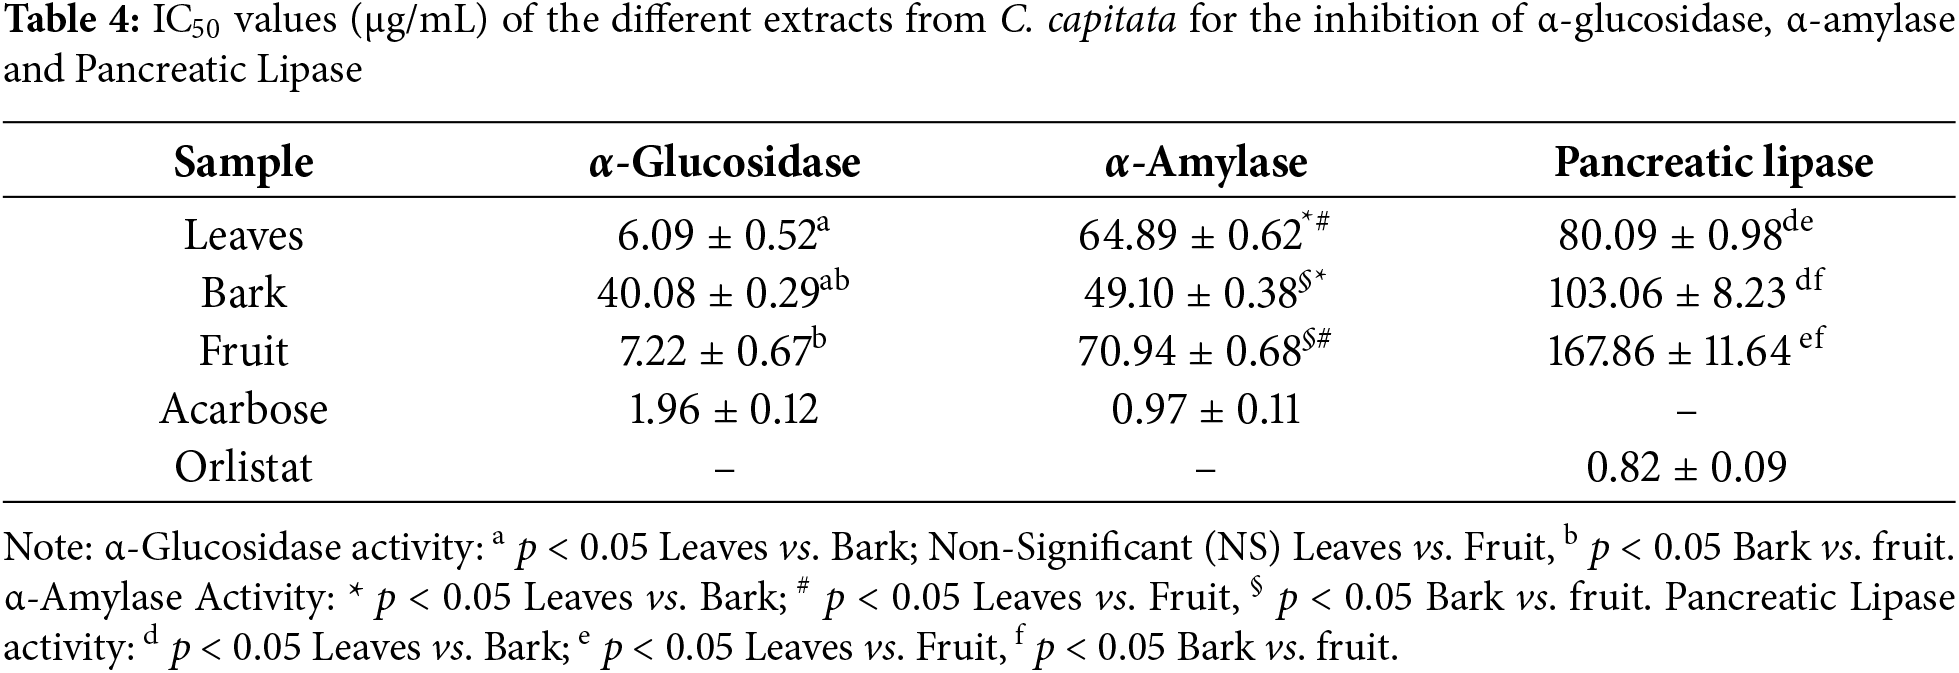
3.7 Inhibition of α-Glucosidase
Inhibiting α-glucosidase has been used to treat several illnesses since it is one of the enzymes that aids in the breakdown of complex carbohydrates (such as starches) into simpler sugars, mostly glucose. By delaying the breakdown of carbohydrates, inhibition of the α-glucosidase enzyme can lower blood glucose levels. This study tested the potential of C. capitata methanolic extracts (leaves, bark, and fruit) as an α-glucosidase inhibitor using an antidiabetic bioassay for the first time.
The α-Glucosidase inhibition activity of C. capitata in different methanolic extracts is depicted in Fig. 4. A remarkable percentage of inhibition at 50 μg/mL was observed in leaves, fruit, and bark, with inhibition percentages of 41%, 47%, and 49%, respectively. There was a concentration-dependent increase in inhibition of α-glucosidase on further doses. The corresponding IC50 value is given in Table 4. Statistical analysis revealed insignificant differences among the bark and fruit extracts. Nonetheless, these extracts and leaf extracts differed statistically significantly (p > 0.05). Prior research on α-amylase and α-glucosidase inhibitors derived from medicinal plants indicates that many of these inhibitors are members of the flavonoid class, which is known for its potential to inhibit α-amylase and α-glucosidase activities [44,45].
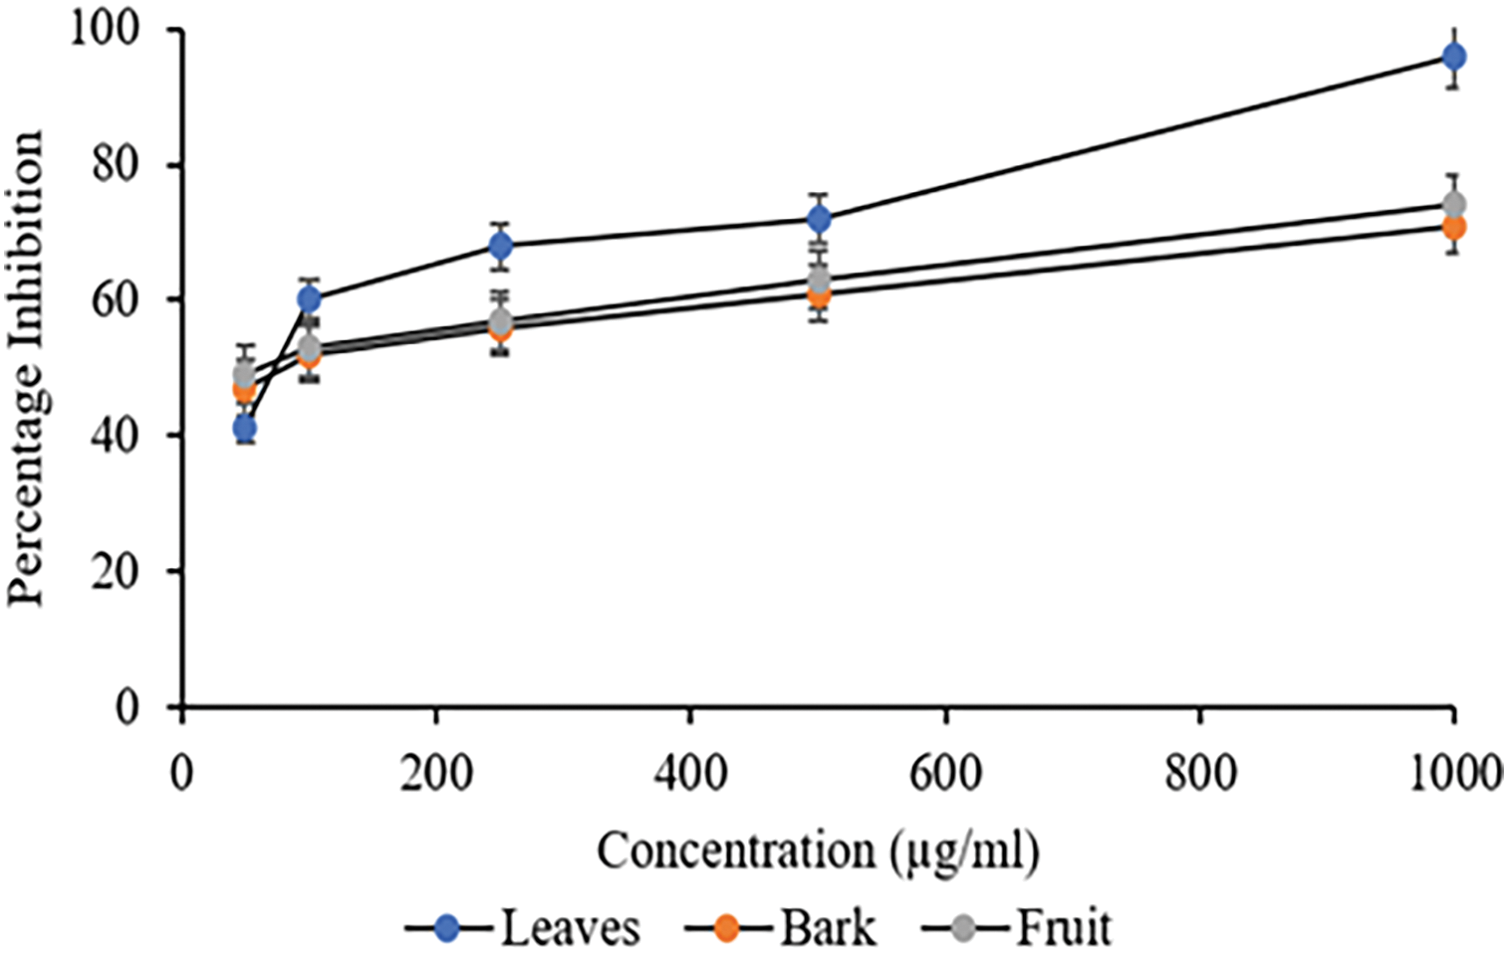
Figure 4: Percentage Inhibition of α-Glucosidase against different extracts of C. capitata. p < 0.05 Leaves vs. Bark (at all the studied concentrations); p < 0.05 Leaves vs. Fruit (at all the studied concentrations), Non-significant (NS) Bark vs. fruit
The inhibitory action of C. capitata extracts towards α-amylase was investigated to further evaluate their possible significance in regulating polysaccharide digestion. The percentage inhibition of α-amylase by C. capitata’s different methanolic extracts showed a concentration-dependent increase in percentage inhibition, as depicted in Fig. 5. At a concentration of 50 μg/mL of different extracts, i.e., leaves, bark and fruits, the reported inhibition percentages were 60%, 57%, and 53%, respectively, which further increased in a concentration-dependent manner. The corresponding IC50 value is given in Table 4. Like the results of α-Glucosidase inhibition, statistical analysis revealed no significant differences among the bark and fruit extracts. However, there was a significant statistical difference between these extracts and leaf extract (p > 0.05). The primary antioxidant substances, polyphenols, are responsible for the observed α-amylase activity. They have been shown to have beneficial effects in managing diabetes mellitus because they regulate the metabolism of carbohydrates, increase insulin production, and alter fat metabolism [44,46].
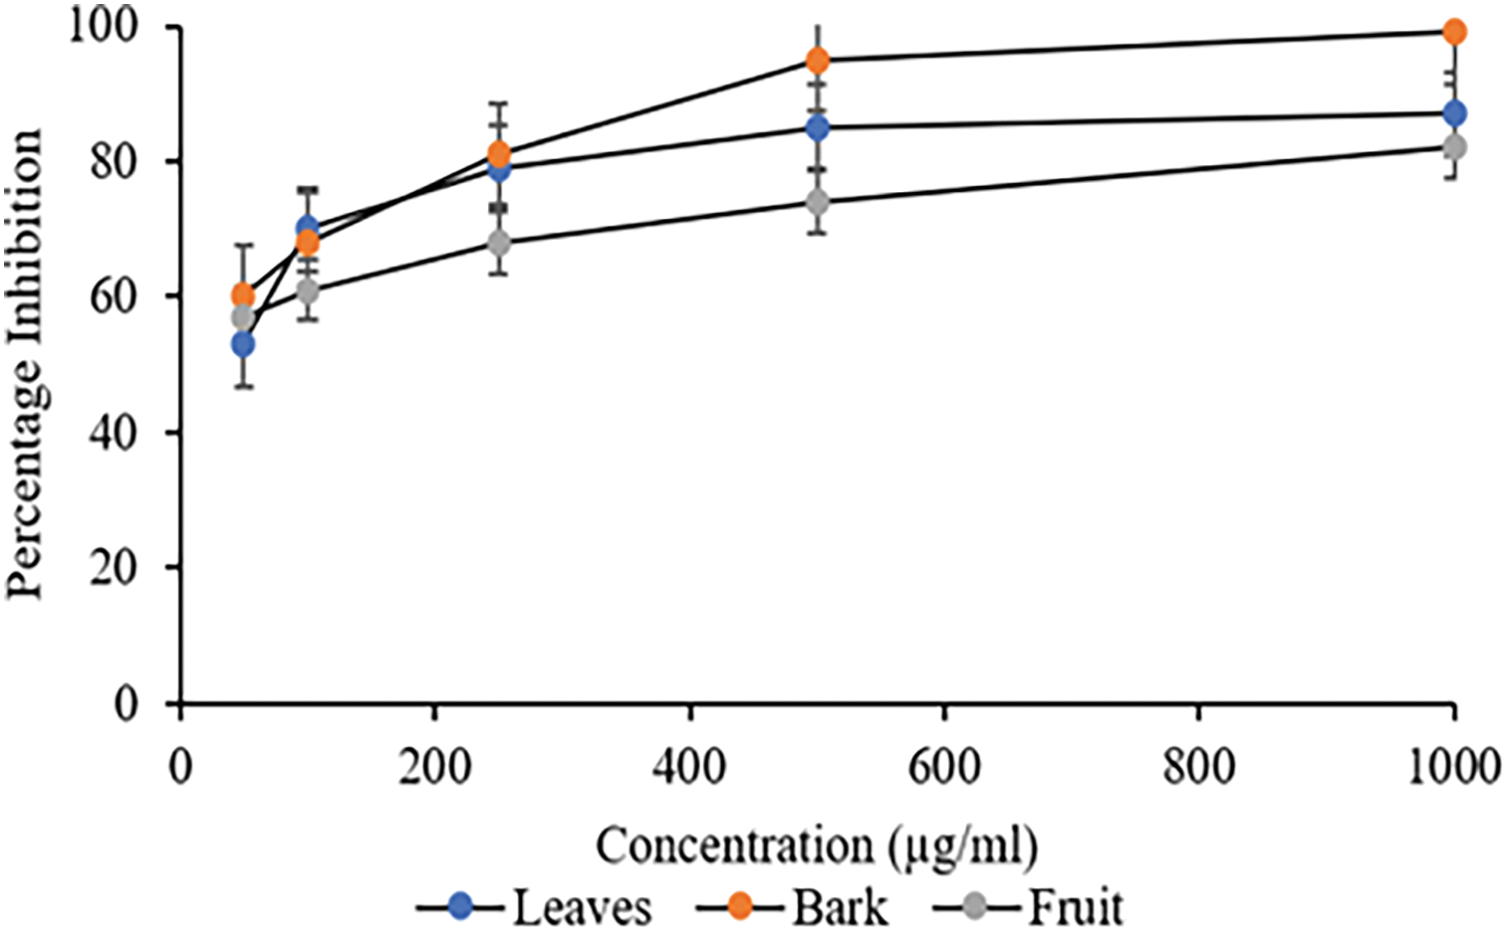
Figure 5: Percentage inhibition of α-Amylase against different extracts of C. capitata. p < 0.05 Leaves vs. Bark (at 500 μg/mL and beyond); p < 0.05 Leaves vs. Fruit (at 100 μg/mL and beyond), p < 0.05 Bark vs. fruit (at 100 μg/mL and beyond)
Moreover, a similar study on Cornus mas reported that methanolic extracts exhibited significant α-glucosidase and α-amylase inhibition. The results indicated that extracts rich in flavonoids were responsible for the observed inhibitory activity [47,48], similar to the findings in C. capitata. This reinforces the idea that C. capitata, like C. mas, may offer valuable bioactive compounds that can contribute to managing postprandial glucose levels. Notably, the conventional inhibitor acarbose was a more potent inhibitor of α-glucosidase and α-amylase activity than all examined extracts derived from C. capitata.
It is pertinent to note that Inhibiting enzymes like alpha-amylase and alpha-glucosidase is a key strategy in managing diabetes, particularly for controlling postprandial blood sugar levels by decreasing glucose absorption and improving glycemic control [17]. Plant-based compounds have shown the potential to inhibit these enzymes, offering natural alternatives for diabetes management [48].
3.9 Inhibition of Pancreatic Lipase
The pancreatic lipase inhibition of the C. capitata methanolic extracts was investigated at different concentrations. Orlistat was the positive control for the study. An essential digestive enzyme for the conversion and absorption of triglycerides into monoglycerides and free fatty acids is pancreatic lipase. The concentration of total cholesterol decreases when the lipase enzyme is suppressed. This is one of the possible mechanisms for the treatment of obesity. Orlistat works by decreasing the absorption of fat because it is a lipase inhibitor. However, the quest for alternative lipase inhibitors has been prompted by the fact that orlistat is linked to several severe adverse effects, such as flatulence, cramping in the abdomen, and greasy stools [49].
The lipase inhibition activity of different C. capitata methanolic extracts are depicted in Fig. 6. More than 50% inhibition was reported at 100 μg/mL, where 54% inhibition in the leaf extract was reported, followed by bark extract at 51%; in contrast, the fruit extract exhibited an inhibition of 51% at 250 μg/mL. Table 4 depicts the corresponding IC50 values; all the extracts demonstrated statistically significant results when compared to each other (p < 0.05) at 500 μg/mL of extract and beyond. Nevertheless, the Lipase inhibitor orlistat was more active than any studied extracts (IC50 = 0.82 ± 0.09 μg/mL).

Figure 6: Percentage Inhibition of Pancreatic lipase against different extracts of C. capitata. p < 0.05 Leaves vs. Bark (at 500 μg/mL and beyond); p < 0.05 Leaves vs. Fruit (at 100 μg/mL and beyond), Non-Significant (NS) Bark vs. fruit
Supporting evidence from other Cornus species highlights the potential of these plants in managing obesity management; studies have shown that C. mas and C. officinalis exhibited significant lipase inhibition, with inhibition rates of approximately 52% and 55% at respective concentrations of 100 and 200 µg/mL, which were linked to their flavonoid and phenolic content [47,50]. The lipase inhibition activity of C. capitata extracts may be attributed to secondary metabolites such as terpenoids and phenolics, previously reported for their lipase inhibitory effects [51].
Phytochemicals derived from plants have few adverse effects and an efficient therapeutic impact against microorganisms. Antimicrobial susceptibility tests were first conducted to ascertain the inhibitory impact of the plant extracts. The antibacterial screening activity of various C. capitata extracts was tested using cultures of the fungus Candida albicans (MTCC 854) and the gram-negative bacterium E. coli (MTCC 452). Methanolic extracts from the leaves, bark, and fruits of C. capitata were tested for antibacterial activity employing paper disc-diffusion method, which uses an inhibitory zone of ≥10 mm in diameter to signify significant antimicrobial activity [52]. The methanolic leaf extract showed insignificant anti-microbial activity in the range of 6 mm diameter against the E. coli bacterial strain, compared to other extracts (i.e., bark and fruit) that were completely insignificant. The leaf extract demonstrated fungistatic properties at 50 and 125 µg/mL extract concentration, whereas comparably higher for fruit extract, i.e., 250 and 500 µg/mL dose. However, the extract was not diffused in agar gel at higher concentrations. Hence, no clear zone was formed around the disk. Conversely, the bark extract showed the fungicidal properties at lower doses of 50 & 125 µg/mL. The fungistatic and Fungicidal activity was confirmed by subculturing the fungal strain from the inhibition zone; in the former case (leaf and fruit extract), the fungus grew on the fresh plate. Hence, the extract was fungistatic. In the bark extract, the fungus did not grow on the fresh plate; therefore, the extract was fungicidal.
Anti-microbial properties against E. coli were observed only in the leaves and bark extracts. Leaves extract was found to be most active (IC50 = 578.7 µg/mL, and MIC = 80 µg/mL), while bark extracts exhibited less antibacterial activity (IC50 = >1000 µg/mL, and MIC= 500 µg/mL) against E. coli. In contrast, fruit extracts showed no anti-microbial activity against E. coli ( Fig. 7).
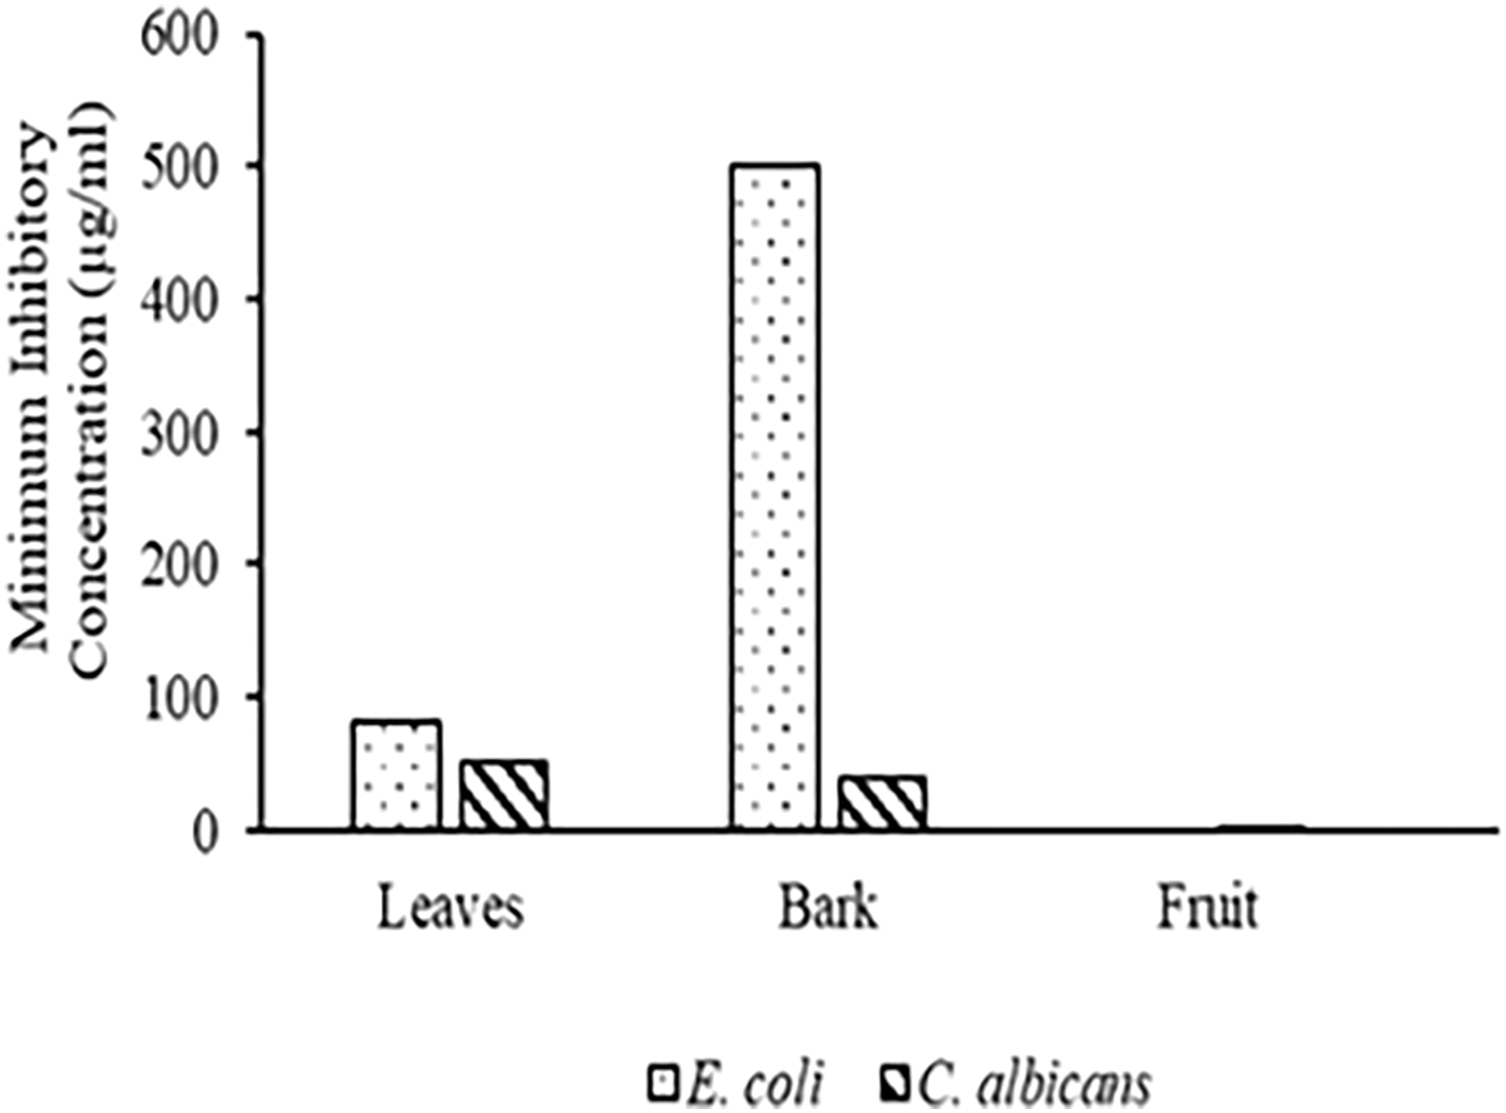
Figure 7: MIC values of methanolic extracts of different plant parts of C. capitata against E. coli (p < 0.05 Leaves vs. Bark) and C. albicans (p < 0.05 Leaves vs. Bark; p < 0.05 Leaves vs. Fruit, p < 0.05 Bark vs. fruit)
It was observed that fruit extracts exhibited significant anti-microbial activity against C. albicans (IC50 = 1.081 µg/mL and MIC = Approx 0.07 µg/mL), followed by bark (IC50 = 368.1 µg/mL and MIC = Approximately 40 µg/mL) and leaf extract (IC50 = 757.3 µg/mL and MIC = Approximately 50 µg/mL).
As per the paper disc diffusion method, none of the extracts demonstrated antibacterial activity against E. coli, whereas in the case of MIC assay, leaves and bark extracts exhibited antibacterial properties against the same. Similarly, the paper disc diffusion assay against C. albicans showed the antimicrobial potential Bark > Leaf > Fruit, whereas MIC results documented it in the order of Fruit > Bark > Leaf. The disparity between disc diffusion and MIC usually occurs because disc diffusion relies on drug diffusion through agar, while MIC tests directly measure concentration in a broth. Variations in diffusion rates, environmental factors, and test conditions can cause discrepancies in the observed antimicrobial activity. When discrepancies are noted, the MIC is generally considered the more accurate measure of the drug’s effectiveness [53].
Supporting evidence from other Cornus species highlights similar trends in antimicrobial activity. For example, studies have shown that Cornus mas extracts displayed no activity against E. coli in disc diffusion assays but exhibited antibacterial effects in MIC assays, aligning with findings in C. capitate [47]. In Cornus officinalis, both disc diffusion and MIC assays demonstrated significant antifungal activity against Candida species, with varying results depending on the method used, echoing the findings seen with C. capitata extracts [50].
These variations underscore the importance of employing multiple testing methods to comprehensively understand plant extracts’ antimicrobial potential.
4 Correlation: Total Phenolic Content vs. Scavenging Percentage of Antioxidants
Fig. 8a and b demonstrates the relationship between total phenolic content and DPPH and SOD scavenging capacities. The computation of correlation coefficients (R2) is typically impacted by the range of parameter values and the quantity of tested samples. For C. capitata, there was a positive and statistically significant linear connection between total phenolic content and antioxidant activity overall. Total phenolic content and SOD had the highest coefficient of determination (R2 = 0.963), followed by total phenolic content and DPPH activity (R2 = 0.919). According to the strong correlations, phenolic chemicals are the main contributors to the C. capitata extracts’ antioxidant properties.
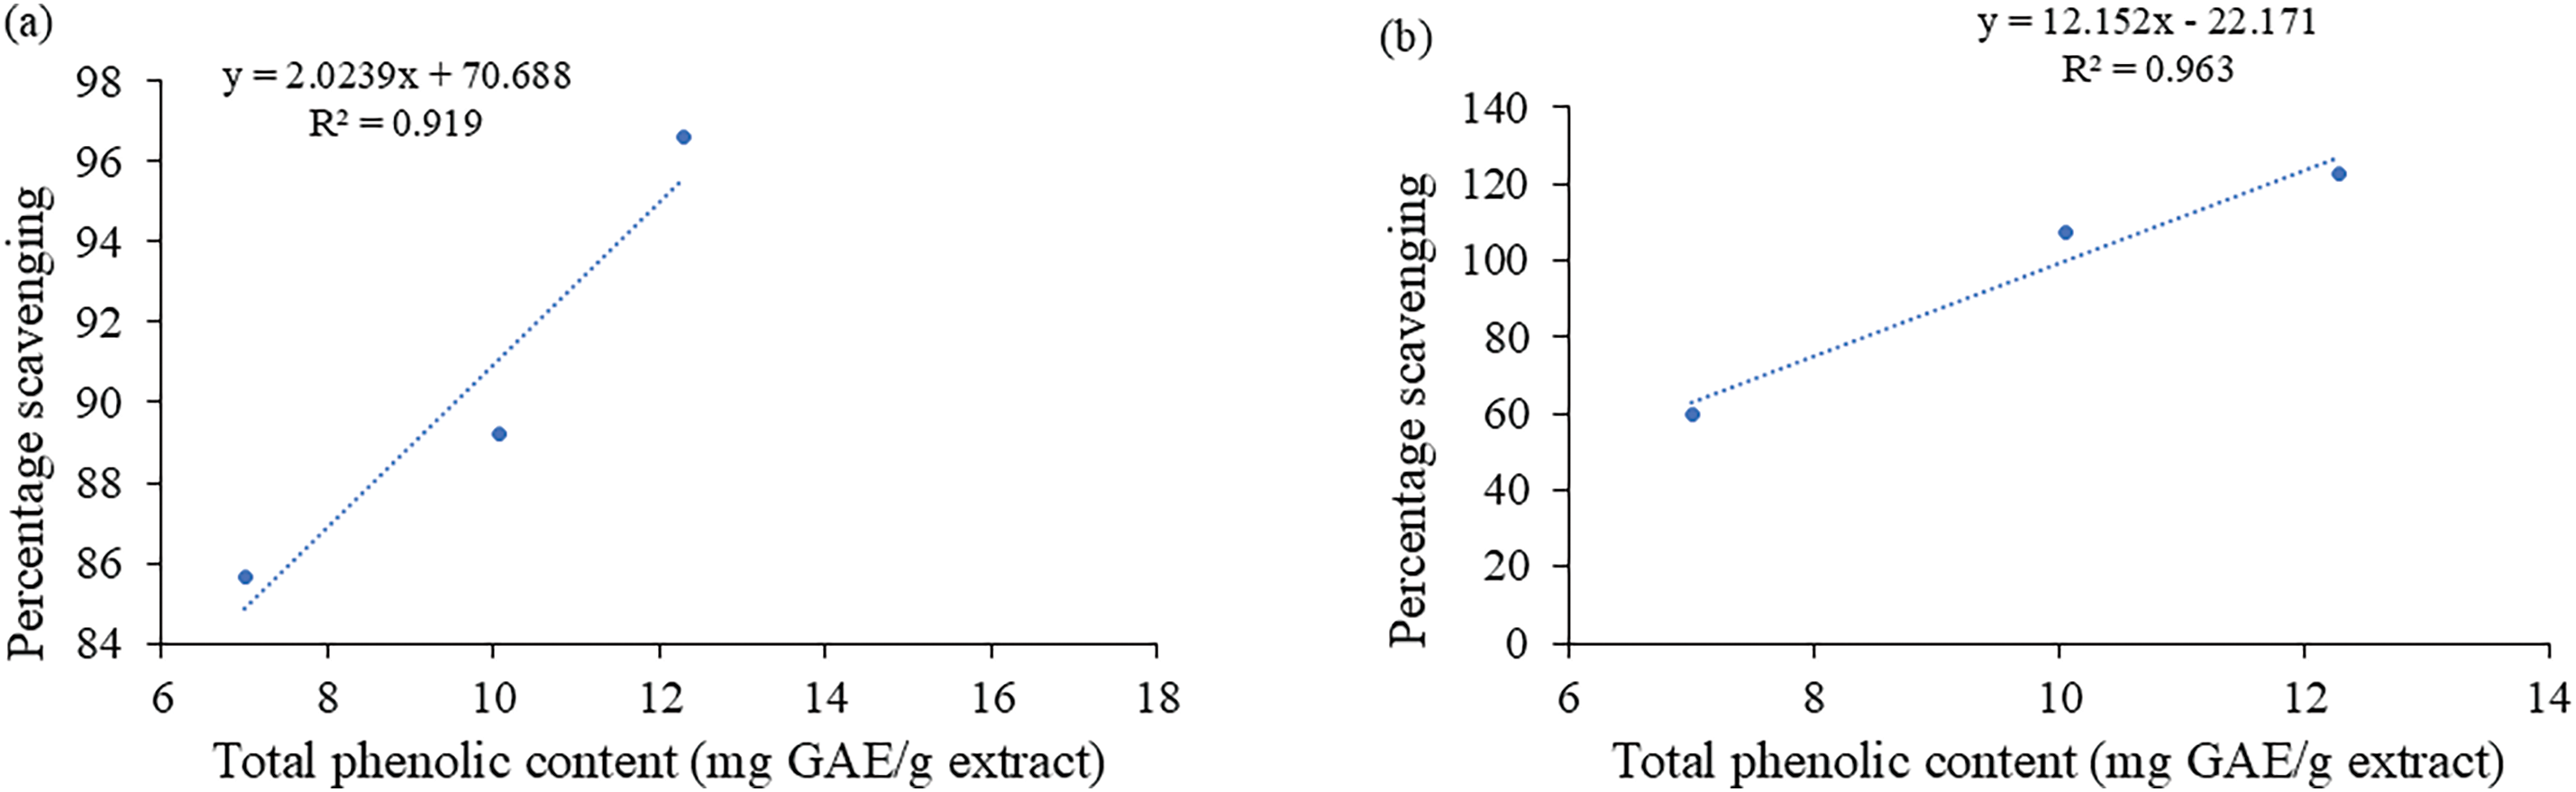
Figure 8: Correlation between total phenolic content and (a) DPPH radical scavenging analysis of the extracts. Coefficient of determination, R2 = 0.919. (b) Superoxide scavenging assay of the extracts. Coefficient of determination, R2 = 0.963
4.1 Correlation: Total Phenolic Content and Total Flavonoid Content vs. Anti-microbial Activity
Fig. 9a and b demonstrates the relationship between total phenolic and flavonoid content vs. anti-microbial activity. A positive and statistically significant linear connection existed between total phenolic content and anti-microbial activity with the coefficient of determination (R2) (R2 = 0.953). However, total flavonoid content and anti-microbial activity exhibited a low correlation with the coefficient of determination (R2 = 0.090). This was in accordance with the quantitative data of flavonoids vs. antimicrobial activity, where a disparity was observed in the flavonoid levels and antimicrobial profiles of the leaf, bark, and fruit samples.
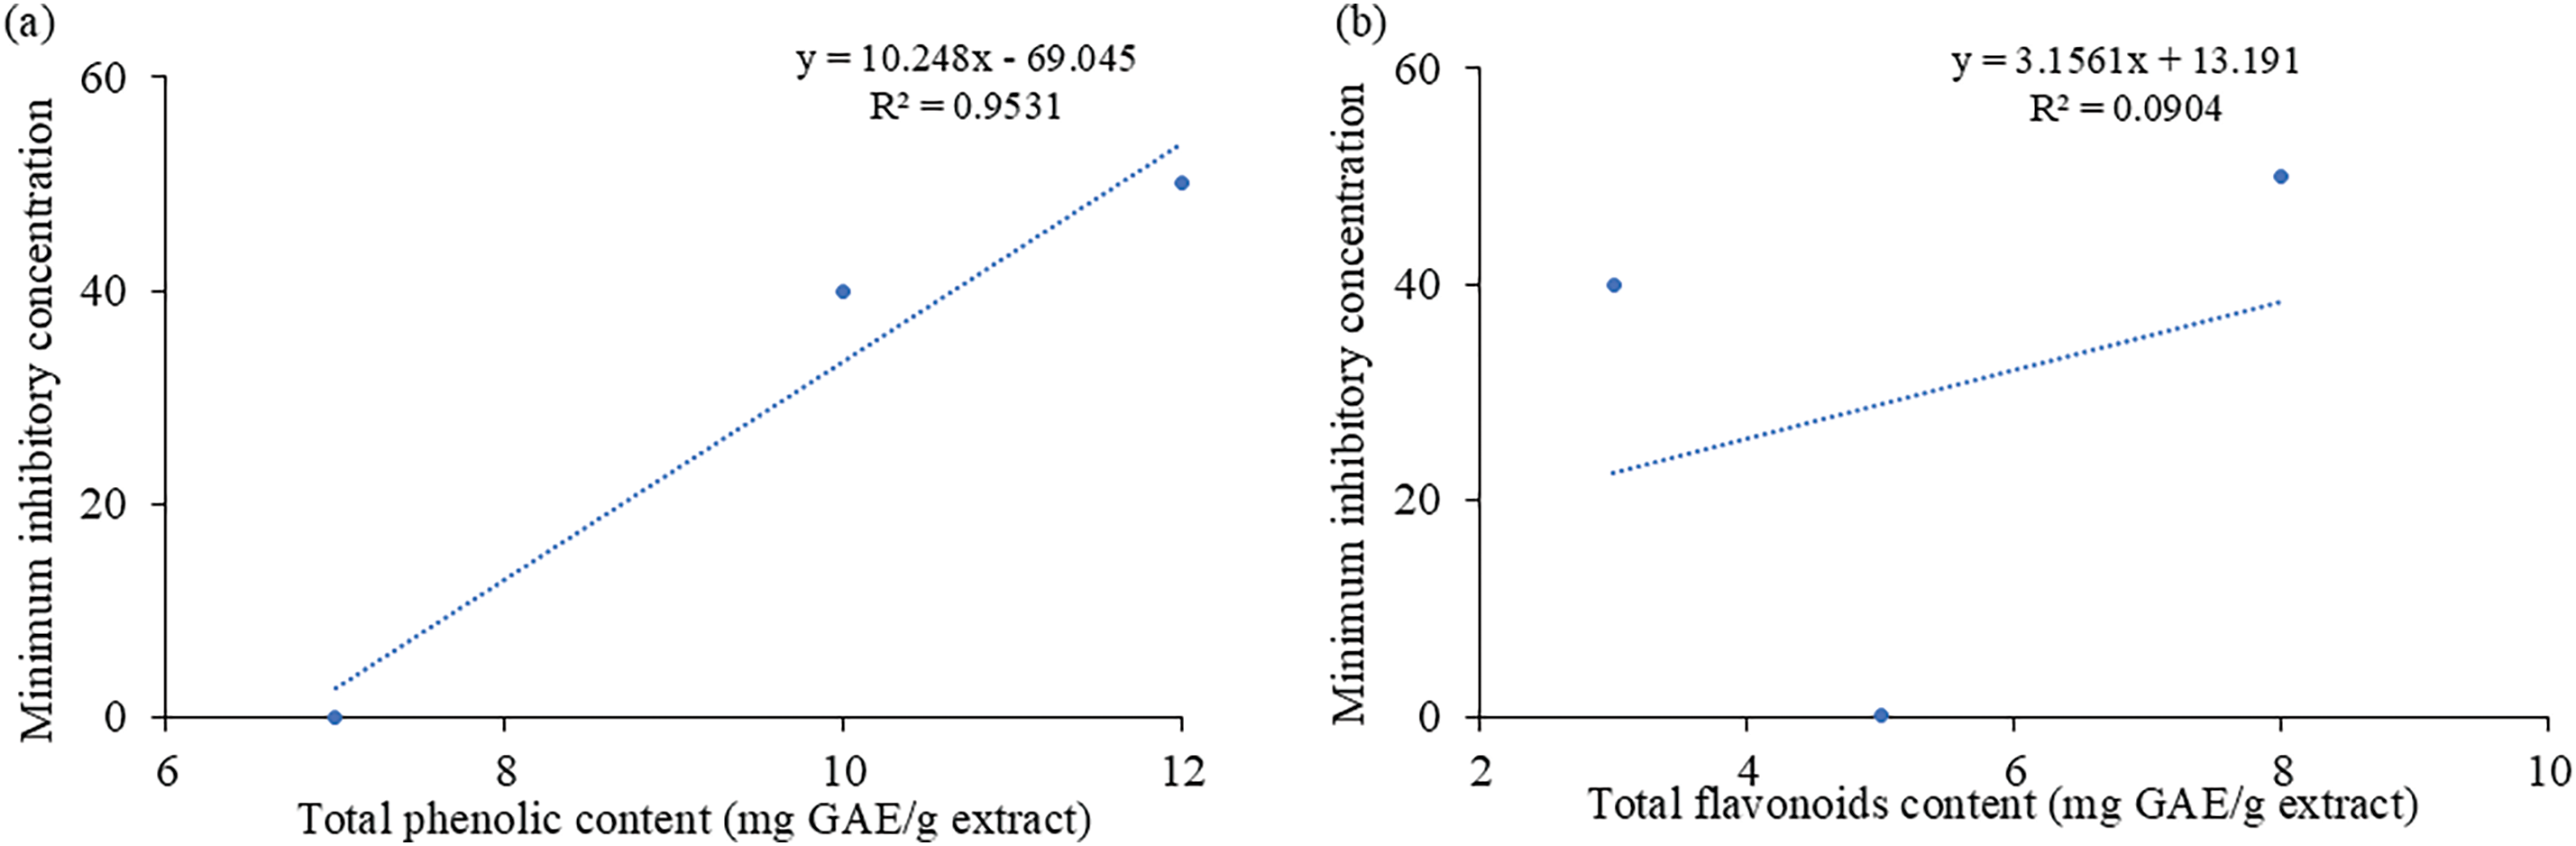
Figure 9: Correlation between Minimal inhibitory concentration and (a) Total phenolic content of the extracts. Coefficient of determination, R2 = 0.9531. (b) Total Flavonoid Content of the extracts. Coefficient of determination, R2 = 0.0904
The therapeutic potential of medicinal plants is attributed mainly to their phytochemical composition and antioxidant properties, which play a crucial role in preventing and treating various diseases. To comprehensively evaluate a plant’s antioxidant capacity, it is essential to analyze the bioactive constituents across different plant parts, such as leaves, bark, roots, fruits, and flowers [53].
The present study examined methanolic extracts from the leaves, bark, and fruits of C. capitata were examined. The leaves were found to have the highest concentrations of phenolic and flavonoid compounds, exhibiting significant free radical scavenging activity. A strong correlation was observed between antioxidant activity and total phenolic content, indicating that C. capitata is a rich source of antioxidants with potential therapeutic applications in combating oxidative stress-related diseases. Furthermore, polyphenols in C. capitata demonstrated potent inhibitory activity against α-glucosidase and α-amylase, with α-glucosidase inhibition being more pronounced. All extracts also inhibited pancreatic lipase, suggesting C. capitata’s potential in obesity management. Additionally, antimicrobial activity was observed, with leaf and bark extracts exhibiting antibacterial effects against E. coli and antifungal activity against C. albicans. This study provides a comprehensive assessment of the antioxidant, antidiabetic, and antimicrobial properties of C. capitata, representing a novel contribution to the literature. Our upcoming research aims to examine the effects of extracts on the modulation of cytokines involved in inflammation which contribute to the development of oxidative illnesses.
Acknowledgement: The authors are thankful to the University Grants Commission, New Delhi, for financial support in the form of a fellowship. The authors thank the Department of Biochemistry, H.N.B. Garhwal University (A Central University), Srinagar (Garhwal), Uttarakhand, for providing research facilities.
Funding Statement: The authors received no specific funding for this study.
Author Contributions: Methodology, Writing–Original Draft Preparation: Deen Bandhu Dimri; Supervision & Conceptualization, Visualization, Validation, Review & Editing: Manisha Nigam; Data analysis: Naresh Singh and Shilpa Semwal; Visualization, Validation, Review & Editing: Abhay Prakash Mishra and Marcello Iriti. All authors reviewed the results and approved the final version of the manuscript.
Availability of Data and Materials: The data supporting the present findings are contained within the manuscript.
Ethics Approval: Not applicable.
Conflicts of Interest: The authors declare no conflicts of interest to report regarding the present study.
References
1. Kaewpiboon C, Lirdprapamongkol K, Srisomsap C, Winayanuwattikun P, Yongvanich T, Puwaprisirisan P, et al. Studies of the in vitro cytotoxic, antioxidant, lipase inhibitory and antimicrobial activities of selected Thai medicinal plants. BMC Complement Altern Med. 2012;12(1):1–8. doi:10.1186/1472-6882-12-217. [Google Scholar] [PubMed] [CrossRef]
2. Cai Y, Luo Q, Sun M, Corke H. Antioxidant activity and phenolic compounds of 112 traditional Chinese medicinal plants associated with anticancer. Life Sci. 2004;74(17):2157–84. doi:10.1016/j.lfs.2003.09.047. [Google Scholar] [PubMed] [CrossRef]
3. Losada-Barreiro S, Bravo-Diaz C. Free radicals and polyphenols: the redox chemistry of neurodegenerative diseases. Eur J Med Chem. 2017;133(suppl):379–402. doi:10.1016/j.ejmech.2017.03.061. [Google Scholar] [PubMed] [CrossRef]
4. Zhang Y, Cai P, Cheng G, Zhang Y. A brief review of phenolic compounds identified from plants: their extraction, analysis, and biological activity. Nat Prod Commun. 2022;17(1):1934578X211069721. doi:10.1177/1934578X211069721. [Google Scholar] [CrossRef]
5. Kumaran A, Karunakaran RJ. In vitro antioxidant activities of methanol extracts of five Phyllanthus species from India. LWT-Food Sci Technol. 2007;40(2):344–52. doi:10.1016/j.lwt.2005.09.011. [Google Scholar] [CrossRef]
6. EL-Kamali HH, EL-Amir MY. Antibacterial activity and phytochemical screening of ethanolic extracts obtained from selected Sudanese medicinal plants. Curr Res J Biol Sci. 2010;2(2):143–6. [Google Scholar]
7. Heinrich M, Mah J, Amirkia V. Alkaloids used as medicines: structural phytochemistry meets biodiversity—an update and forward look. Molecules. 2021;26(7):1–18. doi:10.3390/molecules26071836. [Google Scholar] [PubMed] [CrossRef]
8. Mahato SB, Kundu AP. 13C NMR Spectra of pentacyclic triterpenoids—a compilation and some salient features. Phytochemistry. 1994;37(6):1517–75. doi:10.1016/S0031-9422(00)89569-2. [Google Scholar] [CrossRef]
9. Chung KT, Wong TY, Wei CI, Huang YW, Lin Y. Tannins and human health: a review. Crit Rev Food Sci Nutr. 1998;38(6):421–64. doi:10.1080/10408699891274273. [Google Scholar] [PubMed] [CrossRef]
10. Newman DJ, Cragg GM, Snader KM. Natural products as sources of new drugs over the period 1981–2002. J Nat Prod. 2003;66(7):1022–37. doi:10.1021/np030096l. [Google Scholar] [PubMed] [CrossRef]
11. Sparg SG, Light ME, Van Staden J. Biological activities and distribution of plant saponins. J Ethnopharmacol. 2004;94(2–3):219–43. doi:10.1016/j.jep.2004.05.016. [Google Scholar] [PubMed] [CrossRef]
12. Middleton E Jr, Kandaswami C, Theoharides TC. The effects of plant flavonoids on mammalian cells: implications for inflammation, heart disease, and cancer. Pharmacol Rev. 2000;52(4):673–751. doi:10.1016/S0031-6997(24)01472-8. [Google Scholar] [CrossRef]
13. Kukić J, Popović V, Petrović S, Mucaji P, Ćirić A, Stojković D, et al. Antioxidant and antimicrobial activity of Cynara cardunculus extracts. Food Chem. 2008;107(2):861–8. doi:10.1016/j.foodchem.2007.09.005. [Google Scholar] [CrossRef]
14. Suffredini IB, de Silva JS, Frana SA, Pinto KC, Bento KCD, Rudiger EC, et al. Screening Amazon rainforest plant extracts for antimicrobial activity: a 15-year commitment to the Brazilian biodiversity. Front Antibiot. 2023;2:1–16. doi:10.3389/frabi.2023.1122400. [Google Scholar] [PubMed] [CrossRef]
15. Wasihun Y, Alekaw Habteweld H, Dires Ayenew K. Antibacterial activity and phytochemical components of leaf extract of Calpurnia aurea. Sci Rep. 2023;13(1):1–7. doi:10.1038/s41598-023-36837-3. [Google Scholar] [PubMed] [CrossRef]
16. Pratap CR, Vysakhi MV, Manju S, Kannan M, Abdul KS, Sreekumaran NA. In vitro free radical scavenging activity of aqueous and methanolic leaf extracts of Aegle tamilnadensis (Rutaceae). Int J Pharm Sci. 2013;3:819–23. [Google Scholar]
17. Poovitha S, Parani M. In vitro and In vivo α-amylase and α-glucosidase inhibiting activities of the protein extracts from two varieties of bitter gourd (Momordica charantia L.). BMC Complement Altern Med. 2016;16(S1):1–8. doi:10.1186/s12906-016-1085-1. [Google Scholar] [PubMed] [CrossRef]
18. Rahman MM, Islam MR, Shohag S, Hossain ME, Rahaman MS, Islam F, et al. The multifunctional role of herbal products in the management of diabetes and obesity: a comprehensive review. Molecules. 2022;27(5). doi:10.3390/molecules27051713. [Google Scholar] [PubMed] [CrossRef]
19. Powers SK, Smuder AJ, Judge AR. Oxidative stress and disuse muscle atrophy: cause or consequence? Curr Opin Clin Nutr Metab Care. 2012;15(3):240–5. doi:10.1097/MCO.0b013e328352b4c2. [Google Scholar] [PubMed] [CrossRef]
20. Hosseinpour-Jaghdani F, Shomali T, Gholipour-Shahraki S, Rahimi-Madiseh M, Rafieian-Kopaei M. Cornus mas: a review on traditional uses and pharmacological properties. J Complement Integr Med. 2017;14(3). doi:10.1515/jcim-2016-0137. [Google Scholar] [PubMed] [CrossRef]
21. Yue X, Li X, Chen X, Ashraf MA, Liu Z, Bi H, et al. Molecules and functions of Cornus officinalis bark volatiles. Emirates J Food Agric. 2018;30(10):828–38. doi:10.9755/ejfa.2018.v30.i10.1836. [Google Scholar] [CrossRef]
22. Deng W, Liu Y, Guo Y, Chen J, Abdu HI, Khan MRU, et al. A comprehensive review of Cornus officinalis: health benefits, phytochemistry, and pharmacological effects for functional drug and food development. Front Nutr. 2024;10:1309963. doi:10.3389/fnut.2023.1309963. [Google Scholar] [PubMed] [CrossRef]
23. Czerwinska ME, Melzig MF. Cornus mas and cornus officinalis-analogies and differences of two medicinal plants traditionally used. Front Pharmacol. 2018;9:1–28. doi:10.3389/fphar.2018.00894. [Google Scholar] [PubMed] [CrossRef]
24. Gusain A, Singh N. In vitro antioxidant and bioactive component analysis of Himalayan Spice Faran (Allium Stracheyi). J Mt Res. 2023;18:157–66. doi:10.51220/jmr.v18i1.16. [Google Scholar] [CrossRef]
25. Sen S, De B, Devanna N, Chakraborty R. Total phenolic, total flavonoid content, and antioxidant capacity of the leaves of Meyna spinosa Roxb., an Indian medicinal plant. Chin J Nat Med. 2013;11(2):149–57. doi:10.1016/S1875-5364(13)60042-4. [Google Scholar] [PubMed] [CrossRef]
26. Hajlaoui H, Arraouadi S, Mighri H, Ghannay S, Aouadi K, Adnan M, et al. HPLC-MS profiling, antioxidant, antimicrobial, antidiabetic, and cytotoxicity activities of Arthrocnemum indicum (Willd.) Moq. extracts. Plants. 2022;11(2):232. doi:10.3390/plants11020232. [Google Scholar] [PubMed] [CrossRef]
27. Ielciu I, Sevastre B, Olah NK, Turdean A, Chişe E, Marica R, et al. Evaluation of hepatoprotective activity and oxidative stress reduction of Rosmarinus officinalis L. shoots tincture in rats with experimentally induced hepatotoxicity. Molecules. 2021;26(6):1737. doi:10.3390/molecules26061737. [Google Scholar] [PubMed] [CrossRef]
28. Telagari M, Hullatti K. In-vitro α-amylase and α-glucosidase inhibitory activity of Adiantum caudatum Linn. and Celosia argentea Linn. extracts and fractions. Indian J Pharmacol. 2015;47(4):425–9. doi:10.4103/0253-7613.161270. [Google Scholar] [PubMed] [CrossRef]
29. Lewis DR, Liu DJ. Direct measurement of lipase inhibition by orlistat using a dissolution linked in vitro assay. Clin Pharmacol Biopharm. 2012;1:1000103. doi:10.4172/2167-065X.1000103. [Google Scholar] [PubMed] [CrossRef]
30. Hudzicki J. Kirby-bauer disk diffusion susceptibility test protocol. Am Soc Microbiol. 2009;1–13 [cited 2025 Jan 17]. Available from: https://www.asm.org/Protocols/Kirby-Bauer-Disk-Diffusion-Susceptibility-Test-Pro. [Google Scholar]
31. Wiegand I, Hilpert K, Hancock REW. Agar and broth dilution methods to determine the minimal inhibitory concentration (MIC) of antimicrobial substances. Nat Protoc. 2008;3(2):163–75. doi:10.1038/nprot.2007.521. [Google Scholar] [PubMed] [CrossRef]
32. Wang Z, Li W, Li W, Song W, Liu W. The iridoid glycosides, flavonoids, and triterpenoids in Cornus officinalis and their biological activities. J Ethnopharmacol. 2018;224:51–60. [Google Scholar]
33. Dinda B, Kyriakopoulos AM, Dinda S, Zoumpourlis V, Thomaidis NS, Velegraki A, et al. Cornus mas L. (cornelian cherryan important European and Asian traditional food and medicine: ethnomedicine, phytochemistry and pharmacology for its commercial utilization in drug industry. J Ethnopharmacol. 2016;193:670–90. doi:10.1016/j.jep.2016.09.042. [Google Scholar] [PubMed] [CrossRef]
34. Zhang Q, Su YQ, Yang FX, Peng JN, Li XH, Sun RC. Antioxidative activity of water extracts from leaf, male flower, raw cortex and fruit of Eucommia ulmoides Oliv. For Prod J. 2007;57(12):74–9. doi:10.1109/access.2021.3060317. [Google Scholar] [CrossRef]
35. Barreira JCM, Ferreira ICFR, Oliveira MBPP, Pereira JA. Antioxidant activities of the extracts from chestnut flower, leaf, skins and fruit. Food Chem. 2008;107(3):1106–13. doi:10.1016/j.foodchem.2007.09.030. [Google Scholar] [CrossRef]
36. Jiang X, Wang M, Huang F. Comparative study on phenolic content and antioxidant activity of leaves and fruits of Cornus officinalis. Ind Crops Prod. 2014:211–7. doi:10.3390/antiox9121297. [Google Scholar] [PubMed] [CrossRef]
37. Milenković-Anđelković AS, Anđelković MZ, Radovanović AN, Radovanović BC, Nikolić V. Phenol composition, DPPH radical scavenging and antimicrobial activity of Cornelian cherry (Cornus mas) fruit and leaf extracts. Hem Ind. 2015;69(4):331–7. doi:10.2298/HEMIND140216046M. [Google Scholar] [CrossRef]
38. Tural S, Koca I. Physico-chemical and antioxidant properties of cornelian cherry fruits (Cornus mas L.) grown in Turkey. Sci Hortic. 2008;116(4):362–6. doi:10.1016/j.scienta.2008.02.003. [Google Scholar] [CrossRef]
39. Zhou H, Liao Y, Xu J. Comparative study of flavonoid content and antioxidant activity of leaves and fruits of Cornus officinalis. J Med Plants Res. 2009;3(8):548–52. [Google Scholar]
40. Gidamo GH. Antioxidant activity and mineral content of Impatiens tinctoria A. Rich (Ensosila) tuber, an Ethiopian medicinal plant. Sci Rep. 2023;13(1):14998. doi:10.1038/s41598-023-41824-9. [Google Scholar] [PubMed] [CrossRef]
41. Salar RK, Sharma P, Purewal SS. In vitro antioxidant and free radical scavenging activities of stem extract of Euphorbia trigona Miller. CellMed. 2015;5(2):11–4. doi:10.5667/tang.2015.0004. [Google Scholar] [CrossRef]
42. Pawlowska AM, De Leo M, Braca A. Phenolics of Cornus mas fruits: antioxidant and anti-inflammatory activities. J Agric Food Chem. 2010;58(8):3994–9. [Google Scholar]
43. Wang Z, Kou X, Yang J. Phytochemical composition and antioxidant capacity of different parts of Cornus officinalis. Food Chem. 2013;138(4):2256–62. [Google Scholar]
44. Dastjerdi ZM, Namjoyan F, Azemi ME. Alpha amylase inhibition activity of some plants extract of Teucrium species. Eur J Biol Sci. 2015;7(1):26–31. doi:10.3797/scipharm.aut-04-03. [Google Scholar] [CrossRef]
45. Bhatia A, Singh B, Arora R, Arora S. In vitro evaluation of the α-glucosidase inhibitory potential of methanolic extracts of traditionally used antidiabetic plants. BMC Complement Altern Med. 2019;19:1–9. doi:10.1186/s12906-019-2482-z. [Google Scholar] [PubMed] [CrossRef]
46. Bahadoran Z, Mirmiran P, Azizi F. Dietary polyphenols as potential nutraceuticals in management of diabetes: a review. J Diabetes Metab Disord. 2013;12(1):43. doi:10.1186/2251-6581-12-43. [Google Scholar] [PubMed] [CrossRef]
47. Pérez-García E, Ruiz-Rodríguez BM, Fernández-Ruiz V. Antioxidant and α-glucosidase inhibitory activity of extracts from Cornus mas fruits. Food Chem. 2016;197:865–72. [Google Scholar]
48. Kashtoh H, Baek KH. Recent updates on phytoconstituent alpha-glucosidase inhibitors: an approach towards the treatment of type two diabetes. Plants. 2022;11(20). doi:10.3390/plants11202722. [Google Scholar] [PubMed] [CrossRef]
49. Filippatos TD, Derdemezis CS, Gazi IF, Nakou ES, Mikhailidis DP, Elisaf MS. Orlistat-associated adverse effects and drug interactions: a critical review. Drug Saf. 2008;31:53–65. doi:10.2165/00002018-200831010-00005. [Google Scholar] [PubMed] [CrossRef]
50. Jiang Z, Yang F, Liu L. A review on the medicinal properties of Cornus officinalis. J Ethnopharmacol. 2017;203:162–75. [Google Scholar]
51. Mukherjee PK. Quality control and evaluation of herbal drugs: evaluating natural products and traditional medicine. Elsevier; 2019. doi:10.1016/C2016-0-04232-8. [Google Scholar] [CrossRef]
52. Londonkar R. Potential antibacterial and antifungal activity of Achyranthes aspera L. Recent Res Sci Technol. 2011;3(4). [Google Scholar]
53. Dong X, Deng P, Wang X, Peng C, Peng L. Structural characteristics and immunomodulatory effects of polysaccharides extracted from plant seeds: a review. Trends Food Sci Technol. 2024;153:104747. doi:10.1016/j.tifs.2024.104747. [Google Scholar] [CrossRef]
Cite This Article
 Copyright © 2025 The Author(s). Published by Tech Science Press.
This work is licensed under a Creative Commons Attribution 4.0 International License , which permits unrestricted use, distribution, and reproduction in any medium, provided the original work is properly cited.
 Downloads
 Citation Tools