
 Submit a Paper
 Propose a Special lssue
 Open Access
ARTICLE

Morpho-Physiological Indices for Identification of Heat Tolerant Wheat Genotypes (Triticum aestivum L.) at Seedling Stage
Department of Genetics and Plant Breeding, Department of Crop Botany, Gazipur Agricultural University, Gazipur, 1706, Bangladesh
* Corresponding Author: A. K. M. Aminul Islam. Email:
(This article belongs to the Special Issue: Plant Responses to Biological and Abiotic Stresses)
Phyton-International Journal of Experimental Botany 2025, 94(5), 1545-1563. https://doi.org/10.32604/phyton.2025.063916
Received 28 January 2025; Accepted 06 May 2025; Issue published 29 May 2025
 View Full Text
 Download PDF
Abstract
Morpho-physiological evaluation of a crop’s genetic resources is necessary to find possible genotypes to include in breeding initiatives. The objective of this study was to identify heat-tolerant wheat genotypes among36 mutant lines using morpho-physiological indices. Seedlings of mutant lines and check varieties were grown under both normal (control) and heat-stress conditions in growth chambers. Data were recorded on root-shoot parameters (length, fresh weight, dry weight, and ratio), relative water content (RWC), stability of cell membrane, pigment content, and chlorophyll fluorescence. Two-way analysis of variance showed significant (p < 0.01, p < 0.001) variation among15 morpho-physiological features in both growing conditions. Correlation studies showed that pigment-specific indices (total chl, chl a, chl b, carotenoid, Fv/Fm—chlorophyll fluorescence) had significant positive correlations with root-shoot fresh weight (RFW, SFW) and root-shoot dry weight (RDW, SDW), and negative association with relative water content, stability of cell membrane at both conditions. Hierarchical cluster analysis revealed three primary clusters where cluster III (18 genotypes) showed minimal changes in studied characters than cluster I (11 genotypes) and cluster II (13 genotypes). Results obtained from this study revealed that the identified heat-sensitive (30-2 SSH) and heat-tolerant genotypes (27-2(4), 29-2(2), and 30-2 SSH) of wheat might provide useful breeding materials for enhancing wheat yield even more in this period of uncertain climate change.Keywords
Wheat (Triticum aestivum L.) is a staple food crop that makes a significant contribution to food and nutrition security for the global population [1]. Wheat production is increasingly threatened by rising global temperatures brought on by climate change, especially at critical growth stages like anthesis and grain filling when heat stress is present. High temperatures during these periods can disrupt photosynthesis, reduce grain number and size, and impair overall yield quality. Studies have indicated that wheat yield could decline by up to 8% for every 1°C increase in temperatures above optimal level [2]. Heat stress can alter the morpho-physiological mechanisms of plants. Crucial indicators of heat tolerance in wheat are relative turgidity, cell membrane stability, canopy temperature depression, and chlorophyll retention [3].
Under stressful conditions, for instance, genotypes with lower canopy temperatures frequently exhibit better heat avoidance mechanisms and higher yields [4]. Similarly, the stay-green trait has emerged as an essential component in breeding programs due to its association with prolonged photosynthetic activity under stress [5]. Wheat cultivars with similar morphological characteristics have demonstrated varying tolerance for post-anthesis high-temperature stress. When constructing selection criteria for heat tolerance, the interaction between morpho-physiological features relevant to heat tolerance is crucial to consider [6]. However, to identify more distinct parents for a crossing program and better recombinants that possess greater terminal heat tolerance, it will be helpful to analyze diversity based on morpho-physiological features [7].
Finding genetically superior parents is a crucial prerequisite for the improvement of promising wheat genotypes through the transfer of targeted genes controlling desired traits in the offspring. For this reason, a breeder estimates genetic parameters such as heritability and genetic advancement to comprehend the extent of transmission ability of the traits and their interactions with the environmental variation [8]. Heat tolerance should be a crucial trait in wheat since the average global temperature is predicted to rise by 1.5°C over the next 20 years [9]. According to recent scientific analyses by the Goddard Institute for Space Studies (GISS), the average global temperature rose by 1.04°C between 1880 to 2019 [10,11]. This increased temperature causes heat stress that generates major changes in the growth and developmental stages of wheat, leading to the decline of grain quality and yield of wheat [12]. The chlorophyll content of the plant reduces, relative water content decreases [13] and organelles membrane is destroyed under heat stress. All these physiological traits significantly affect wheat productivity under stress conditions.
Therefore, heat stress has been given topmost research importance in major wheat-growing areas, especially in subtropical countries. To mitigate heat stress impacts, it is important to screen out tolerant genotypes based on morpho-physiological indices [14,15]. The present investigation was focused on the identification of heat-tolerant genotypes of wheat genotypes based on the morpho-physiological characters. Plant breeders may be able to exploit genetic variation for stress tolerance to develop tolerant cultivars by selecting desirable genotypes in stress environments [3,16]. Finding appropriate selection criteria to identify genotypes that are tolerant to heat is therefore a significant issue for plant breeders. In a heat-stressed environment, a genotype that can sustain turgid leaves would have physiological benefits including improved degree of stomatal opening and complexes protect photosystem. High temperature is the main source of stress for the photosynthetic process. Several studies have reported a reduction in photosynthesis due to disruptions in the structure and function of chloroplasts and a decrease in chlorophyll content [17–20]. Wheat genotypes with certain morpho-physiological traits may be more tolerant to heat stress than other genotypes. This research uses diverse mutant wheat genotypes developed from four popular wheat varieties (BARI Gom27, BARI Gom28, BARI Gom29, BARI Gom30) of Bangladesh to evaluate their heat tolerance potentiality. Additionally, high-yielding parallel with heat-tolerant wheat genotypes will be developed for the farmers to increase productivity under a stress environment. The present study intends to identify heat-tolerant mutant lines of wheat based on morpho-physiological traits at the seedling stage and give an overview of these traits that underlie heat tolerance.
2.1 Location and Period of Experiment
The present study was carried out in the Plant Physiology Laboratory and Seed Science and Technology Laboratory of Bangabandhu Sheikh Mujibur Rahman Agricultural University to identify heat-tolerant wheat genotypes from 36 mutant lines. The research experiment was conducted from July 2022 to November 2022.
2.1.1 Experimental Materials and their Sources
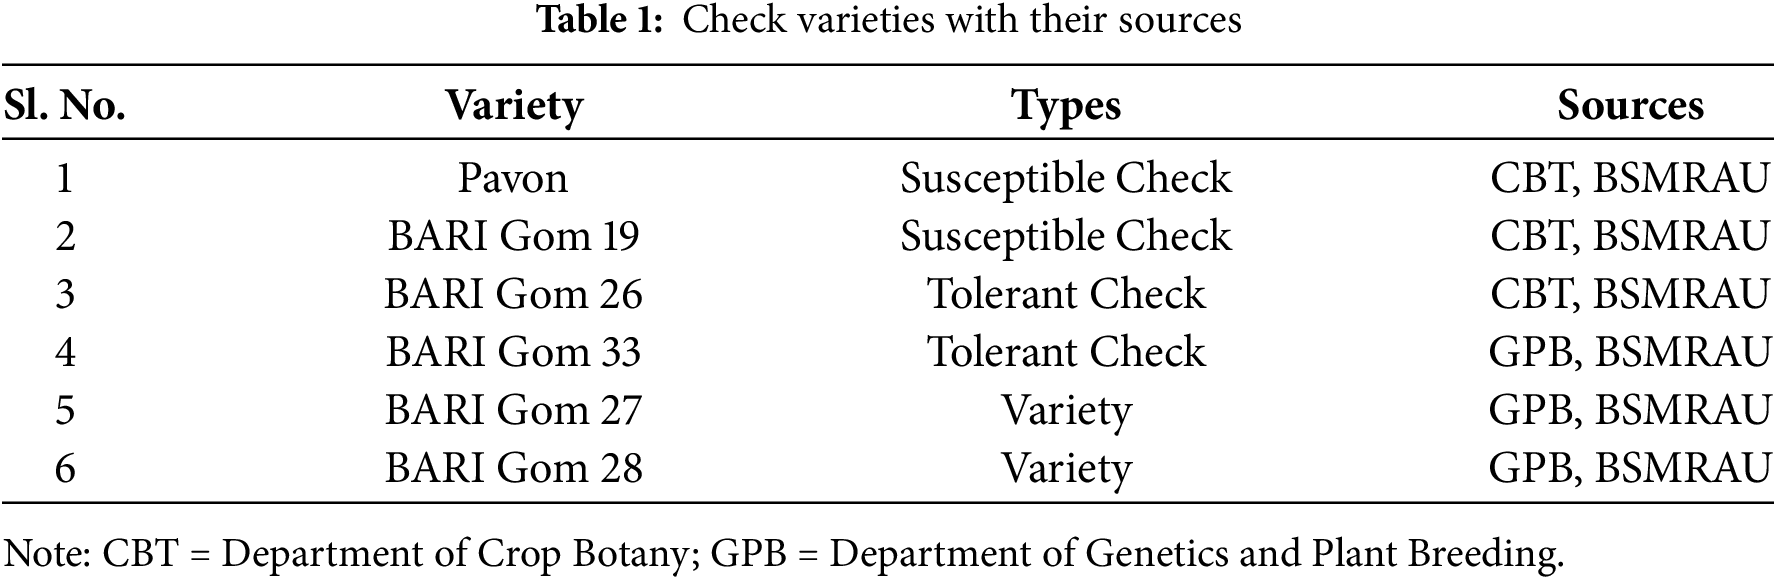
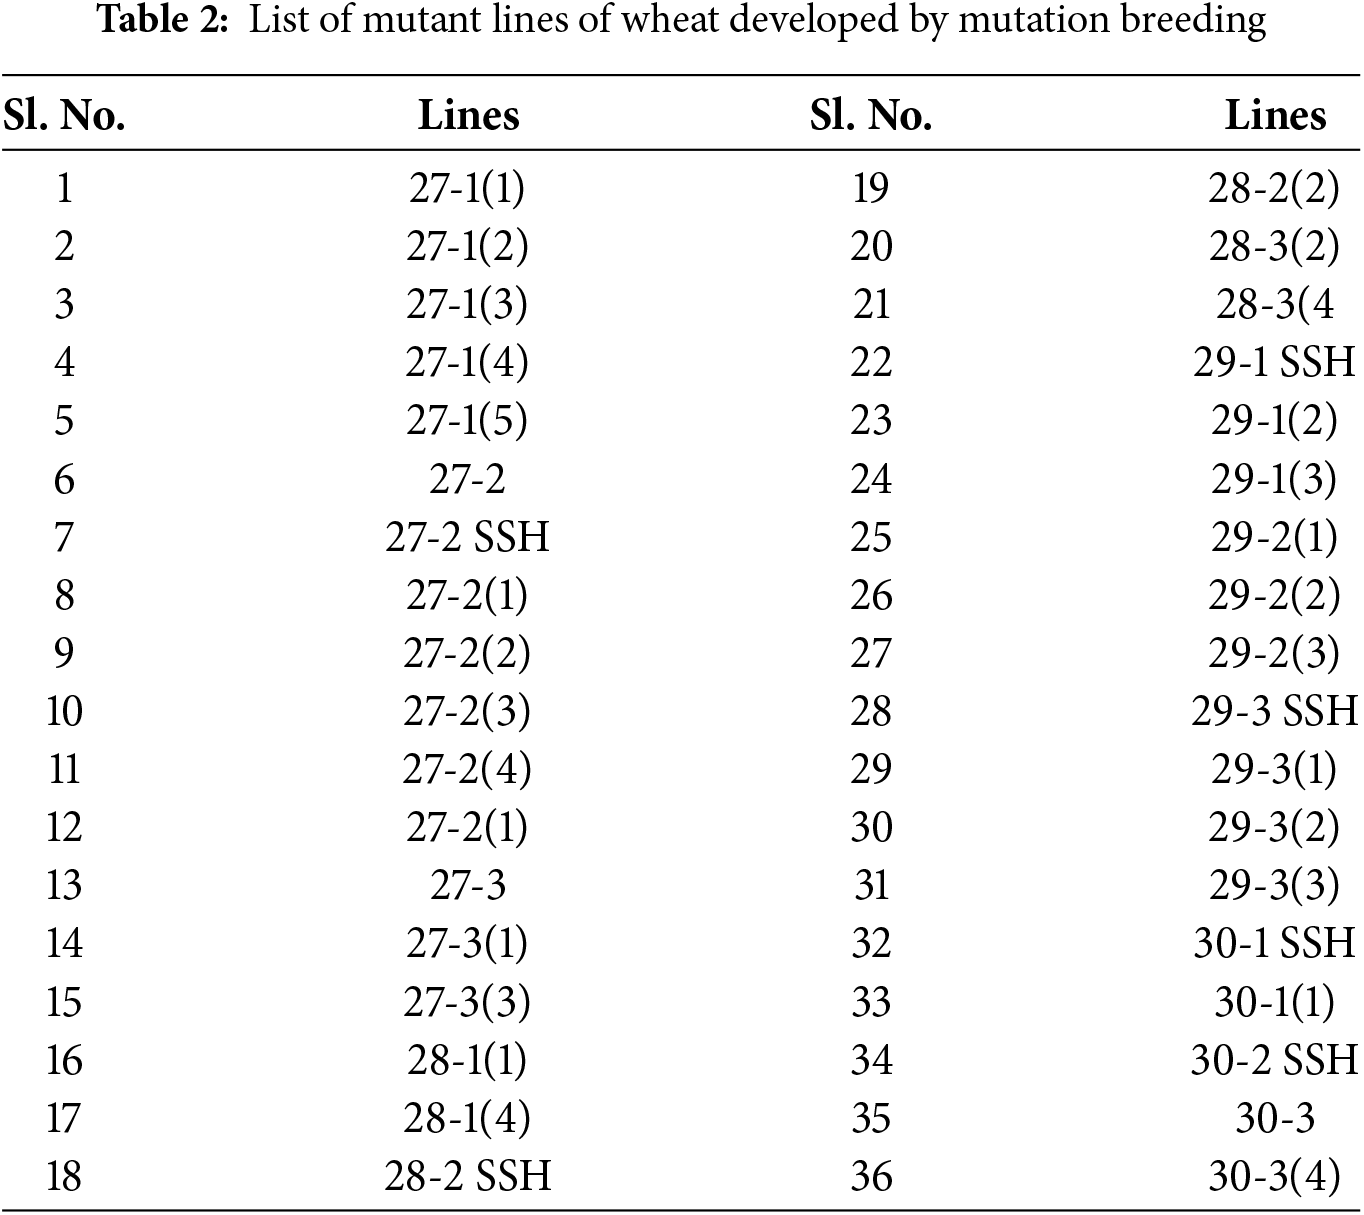
Thirty-six mutants developed by mutation breeding along with two varieties, two tolerant checks (BARI Gom 26 and BARI Gom 33), and two susceptible checks (BARI Gom 19 and Pavon) were used for screening (Tables 1, 2). Uniform-size seeds of 42 wheat genotypes were used for screening both under heat stress and controlled conditions.
2.1.2 Heat Treatment in Growth Chamber
Seed surfaces were first sterilized with 70% ethanol and repeatedly washed with sterile distilled water. The seeds were then soaked in distilled water for 10 min and placed into sterile sand moistened with distilled water in the petri dishes (Dia: 15 cm) to enhance seed germination. The seeds were then stored in the lab for three days at a variable temperature between 26°C and 32°C (Plate 1). The seedlings were transferred to the growth chamber having day night temperature of 25 ± 1°C with a relative humidity of 75%–80% with 16-h photoperiod and 200 µmol photon m−2s−1 light intensity, or around 1/10th full light intensity.
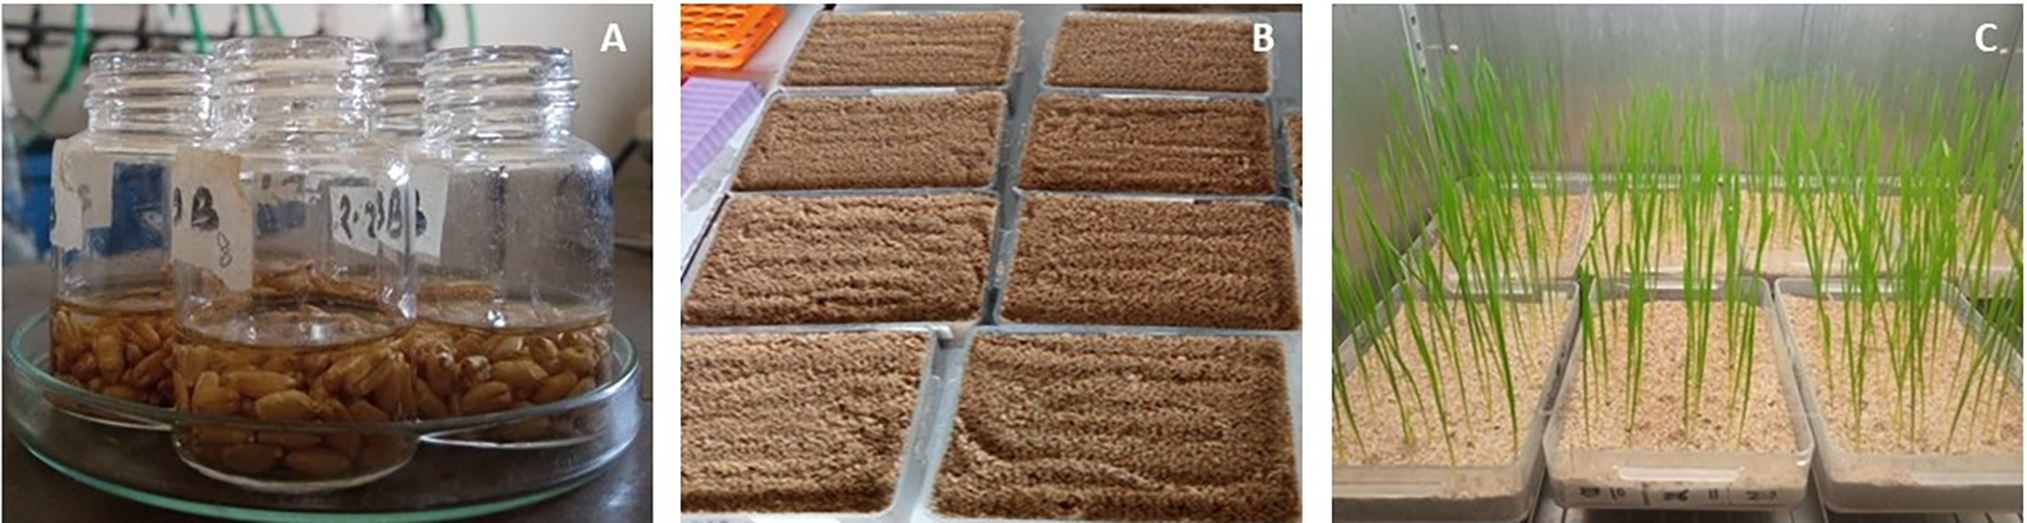
Plate 1: Germination of wheat seeds (A) Preparation of wheat seeds for sowing (B) Petri plates after sowing wheat seeds (C) Wheat seedlings at growth chamber
The seedlings were kept in two separate growth chambers, one having a controlled environment with a constant temperature of 25 ± 1°C and another having a heat stress environment [21] with a constant temperature of 35 ± 1°C (for two days before data recording). In both chambers, the relative humidity (RH) is 75%–80% with a 16-hour photoperiod, and a light intensity of 200 µmol photon m−2s−1 for 48 h after four days (Plate 2). The temperature and relative humidity were determined by using a digital humidity and temperature meter (Model: HD-306, HTC Instruments, Taipei, Taiwan). Half-strength Hogland’s nutrient solution was used to irrigate the seedling’s petri plates.
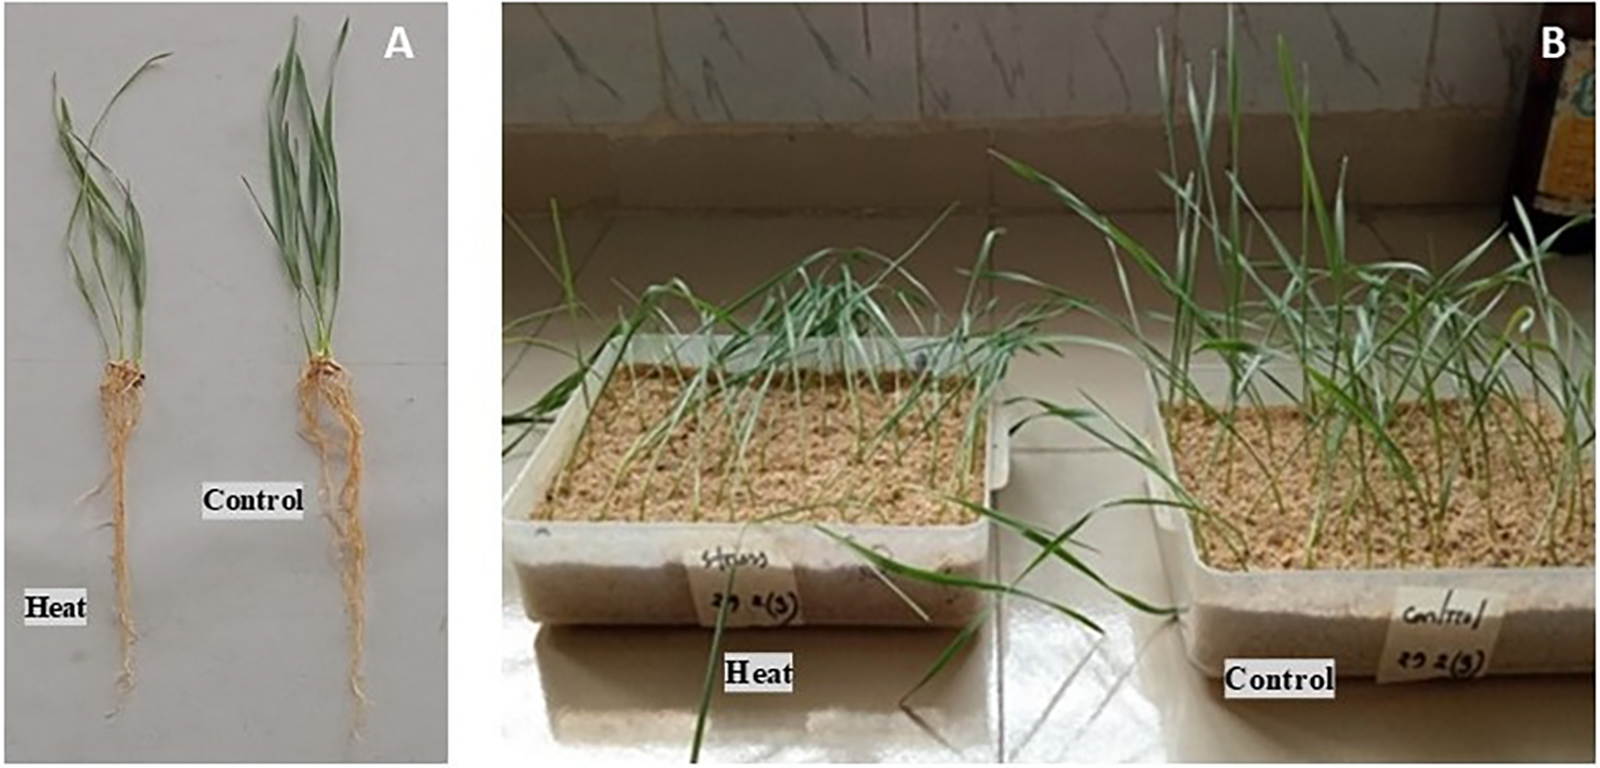
Plate 2: Wheat seedlings at control and heat stressed conditions; (A) Uprooted wheat seedlings (B) Wheat seedlings after termination of heat stress
2.2.1 Estimation of Morphological Traits
Data were recorded on root length, shoot length, root fresh weight, and shoot fresh weight from seedlings of both sets (controlled and heat stress). Measurements of root length and shoot length were taken from the tip of the longest leaf and root, respectively, to the shoot-root junction. To determine the fresh biomass of plants, the seedlings were taken and weighed in an analytical balance. The dry biomass of root and shoot was measured by analytical balance after the shoot and root dried at 60°C for two days or until they reached consistent weight.
2.2.2 Determination of Physiological Attributes
i. Cell membrane stability (CMS)
Cell membrane stability (CMS) was measured in terms of membrane injury index by observing the electrical conductivity of leaf leachates in deionized water [22]. In short, two sets of leaf samples, 0.1 g each, were cut into square pieces of the same size and put into a test tube containing 10 mL of deionized water. The conductivity Meter (Model: EC-400L, Human Lab Instrument Co., Suwon, Korea) was used to measure the electrical conductivities of two sets, C1 and C2, respectively which was maintained at 40°C for 30 min and 100°C in a boiling water bath for 15 min. The membrane injury index was measured through the following formula:
ii. Relative water content (RWC)
The fresh weight (FW), turgid weight (TW), and dry weight (DW) were determined by taking duplicate leaf discs from fully grown uniform leaves of 15-day-old seedlings of three plants. The leaf discs were immersed in 10 mL of deionized water for 4 h to allow the cells to achieve their maximum turgidity, and the turgid weight was measured as soon as the fresh weight of the leaf discs was recorded following the preparation of the leaf discs. The dry weight of leaf samples was determined after 24 h of full drying in an incubator set at 80°C [23,24]. The relative water content (RWC) of leaves was measured following the formula given below:
iii. Chlorophyll fluorescence
Leaf chlorophyll fluorescence was estimated by the protocol [25–27]. The leaf samples were kept in the dark condition for 30 min before measurement of chlorophyll fluorescence properties. The fluorescence characteristics of chlorophyll were measured by using an OS5p Modulated Fluorometer (ADC BioScientific Ltd., Great Amwell Herts, UK) as the ratio of variable fluorescence to maximum fluorescence (Fv/Fm).
iv. Estimation of total chlorophyll, chl a, chl b and carotenoid content
Fresh fully opened leaf samples (0.1 g) were collected from randomly chosen seedlings and chlorophyll content was extracted using 80% acetone. HPLC grade acetone (5 mL) was added with 0.1 g of homogenized leaf samples in a glass vial and kept them 24 h at 4°C in the dark. The absorbance was measured using a UV-visible Spectrophotometer (Genesys 10S UV-VIS, Thermo Fisher Scientific, Waltham, MA, USA) at 663 and 645 nm wavelength, and chl a and chl b were computed using the equations [28]. Total chlorophyll and the carotenoid content (mg g−1 FW of lutein equivalent) were measured by using the molar extraction coefficient of lutein [29].
2.3 Statistical Analysis of Data
R Version 4.1.0 and META (multi-environment trial analysis)-R software version 6.0 for Windows were used to analysis of data on various attributes of wheat genotypes [30,31]. The acquired data were put in a two-factor analysis (genotypes x stress treatments) of variance (ANOVA) in the general linear model by using the lme4 program [32] and AGRICOLE Library was used to determine the difference between means using Tukey’s HSD test [33]. The mean differences were considered significant when p < 0.05. The boxplot and whisker plot were used to graphically illustrate the descriptive statistics of the variables. Correlation coefficient matrices were displayed by using the R-package Corrplot. The hierarchical co-clustering algorithm was applied to classify the genotype in clusters. Within each cluster, the genotypes were generally similar, but the extracted clusters were different from one another. Cluster heatmaps were created by normalizing and adapting the studied traits to the rhcoclust library [34]. The principal component analysis (PCA) was employed to decrease the data set’s complexity while preserving crucial information. The eigenvalue, latent vectors, and PCA-biplot were obtained from the PCA. R packages FactoMineR, FactoExtra, and GGPlot2 were used to perform principal component analysis [35,36].
These findings, which were obtained through various statistical analyses using META (multi-environment trial analysis)-R software version 6.0, can be used to design an indirect selection strategy for heat tolerance and yield stability based on the relationship between morphological, physiological, and yield attributes. Results from these analyses have been discussed and presented in this chapter (both lab and field experiment) [30] and R-4.1.0 for the win [31] on different characters of wheat genotypes that are presented in tables and figures and discussed in the following headings.
3.1 Functional Relationships among Different Traits in Wheat Seedlings
Fig. 1 shows the mean square values (two way analysis of variance) for studied attributes. Forty-two wheat genotypes were evaluated under two environments (control and heat stress), and data recorded on 15 morpho-physiological characteristics were subjected to two way analysis of variance (Table 3). All variables under study had highly significant (p ≤ 0.001) differences between genotypes, suggesting that each variable under study had a large amount of genetic diversity among the genotypes. These variations may be the consequence of the extensive genetic makeup.
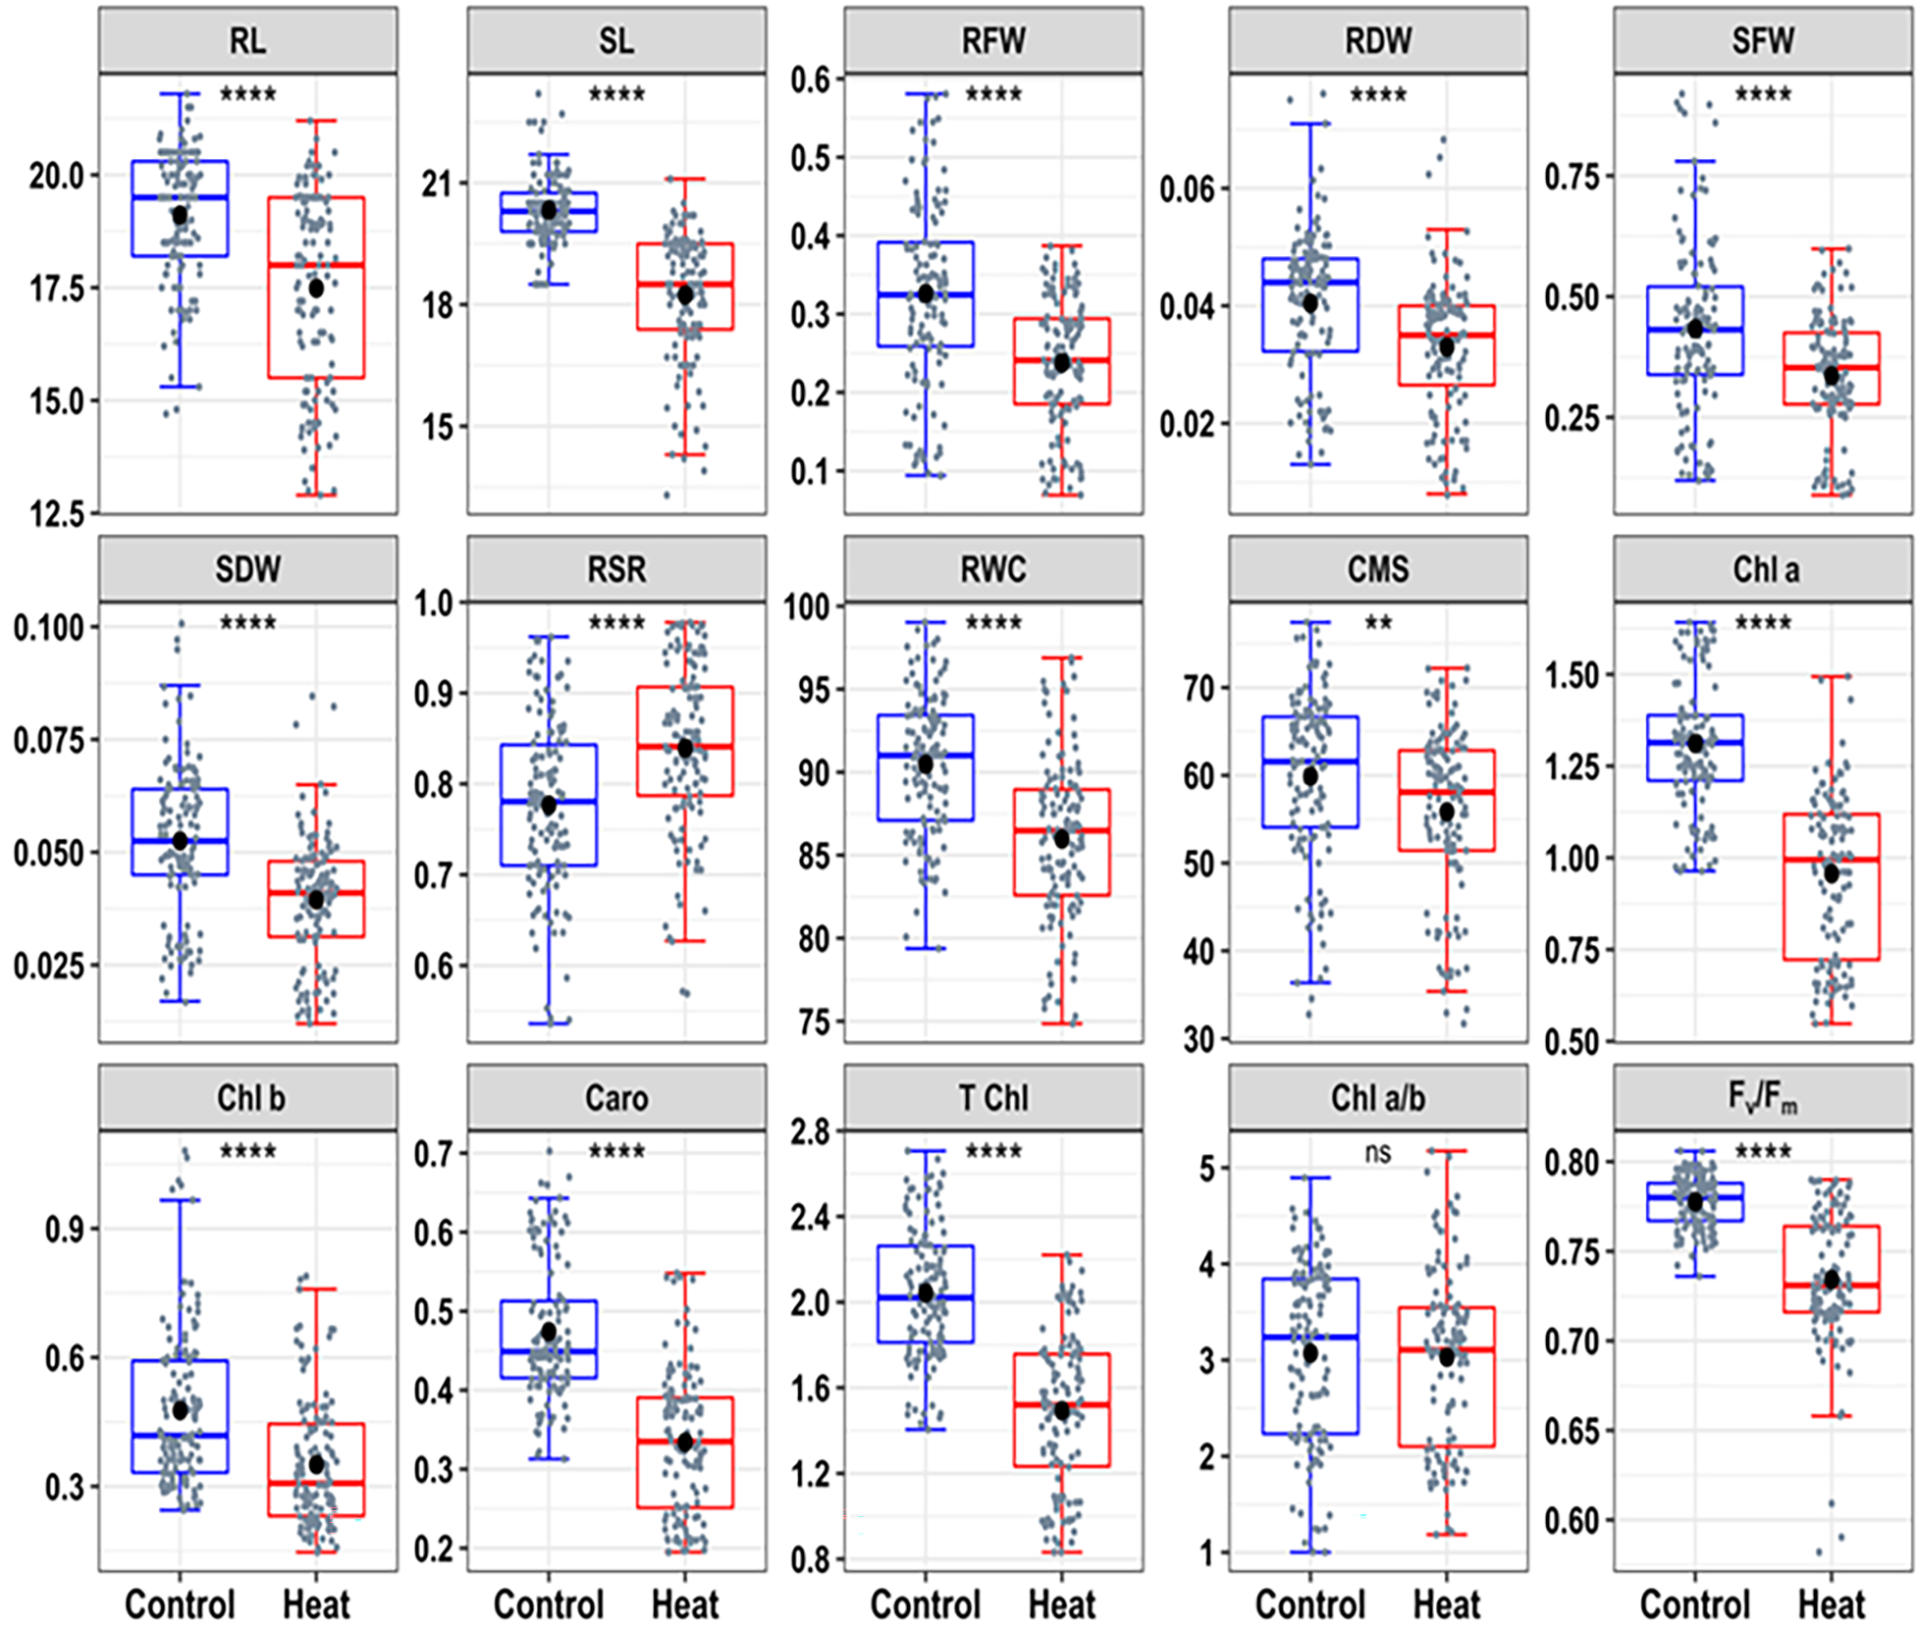
Figure 1: Descriptive summary of 15 morpho-physiological traits of 42 genotypes of wheat at controlled and heat stress environments. ns, non-significant; **, p < 0.01; ****, p < 0.0001. Root length (RL); shoot length (SL); shoot fresh weight (SFW); root fresh weight (RFW); shoot dry weight (SDW); root dry weight (RDW); relative water content (RWC); cell membrane stability (CMS); root shoot ration (RSR); chlorophyll fluorescence (Fv/Fm); total chlorophyll (T Chl); chlorophyll a (Chl a); chlorophyll b (Chl b); chlorophyll ratio of a/b (Chl a/b), and carotenoid (Caro)
3.2 Effects of Growing Environments on Morpho-Physiological Traits of Wheat
In descriptive data as slate color dots on the boxes represented the distribution of 42 wheat genotypes. Additionally, the controlled condition was represented by blue boxes and the heat treated condition was represented by red boxes (Fig. 1).
The descriptive statistics of the seedling traits were displayed in the box plots (Fig. 1). The best linear unbiased estimators (BLUE) of morpho-physiological traits showed significant differences in the heat treatment, and the trait values were significantly lower in the heat-treated seedlings than in the controlled environment, except significant increase in the root-shoot ratio (RSR) in heat stress condition. Of all the traits, SL, RFW, SDW, T Chl, Chl a, Chl b, and Caro revealed the highest value under a controlled environment and decreased significantly (p < 0.001) under a heat-stress environment. Additionally, RDW, SFW, RWC, CMS, and Fv/Fm were significantly decreased (p ≤ 0.01) due to heat stress (Fig. 2). Fv/Fm is a ratio of variable fluorescence (Fv) to maximum fluorescence (Fm) which measures the efficiency of photosystem II (PSII). It is a reliable indicator of photosynthetic activity and is commonly used to assess heat-induced impairment to PSII [15,37]. Fv/Fm is heat sensitive which can accelerate senescence and reduce viable leaf area. Heat stress is significantly affected by different morpho-physiological traits and these results are aligned with the previous findings on wheat genotypes exposed to increased temperature [38].
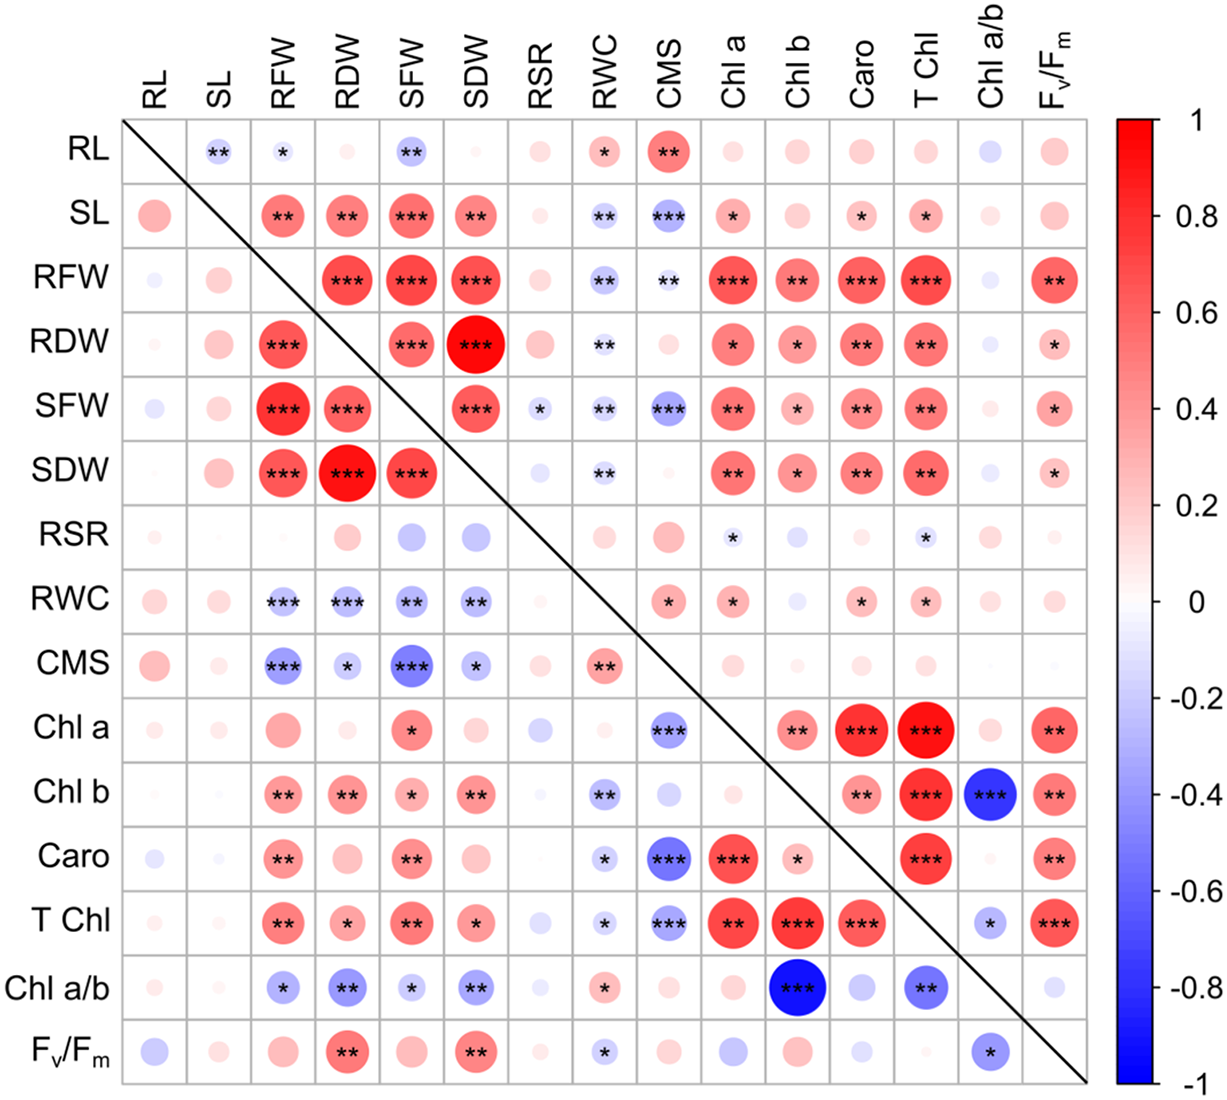
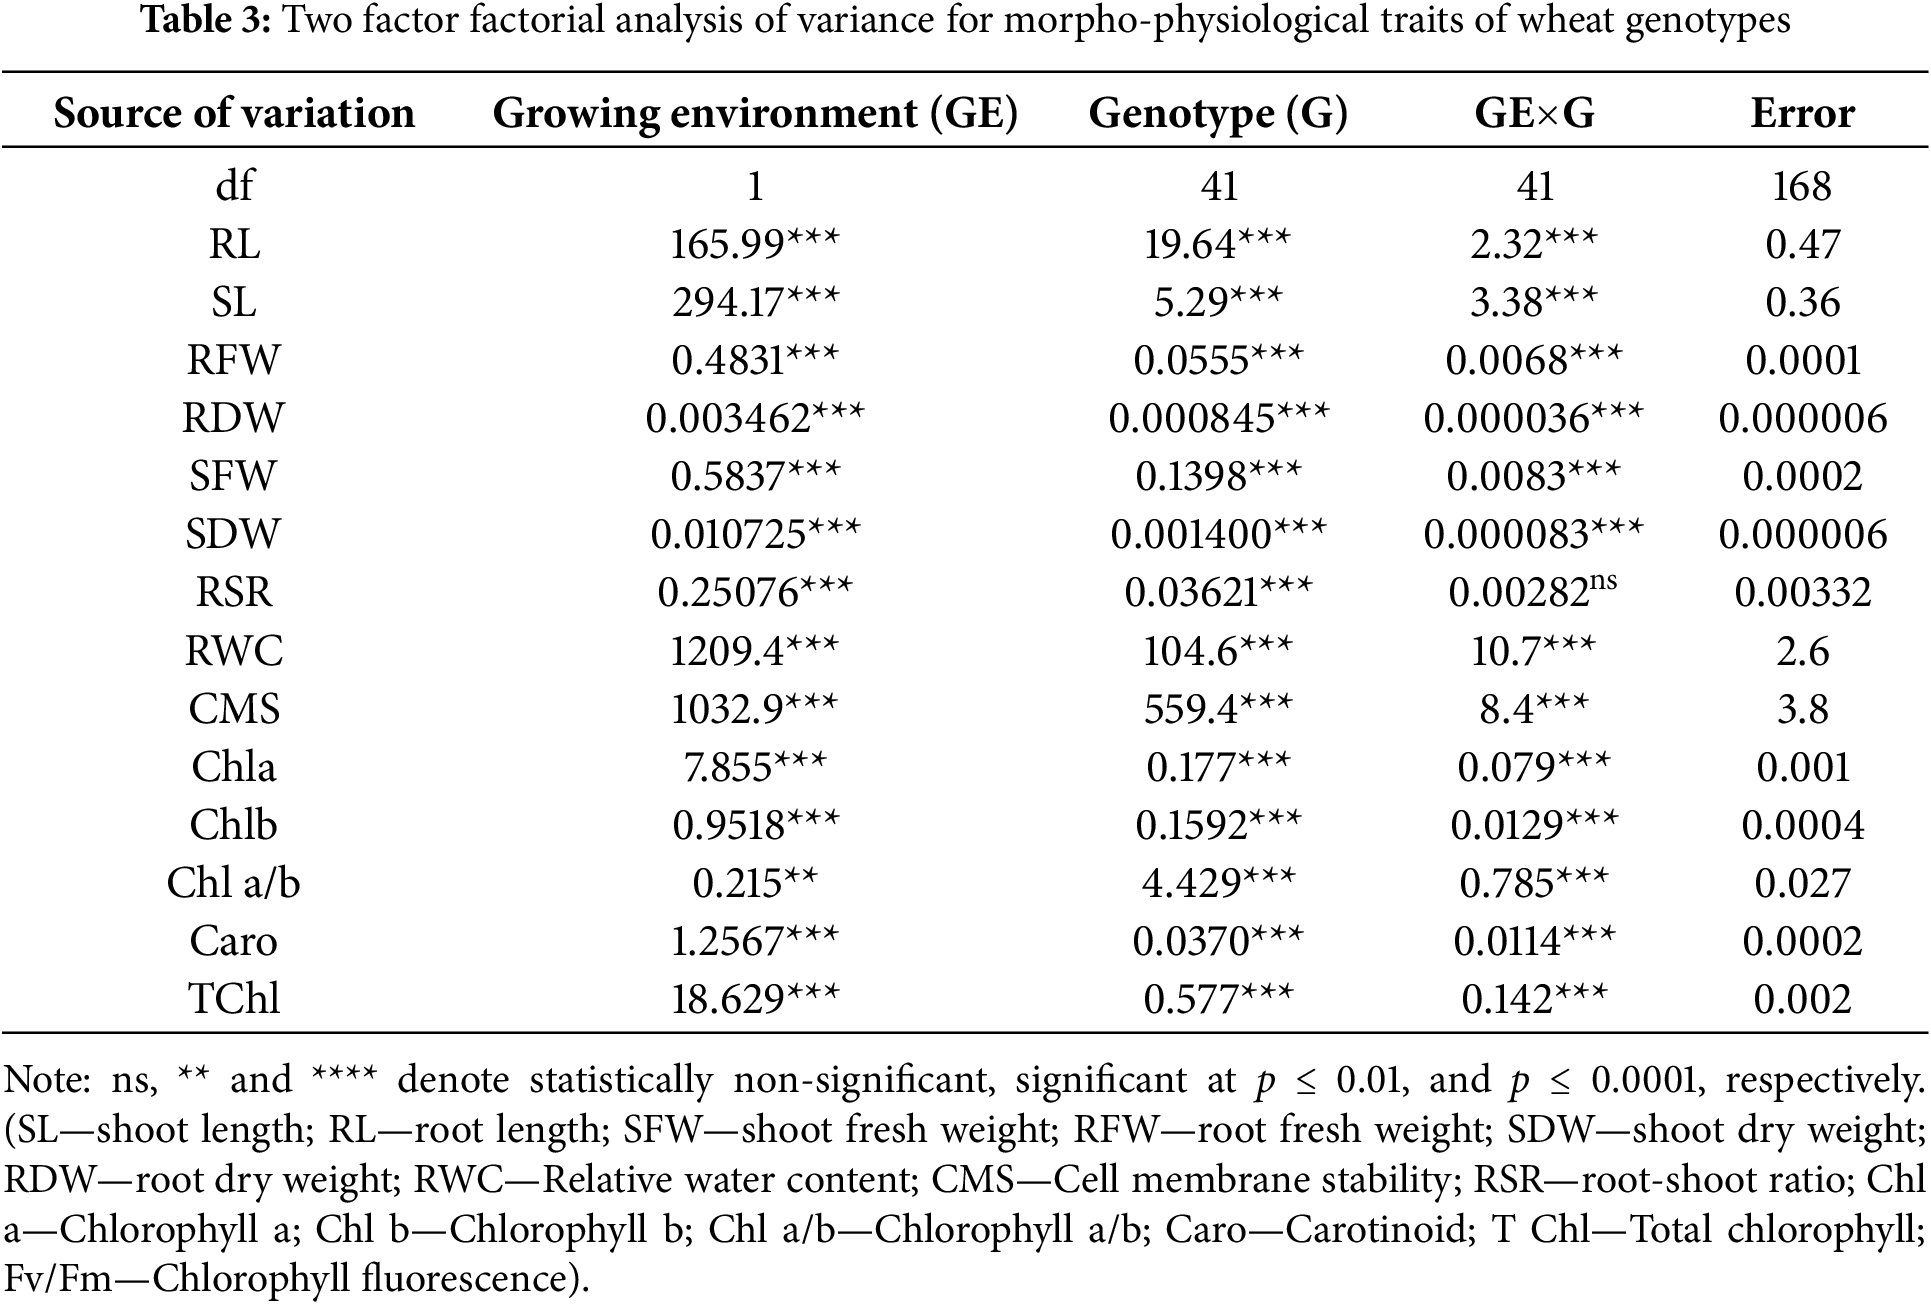
Figure 2: Correlation between the 42 wheat genotypes’ best linear unbiased estimators of morpho-physiological characteristics under control and heat stress
The results revealed that heat stress has a pronounced effect on RSR. Under normal conditions (control), the seedlings might prioritize shoot growth over root development as resources are sufficient for above-ground growth. This could result in a relatively lower RSR, indicating a balanced investment between roots and shoots. However, under heat stress, resources might get redirected towards root development to enhance water and nutrient uptake, leading to an increase in RSR. This change could imply that RSR is responsive to heat stress and may serve as an indicator or response variable in these conditions.
3.3 Correlation Analysis among Morpho-Physiological Traits
Pearson’s correlation was employed to assess interrelationships among 15 studied traits of 42 wheat genotypes. The correlation matrix revealed both strong positive and negative correlations among the variables (Fig. 2). By conducting correlation analyses among these morpho-physiological traits under both conditions, we can recognize how different traits might be interconnected or how changes in one trait might influence others. There was a significant association between all root and shoot traits, having the exception of the correlation between SL and RL. In addition to root traits, root shoot ration exhibited a negligible positive correlation with all other seedling traits under study, but the exception in SFW under heat stress. The indices related to the roots and shoots (RFW, RDW, SFW, and SDW) showed a significant positive association with each other, on the other hand, showed a significant negative association with the stability of cell membrane (CMS) and relative water content (RWC). RWC and CMS had a significant negative correlation only in the control condition. In both cases, pigment-specific indices (total Chl, Chl a, Chl b, Caro, and Fv/Fm) exhibited a strong positive association with growth indices (SFW, RFW, SDW, and RDW) and negative correlations with the stability of cell membrane (CMS), relative water content (RWC), and chlorophyll a/b ratio (Fig. 2). Significant associations among morpho-physiological traits of wheat seedlings demonstrated their combing effect on wheat plant responses under heat stress [39].
The bottom diagonal panel shows associations under control conditions, whereas the top diagonal panel shows associations under heat conditions. The correlation coefficient increases with the intensity of color and the size of the circles. Data were averaged over two growth scenarios. Significance level was indicated by the asterisks (*p < 0.05, **p < 0.01, ***p < 0.001).
The positive correlation among root and shoot-related indices (RFW, RDW, SFW, and SDW) suggests that these aspects are interrelated. When one of these indices increases, the others tend to increase as well. This might indicate a cohesive growth pattern or an integrated response in wheat plants under certain conditions. But under both normal and heat stress circumstances, these indices have a negative connection with cell membrane stability (CMS) and the relative water content (RWC), suggesting a different relationship. Growth indices and CMS under heat stress have a negative connection, which implies that the integrity of cell membranes declines as the plant devotes more resources to growth (as shown by higher root and shoot-related indices). Since chlorophyll a and b can affect light absorption and energy transfer during photosynthesis, a lower chlorophyll a/b ratio may indicate a larger amount of chlorophyll b than chlorophyll a. Higher pigment levels in wheat seedlings appear to have a detrimental effect on water content and cell membrane integrity, even if they are indicative of improved photosynthetic capability and growth [40]. This association suggests that the expenditure on photosynthetic pigments may jeopardize water retention and cellular integrity, which would impair the plant’s resistance to stress, particularly heat stress.
3.4 Hierarchical Clustering of the Genotypes
Forty-two genotypes were grouped using multivariate analysis to determine which genotypes and desired plant features were present. This was accomplished by classifying wheat genotypes into distinct clusters of similar genotypes based on hierarchical cluster analysis (HCA) with the help of relative BLUEs of morpho-physiological parameters (Method = Ward.D2 and Distance = Euclidean) (Fig. 3). The two-way cluster heatmap showed two groups and was slit at the variable level (Fig. 3), while three clusters were generated at the genotypic level based on dereferences based on the characteristics under study. While strongly linked attributes were grouped in a column cluster, the genotypes that were most similar were grouped in a row cluster. RWC, CMS, RDW, SDW, SL, Chl a/b, and Fv/Fm were restricted to group 2, whereas the majority of the characteristics, including T Chl, CHl a, Chla b, Caro and RL, RFW, SFW and RSR were assigned to variable group 1. In the row clusters, 18 of the highest number of wheat genotypes were under cluster III, 13 in cluster II, and 11 in cluster I (Table 4, Fig. 3).
Figure 3: Heatmap showing relative best linear unbiased estimators (BLUEs) and hierarchical clustering of wheat genotypes vs. morpho-physiological parameters (method = ward.D2 and distance = Euclidean)
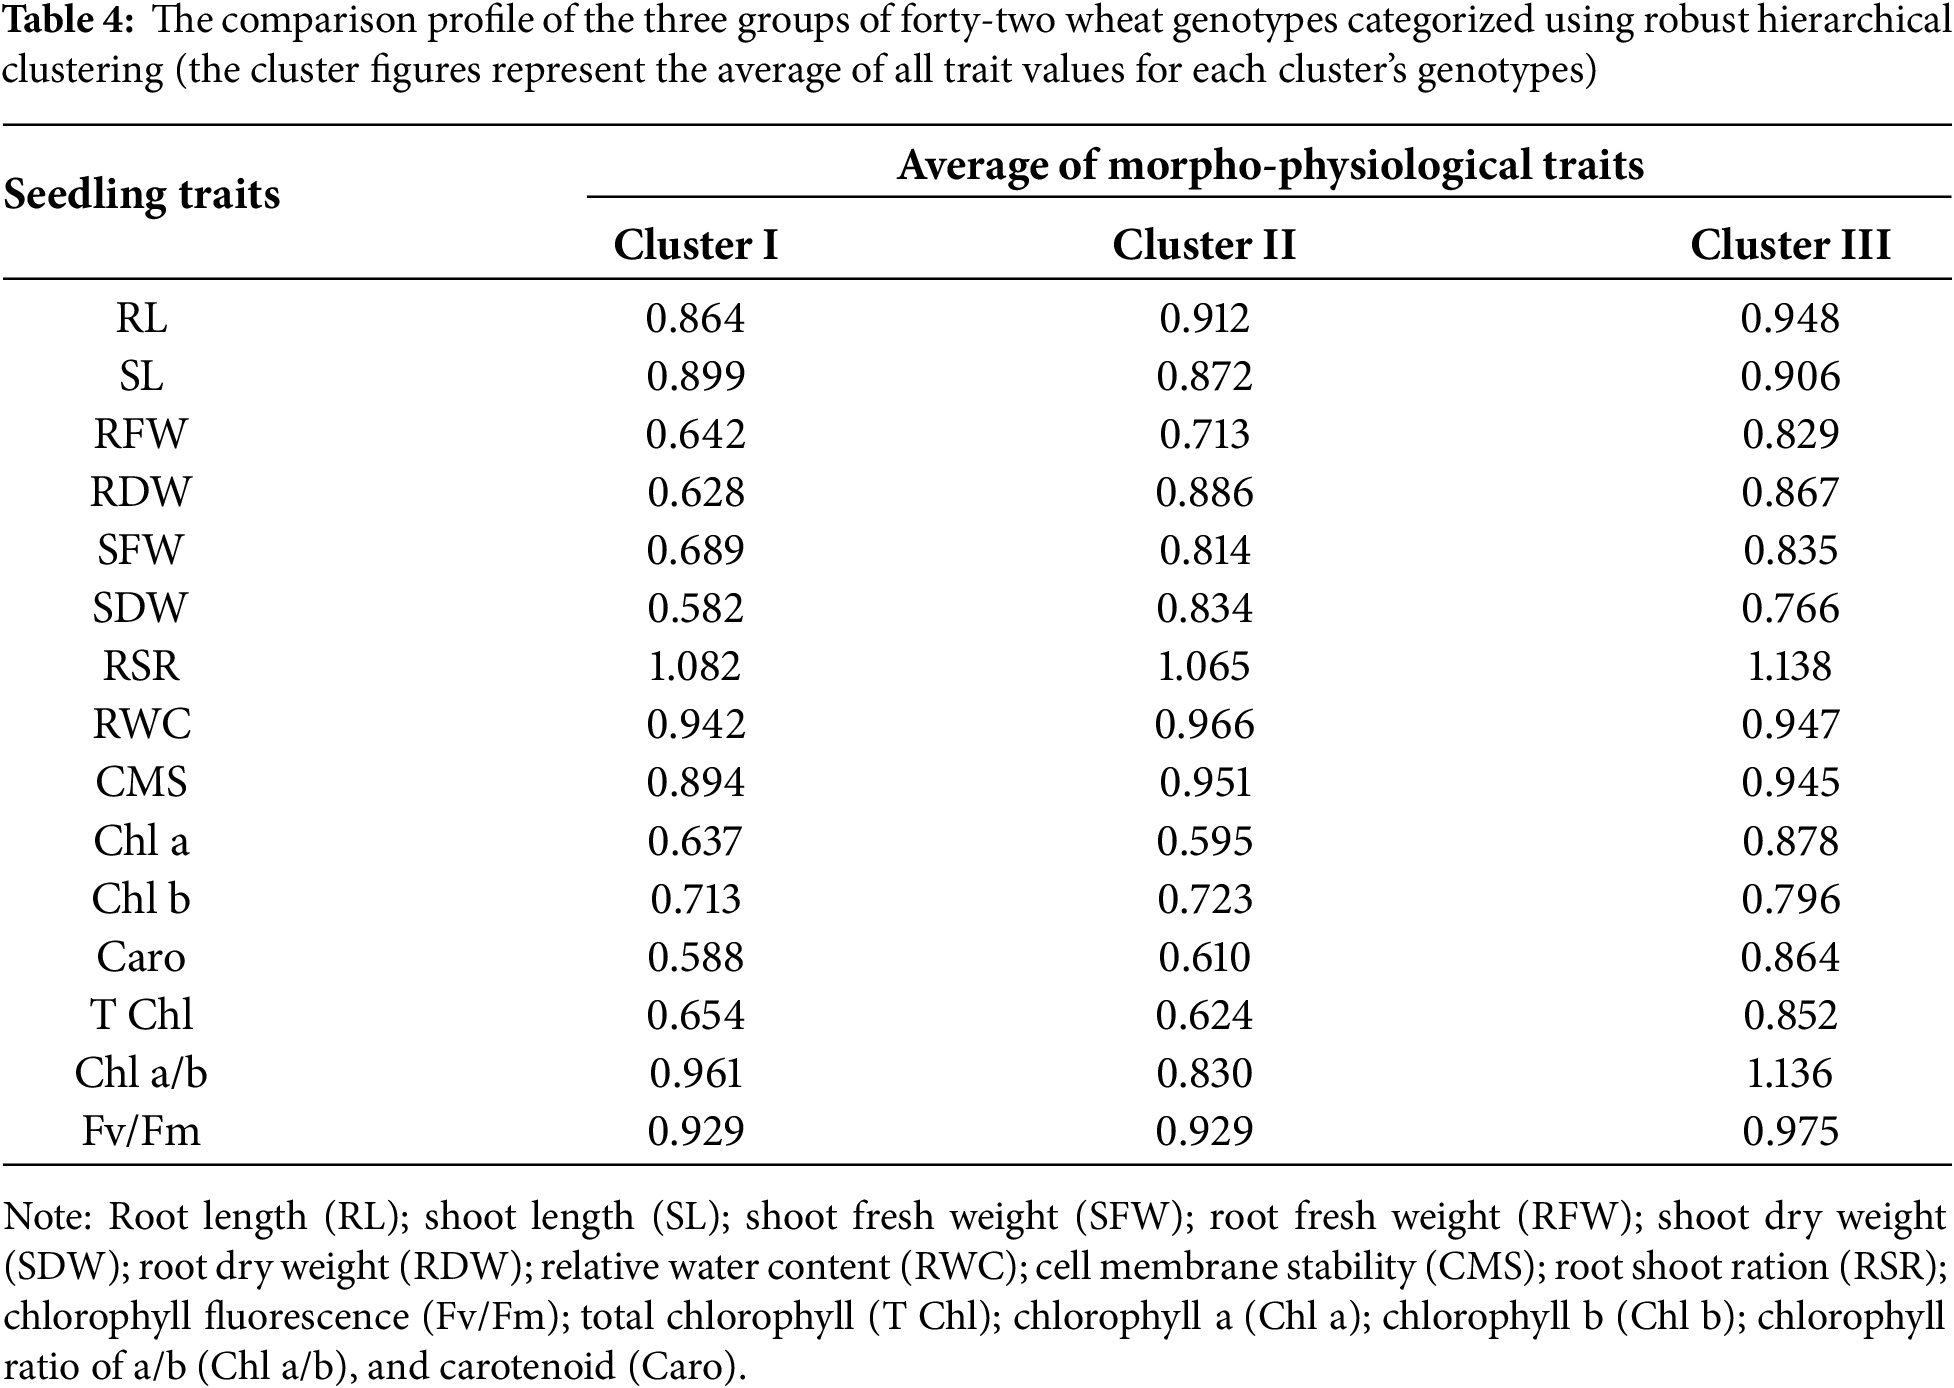
Overall, group I’s factors were the main factors contributing to cluster III. On the other hand, group 2’s parameters mostly defined cluster I. On the other hand, cluster II’s genotypes showed a wide range of differences between the two groups under the study’s parameters (Fig. 4). Following cluster II, the genotypes in row cluster III retained superior T Chl, Chl a, Chl b, Caro, RL, RFW, and SFW. The greatest RWC, CMS, RDW, SDW, and well-maintained RL, SL, and Fv/Fm were the primary characteristics of cluster II’s row, which was followed by cluster III (Table 4). Chl b and SL were better conserved in row cluster I, which was followed by row cluster III, which had a respectable RSR contribution (Table 4). The degree of change in the traits of seedlings and the results of different multivariate analyses indicated that wheat genotypes of cluster III were heat-tolerant, followed by the genotypes of cluster II, as they exhibited good performance for the majority of the seedling traits under study. In contrast, the wheat genotypes in cluster I were confirmed to be heat sensitive because of their poor performance for growth and physiological parameters under heat stress. Hierarchical clustering is an effective tool to categorize plant genotypes based on similarity across numerous stress tolerance indices [41].
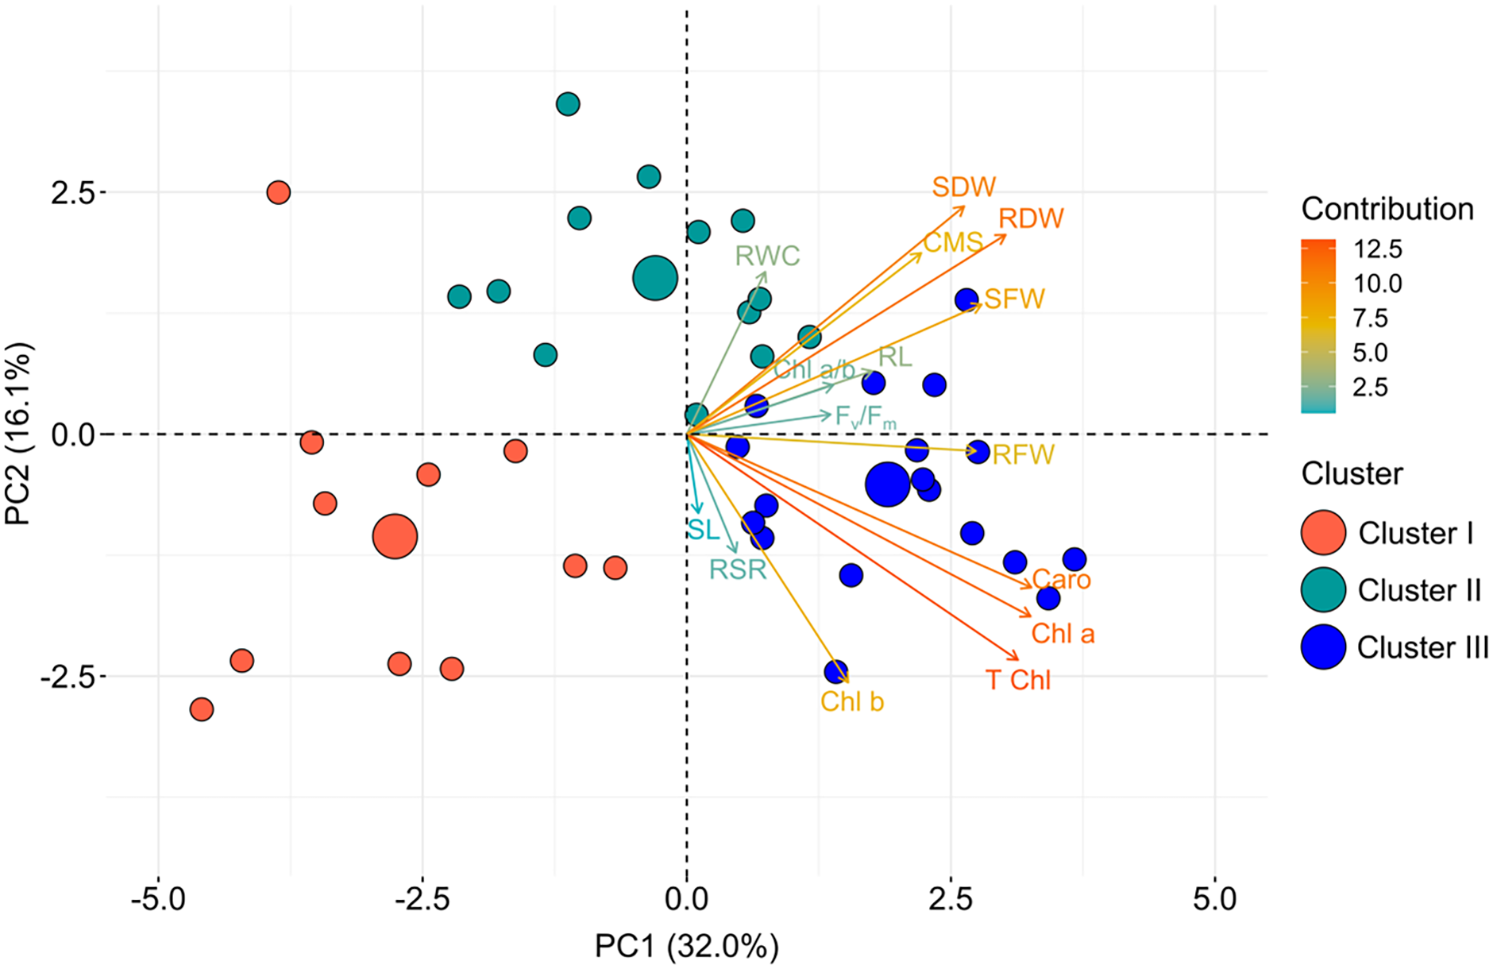
Figure 4: PCA biplot of morpho-physiological characteristics and wheat genotypes based on relative best linear unbiased estimators. Genotypes were dispersed in different ordinates according to how divergent they were
3.5 Principal Component Analysis (PCA)
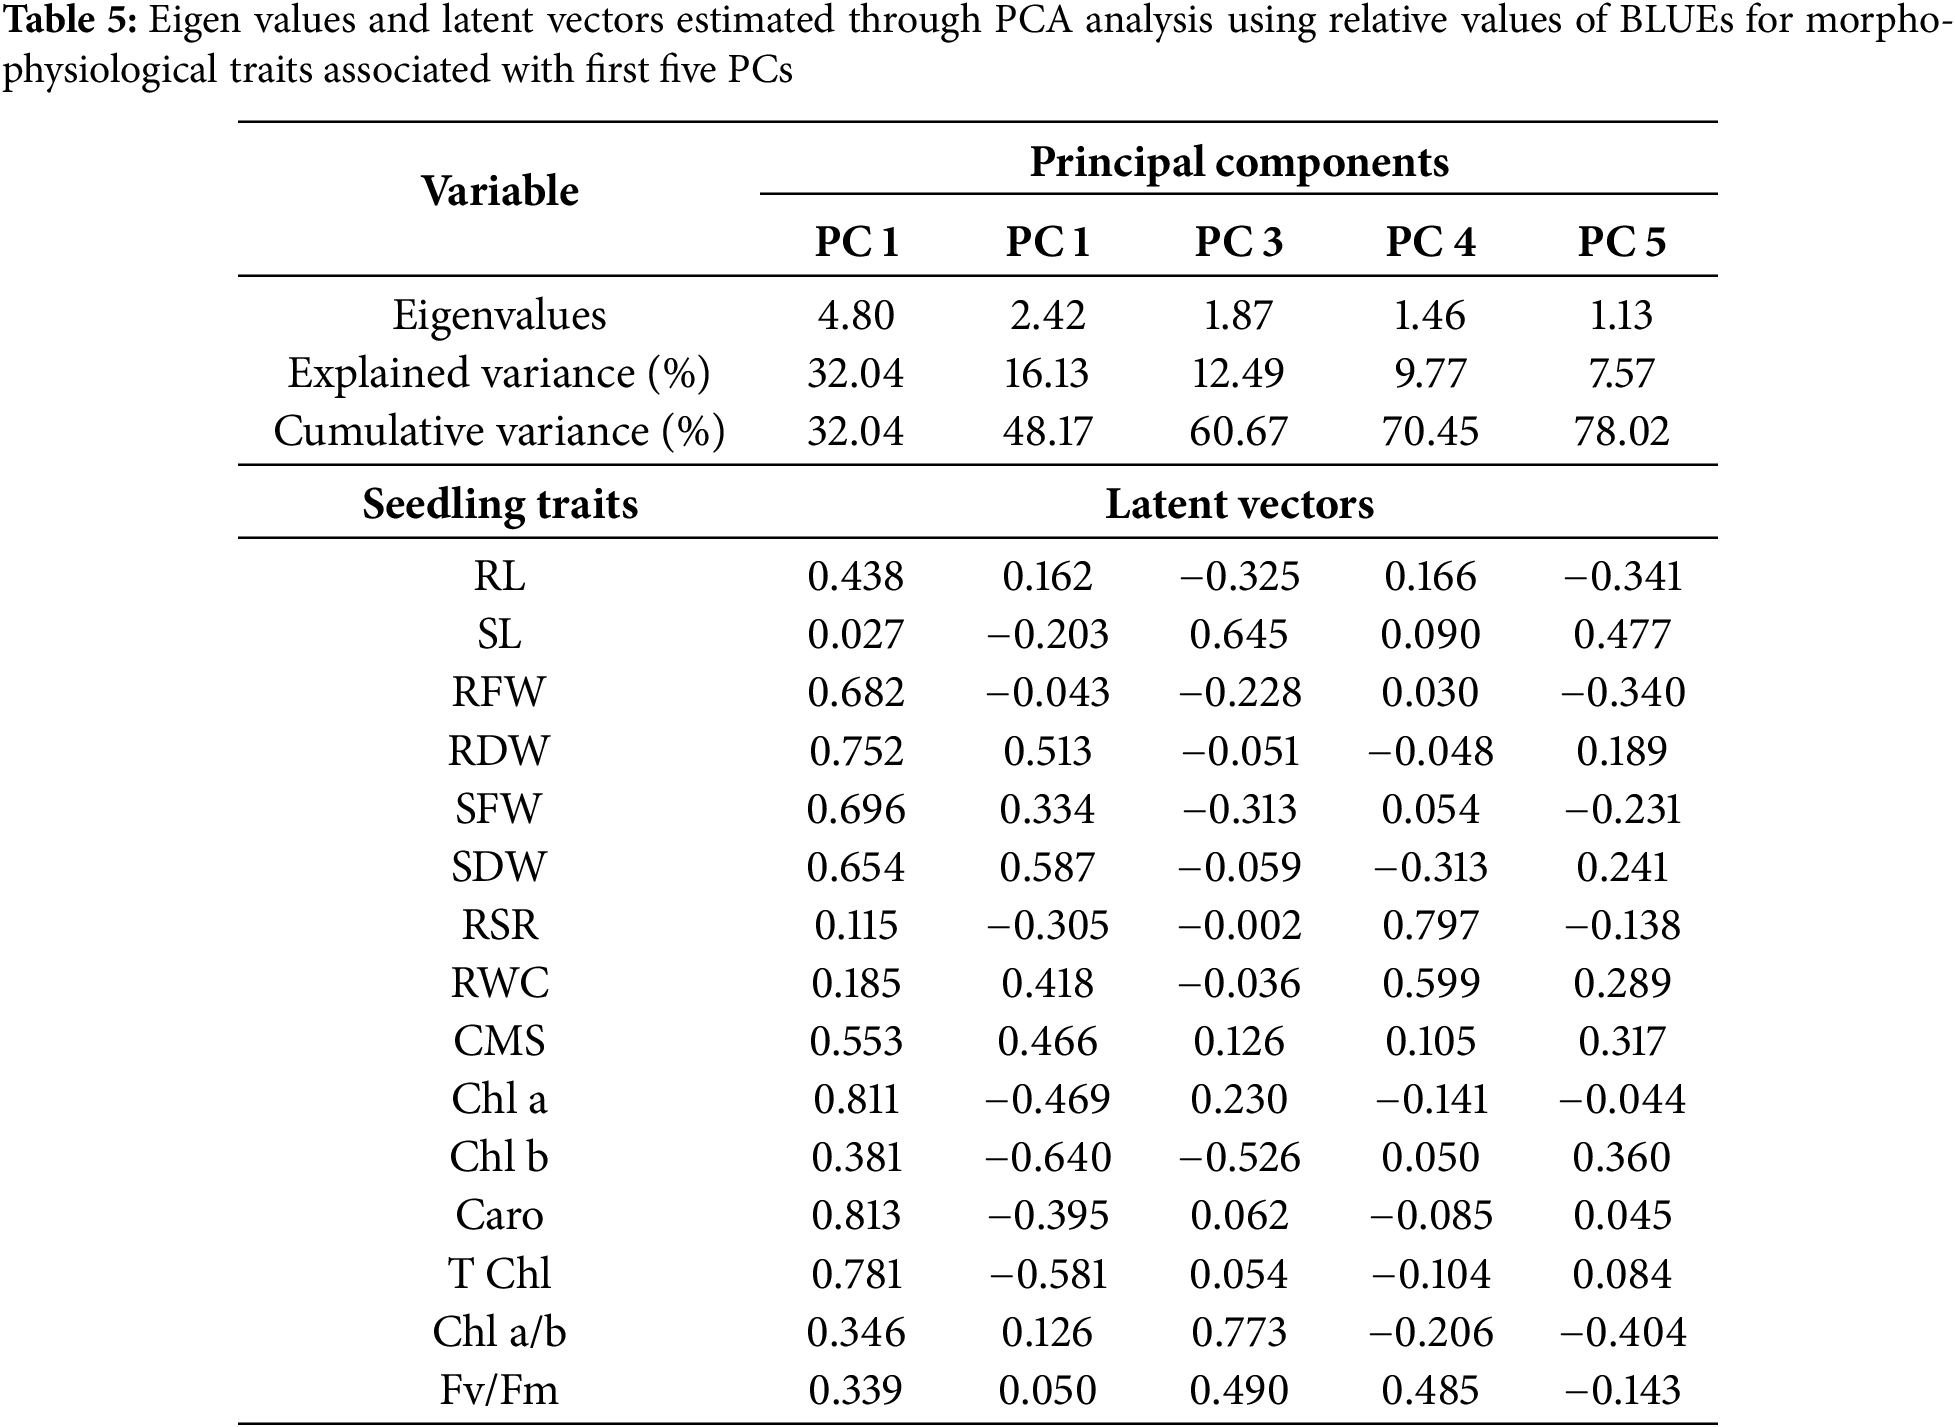
Genetic divergence among the various wheat genotypes is explained by principal component analysis (PCA). Morpho-physiological traits related to stress tolerance were subjected to PCA analysis (Table 4). Among 15 principal components (PCs), only five PCs were deemed significant (eigenvalue > 1.0), while the remaining were nonsignificant (eigenvalue < 1.0) and were unworthy of further interpretation. The PCs explained that all the traits under study influenced 78% of the genotypic variability in heat stress tolerance which was explained by the first five components, while the first two explained 48% of the variability (Table 5, Fig. 4).
To determine which factors have the greatest influence on genotypic variation, biplot analysis is frequently employed. A visual comparison tool for genotypes based on several traits is also included [42]. PCA uses a biplot to display variables as vectors on top of a plot. The relative length of the vectors indicates the relative degree of variability in each variable. Two variables are positively associated if their angle is <90°; negatively correlated if the angle is >90° (around 180 degrees); and uncorrelated if the angle is 90 degrees [43]. Two variables are said to have a positive correlation when they are near together, generating a small angle. It may be applied to comparisons of selection techniques and independent culling based on several characteristics [44,45].
Only five of the 15 principal components (PCs) had eigen value greater than 1.0, which was considered as significant. First two PCs accounts for 48% variability, whereas the first five PCs explained 78% variability (Table 5). The PC1 in the PCA-biplot accounted for 32% of the overall variability. Every physiological and anatomical characteristic (apart from SL) either favorably or adversely influenced heat tolerance.
RWC, SDW, and RDW were the main contributors to the second PC, which explained almost 16% of the overall variance. The evaluation of the genotypes under study is thought to be better explained by the pigment-specific features (T Chl, Chl a, Chl b, and Caro) that were differentiated through the first PC. Out of all the characteristics, group 1 consisted of SL, RSR, and Chl b, whereas groups 2 and 3 included Caro, Chl b, T Chl, CMS, RWC, RL, and Chl a/b. The PCA biplot showed that the characteristics of group 2, which were the main donors in PC 1 were strongly linked with the genotypes of row cluster III. On the other hand, the variable group 1, which was also a donor in PC 1, was linked to the genotype cluster III. Although several variables of group 3 contributed to PC 2 were also strongly associated with row cluster II. The variables or traits of group 3 that contributed to PC 2 were shown to be closely associated with the genotypes of row cluster III.
The length of the biplot signifies the quality of representation, while a vector’s color intensity shows how much each trait contributes towards the main components. The angle generated from the biplot’s at the center point between vectors indicated that whether the evaluated traits interact positively or negatively. Larger circles denote the centroid of the corresponding cluster, while Fig. 3 provides further information.
3.6 Genotype Variability in the Extracted Clusters
A radar chart is a visual aid that provides information by comparing three or more variables on a two-dimensional plane. The results showed that cluster I was heavily impacted by heat stress, but the genotypes of cluster III had better withstood capacity under heat stress than the genotypes of cluster II (Fig. 5, Table 6).
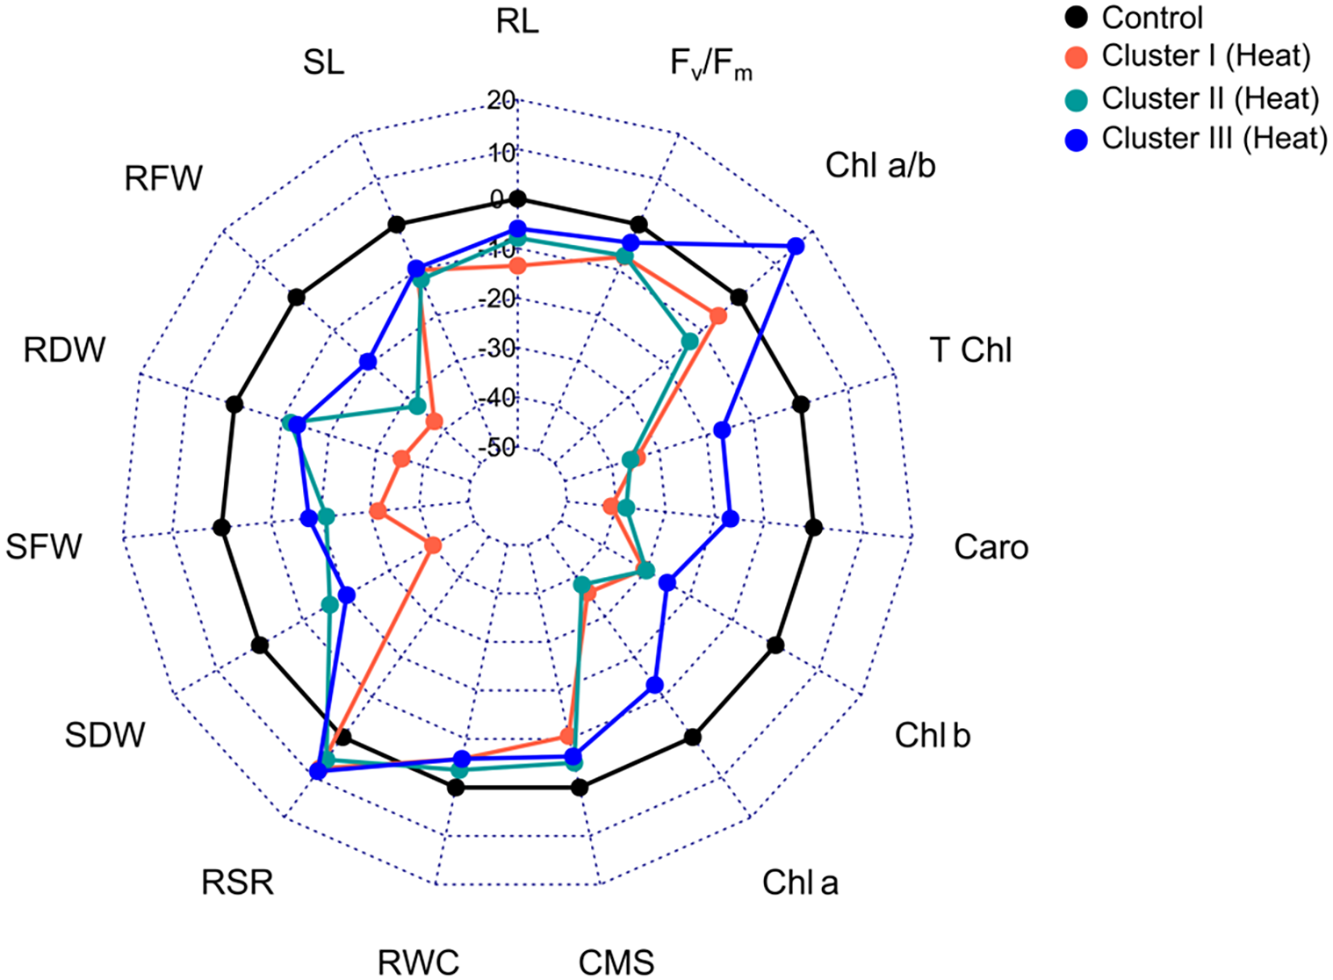
Figure 5: Radar diagram illustrating how heat stress alters the genotypes of several clusters’ seedling characteristics. The values are expressed as percentage of the control environment. Root length (RL); shoot length (SL); shoot fresh weight (SFW); root fresh weight (RFW); shoot dry weight (SDW); root dry weight (RDW); relative water content (RWC); cell membrane stability (CMS); root shoot ration (RSR); chlorophyll fluorescence (Fv/Fm); total chlorophyll (T Chl); chlorophyll a (Chl a); chlorophyll b (Chl b); chlorophyll ratio of a/b (Chl a/b), and carotenoid (Caro)
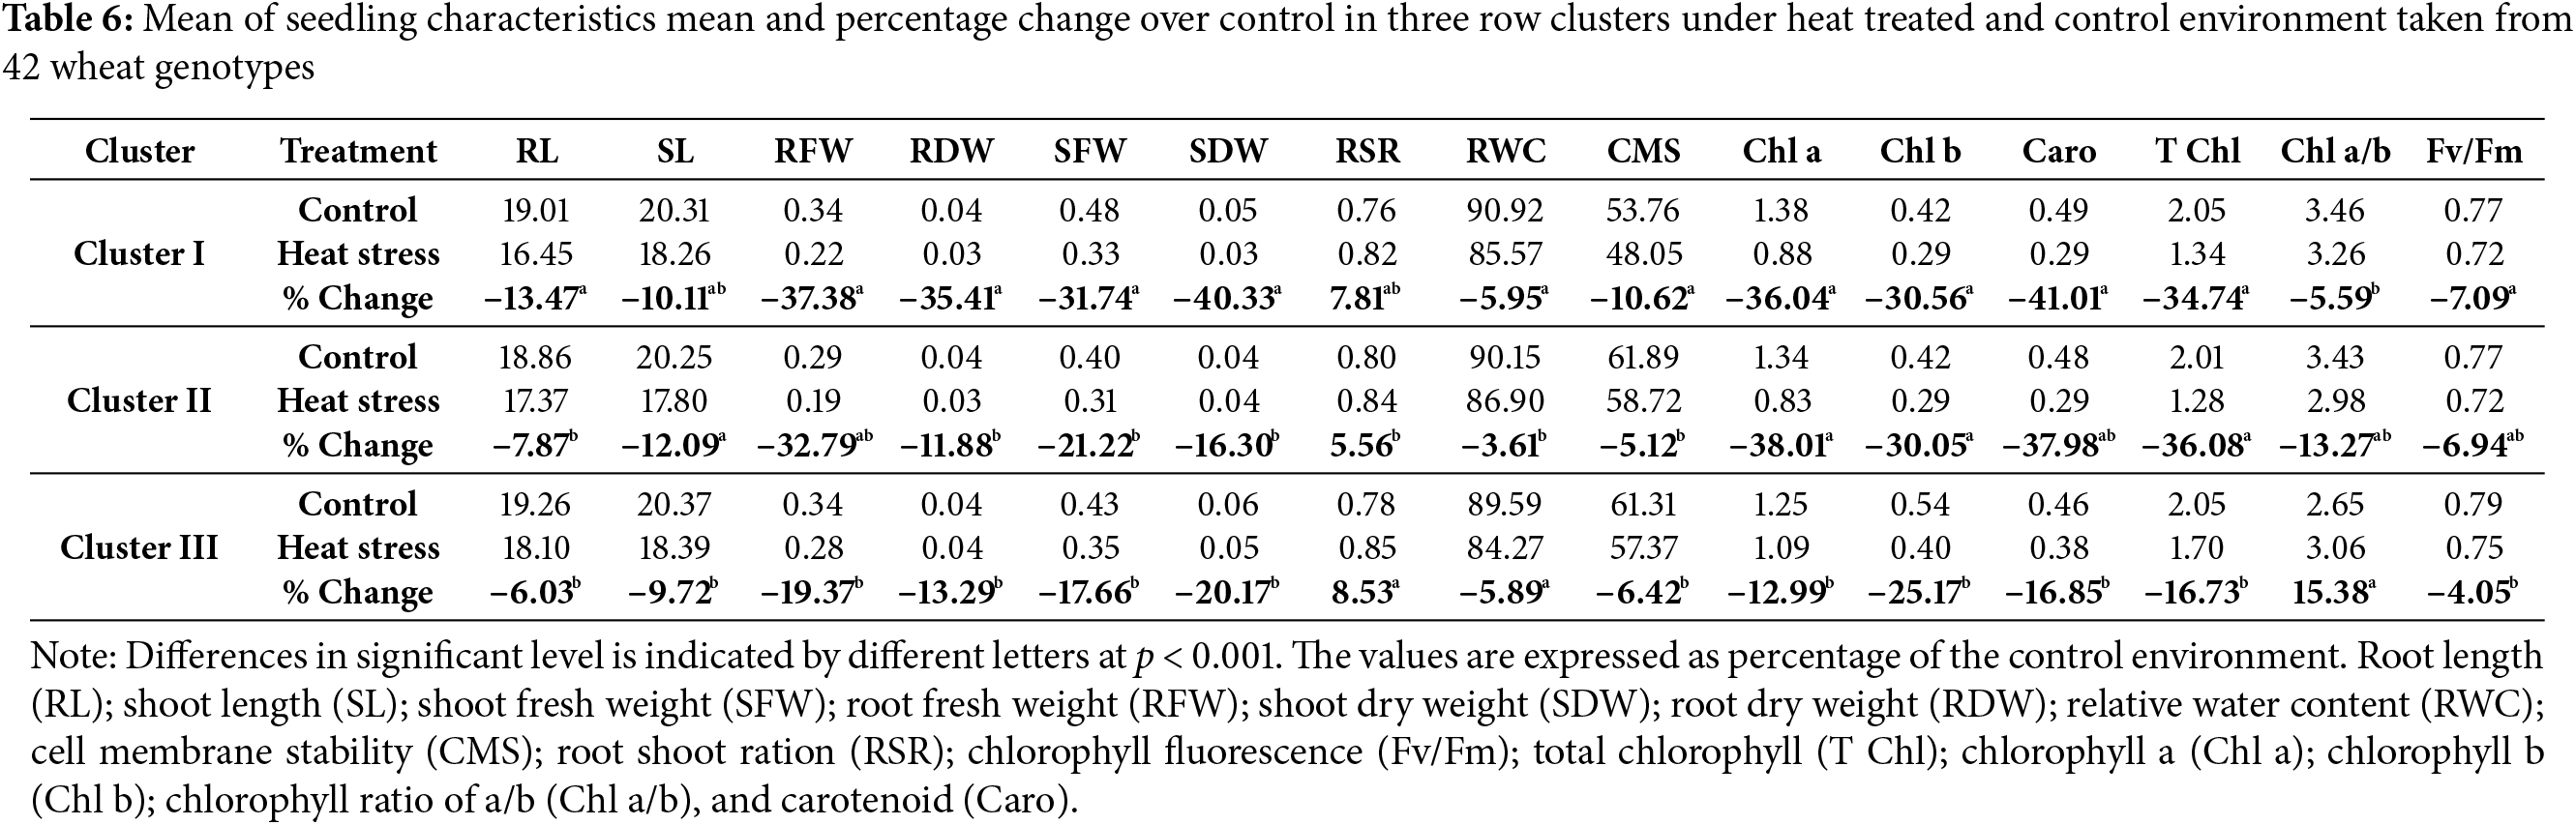
Heat stress treatment resulted in a 13%, 7%, and 6% reduction in root length (RL) in clusters I, II and III, respectively (Fig. 5, Table 6). The percentage decrease in SL during heat stress in clusters I, II and III were 10%, 12%, and 9%, respectively, in comparison to control. When compared to control, SFW fell by 32%, 21%, and 18% in clusters I, II, and III, respectively, while RFW reduced by the least amount 19% in cluster 3 and by an average of 35% in the other two clusters under heat treatment. As compare to control environment, cluster I exhibited 35% drop in RDW during heat stress, whereas clusters II and III experienced 12% and 13% decreases, respectively (Fig. 5 and Table 6). In heat stress environment, SDW showed a similar pattern of decline and clusters I, II, and III experiencing 40%, 16%, and 20% decreases, respectively. RWC fell as well in similar pattern. In contrast to the control, RSR raised in all clusters under heat stress conditions, where the cluster III showed the highest rise (9%) followed by cluster I (8%) and cluster II (6%).
The cluster II showed the lowest CMS decline of 5% as a result of heat stress, followed by cluster III at 7%, while the cluster I showed an 11% decrease. Heat stress caused Chl b to drop by 25%, 30%, and 31% in clusters I, II, and III, respectively, compared to control. Conversely, Chl a decreased by an average of 38% in other clusters and by the least amount (13% in cluster III and 36% in cluster I). There is a comparable downward trend for carotenoid, total chlorophyll, and Fv/Fm. Cluster I showed a drop in the ratio of Chl a and Chl b at the least 6% under heat stress, whereas Cluster II experienced a decrease of 13%. In contrast, cluster III showed a 15% rise in Chl a/b (Table 6).
The relative growth pattern of crop plant’s is exhibits by the root-shoot ratio. In this study, heat stress led to a substantial rise in mean RSR. A greater root-shoot ratio means that under heat stress, the root growth of the seedlings’ is less impacted than their shoot growth. Other researchers thought that the less impacted root development under heat stress was a way for wheat seedlings to escape heat [25]. A greater decrease in shoot dry weight and root dry weight of the genotypes under heat stress environment was likely the cause of higher root-shoot ratio of the genotypes of row cluster I and II in the present investigation. Furthermore, the effects of a higher Chl a and Chl b ratio (Chl a/b) under heat treated condition as opposed to control may suggest an effort to maximize photosynthetic processes, serve as a stress-reduction strategy, or indicate possible difficulties in sustaining ideal photosynthetic efficiency in demanding conditions [3,17].
Significant alterations in all measured attributes were noted across the wheat genotypes at heat treated condition. The lower mean values for all the studied variables was observed in heat treated seedlings than the control environment with the exception in RSR. Genotypes of those clusters were shown to be more tolerant of heat stress, as evidenced by the lower declines in root-shoot length, fresh weight, carotenoid, T Chl, chlorophyll fluorescence, Chl a and Chl b in cluster III, as well as in SD, RD, RWC and CMS in cluster II.
According to correlation studies, pigment-specific indices (T Chl, Chl a, Chl b, Fv/Fm, Caro) exhibited significant negative correlations with RWC and CMS both under control and heat-treated conditions, as well as significant positive correlations with vegetation (RFW, RDW, SFW, and SDW). However, it is important to note that the PCA-biplot showed a substantial correlation between genotypes of row cluster III and pigment attributes, which were the main contributors in PC 1. Although several of those qualities were also highly associated to row cluster II, the traits of RFW, RDW, SFW, SDW, CMS, RWC, and Fv/Fm that contributed to PC 2 were shown to be closely related with the genotypes of row cluster III.
As plant breeders rarely consider heat tolerance as an independent characteristic, they can efficiently select genotypes of trait groups they are interested in by utilizing co-cluster combinations. Certain genotypes were found to be heat-sensitive, while others were determined to be heat-stress resistant based on seedling characteristics under both environmental circumstances.
Cluster III genotypes were found to be heat-tolerant, followed by cluster II genotypes. This is because the genotypes of cluster III performed better for the majority of the characters under study including carotenoid (Caro), total chlorophyll (T Chl), shoot fresh weight (SFW), root fresh weight (RFW), shoot dry weight (SDW), root dry weight (RDW), cell membrane stability (CMS), chlorophyll a (Chl a), chlorophyll b (Chl b), carotenoid (Caro), and chlorophyll fluorescence (Fv/Fm). In contrast, the genotypes of cluster I were confirmed to be heat sensitive because of their poor growth and physiological capacity under heat stress. Given their morphological variations and physiological responses to stress, these wheat genotypes can be selected as prime candidates for further breeding programs.
Acknowledgement: The authors would like to acknowledge Bangabandhu Sheikh Mujibur Rahman Agricultural University (BSMRAU), Gazipur, Bangladesh authority for their support to carry out the research.
Funding Statement: The authors received no specific funding for this study.
Author Contributions: The authors confirm contribution to the paper as follows: Conceptualization and methodology: S. Y. Labonno; M. S. Raihan; M. Mohi-Ud-Din; A. K. M. Aminul Islam; investigation: S. Y. Labonno; M. Mohi-Ud-Din; A. K. M. Aminul Islam; data curation: S. Y. Labonno; writing—original draft preparation: S. Y. Labonno; M. S. Raihan; M. Mohi-Ud-Din; A. K. M. Aminul Islam; writing—review and editing: M. Mohi-Ud-Din; A. K. M. Aminul Islam; supervision: S. Y. Labonno; M. S. Raihan; M. Mohi-Ud-Din; A. K. M. Aminul Islam; project administration: A. K. M. Aminul Islam; funding acquisition: A. K. M. Aminul Islam. All authors reviewed the results and approved the final version of the manuscript.
Availability of Data and Materials: The data generated during experimentation and support the findings of this study are available from the corresponding author, A. K. M. Aminul Islam, upon reasonable request.
Ethics Approval: Not applicable.
Conflicts of Interest: The authors declare no conflicts of interest to report regarding the present study.
References
1. Acevedo M, Zurn JD, Molero G, Singh P, He X, Aoun M, et al. The role of wheat in global food security. In: Nagothu US, editor. Agricultural development and sustainable intensification: technology and policy challenges in the face of climate change. Oxfordshire, UK: Routledge; 2018. p. 81–110. doi:10.4324/9780203733301-4. [Google Scholar] [CrossRef]
2. Asseng S, Ewert F, Martre P, Rötter RP, Lobell DB, Cammarano D, et al. Rising temperatures reduce global wheat production. Nat Clim Change. 2015;5:143–7. doi:10.1038/nclimate2470. [Google Scholar] [CrossRef]
3. Sarkar S, Islam AKMA, Barma NCD, Ahmed JU. Tolerance mechanisms for breeding wheat against heat stress: a review. S Afr J Bot. 2021a;138(2021):1–16. doi:10.1016/j.sajb.2021.01.003. [Google Scholar] [CrossRef]
4. Yadav S, Sharma S, Sharma KD, Dhansu P, Devi S, Preet K, et al. Selenium mediated alterations in physiology of wheat under different soil moisture levels. Sustainability. 2023;15:1771. doi:10.3390/su15031771. [Google Scholar] [CrossRef]
5. Anjum MA, Sarfraz M, Qureshi MA, Rizwan M, Naz A, Ahmed K, et al. Impact of salicylic acid on wheat growth and nutrient uptake in salinized environments. J Pure Appl Agric. 2022;7(3):1–7. [Google Scholar]
6. Rehman HU, Tariq A, Ashraf I, Ahmed M, Muscolo A, Basra SMA, et al. Evaluation of physiological and morphological traits for improving spring wheat adaptation to terminal heat stress. Plants. 2021;10(3):455. doi:10.3390/plants10030455. [Google Scholar] [PubMed] [CrossRef]
7. Ullah A, Nadeem F, Nawaz A, Siddique KHM, Farooq M. Heat stress effects on the reproductive physiology and yield of wheat. J Agron Crop Sci. 2022;208(1):1–17. doi:10.1111/jac.12572. [Google Scholar] [CrossRef]
8. Sharma D, Jaiswal J, Singh N, Chauhan A, Gahtyari NC. Developing a selection criterion for terminal heat tolerance in bread wheat based on various morpho-physiological traits. Int J Current Microbio Appl Sci. 2018;7(7):2716–26. doi:10.20546/ijcmas.2018.707.318. [Google Scholar] [CrossRef]
9. Masson-Delmotte V, Zhai P, Pirani A, Connors SL, Péan C, Berger S, et al. Contribution of working group I to the sixth assessment report of the intergovernmental panel on climate change. Cambridge, UK: Cambridge University Press; 2021. [Google Scholar]
10. Lenssen N, Schmidt G, Hansen J, Menne M, Persin A, Ruedy R, et al. Improvements in the GISTEMP uncertainty model. J Geophys Res Atmos. 2019;124(12):6307–26. doi:10.1029/2018JD029522. [Google Scholar] [CrossRef]
11. Lenssen N, Schmidt GA, Hendrickson M, Jacobs P, Menne M, Ruedy R. A GISTEMPv4 observational uncertainty ensemble. J Geophys Res Atmos. 2024;129(17):e2023JD040179. doi:10.1029/2023JD040179. [Google Scholar] [CrossRef]
12. Kumar A, Dash GK, Barik M, Panda PA, Lal MK, Baig MJ, et al. Effect of drought stress on resistant starch content and glycemic index of rice (Oryza sativa L.). Starch. 2020;72:190–229. doi:10.1002/star.201900229. [Google Scholar] [CrossRef]
13. Iqbal H, Yaning C, Rehman HU, Waqas M, Ahmed Z, Raza ST, et al. Improving heat stress tolerance in late planted spring maize by using different exogenous elicitors. Chil J Agric Res. 2020;80(1):30–40. doi:10.4067/S0718-58392020000100030. [Google Scholar] [CrossRef]
14. Medina E, Kim SH, Yun M, Choi WG. Recapitulation of the function and role of ROS generated in response to heat stress in plants. Plants. 2021;10(2):371. doi:10.3390/plants10020371. [Google Scholar] [PubMed] [CrossRef]
15. Moradpour M, Abdullah SNA, Namasivayam P. The impact of heat stress on morpho-physiological response and expression of specific genes in the heat stress-responsive transcriptional regulatory network in Brassica oleracea. Plants. 2021;10(6):1064. doi:10.3390/plants10061064. [Google Scholar] [PubMed] [CrossRef]
16. Islam AU, Chhabra AK, Dhanda SS, Peerzada OH. Genetic diversity, heritability and correlation studies for yield and its components in bread wheat under heat stress conditions. IOSR J Agric Vet Sci (IOSR-JAVS). 2017;10(5):71–7. doi:10.9790/2380-1005017177. [Google Scholar] [CrossRef]
17. Djanaguiraman M, Boyle DL, Welti R, Jagadish SVK, Prasad VV. Decreased photosynthetic rate under high temperature in wheat is due to lipid desaturation, oxidation, acylation, and damage of organelles. BMC Plant Biol. 2018;18(1):55. doi:10.1186/s12870-018-1263-z. [Google Scholar] [PubMed] [CrossRef]
18. Sarkar S, Khatun M, Era FM, Islam AKMM, Anwar MP, Danish S, et al. Abiotic stresses: alteration of composition and grain quality in food legumes. Agronomy. 2021b;11:2238. doi:10.3390/agronomy11112238. [Google Scholar] [CrossRef]
19. Khatun M, Sarkar S, Era FM, Islam AKMM, Anwar MP, Fahad S, et al. Drought stress in grain legumes: effects, tolerance mechanisms and management. Agronomy. 2021;11(12):2374. doi:10.3390/agronomy11122374. [Google Scholar] [CrossRef]
20. Yadav MR, Choudhary M, Singh J, Lal MK, Jha PK, Udawat P, et al. Adaptation, and mitigation of heat stress on wheat under changing climates. Int J Mol Sci. 2022;23(5):28–38. doi:10.3390/ijms23052838. [Google Scholar] [PubMed] [CrossRef]
21. Khatun S, Ahmed JU, Mollah MMI, Taewan K. Physiological mechanism of thermotolerance in wheat (Triticum aestivum L.) seedlings. Am J Plant Sci. 2018;9:2719–27. doi:10.4236/ajps.2018.913198. [Google Scholar] [CrossRef]
22. Deshmukh PS, Sairam RK, Shukla DS. Measurement of ion leakage as a screening technique for drought resistance in wheat genotypes. Indian J Plant Physiol. 1991;34:89–91. [Google Scholar]
23. Arndt SK, Irawan A, Sanders GJ. Apoplastic water fraction and rehydration techniques introduce significant errors in measurements of relative water content and osmotic potential in plant leaves. Plant Physiol Soc. 2015;155(4):355–568. doi:10.1111/ppl.12380. [Google Scholar] [PubMed] [CrossRef]
24. Gulen H, Eris A. Some physiological changes in strawberry (Fragaria x ananassa cv. Camarosa) plants under heat stress. J Hort Sci Biotechnol. 2003;78:894–8. doi:10.1080/14620316.2003.11511715. [Google Scholar] [CrossRef]
25. Strasser BJ, Strasser RJ. Measuring fast fluorescence transients to address environmental questions: the JIP test. In: Mathis P, editor. Photosynthesis: from light to biosphere. Dordrecht-Boston-London: Kluwer Academic Publishing; 1995. p. 977–80. doi:10.1007/978-94-009-0173-5_1142. [Google Scholar] [CrossRef]
26. Strasser RJ, Srivastava A, Tsimilli-Michael M. The fluorescence transient as a tool to characterize and screen photosynthetic samples. In: Yunus M, Pathre U, Mohanty P, editors. Probing photosynthesis: mechanism, regulation and adaptation. London, UK: Taylor and Francis Publishers; 2000. p. 445–83. [Google Scholar]
27. Misra AN, Srivastava A, Strasser RJ. Utilization of fast chlorophyll a fluorescence technique in assessing the salt/ion sensitivity of mungbean and Brassica seedlings. J Plant Physiol. 2001;158:117–31181. doi:10.1078/s0176-1617(04)70144-3. [Google Scholar] [CrossRef]
28. Arnon D. Copper enzymes in isolated chloroplasts polyphenol-oxidase in Beta vulgaris. Plant Physiol. 1949;24:1–15. doi:10.1104/pp.24.1.1. [Google Scholar] [PubMed] [CrossRef]
29. Mohi-Ud-Din M, Siddiqui N, Rohman M, Jagadish SVK, Ahmed JU, Hassan MM, et al. Physiological and biochemical dissection reveals a trade-off between antioxidant capacity and heat tolerance in bread wheat (Triticum aestivum L.). Antioxidants. 2021;10(3):351. doi:10.3390/antiox10030351. [Google Scholar] [PubMed] [CrossRef]
30. Alvarado G, Rodríguez FM, Pacheco A, Burgueño J, Crossa J, Vargas M, et al. META-R: a software to analyze data from multi-environment plant breeding trials. Crop J. 2020;8:745–56. doi:10.1016/j.cj.2020.03.010. [Google Scholar] [CrossRef]
31. R Core Team. R: a language & environment for statistical computing. Vienna, Austria: R Foundation for Statistical Computing; 2022. [Google Scholar]
32. Bates D, Machler M, Bolker B, Walker S. Fitting linear mixed-effects models using lme4. J Stat Softw. 2015;67:1–48. doi:10.18637/jss.v067.i01. [Google Scholar] [CrossRef]
33. Steel RGD, Torrie JH, Dicky DA. Principles and procedures of statistics, a biometrical approach. 3rd ed. New York, NY, USA: McGraw Hill, Inc. Book Co.; 1997. p. 352–8. [Google Scholar]
34. Hasan MN, Badsha MB, Mollah MNH. Robust hierarchical co-clustering to explore toxicogenomic biomarkers and their regulatory doses of chemical compounds. bioRxiv. 2020;9:49–6. doi:10.1101/2020.05.13.094946. [Google Scholar] [CrossRef]
35. Wickham H. ggplot2: elegant graphics for data analysis. New York, NY, USA: Springer; 2016. [Google Scholar]
36. Lê S, Josse J, Husson F. FactoMineR: an R package for multivariate analysis. J Stat Softw. 2008;25:1–18. doi:10.18637/jss.v025.i01. [Google Scholar] [CrossRef]
37. Ahammed GJ, Guang Y, Yang Y, Chen J. Mechanisms of elevated CO2-induced thermotolerance in plants: the role of phytohormones. Plant Cell Rep. 2021;40:2273–86. doi:10.1007/s00299-021-02751-z. [Google Scholar] [PubMed] [CrossRef]
38. Maulana F, Ayalew H, Anderson JD, Kumssa TT, Huang W, Ma XF. Genome-wide association mapping of seedling heat tolerance in winter wheat. Front Plant Sci. 2018;9:1272. doi:10.3389/fpls.2018.01272. [Google Scholar] [PubMed] [CrossRef]
39. Vargas Y, Mayor-Duran VM, Buendia HF, Ruiz-Guzman H, Raatz B. Physiological and genetic characterization of heat stress effects in a common bean RIL population. PLoS One. 2021;16:e0249859. doi:10.1371/journal.pone.0249859. [Google Scholar] [PubMed] [CrossRef]
40. Adam AMMG, Jahan N, Rashid P. Changes in photosynthetic pigment of wheat (Triticum aestivum L. var. BARI Gom-25) as affected by NAA and N-fertilizer. Dhaka Univ J Biol Sci. 2022;31(1):169–76. doi:10.3329/dujbs.v31i1.57925. [Google Scholar] [CrossRef]
41. El-Mohsen AAA, El-Shafi MAA, Gheith EMS, Suleiman HS. Using different statistical procedures for evaluating drought tolerance indices of bread wheat genotypes. Adv Agric Biol. 2015;4(1):19–30. doi:10.15192/PSCP.AAB.2015.4.1.1930. [Google Scholar] [CrossRef]
42. Al-Naggar AMM, El-Shafi MAEA, El-Shal MH, Anany AH. Evaluation of Egyptian wheat landraces (Triticum aestivum L.) for drought tolerance, agronomic, grain yield and quality traits. Plant Archives. 2020;20(1):3487–3504. doi:10.9734/arrb/2020/v35i230186. [Google Scholar] [CrossRef]
43. Porkabiri Z, Sabaghnia N, Ranjbar R, Maleki HH. Genetic variation of some tobacco (Nicotiana tabacum L.) genotypes by morphological traits. Sci Agric Bohemica. 2019;50:1–7. doi:10.2478/sab-2019-0001. [Google Scholar] [CrossRef]
44. Coates BS, Siegfried BD. Linkage of an ABC transporter to a single QTL that controls Ostrinia nubilalis larval resistance to the Bacillus thuringiensis Cry1Fa toxin. Insect Biochem Mol Biol. 2015;63:86–96. doi:10.1016/j.ibmb.2015.06.003. [Google Scholar] [PubMed] [CrossRef]
45. Anjum SA, Ashraf U, Zohaib A, Tanveer M, Naeem M, Ali I, et al. Growth and development responses of crop plants under drought stress: a review. Zemdirbyste. 2017;104(3):267–76. doi:10.13080/z-a.2017.104.034. [Google Scholar] [CrossRef]
Cite This Article
 Copyright © 2025 The Author(s). Published by Tech Science Press.
This work is licensed under a Creative Commons Attribution 4.0 International License , which permits unrestricted use, distribution, and reproduction in any medium, provided the original work is properly cited.
 Downloads
 Citation Tools