
 Submit a Paper
 Propose a Special lssue
 Open Access
ARTICLE

Process Monitoring and Terminal Verification of Cable-Stayed Bridges with Corrugated Steel Webs under Contruction
School of Transportation and Geomatics Engineering, Shenyang Jianzhu University, Shenyang, 110168, China
* Corresponding Author: He Liu. Email:
Structural Durability & Health Monitoring 2023, 17(2), 131-158. https://doi.org/10.32604/sdhm.2023.023431
Received 26 April 2022; Accepted 09 August 2022; Issue published 09 May 2023
 View Full Text
 Download PDF
Abstract
In this paper, the construction process of a cable-stayed bridge with corrugated steel webs was monitored. Moreover, the end performance of the bridge was verified by load test. Owing to the consideration of the bridge structure safety, it is necessary to monitor the main girder deflection, stress, construction error and safety state during construction. Furthermore, to verify whether the bridge can meet the design requirements, the static and dynamic load tests are carried out after the completion of the bridge. The results of construction monitoring show that the stress state of the structure during construction is basically consistent with the theoretical calculation and design requirements, and both meet the design and specification requirements. The final measured stress state of the structure is within the allowable range of the cable-stayed bridge, and the stress state of the structure is normal and meets the specification requirements. The results of load tests show that the measured deflection values of the mid-span section of the main girder are less than the theoretical calculation values. The maximum deflection of the girder is −20.90 mm, which is less than −22.00 mm of the theoretical value, indicating that the girder has sufficient structural stiffness. The maximum impact coefficient under dynamic load test is 1.08, which is greater than 1.05 of theoretical value, indicating that the impact effect of heavy-duty truck on this type of bridge is larger. This study can provide important reference value for construction and maintenance of similar corrugated steel web cable-stayed bridges.Keywords
With the development of modern bridge technology, the span capacity of long-span bridges has developed rapidly. However, in long-span bridges, for continuous girder bridges and continuous rigid frame bridges with traditional concrete box girders, the structural self-weight accounts for more than 80% of the total load, and most of the bearing capacity of the structure is consumed on the self-weight, not used to bear the vehicle load [1]. Facing the problems of self-weight and inconvenience in construction of traditional concrete box girder bridge, PC (plate composite) structure bridge with corrugated steel web emerges as the times require. In 1986, the world’s first corrugated steel web PC composite girder bridge-Cognac Bridge was built in France [2]. In 1993, Japan built the first corrugated steel web simply supported box girder bridge-Shinkaibashi Bridge. At the beginning of the 21st century, Omi Otori Bridge, the world’s first cable-stayed bridge with corrugated steel webs, was built in Japan. The completion of Omi Otori Bridge indicated that the cable-stayed bridge with corrugated steel web had entered the stage of engineering practical application [3–6].
PC composite box girder with corrugated steel webs is a composite box girder structure composed of concrete flange plates of top and bottom plates and corrugated steel webs, and equipped with prestressed system. Because the corrugated steel web is relatively thin and its stiffness is less than that of the traditional concrete box girder, some diaphragms will be set in the actual project to prevent the torsion and deformation of the structure [7–10]. PC composite girder with corrugated steel webs makes full use of the advantages of high compressive strength of concrete and high shear strength of corrugated steel webs, which improves the service efficiency of materials. The use of steel web avoids the traditional prestressed concrete box girder [11–14].
Cable-stayed bridge belongs to high-order statically indeterminate structure, which is characterized by high coupling between design and construction. The construction method, construction sequence and material performance of cable-stayed bridge will directly affect the structural internal force distribution and bridge line type in the completed state [15–18]. Due to the complex stress of corrugated steel web, in order to ensure the safety of the bridge, it is necessary to conduct detailed analysis and construction monitoring in each construction stage of cable-stayed bridge. After the completion of cable-stayed bridge, load test is needed to evaluate the service performance of the bridge. Through the static load, engineers can measure the stress and deflection of the control section of the bridge span structure under the test load, and compare it with the theoretical calculation value, so as to check whether the stress and deflection of the structure control section are consistent with the design requirements and evaluate the current bearing capacity of the bridge span structure. Through dynamic load test, the overall dynamic performance of the structure and the dynamic performance under vehicle load are evaluated, so as to provide original data for bridge maintenance, management, reinforcement, repair or reconstruction in the future [19–22].
This paper takes the construction monitoring and load test of a cable-stayed bridge with corrugated steel webs as an example. To ensure the safety of cable-stayed bridge structure in construction and achieve the internal force state of the completed bridge, the changes of main girder line type, main girder stress and cable force before and after deck system pavement are monitored. At the same time, to verify whether the bridge can meet the design requirements, the static and dynamic load test after completion is carried out. This study can provide important reference value for the construction and design of similar cable-stayed bridges.
The cable-stayed bridge is in the North of Chaoyanggou reservoir of Zhengzhou Dengfeng expressway reconstruction project and crosses Chaoyanggou reservoir. The structural form of cable-stayed bridge is PC girder Partial Cable-stayed Bridge with corrugated steel webs, and the structural system is continuous rigid frame. The elevation after the completion of the whole bridge is shown in Fig. 1. The total length of the cable-stayed bridge is 472 m, and the layout form of the longitudinal bridge direction is 58 + 118 + 118 + 108 = 472 m. The total width of the bridge deck is 35 m, and the layout of the cross section is 3.0 m (sidewalk) + 1.5 m (cable area) + 12.5 m (motorway) + 1.0 m (guardrail) + 12.5 m (motorway) + 1.5 m (cable area) + 3.0 m (sidewalk). The design speed is 80 km/h, and the load specification adopts highway class I.
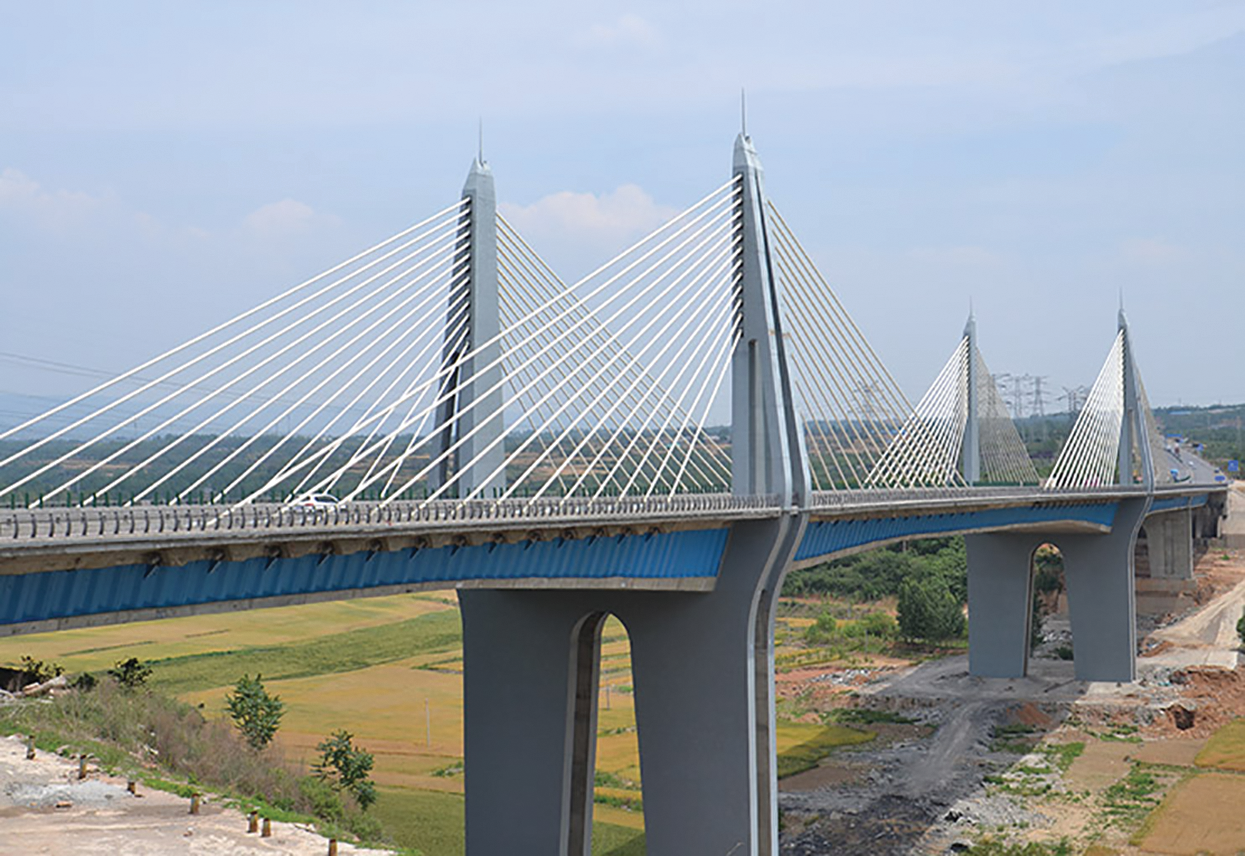
Figure 1: Photo of the bridge
The main girder adopts a single box four chamber inclined web section, the width of the top plate is 35.0 m. The beam height varies linearly from 4.5 to 7.0 m near the top of the pier. The thickness of the bottom plate of each girder section ranges from 100~28 cm from the cantilever root to the girder 9#, which varies in a straight line. The thickness of the top plate of the box girder: 150 cm for girder 0 and 30 cm for the rest. The main girder is made of C55 concrete. Pier 1 adopts solid thin-wall pier, C40 concrete, and its top adopts basin support. The elevation and top view of the cable-stayed bridge are shown in Figs. 2 and 3. Pier 2 and Pier 3 adopt double thin-walled solid piers. And Pier 2 and Pier 3, composed of C50 concrete, are consolidated with the main beam and main tower. Besides, C40 concrete is used for bearing platform and C30 concrete is used for pile foundation. The main tower is arranged between the carriageway and the sidewalk and is designed as double tower columns. It adopts a combined reinforced concrete structure. The height above the bridge deck of the main tower is 33 m. The vertical tower column adopts a longitudinal rectangular section. The width changes linearly from 6.4 to 3.5 m near the root of the main tower, and the transverse width is 1.5 m. The outer auxiliary tower adopts double leg rectangular section with section size of 1.6 m × 1.0 m, the cross section of the auxiliary tower is arranged obliquely on the tower top and combined with the vertical tower column. The anchorage of the stay cable on the tower top adopts the split wire pipe cable saddle structure.
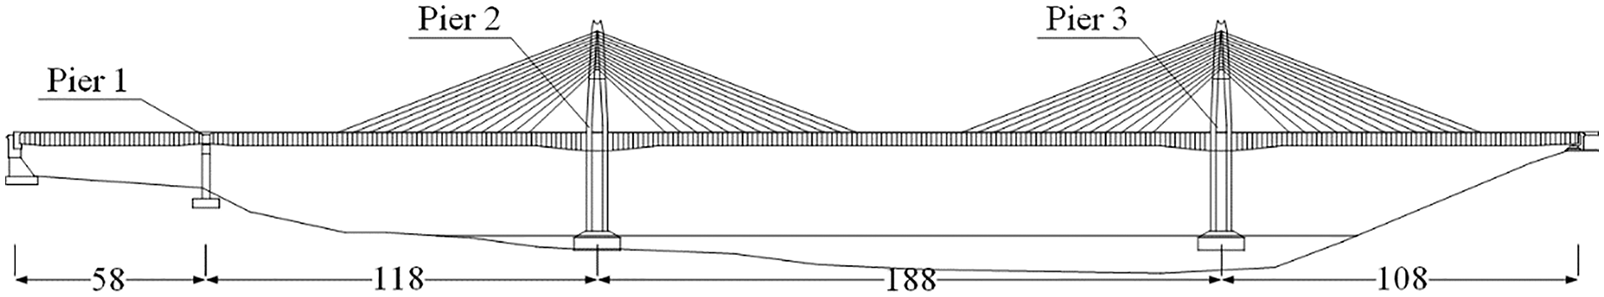
Figure 2: Elevation of the whole bridge (unit: m)
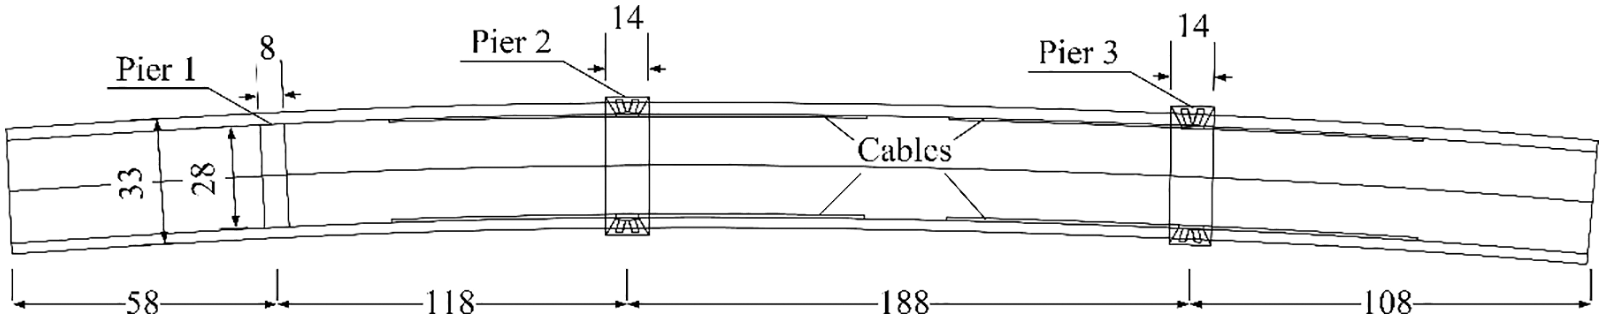
Figure 3: Top view of the whole bridge (unit: m)
The cross section of cable-stayed bridge is shown in Fig. 4. The stay cables are single row cables with double cable planes, which are arranged between the carriageway and the sidewalk. There are 52 pairs of cables in the whole bridge. The length of the cable free area of the main girder near the tower root is 40.0 m, the cable distance on the girder is 4.8 m, and the cable distance on the tower is 1.0 m. The stay cable is made of monofilament epoxy coated steel strand. The thickness of corrugated steel web is 12~24 mm. The corrugated steel plate is connected with the concrete top plate with studs. The corrugated steel plate and the concrete base plate are connected in an embedded way. The longitudinal connection between corrugated steel web segments adopts lap joint and fillet welding connection. The connection between corrugated steel plate and concrete diaphragm adopts double PBL key.
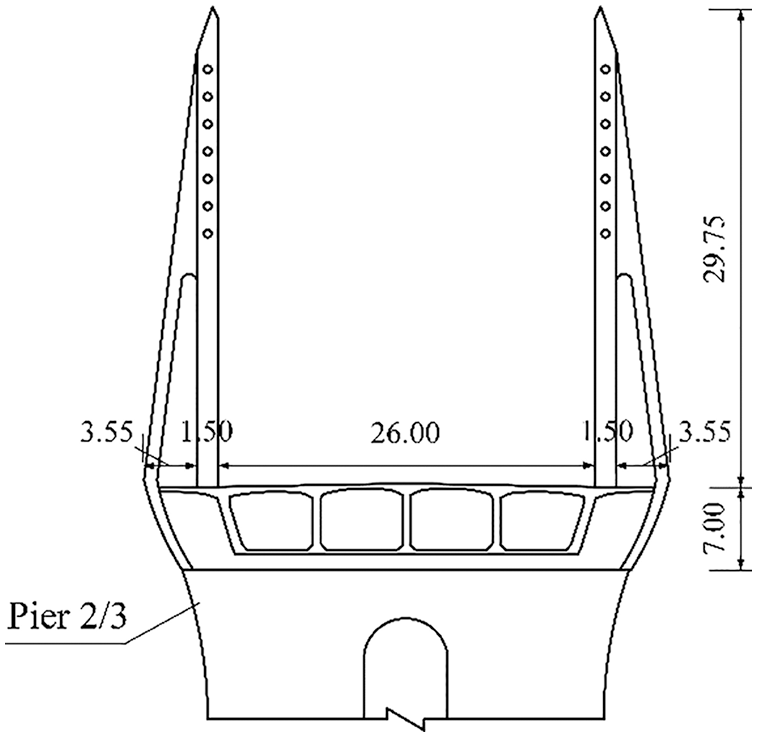
Figure 4: Cross section of the mid-span (unit: m)
The main girder of the bridge is divided into 18 girder sections for construction. Section division of the main girder is shown in Fig. 5.
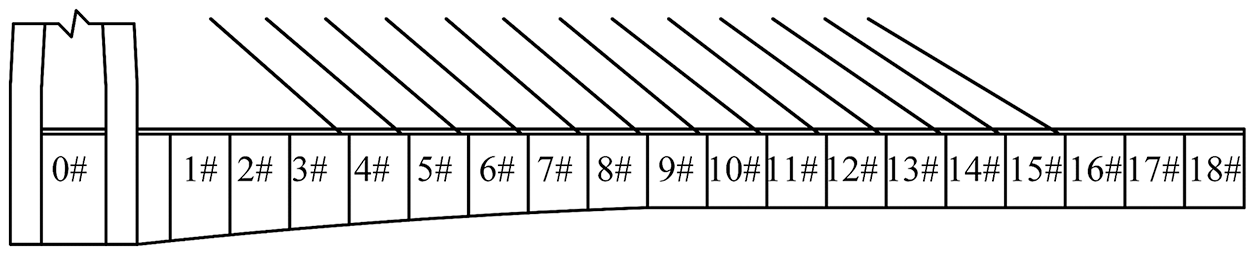
Figure 5: Division of girder sections
3 Construction Monitoring and Load Test
3.1 The Establishment of Finite Element Model
The finite element model of cable-stayed bridge is established by MIDAS/civil finite element analysis software. To facilitate calculation, based on fully considering the construction sequence and structural stress, spatial girder element is used for structural discretization in modeling. The calculation model of cable-stayed bridge is shown in Fig. 6.
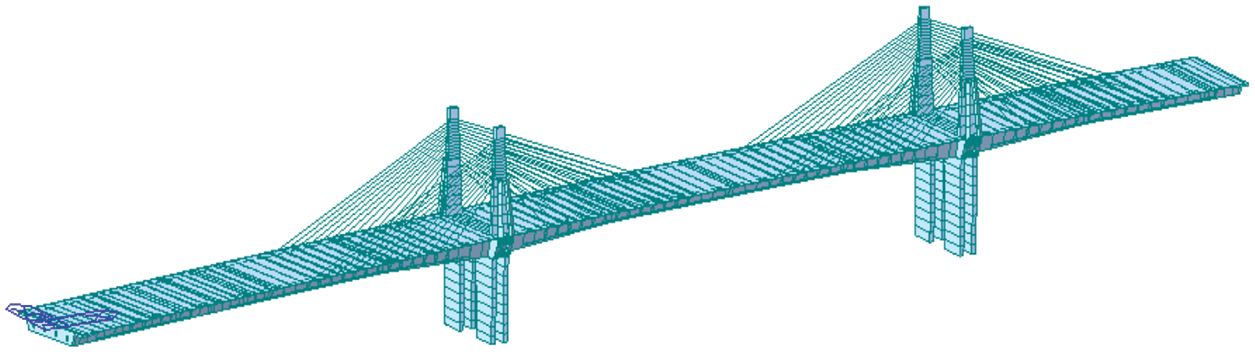
Figure 6: Finite element analysis model
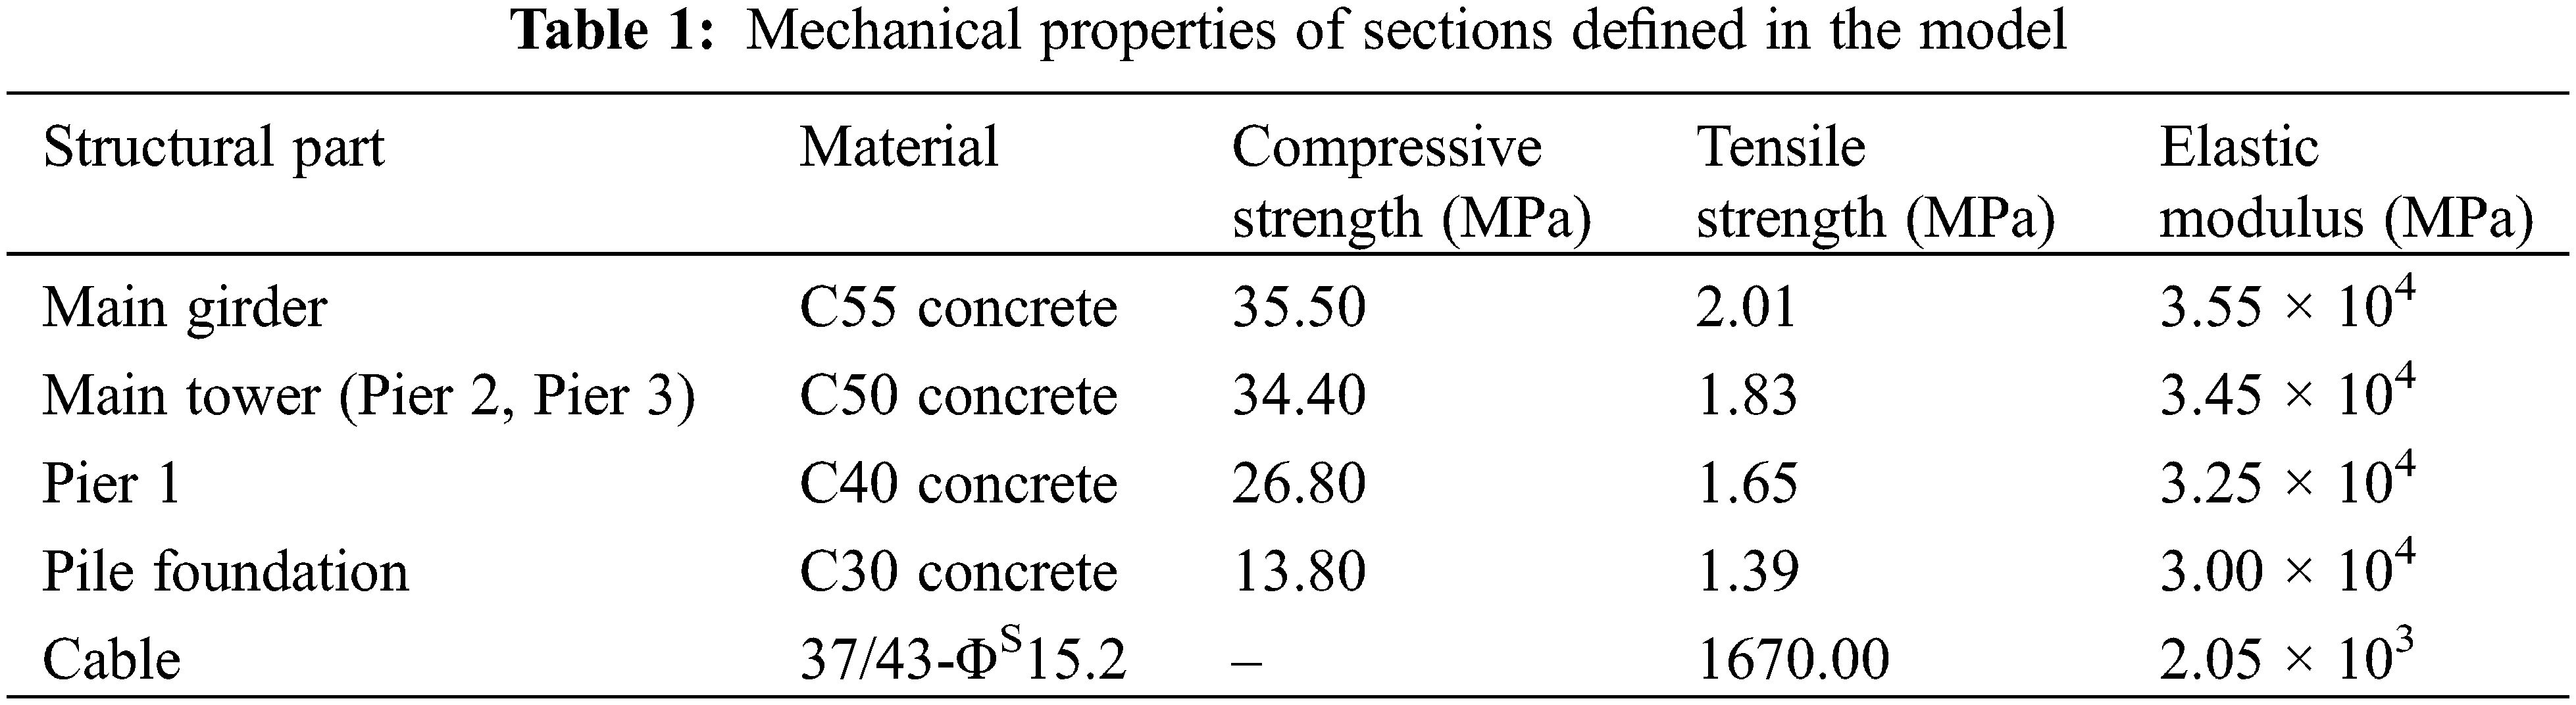
The definition of mechanical properties of different sections of pedestrian cable-stayed bridge in the finite element model is shown in Table 1. The main girder is defined as C55 concrete with elastic modulus E = 3.55 × 10⁴ MPa. The main tower is defined as C50 concrete with elastic modulus E = 3.45 × 10⁴ MPa. C40 and C30 concrete are defined for Pier 1 and pile foundation respectively. The cables adopt single wire epoxy coated steel strand with specification of 37-Φ 15.2 and 43-Φ 15.2 two specifications with tensile strength of 1670 MPa.
The bridge crosses the water surface of the reservoir area. The trestle bridge and drilling platform shall be built first, and steel sheet pile cofferdam shall be inserted after the construction of bearing platform foundation pile is completed. Finally the substructure such as cap and pier body shall be constructed successively. The construction of superstructure shall be carried out simultaneously with the main tower in combination with the specific construction organization design. After the construction of box girder 0# is completed, the hanging basket system shall be installed and preloaded, and each girder section shall be suspended poured in turn. After the girder 5# construction is completed, the girder 6# is moved forward in place, and the first stay cable is installed and tensioned. After that, a stay cable will be installed for each cantilever girder section. After the construction of girder 18# is completed, all stay cables will be installed and the first tensioning of all stay cables will be completed. During the construction of main girder on both sides of the main pier, the construction of cast-in-situ sections on the left and right sides shall be completed. For the jacking construction of the main span closure section, after the jacking operation is completed, lock the rigid skeleton of the main span closure section and complete the subsequent closure work. After the closure work is completed, the second tensioning and bridge deck pavement construction shall be carried out. The specific construction steps are shown in Fig. 7.
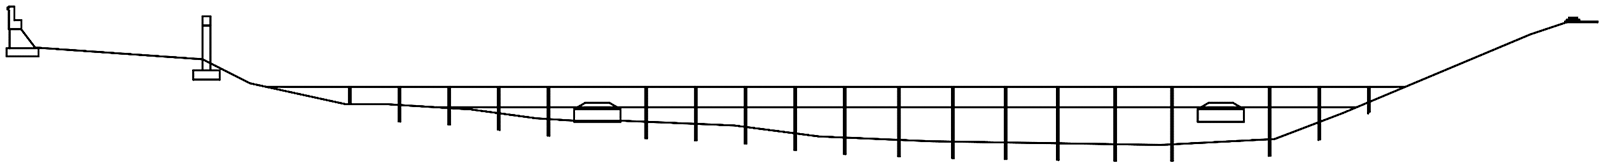
Figure 7a: Construction of substructure and foundation
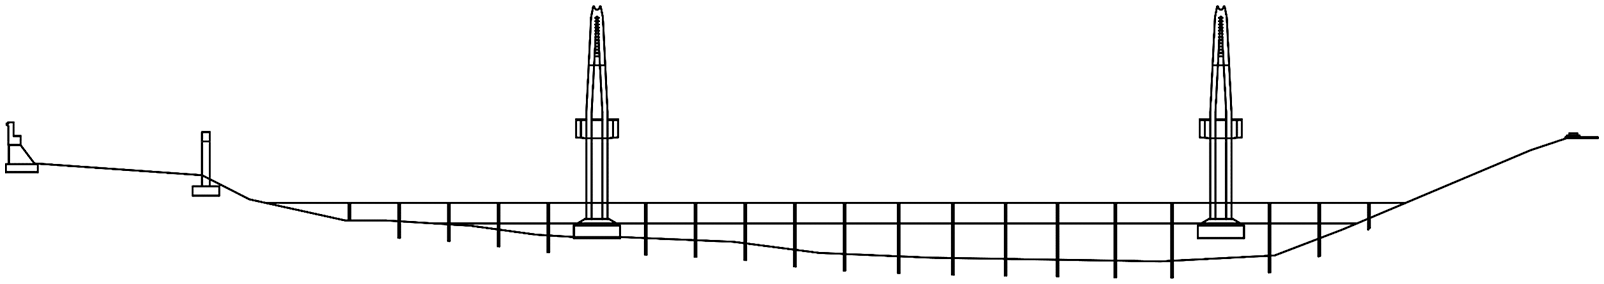
Figure 7b: Construction of main tower and girder 0#
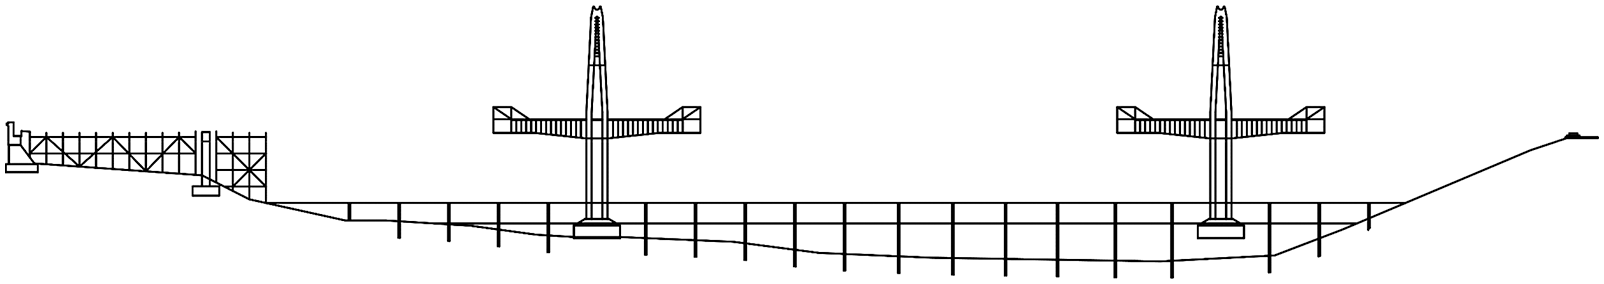
Figure 7c: Installing the hanging basket system and pouring it to the girder 5# in turn
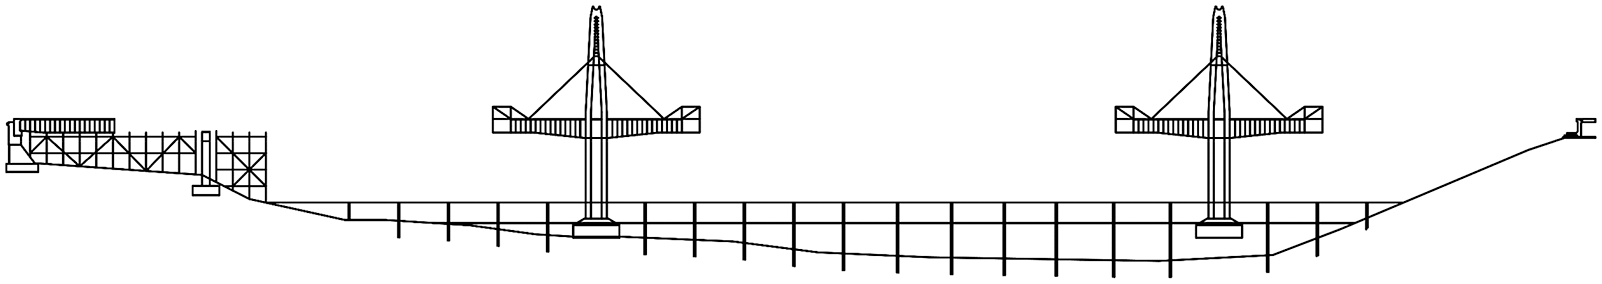
Figure 7d: Moving the hanging basket forward and installing the first cable

Figure 7e: Pouring until the girder 18#, and installing the cables at the same time
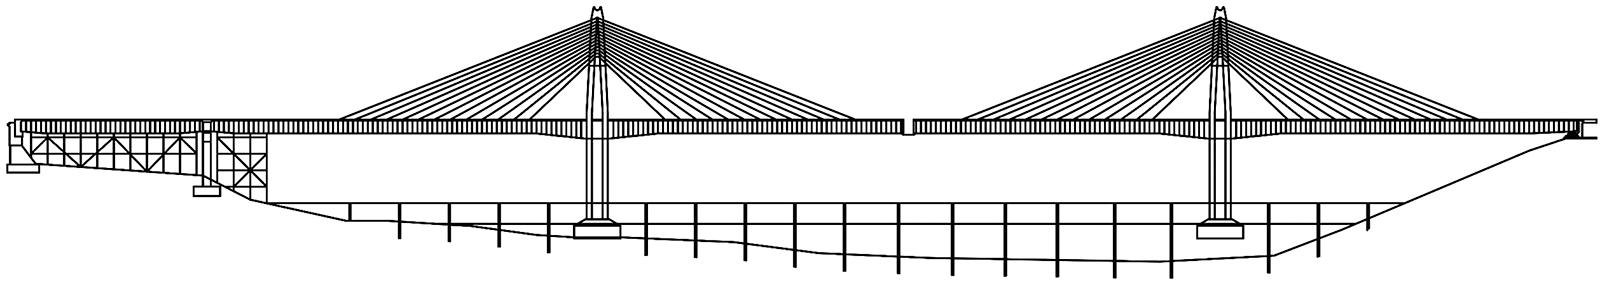
Figure 7f: First tensioning and closure of mid-span
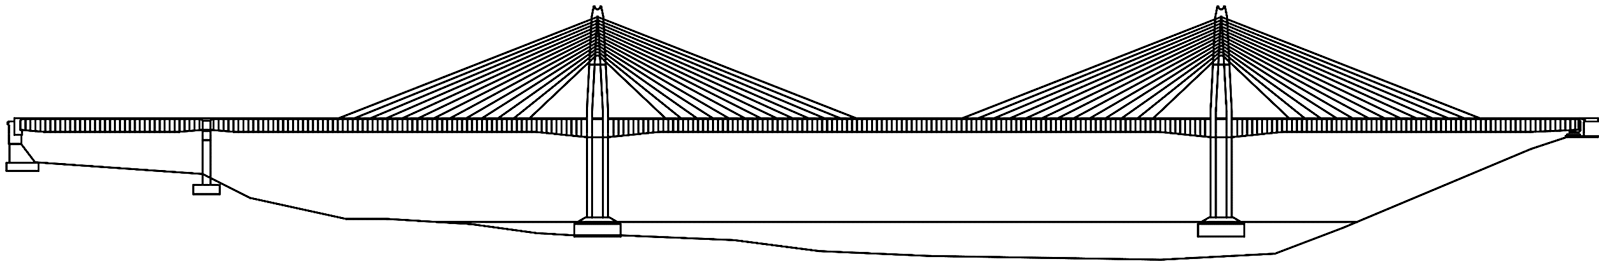
Figure 7g: Second tensioning, bridge deck system construction
3.3 Construction Monitoring Scheme
3.3.1 Layout of Measuring Points
The construction monitoring includes the linear monitoring of the cantilever section of the main girder, the stress monitoring of the main girder and the cable force monitoring of the stay cables. In the stress monitoring of the main girder, four test sections are defined. The distribution positions of the four test sections are shown in Fig. 8a. They are F1 and F2 on both sides of Pier 2 and F3 and F4 on both sides of Pier 3. To monitor the cable force of stay cables, 104 cables of the whole bridge are divided into 8 groups. The naming method of each group is shown in Fig. 8b. Taking the group of stay cables ‘P2NW’ as an example, ‘P2’ represents the stay cables on both sides of Pier 2, ‘NW’ represents the group of stay cables in the northwest direction of Pier 2.
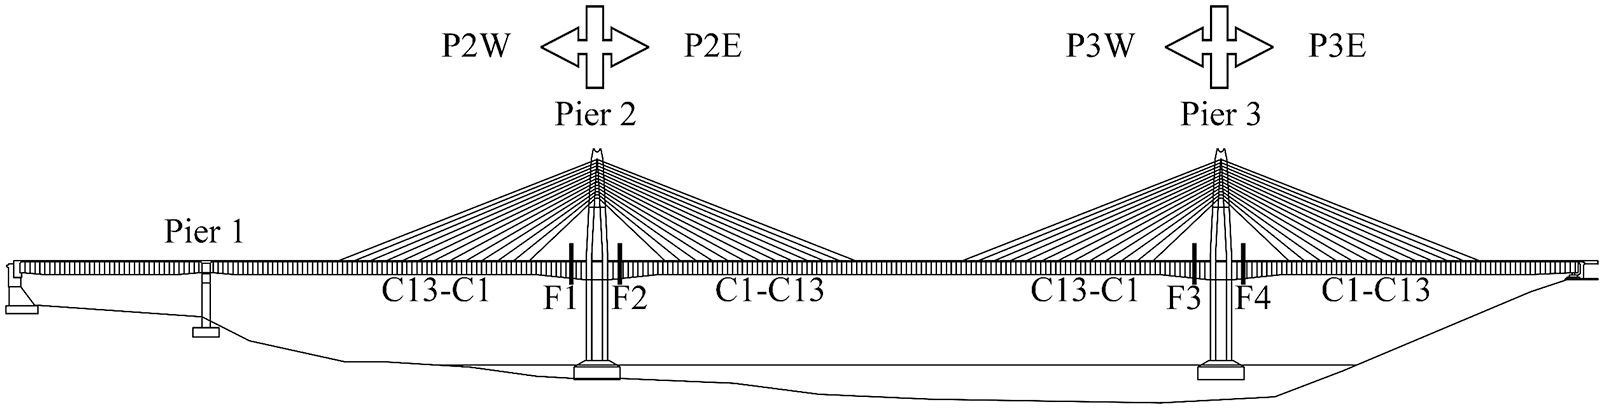
Figure 8a: Layout of measuring points and section division of the elevation of cable-stayed bridge
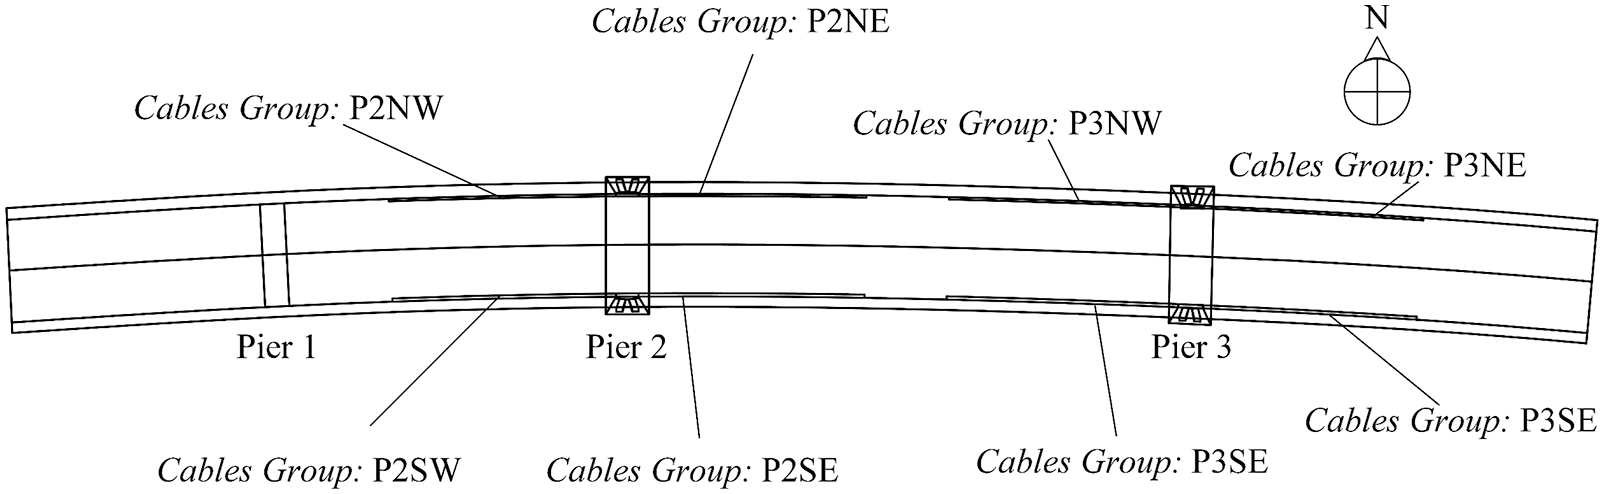
Figure 8b: Groups of stay-cables
3.3.2 Linear Monitoring of Cantilever Section of Main Girder
To ensure that the linear error of cable-stayed bridge meets the specification requirements after the completion of each construction stage, total station and level are used to track and monitor the displacement of corrugated steel web box girder in cantilever construction stage. The girder 0# and girder 1# are cast-in-situ on the Berry girder and girder 2# to girder 18# are cantilevered on the cradle. The results of line shape monitoring can analyze the line shape changes of each section during the cantilever casting construction stage and pushing process. Then the height difference of the closure section is analyzed and compared to prepare the closure construction. Linear monitoring is one of the important indexes to evaluate whether the bridge meets the requirements of design and specification.
3.3.3 Main Girder Stress Monitoring
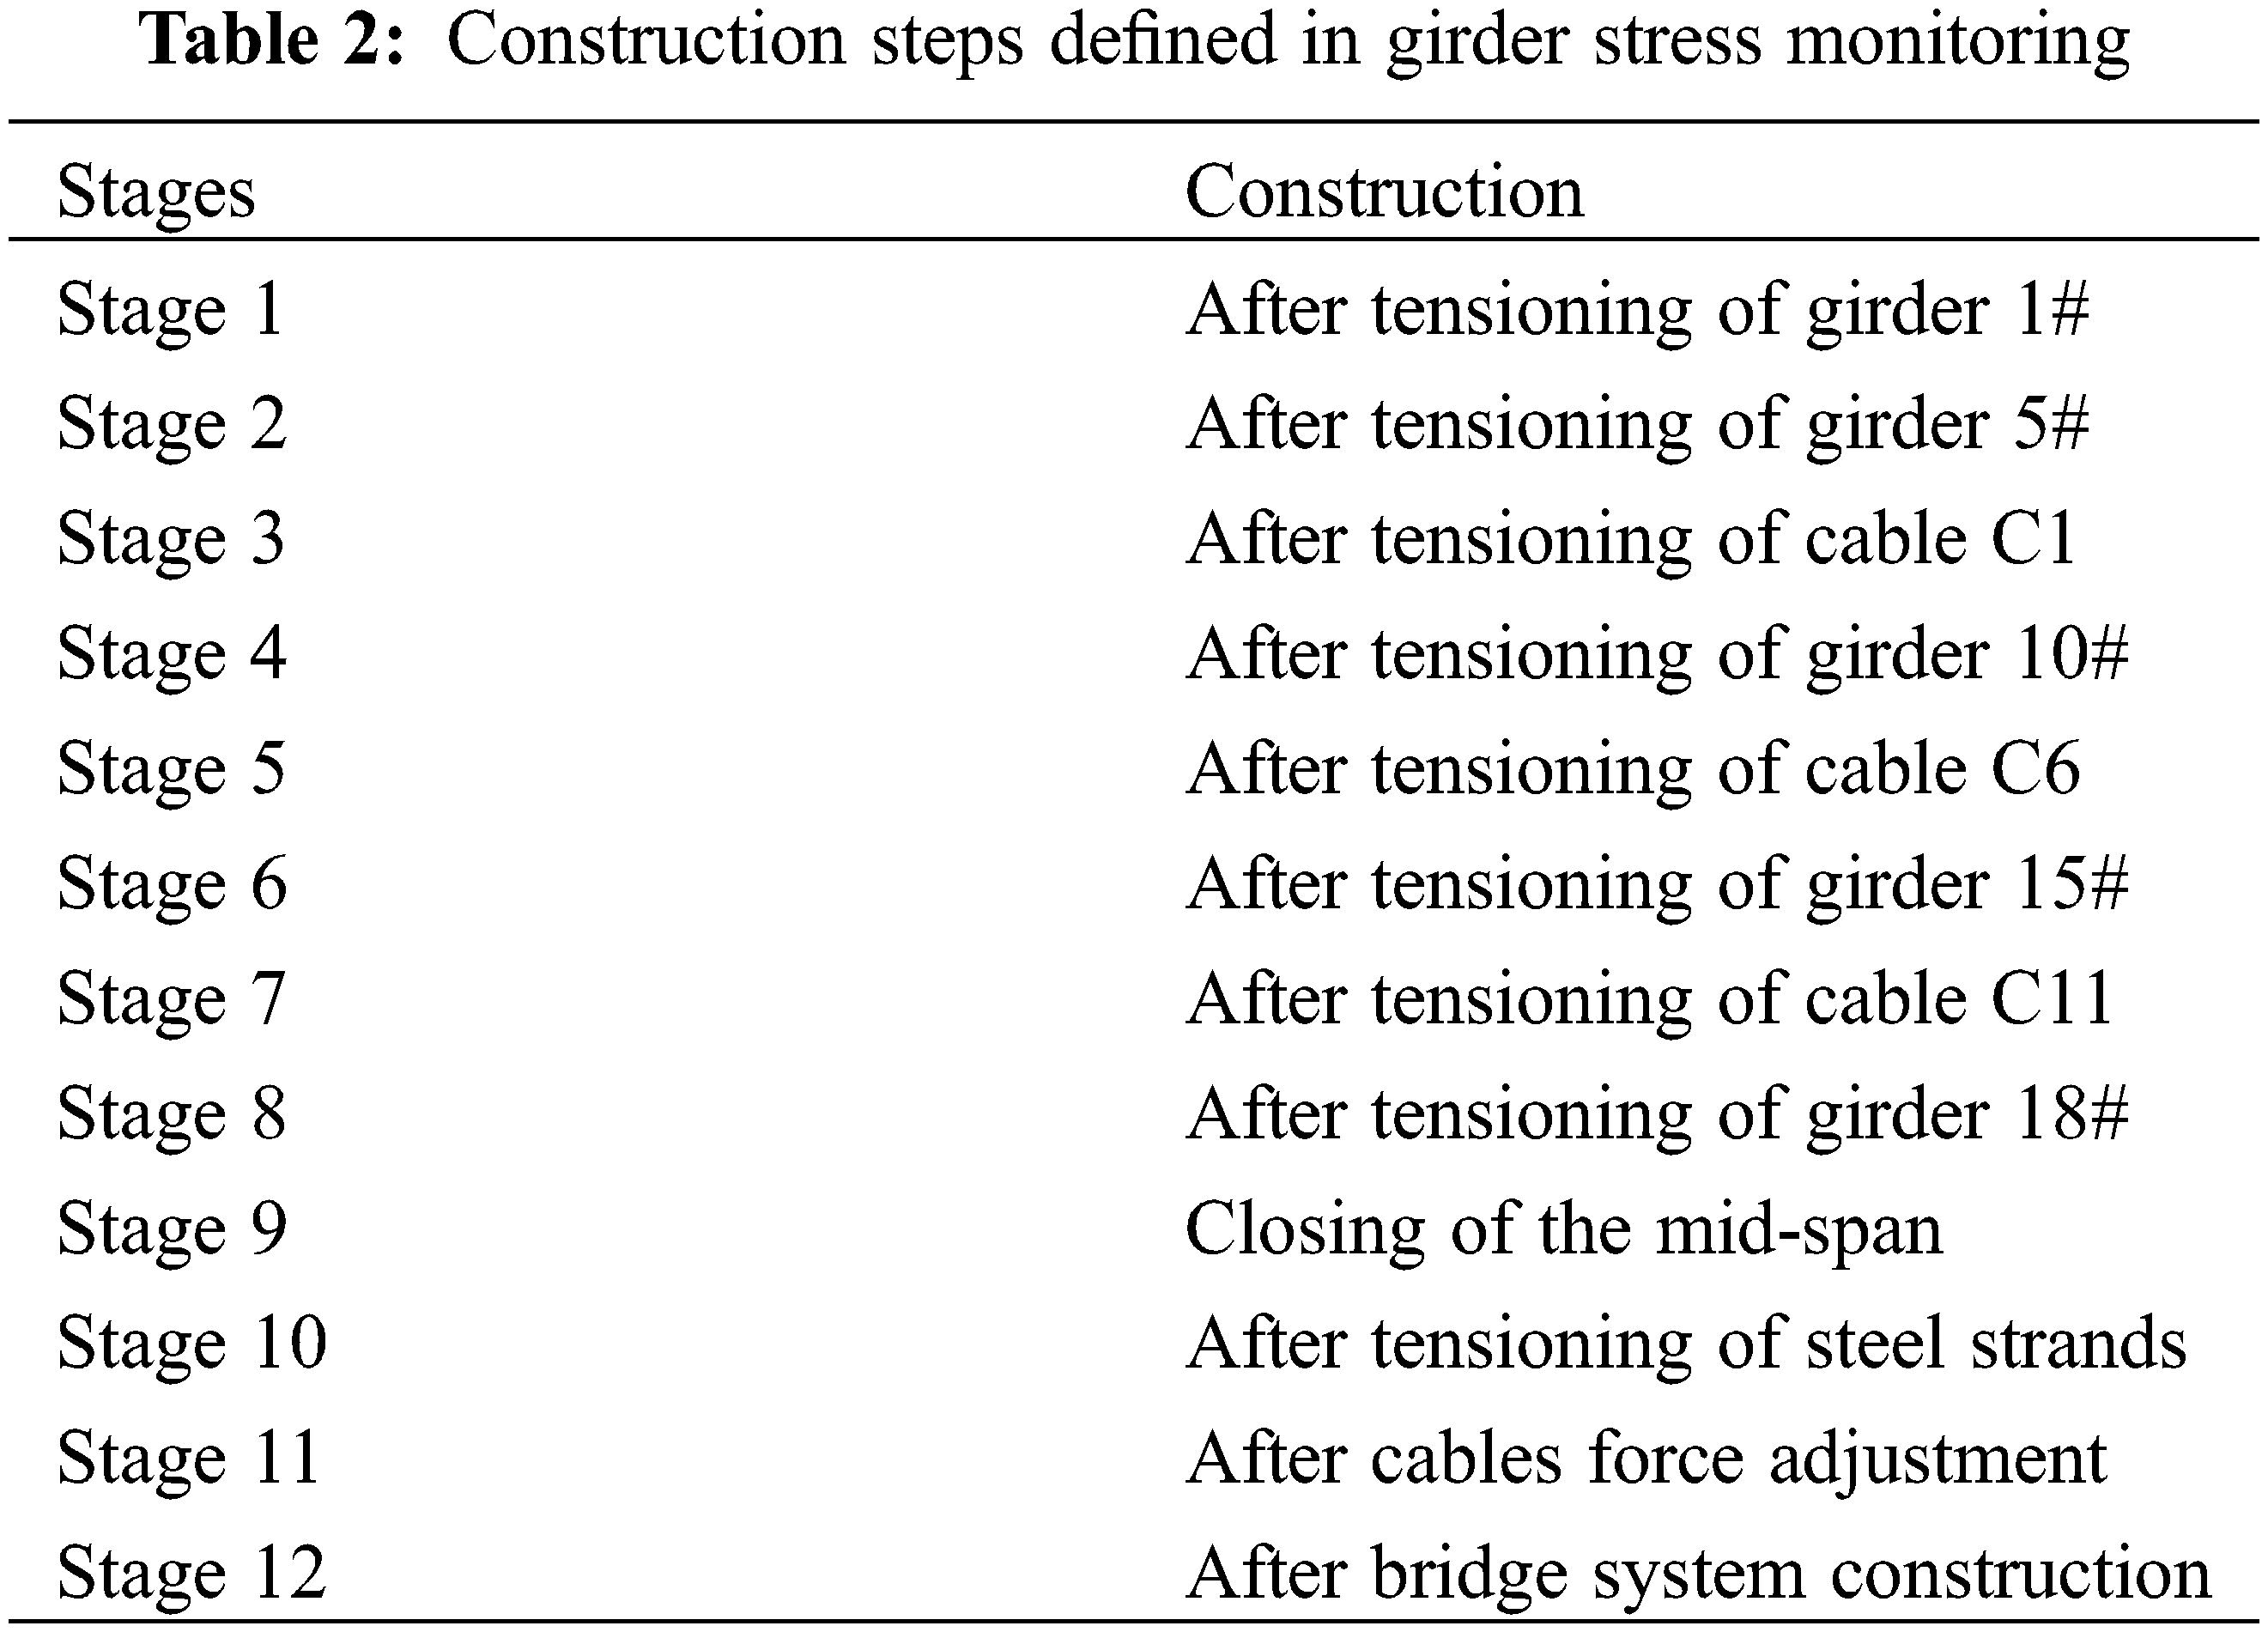
Cable-stayed bridge construction process is complicated. Real-time and accurate understanding of the stress state of corrugated steel web girder during construction can not only warn the stress safety of main girder, but also check the theoretical parameters, which can provide basis for construction control. It is impossible to completely agree the physical-mechanical or time parameters used in design calculation with the corresponding parameters in actual engineering. The actual stress of the structure may not reach the expected result of design calculation. Therefore, it is necessary to monitor and measure the construction stress of the main girder control section in the construction stage to provide reference data for design and construction control, so as to ensure the safety and quality of the bridge. In order to monitor the stress of the cable-stayed bridge, 12 construction steps are defined, and the specific information of each construction step is shown in Table 2.
Cable tension can directly affect the internal force and alignment of the main girder. Cable tension state in some cable-stayed bridges is an indicator reflecting the internal force state of the whole bridge. It is one of the main tasks of construction process monitoring system to determine cable forces during construction and completion stages with special equipment. Cable force monitoring uses a spectrum analysis method. The frequency spectrum analysis method uses a highly sensitive sensor attached to the cable to pick up the vibration signal of the cable excited by ambient vibration. The vibration signal is filtered, amplified and spectrum analyzed. Then the natural frequency of the cable is determined according to the spectrum diagram. Finally, the cable force is determined according to the relationship between the natural frequency and the cable force. Considering the influence of cable bending stiffness, calibration before measurement should be performed and corrected during measurement. There are 8 groups of 104 cables in the cable-stayed bridge. The serial numbers of each group is shown in Fig. 9. Photos of cable tension monitoring are shown in Fig. 10.
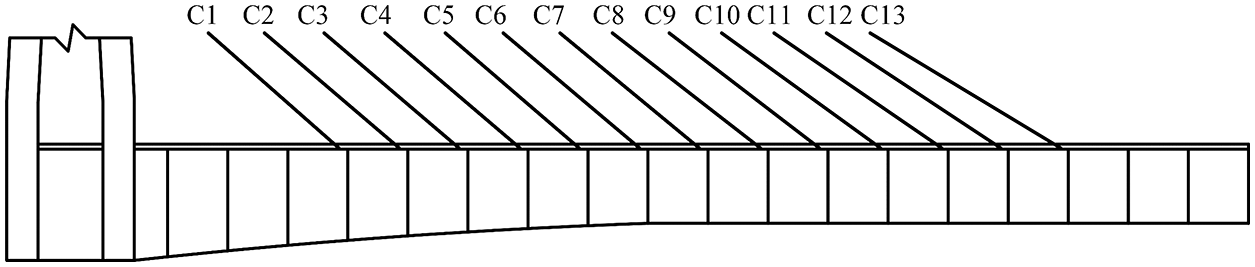
Figure 9: Cable serial numbers defined in cable force monitoring
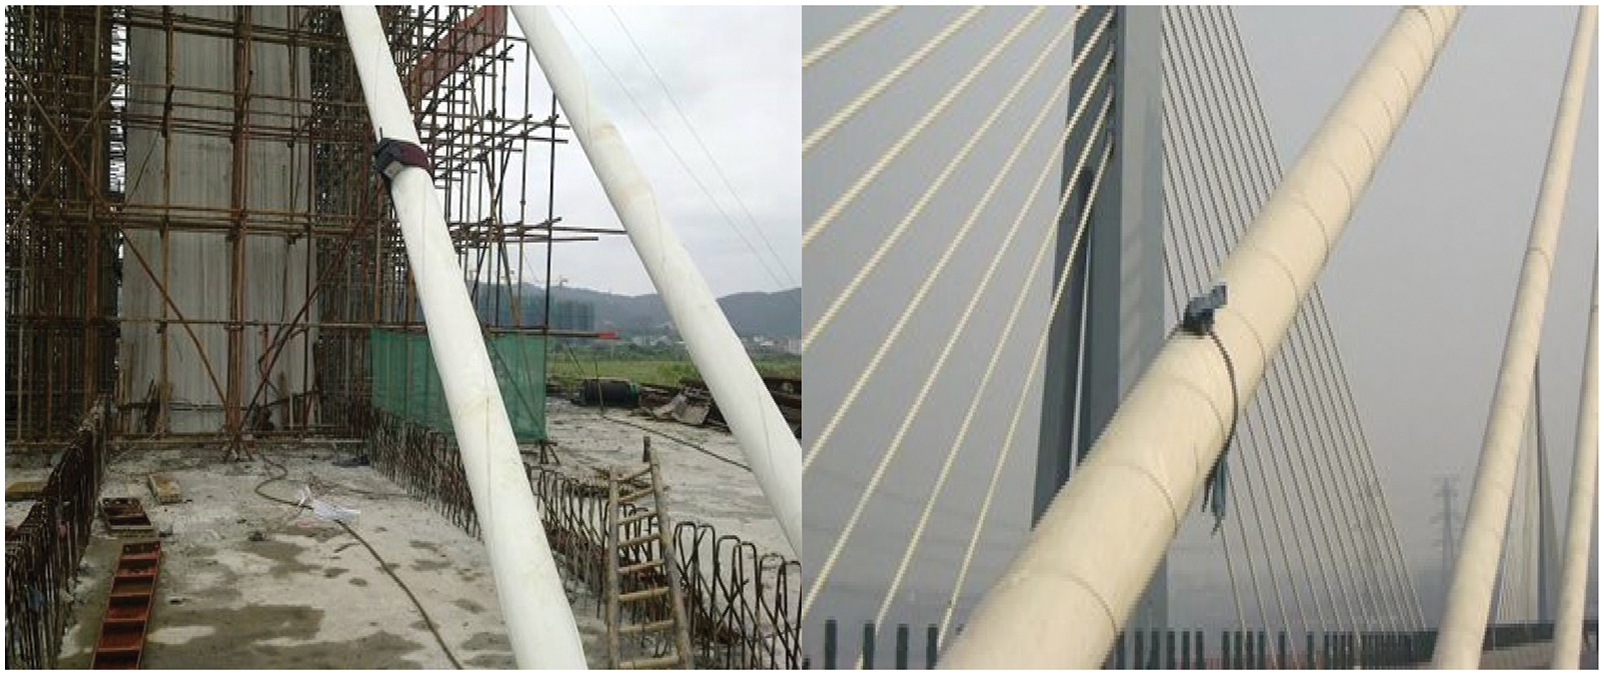
Figure 10: Photos of cable tension monitoring
Bridge static load test is mainly to determine the actual bearing capacity of bridge structure by measuring the stress and structural deformation of each control section under static load and their distribution law, so as to determine whether the actual working state of bridge structure matches the design expectation. It is the most direct and effective way to check bridge performance (structural strength, rigidity, etc.) and working state. According to the structural stress characteristics of cable-stayed bridge and the concrete construction conditions, the test section is determined as the second span mid-section, the third span mid-section and the fourth span mid-section. The test contents are shown in Table 3. Photos of static load test are shown in Fig. 11.
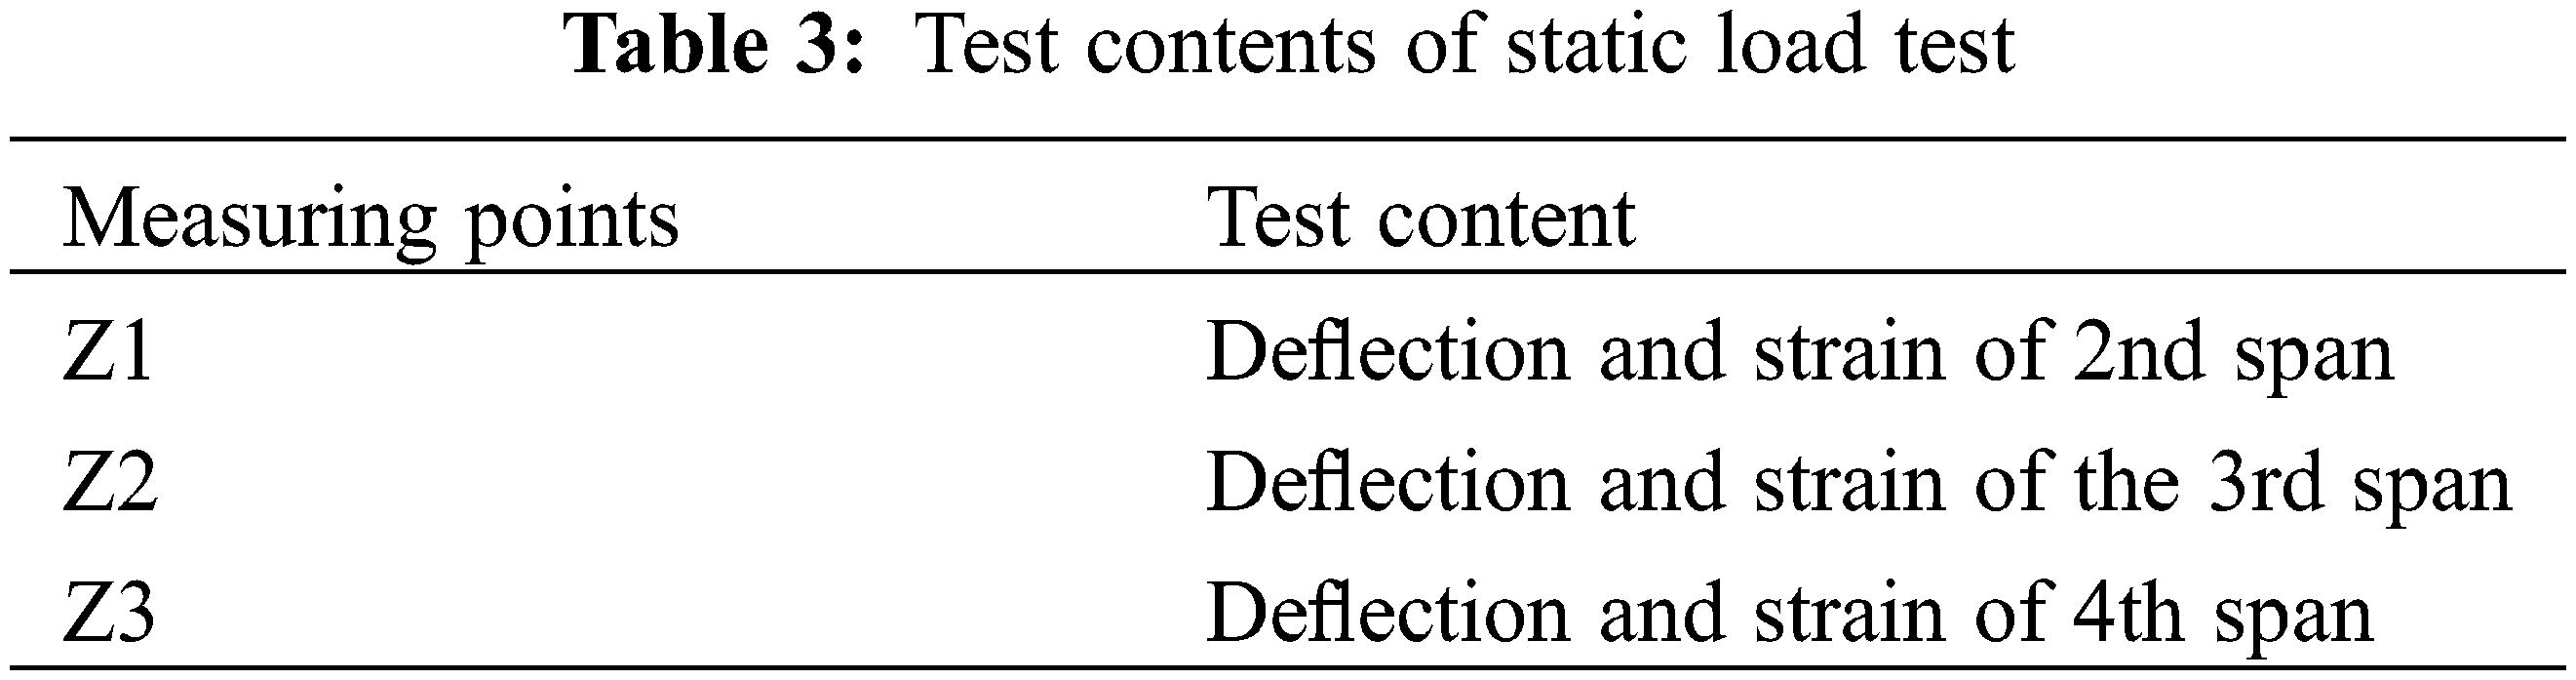
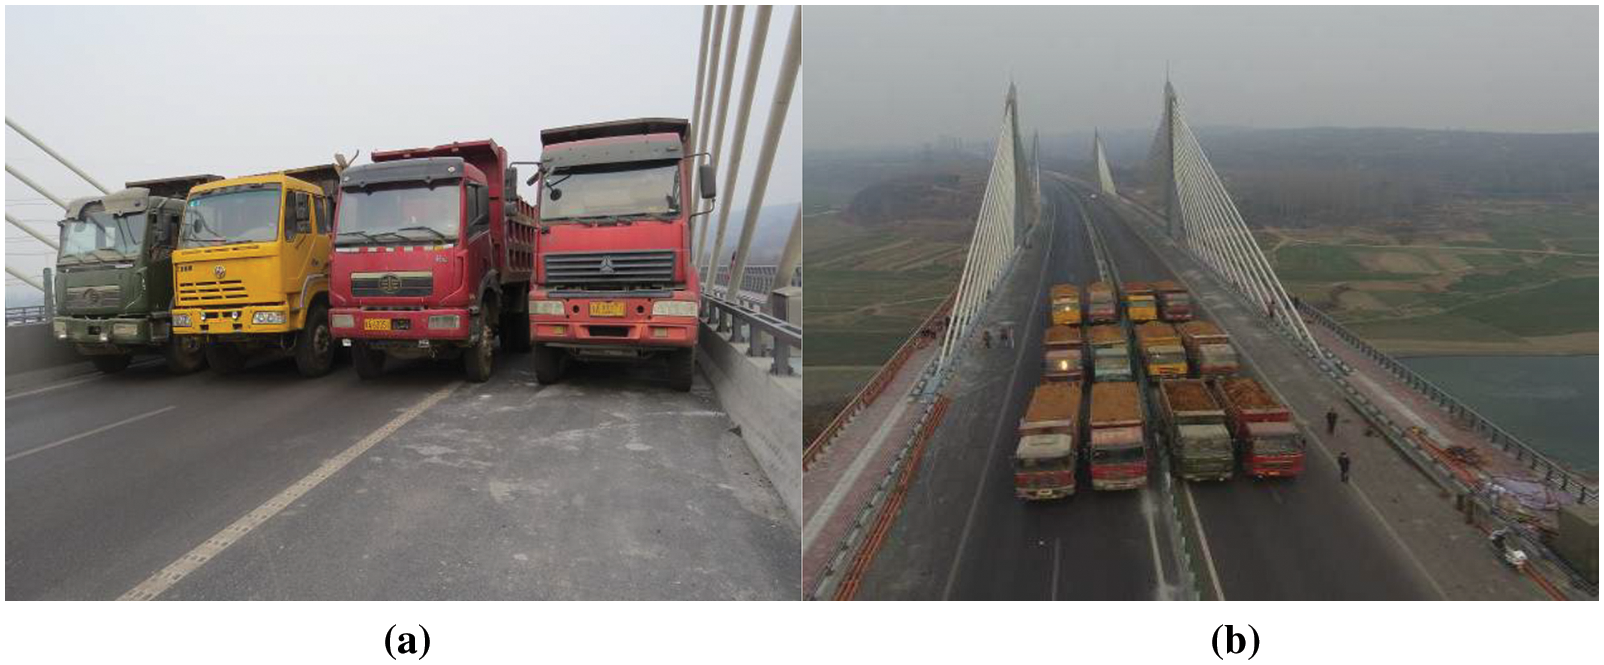
Figure 11: Photos of static load test
3.4.2 Arrangement of Test Vehicles and Measuring Points
In the static load test, three test sections are defined. The distribution positions of the three test sections are shown in Fig. 12a. The three test sections are located in the middle of the second span, the third span and the fourth span respectively. The cross section of the measuring point arrangement is shown in Fig. 12b. The strain gauges and deflectometers are arranged at the top plate of the main girder with corrugated steel web.
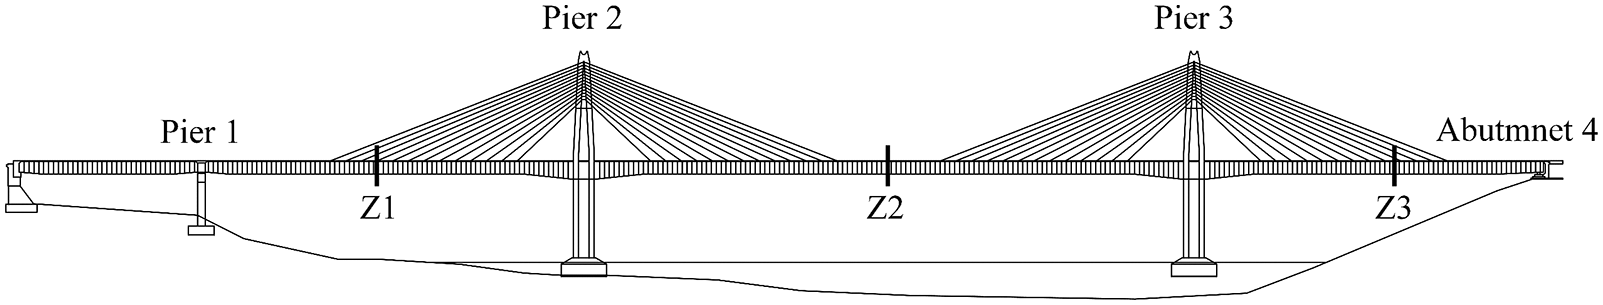
Figure 12a: Elevation of measuring point layout
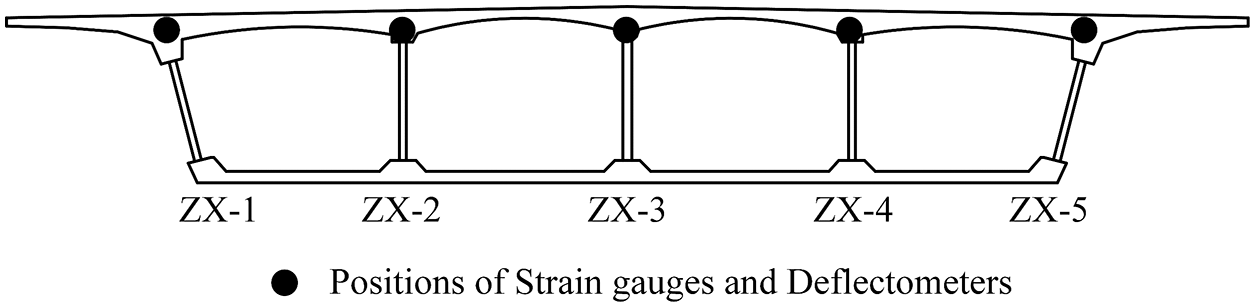
Figure 12b: Cross section of measuring point layout
The internal force influence lines of each cross control section are shown in Fig. 13.
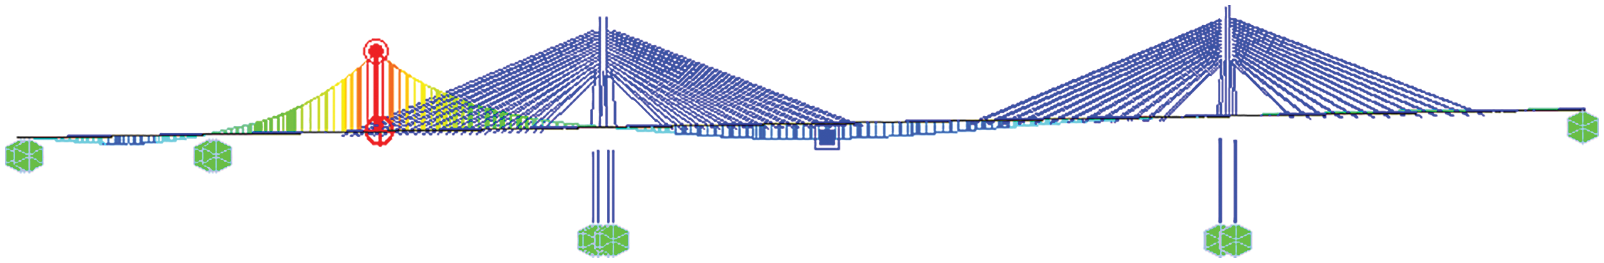
Figure 13a: Influence line of internal force across Z2 section at 118m
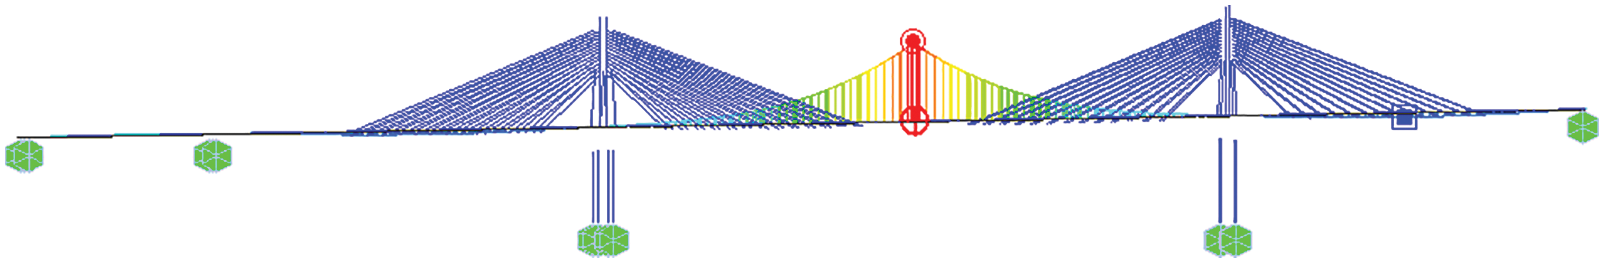
Figure 13b: Influence line of internal force across Z2 section at 188m
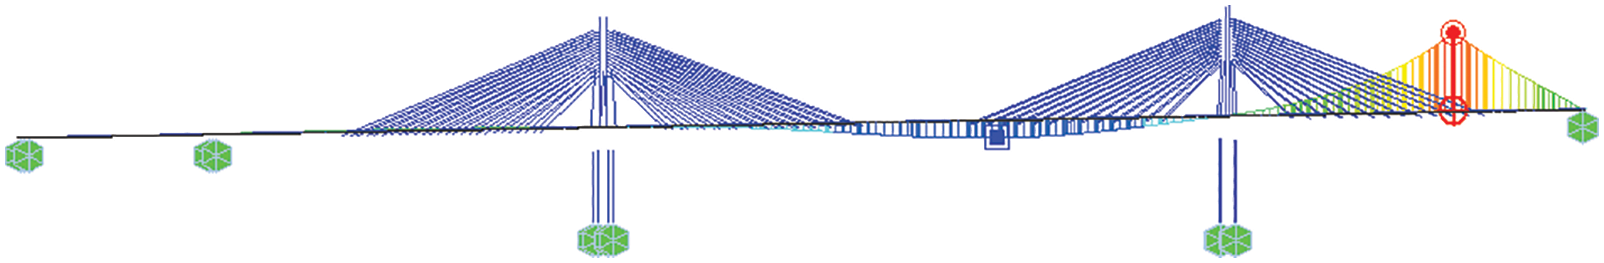
Figure 13c: Influence line of internal force across Z3 section at 108m
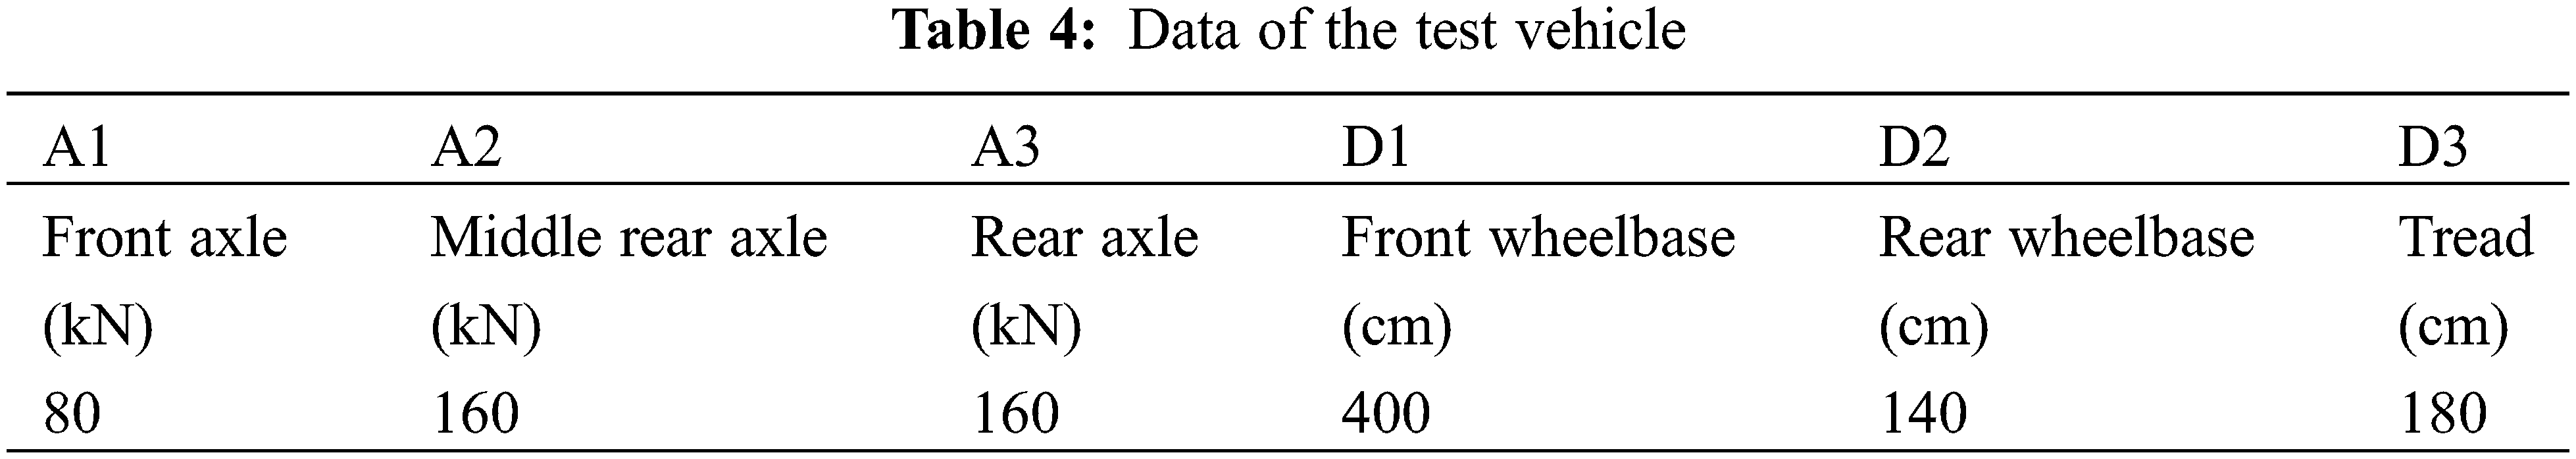
The test vehicle is proposed to be a double rear axle truck with a total weight of 400 kN, with a total of 20 trucks. If the actual loaded vehicle is slightly different from the calculation and analysis. The plane and elevation dimensions of the test vehicle are shown in Fig. 14. The detailed data of the test vehicle are listed in Table 4.
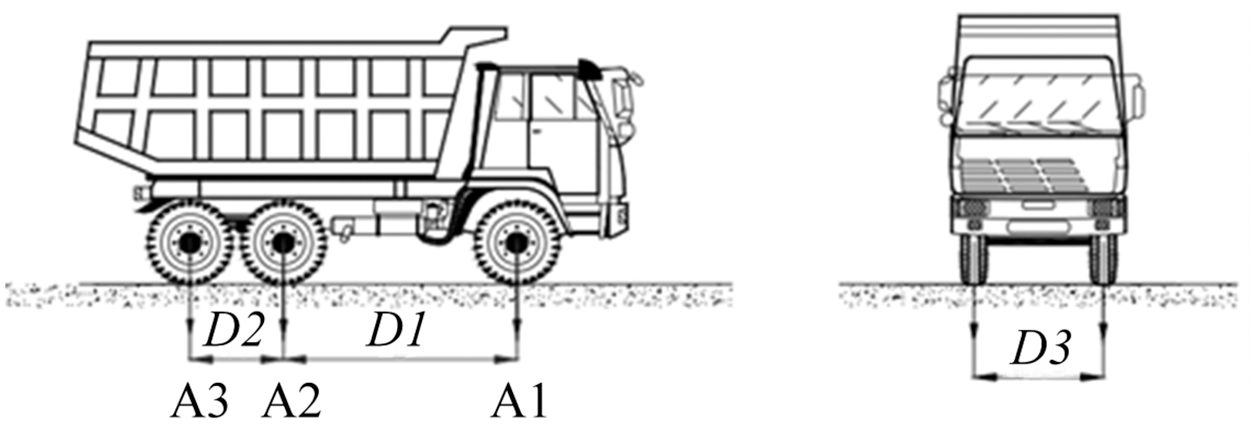
Figure 14: Plane and elevation dimensions of the test vehicle
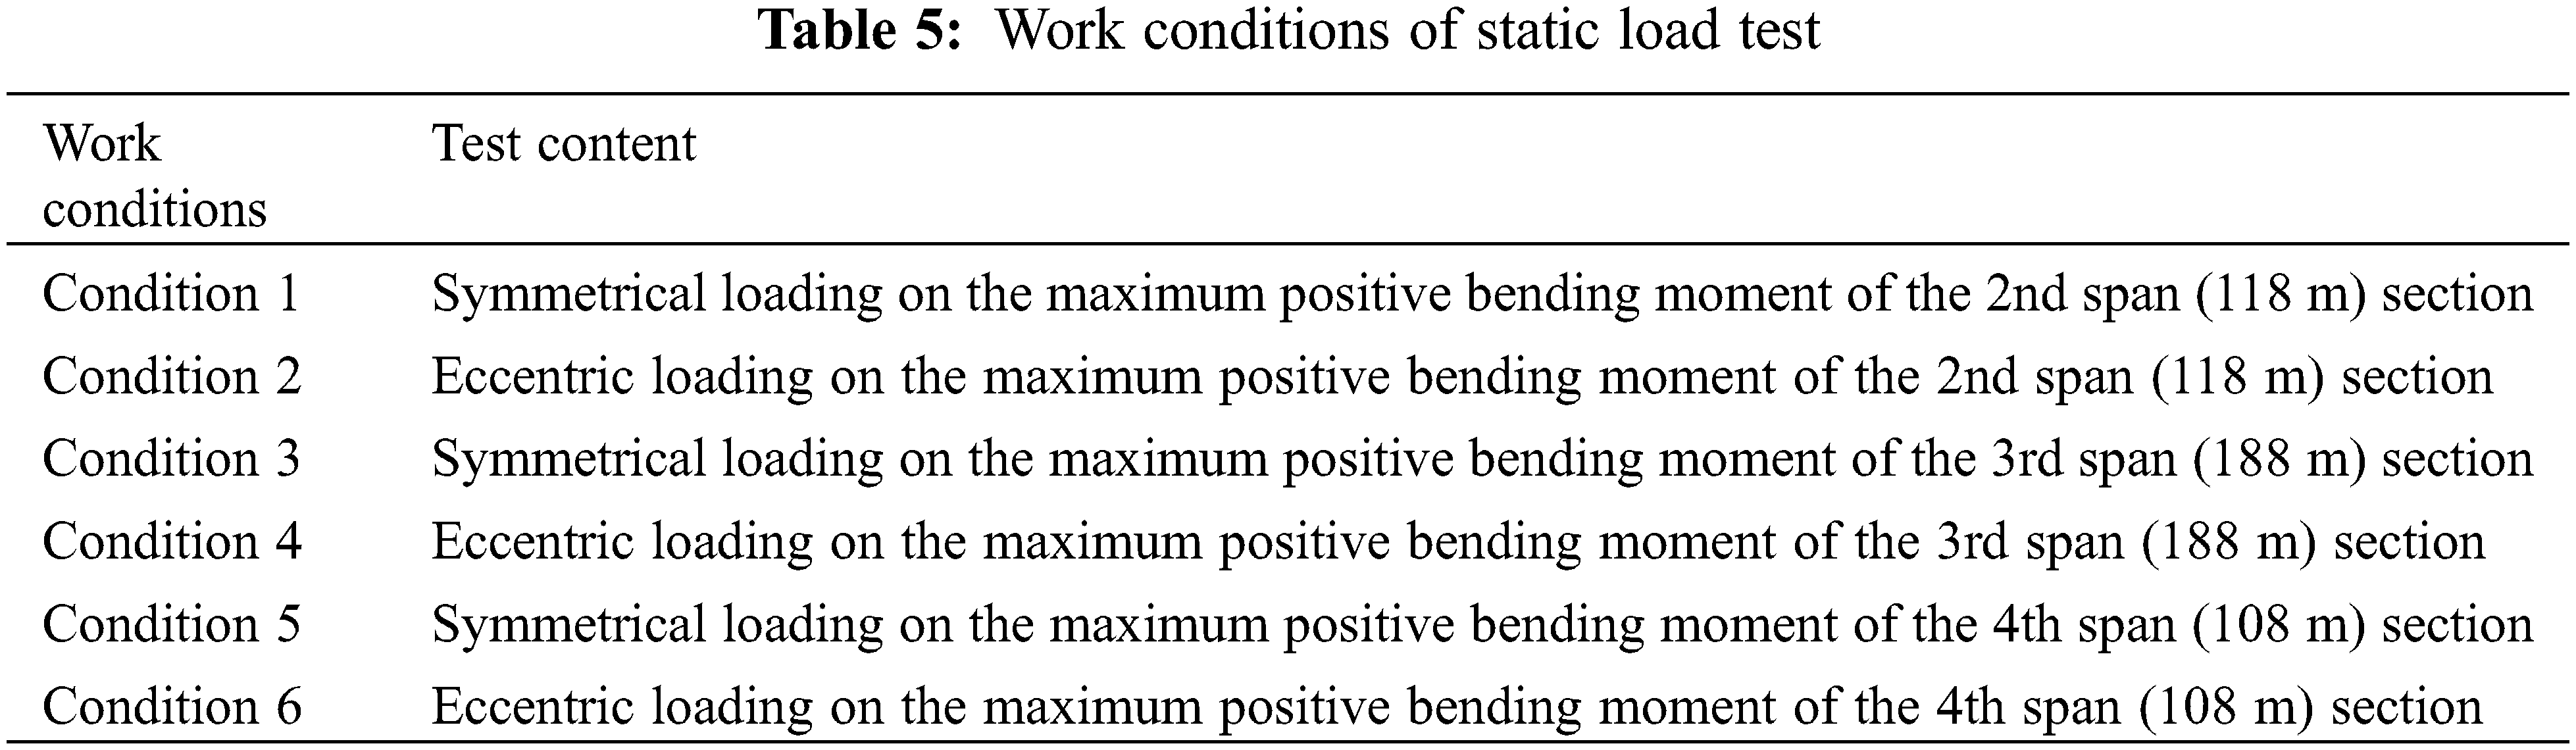
To simulate the maximum bending moment effect of vehicle load, the longitudinal position of the test vehicle on the bridge deck is changed to ensure that the load efficiency is within the specified range. The static load test of cable-stayed bridge is divided into six working conditions. The loading scheme under the six working conditions is shown in Table 5.
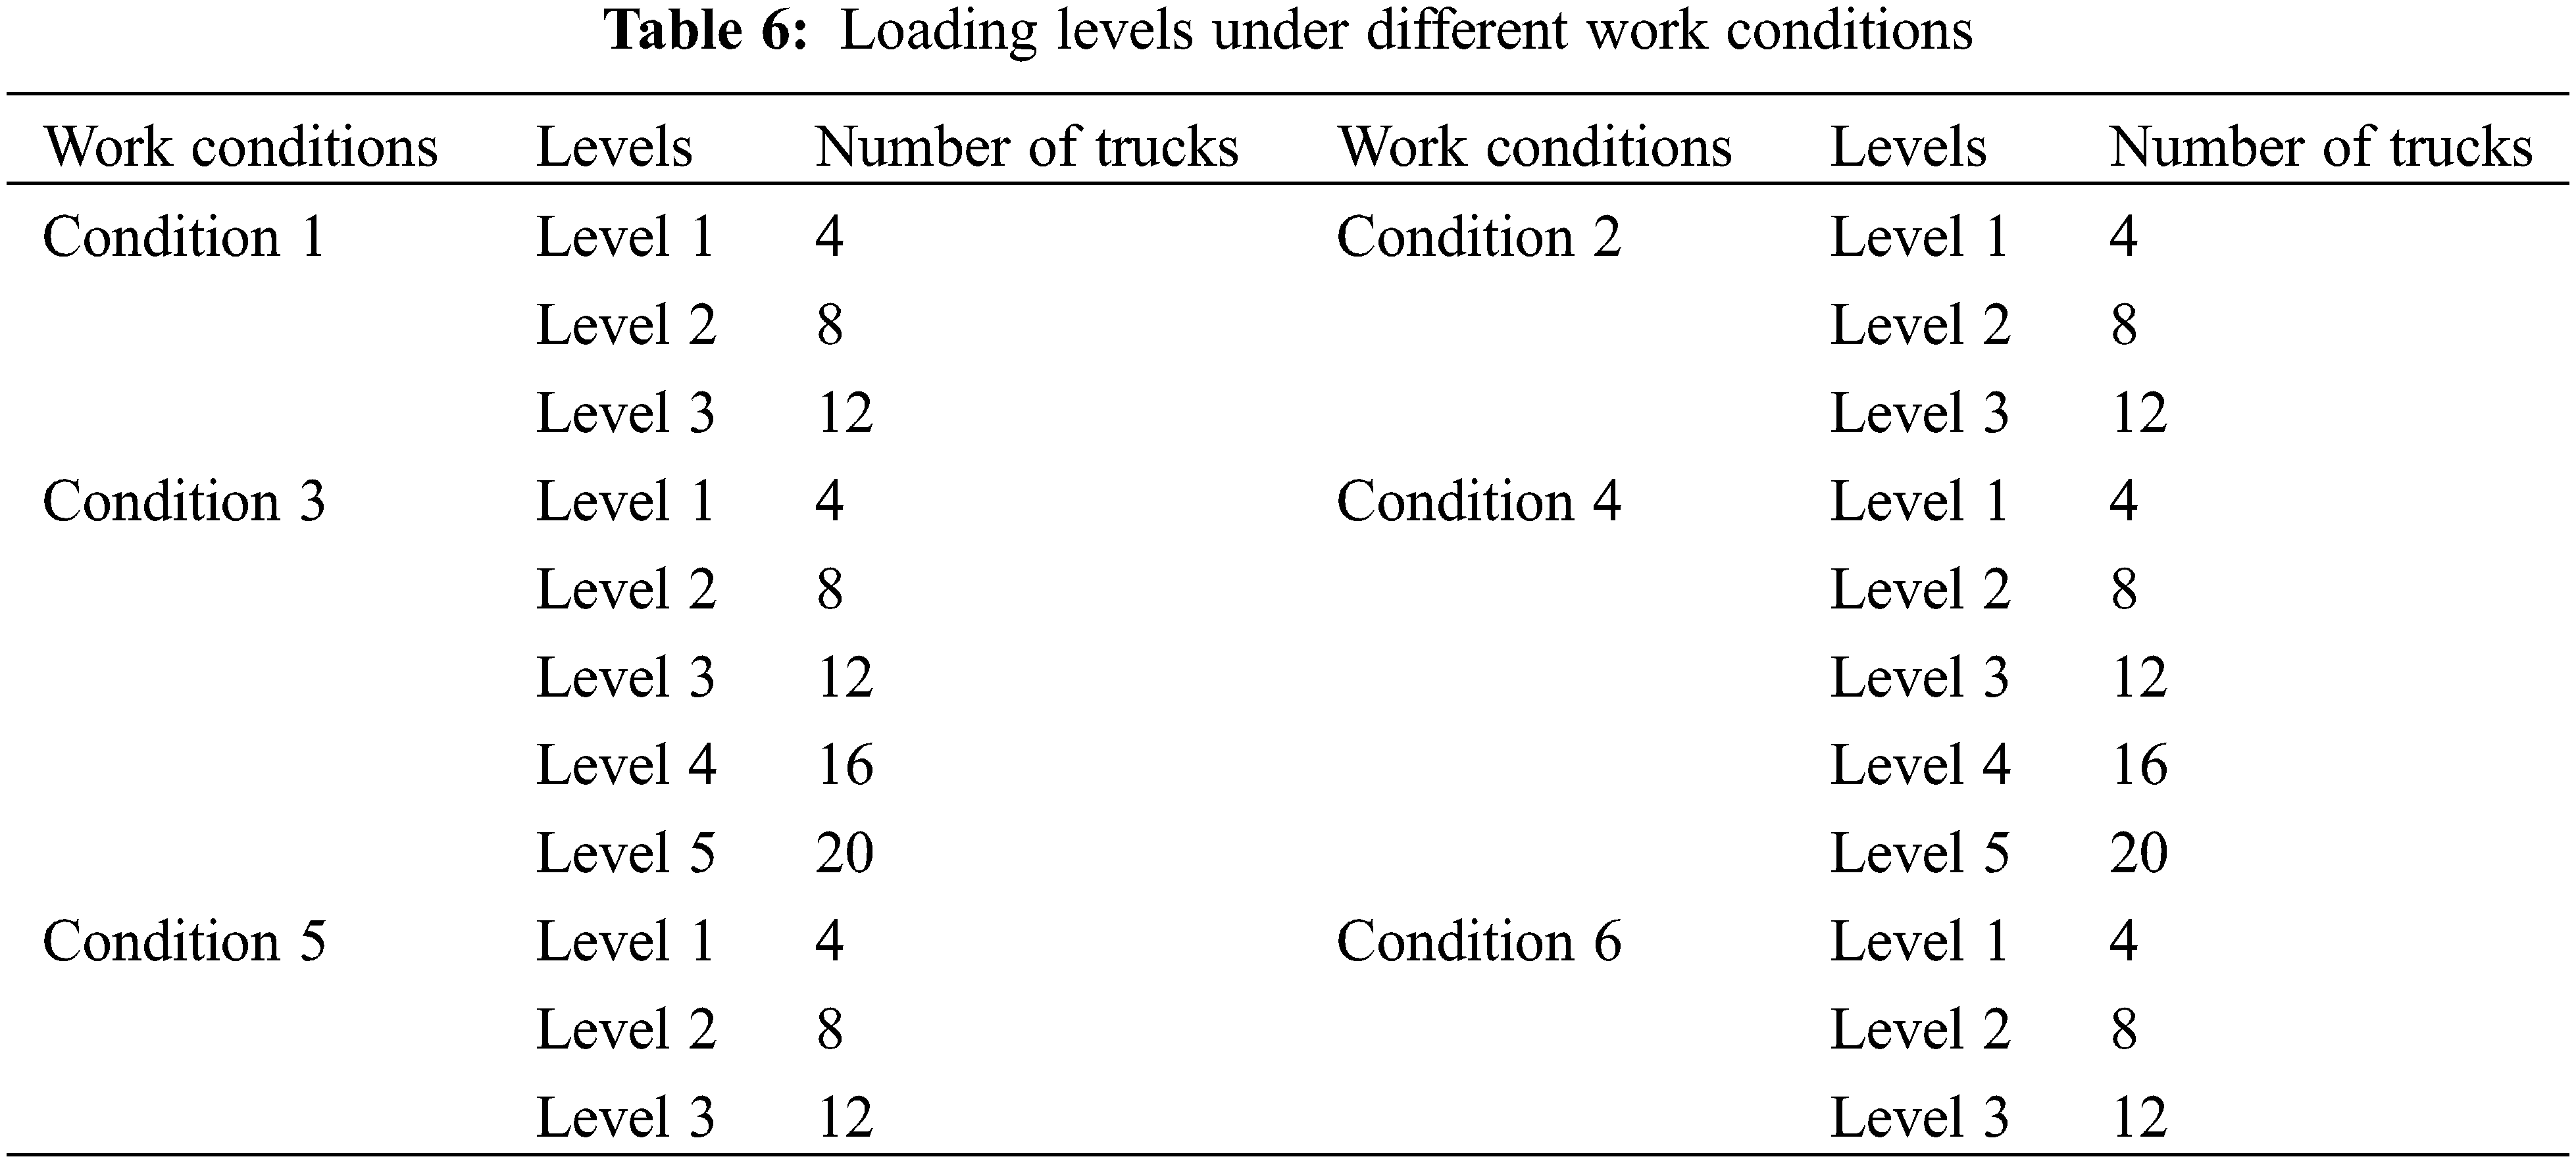
For the bridge safety during the test, the test load during is controlled according to the graded loading. The vehicles loaded at each level under each work condition are shown in Table 6. During the test, the reading shall be taken after each load is applied and stabilized for 5 min, and then reading every 5 min. When the change of the last 5 min reading is less than 25% of the previous 5 min increment, it is considered to be relatively stable, and the next level of load can be applied. This is done until the maximum test load is reached. Once all loading levels are completed, uninstall once.
Bridge dynamic load test is to learn from a large number of measured data signals. The dynamic characteristics of the structure and its ability to resist forced vibration and burst load are understood from the measured data signals. Finally, the dynamic characteristics and response of the bridge structure are evaluated comprehensively. Dynamic load test can reveal the inherent law of bridge structure vibration to judge the actual working state of the structure, and at the same time accumulate the original data for the structural evaluation in service stage [23–25].
Vibration signal acquisition and analysis system is adopted in this dynamic load test, as shown in Fig. 15. The system consists of excitation part, signal measurement and data acquisition part, signal analysis and frequency response function analysis and estimation. In order to accurately collect environmental excitation signals, a low-frequency acceleration sensor with high sensitivity was selected for this test, and the frequency response range was 0.01~100 Hz.
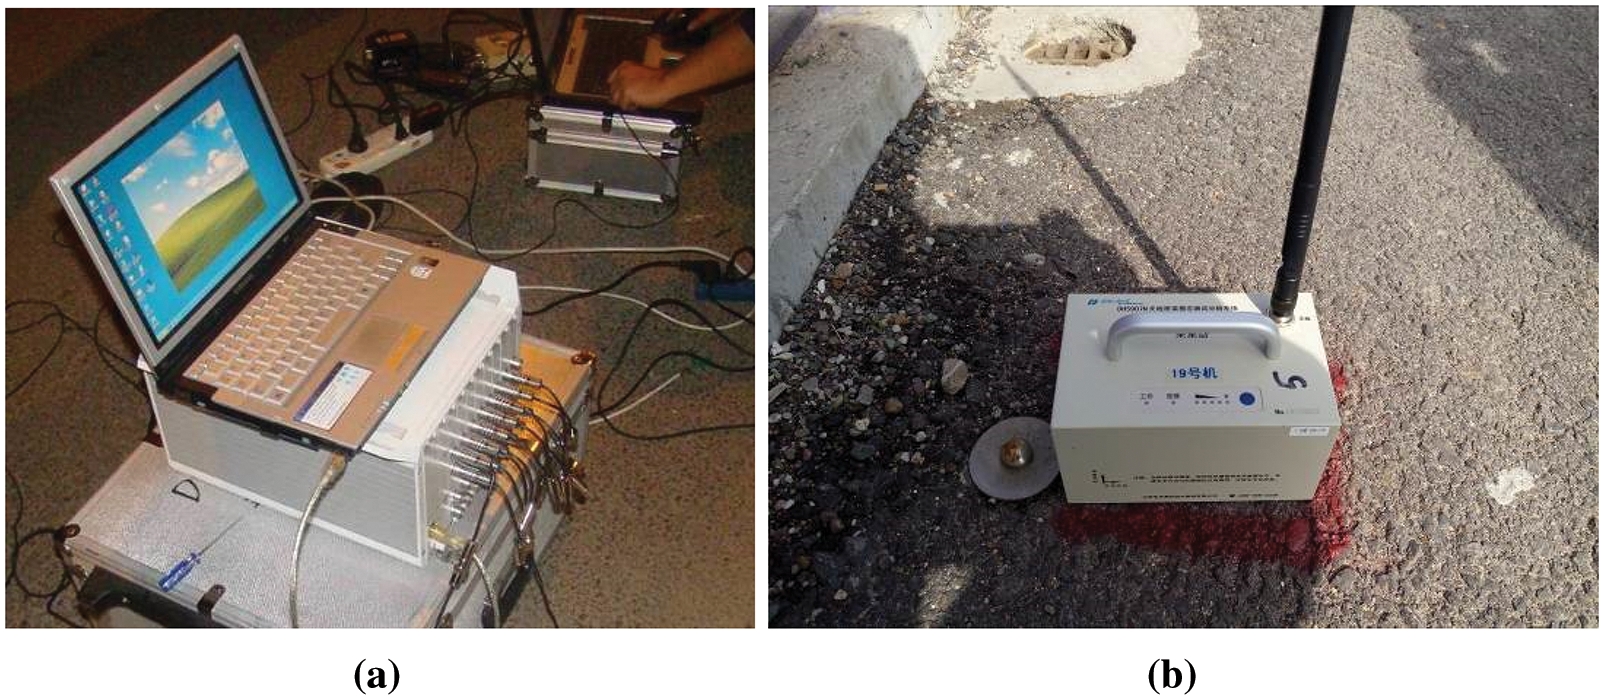
Figure 15: Vibration test system
Nine acceleration sensors are arranged on each side of the bridge, and a total of 18 acceleration sensors and one dynamic strain are arranged on the left and right sides. The specific layout is shown in Fig. 16.
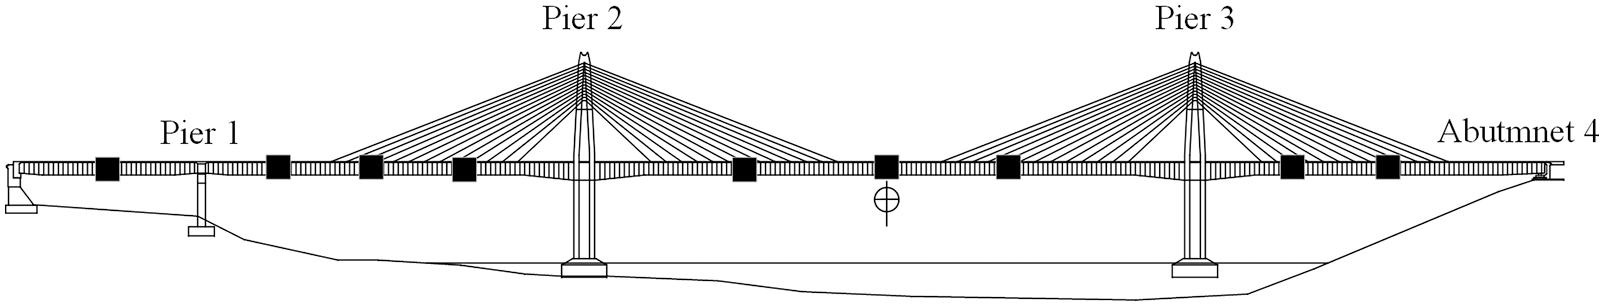
Figure 16: The vertical layout diagram of sensor
Because the vibration of actual bridge structure is often complex and random, it is difficult to analyze and judge the rule of structure vibration directly based on such signal or data. Generally, the measured vibration waveform needs to be analyzed and processed in order to further analyze the dynamic performance of the structure, and parameters such as amplitude, damping ratio and vibration mode can be obtained. Frequency domain analysis is to transform the time domain signal into frequency domain signal by mathematical principle of Fourier transform. It can reveal the frequency components of the signal and the transmission characteristics of the vibration system, so as to determine the frequency and frequency distribution characteristics of the structure. After obtaining these vibration parameters, the dynamic performance of bridge structure can be comprehensively evaluated according to relevant indexes [26–30]. The natural frequency of the cable-stayed bridge can be measured by a pulsation test.
4 Construction Monitoring Results
4.1 Monitoring Results of Main Girder Linearity
The test results of linear variation of main girder are shown in Fig. 17. The x-axis represents the beam number and the vertical axis represents the deflection value of the main beam. The red solid line and blue solid line in the figure respectively represent the deformation values of the West cantilever section and the East cantilever section of the bridge tower before and after the cable tensioning. The black dotted line is the theoretical value calculated by the finite element software. Generally speaking, the curve shows a ladder upward trend from 5# girder to 17# girder. The maximum value of measured deformation and theoretical deformation of cantilever girders on both sides of Pier 2 appears in 15# girder, and the maximum difference is 1.0 cm. The maximum value of measured deformation and theoretical deformation of cantilever girders on both sides of pier 3 appears in 17# girder section, and the maximum difference is 1.7 cm.
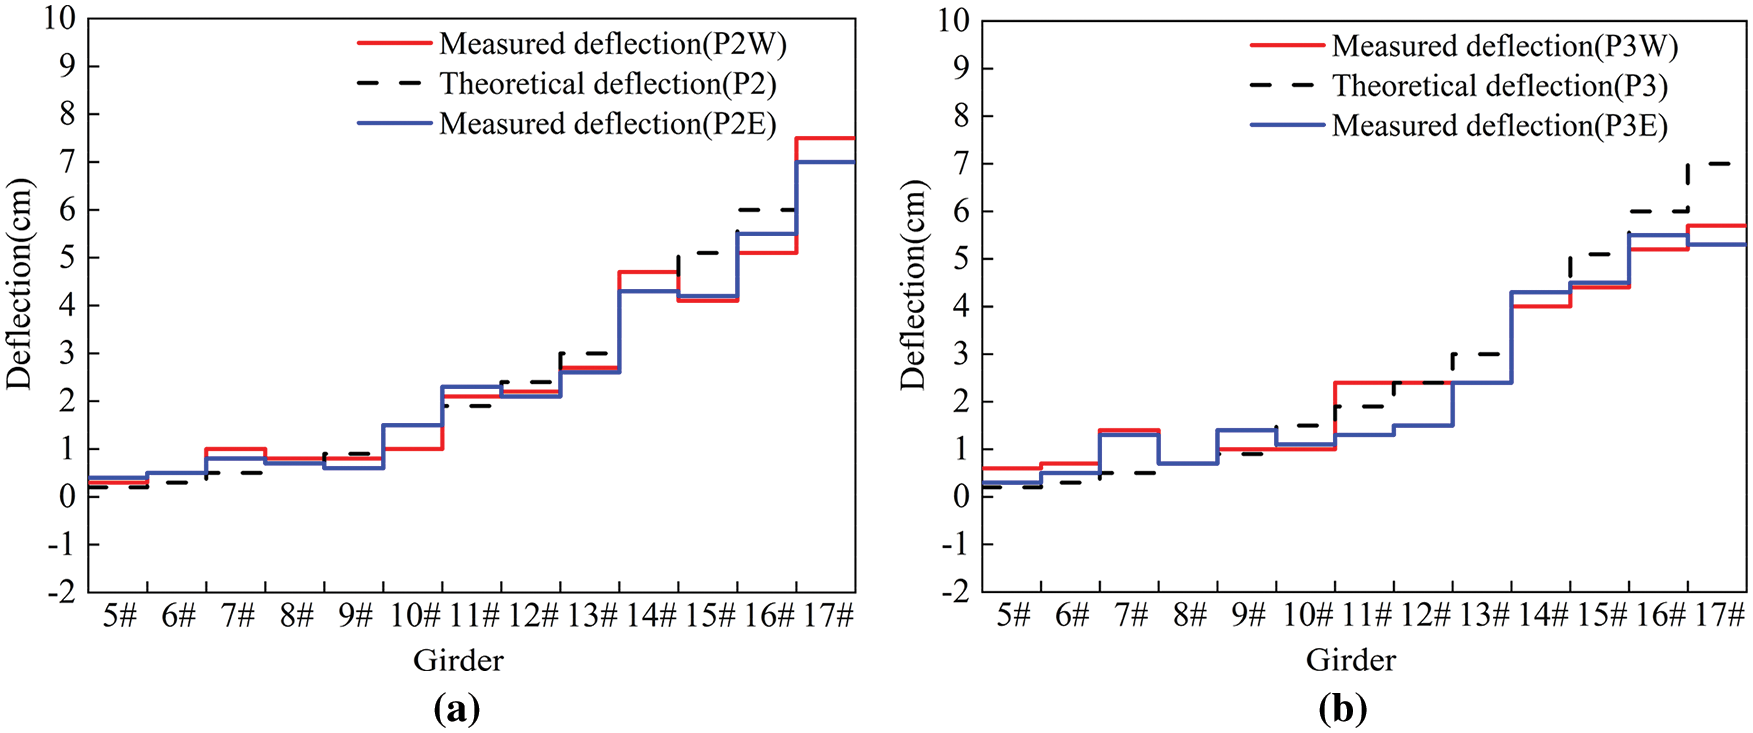
Figure 17: Monitoring results of main girder linearity
4.2 Monitoring Results of Main Girder Stress
This project measured the structural stress by monitoring the strain-frequency domain calibration curve. Then the actual strain of concrete is calculated and the concrete stress is calculated according to the elastic modulus of concrete. The monitoring results of main girder stress in 12 construction stages are shown in Fig. 18. From the construction stage, the maximum stress of the main girder occurs in construction stage 11 (after cables force adjustment). The maximum difference between the theoretical stress and the measured stress of section F1 occurs in construction stage 6 (after tensioning of girder 15#). The maximum difference between the theoretical stress and the measured stress of section F2 occurs in construction stage 11 (after cables force adjustment). The maximum difference between the theoretical stress and the measured stress of section F3 occurs in the construction stage 12 (after bridge system construction). The maximum difference between the theoretical stress and the measured stress of section F4 occurs in construction stage 11 (after cables force adjustment). Therefore, the influence of cable force adjustment on the stress of cable-stayed bridge is obviously greater than that in other construction stages.
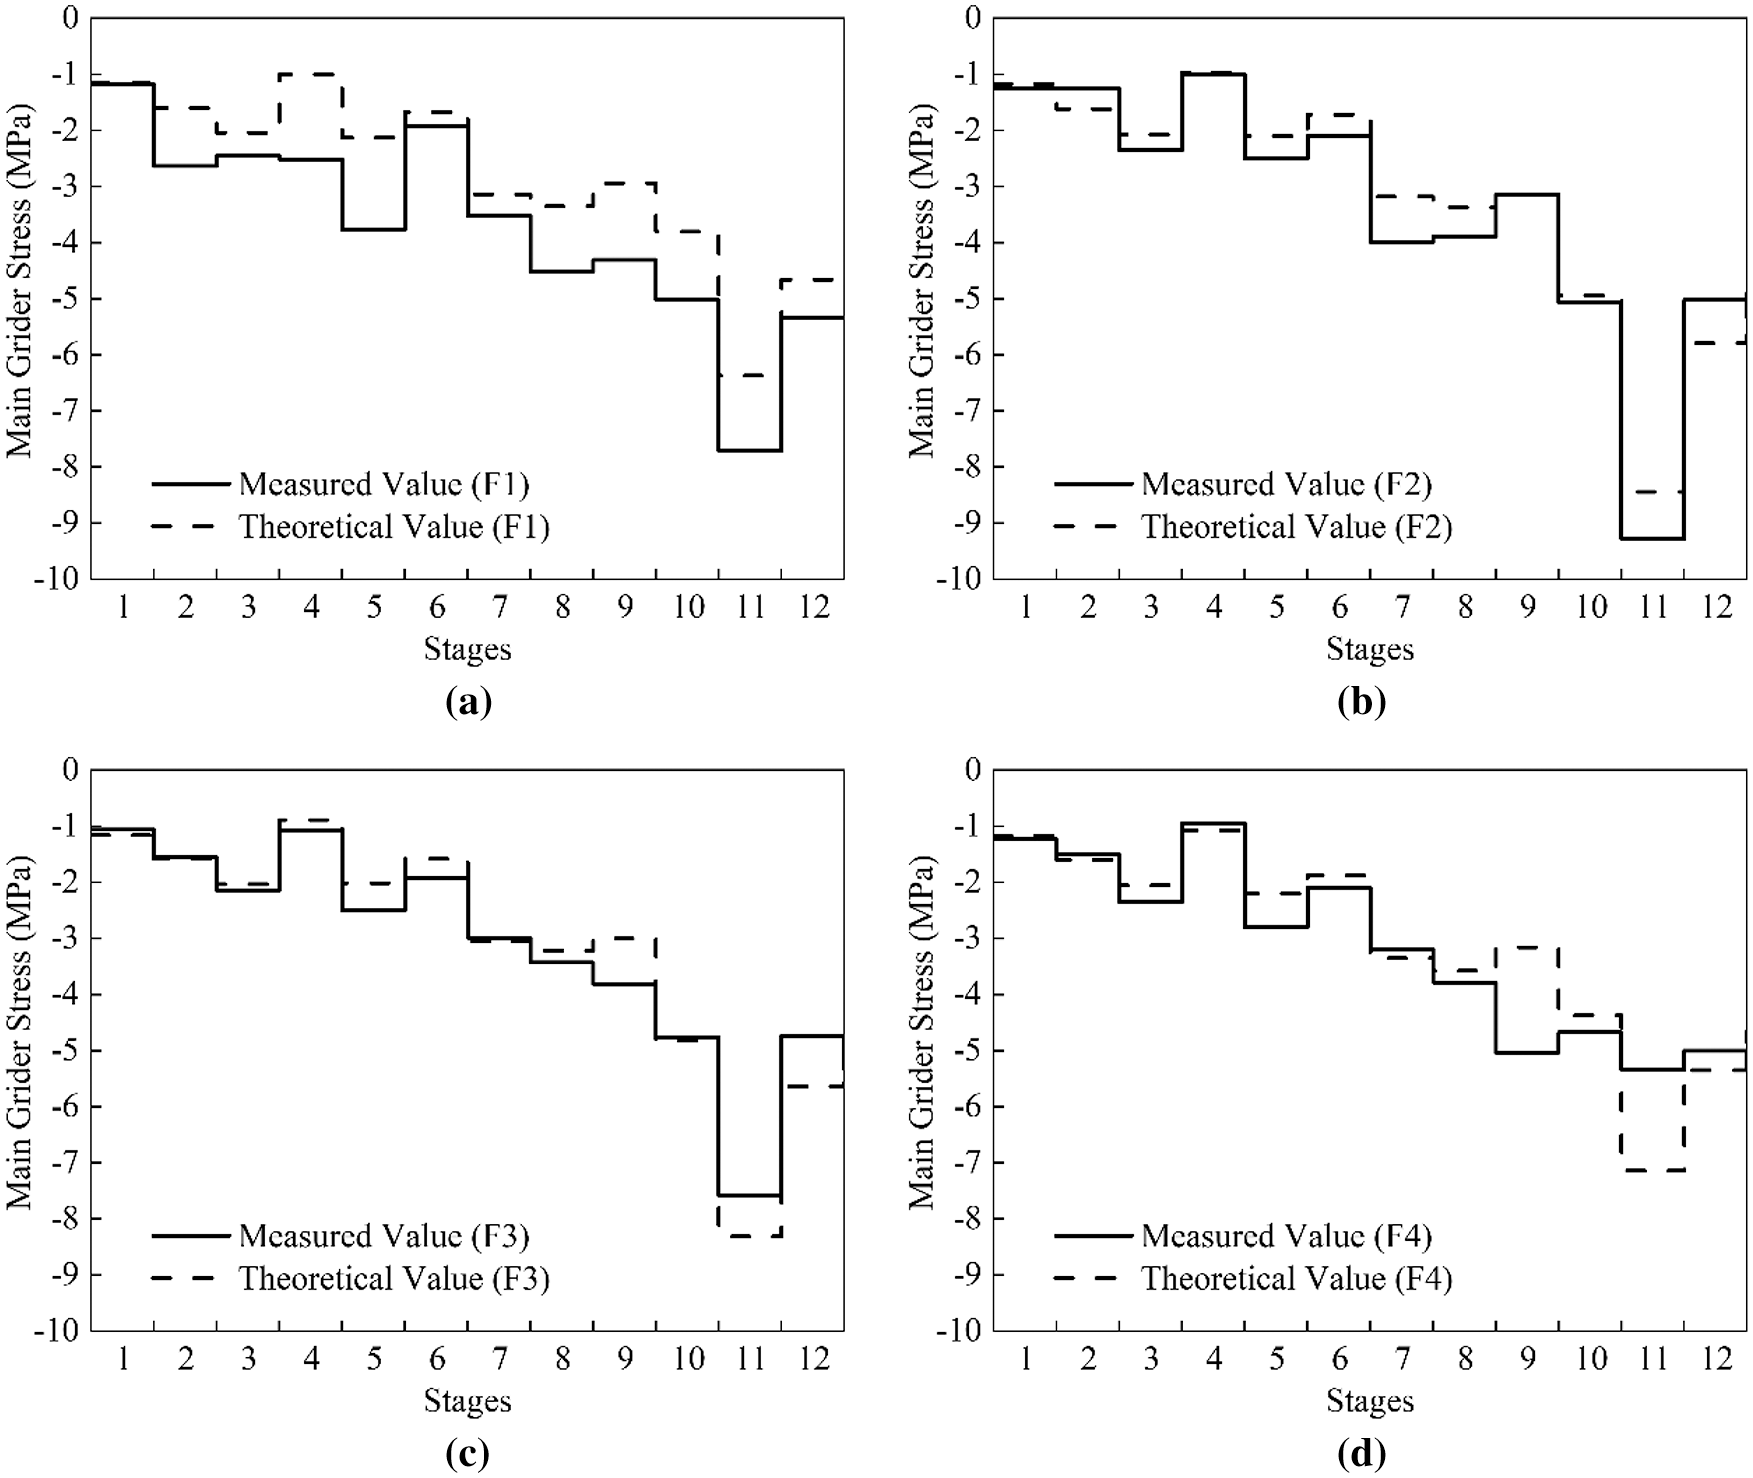
Figure 18: Monitoring results of main girder stress
4.3 Monitoring Results of Cable Force after Closure
In the actual construction monitoring, the monitoring of stay cable is divided into two parts: (1) After each pair of stay cables is tensioned, test the cable force of 4 adjacent pairs of stay cables. (2) After the closure of the mid-span, the cable force of the whole bridge is measured.
Due to the limited space of this paper, only the monitoring results of the second part are introduced. The comparison between the measured and theoretical cable force of the cable-stayed bridge after the closure is shown in Fig. 19. As can be seen from the figure, the maximum difference of cable force value of Pier 2 is 488 kN, which is P2SW-C12. The actual cable force of P2SW-C12 is 4954 kN. But it has a theoretical cable force of 5442 kN, with a difference of 9.8%. The maximum difference of cable force value of pier3 is 478 kN, which is P3SE-C12. The actual cable force of P3SE-C12 is 5442 kN and the theoretical cable force is 4964 kN, with a difference of 9.6%. In general, the vibration frequency method can basically meet the accuracy requirements of cable force monitoring. The cable force of the stay cable of the bridge basically meets the requirements of the design and specifications in the cable hanging and tensioning stage and after the closure of the bridge.
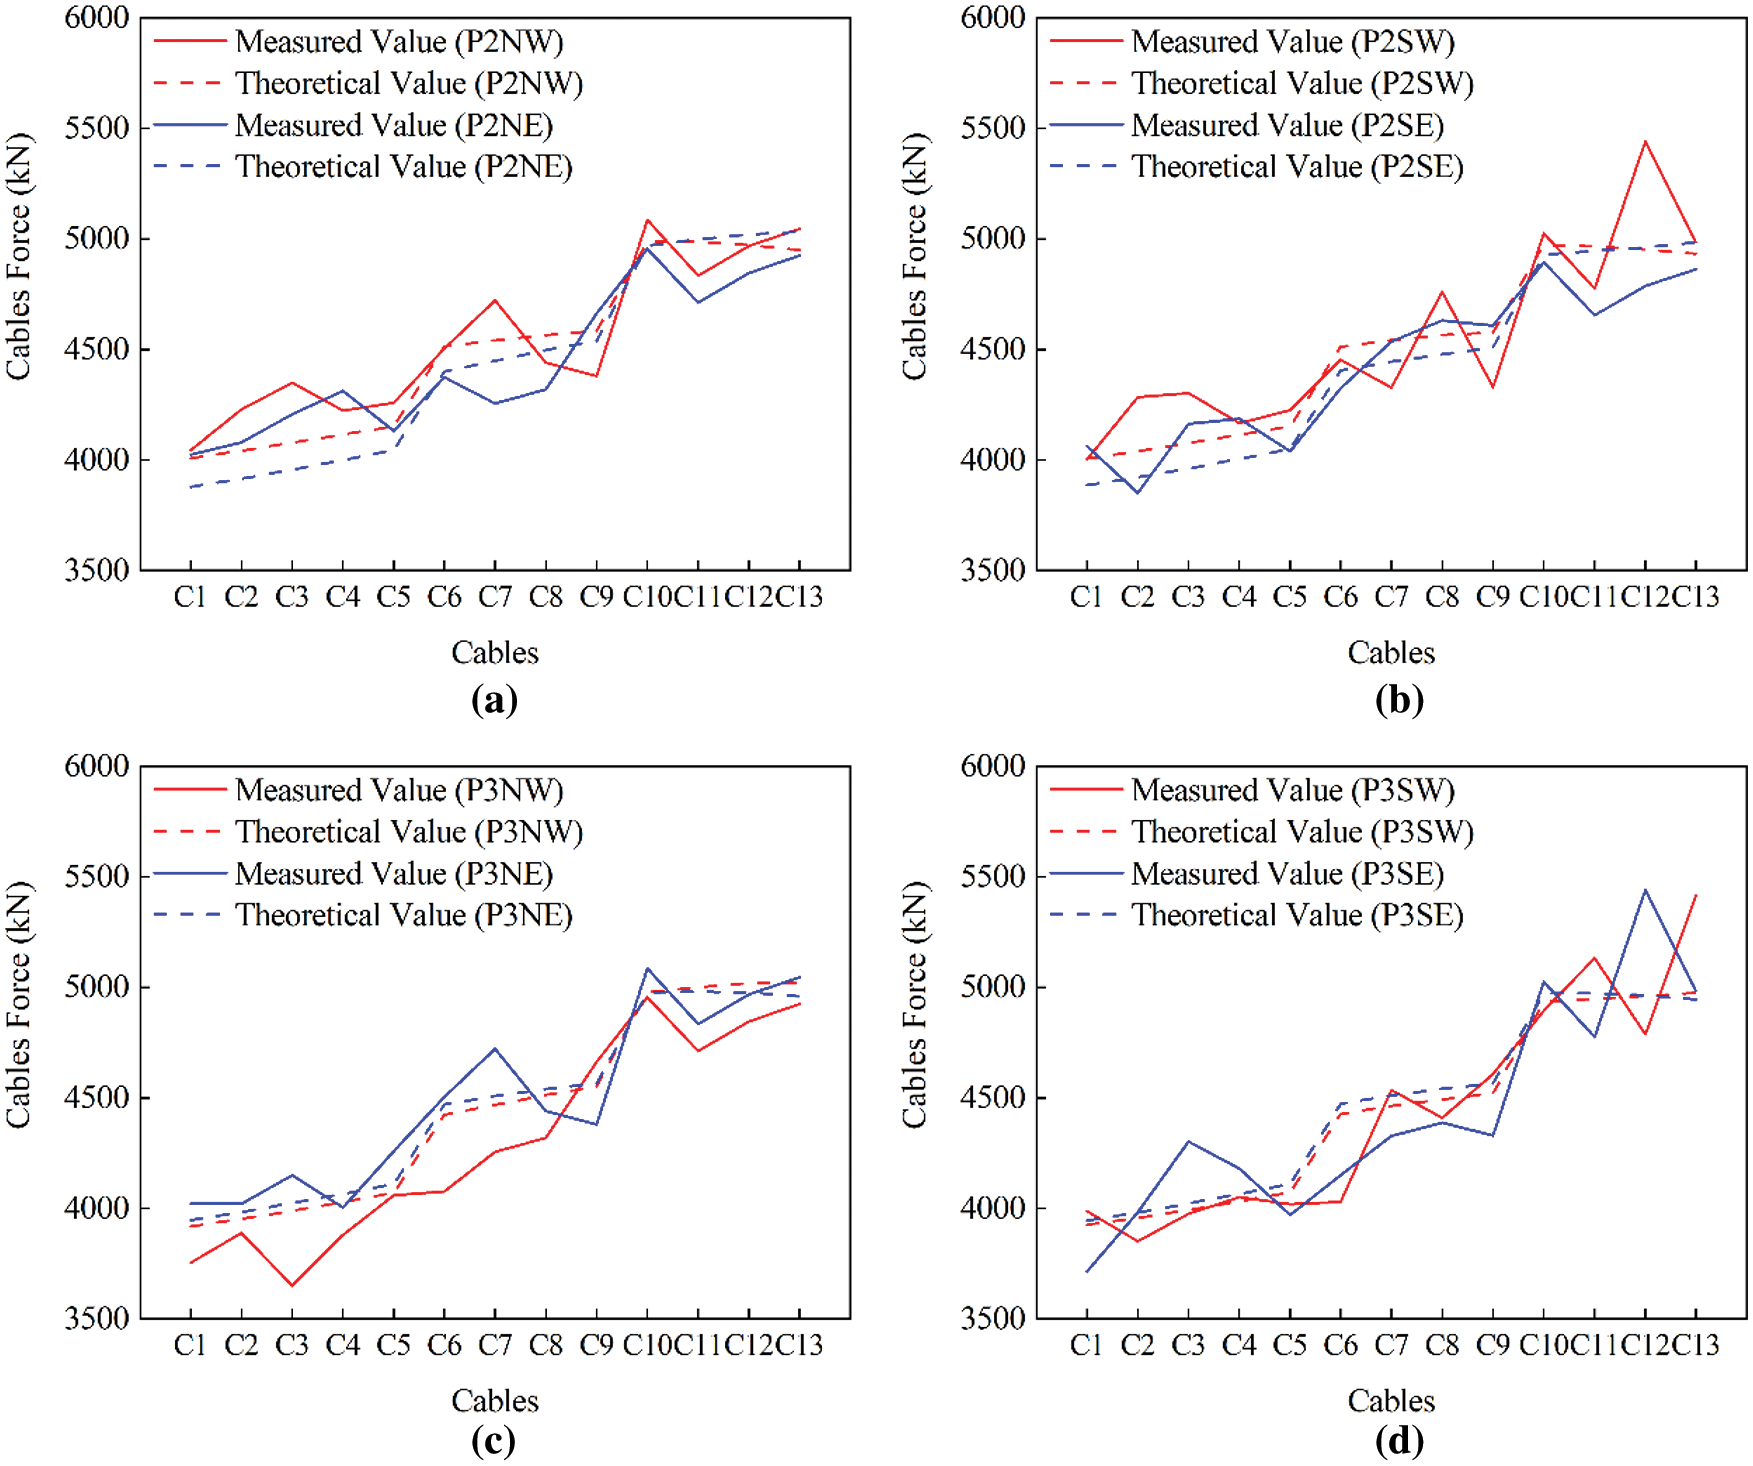
Figure 19: Monitoring results of cable force after closure
5.1.1 Deflection Test Results of Main Girder
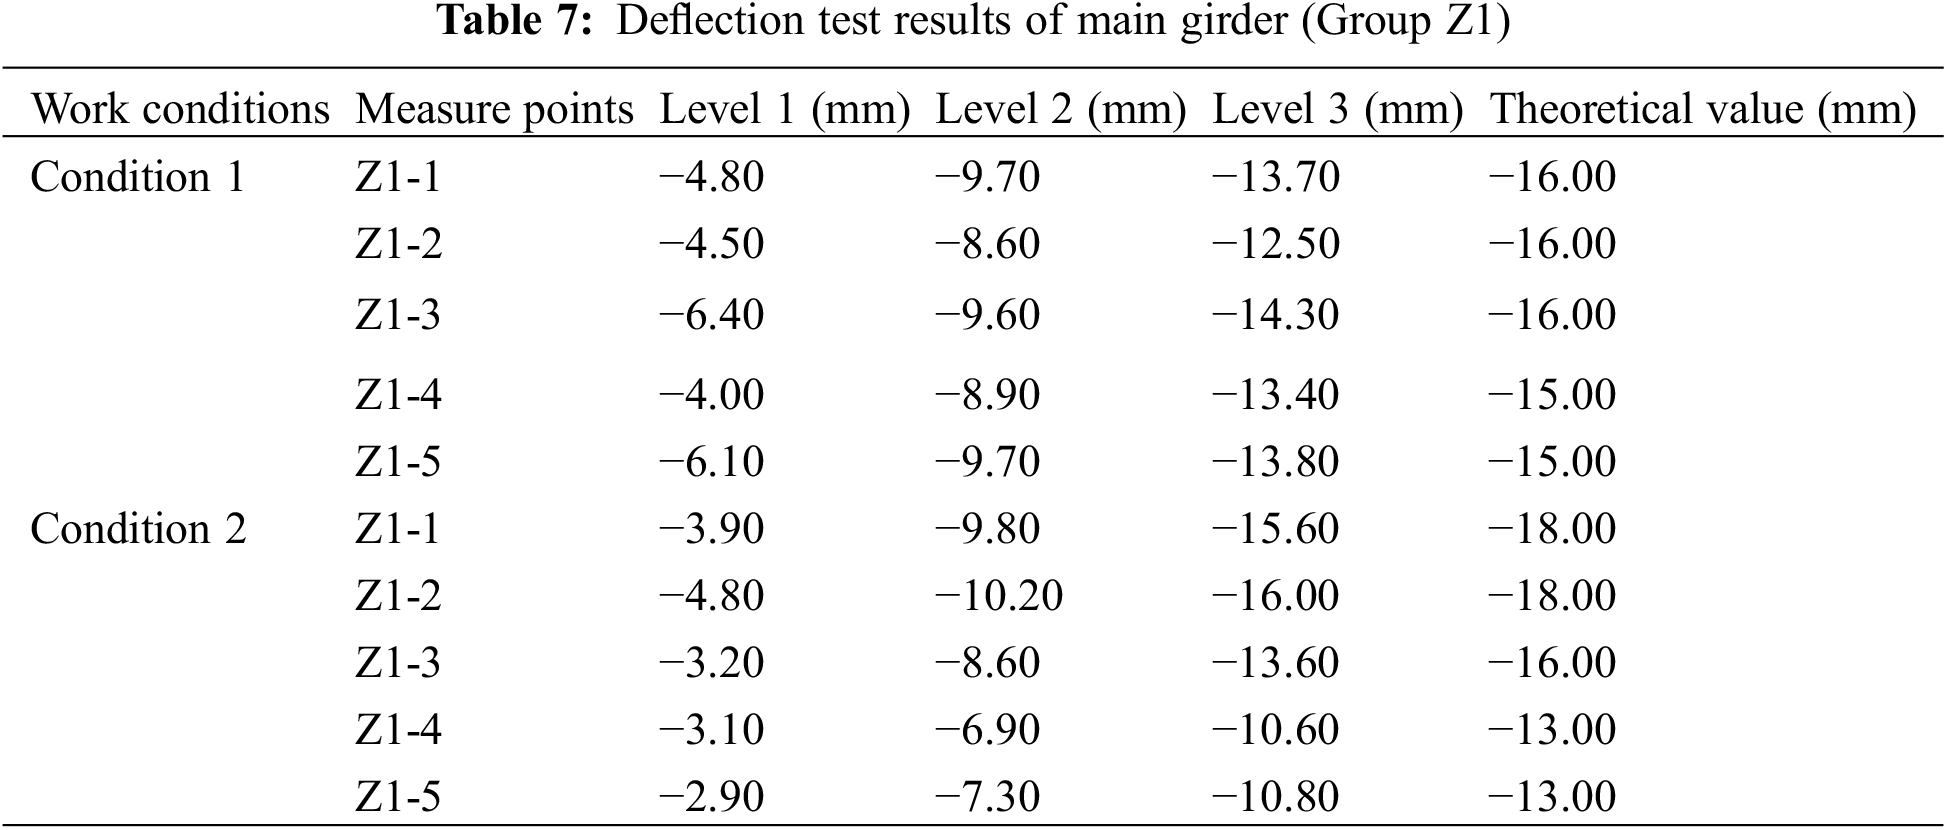
The test results of main girder deflection under working conditions 1 and 2 are shown in Table 7. From the perspective of loading level, the measuring point Z1-3 of working condition 1 produces the maximum deflection at the third level, which is −14.30 mm, lower than −16.00 mm of the theoretical value. Under condition 2, the maximum deflection of measuring point Z1-2 in the third stage is −16.00 mm, which is lower than −18.00 mm of the theoretical value. Since the symmetrical loading is adopted in condition 1 and the eccentric loading is adopted in condition 2, the position of the measuring point with the maximum deflection has changed. Generally speaking, the maximum deflection under the three loading levels is less than the theoretical value, indicating that the stiffness of the bridge structure meets the design requirements.
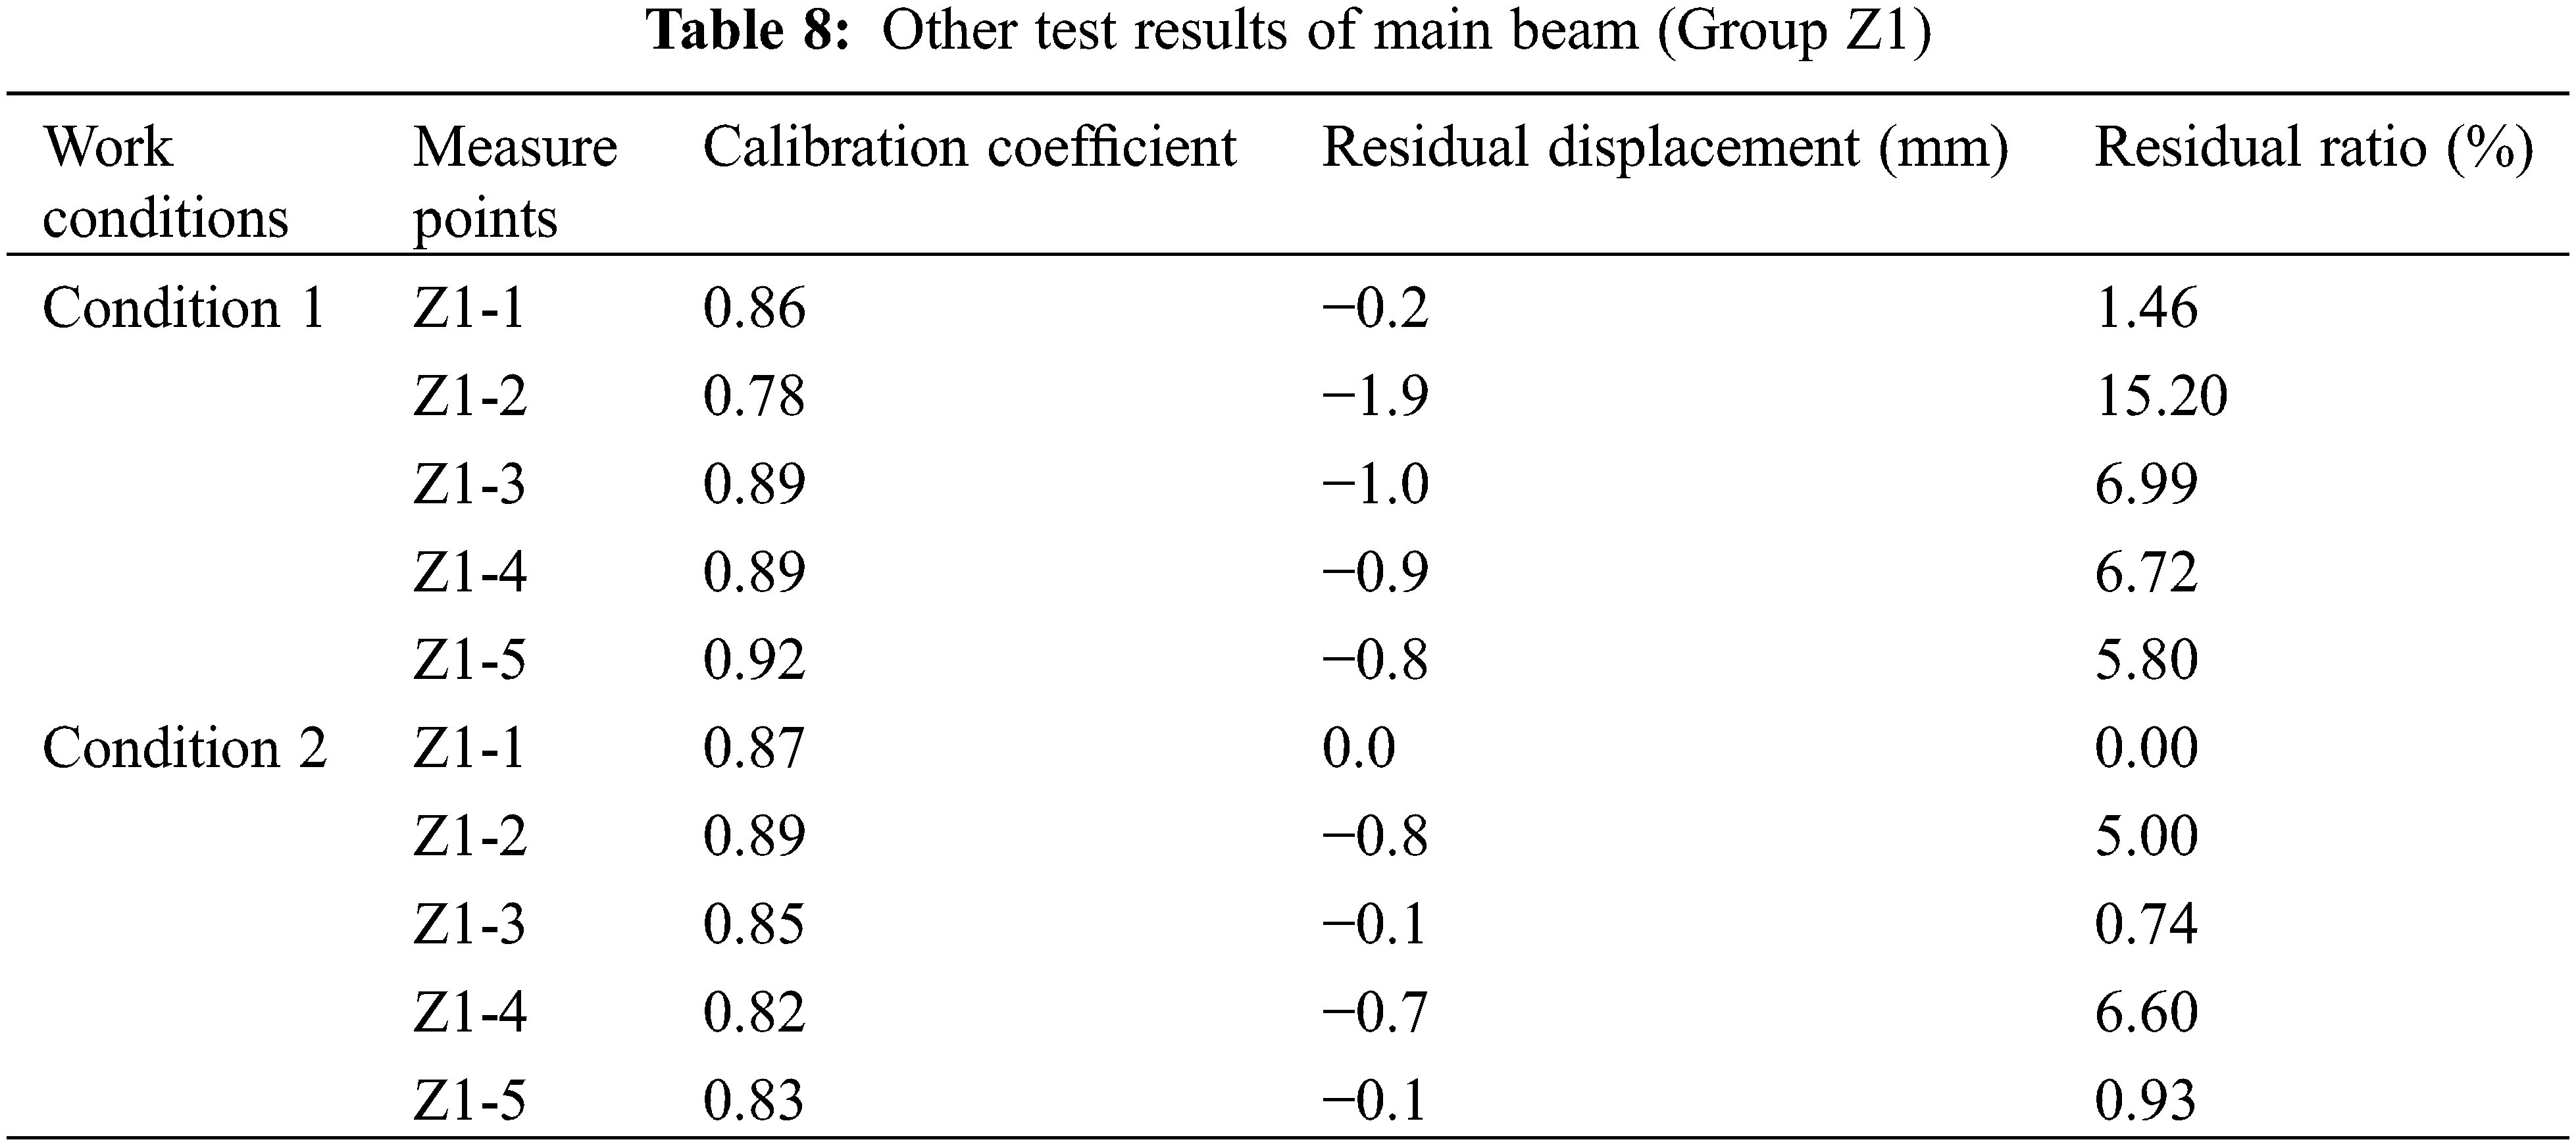
It can be seen from Table 8 that, under the load of working condition 1, the check coefficient of each measuring point on Z1 section is between 0.78 and 0.92. The maximum check coefficient is 0.92. The minimum check coefficient is 0.78. All are less than 1, indicating that the actual working condition of the bridge span structure is better than the theoretical condition. Under working condition 1, the maximum residual ratio at each measuring point of Z1 section is 15.20%, less than 20%, indicating that the structure is in elastic working condition. Under the load of working condition 2, the check coefficients of each measuring point of Z1 section range from 0.82 to 0.89. The maximum check coefficient is 0.89. The minimum check coefficient is 0.82. All are less than 1, indicating that the actual working condition of the bridge span structure is better than the theoretical condition. Under working condition 2, the maximum residual ratio at each measuring point of Z1 section is 6.60%, less than 20%, indicating that the structure is in elastic working condition.
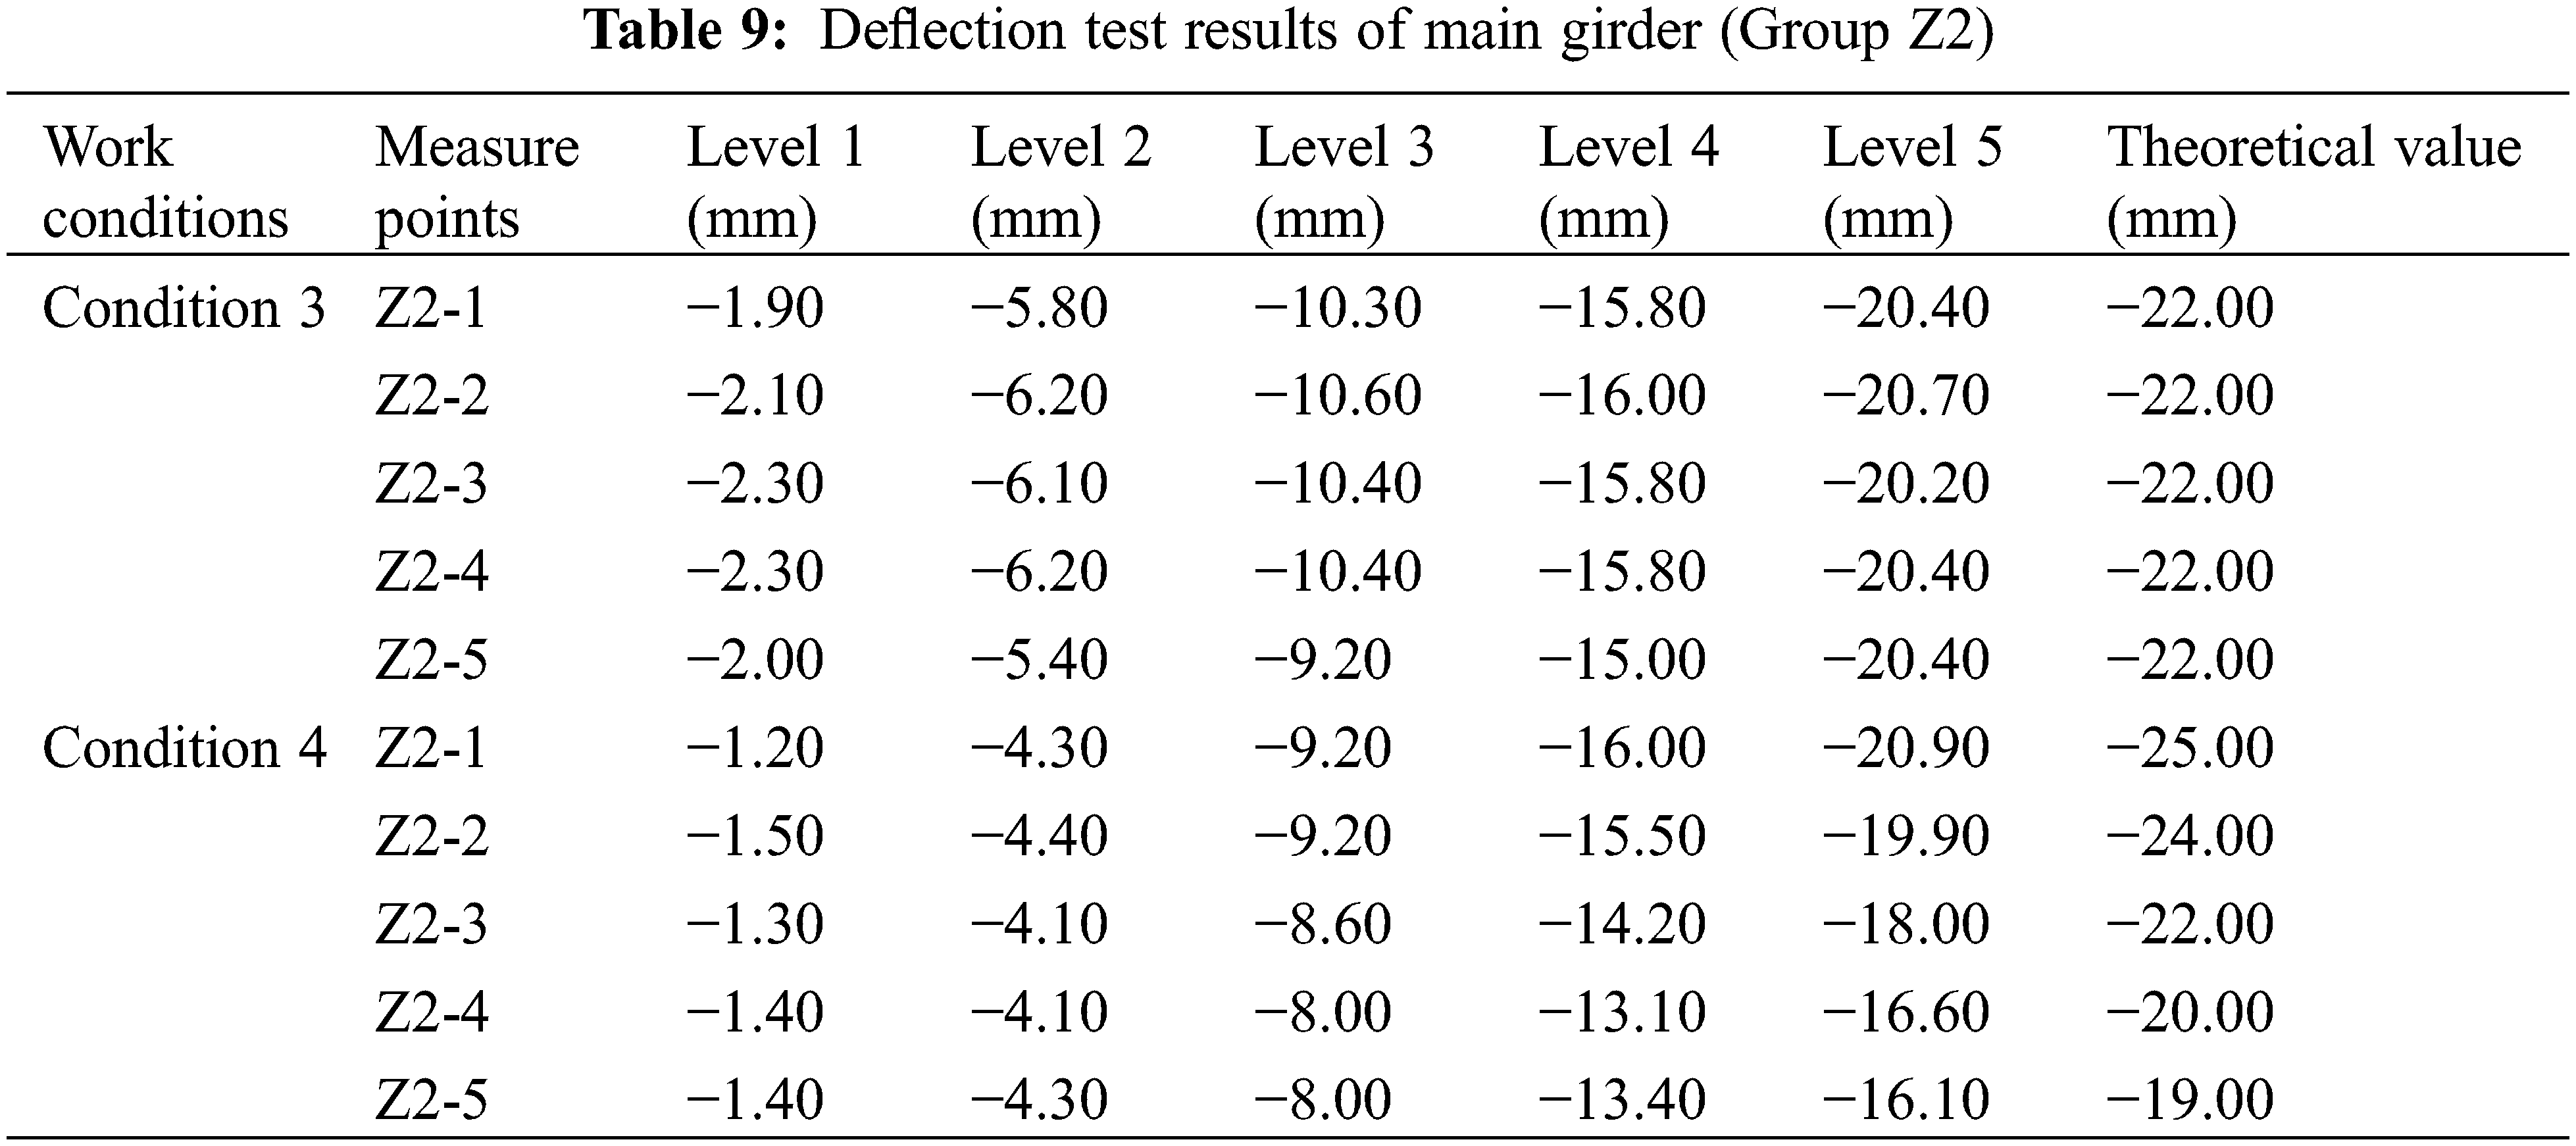
The deflection test results of the main girder of group Z2 are shown in Table 9. Since there are more loading vehicles under conditions 3 and 4, the bridge is loaded in five loading levels. The deflection of each measuring point increases with the increase of loading grade, which is in line with the law of bridge design. The maximum deflection of measuring point Z2-2 under working condition 3 is −20.70 mm, which is less than −22.00 mm of the theoretical value. The maximum deflection under working condition 4 appears on measuring point Z2-1, and the maximum deflection is −20.90 mm, which is less than −25.00 mm of the theoretical value. The maximum deflection of this group is also less than the theoretical deflection, indicating that the structural bearing capacity of the third span of cable-stayed bridge meets the design requirements.
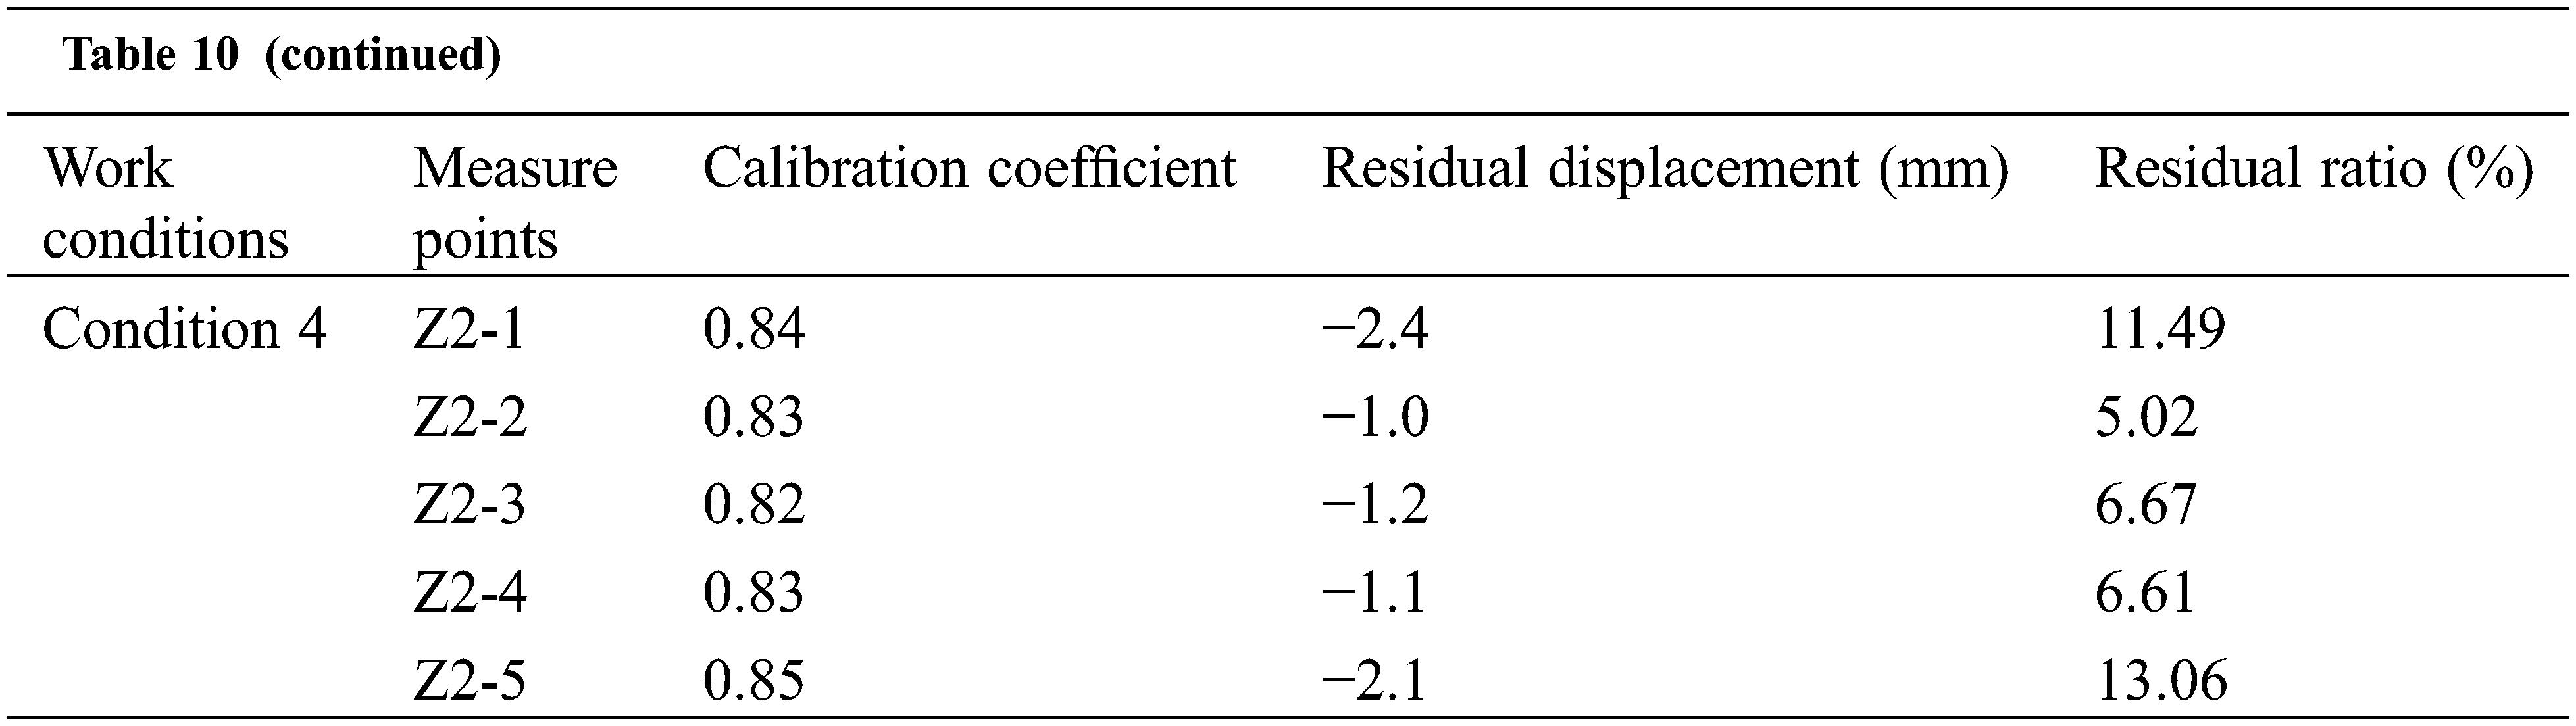
It can be seen from Table 10 that, under load of working condition 3, check coefficient of each measuring point on Z2 section range from 0.92 to 0.94. The maximum check coefficient is 0.94. The minimum check coefficient is 0.92. All are less than 1, indicating that the actual working condition of the bridge span structure is better than the theoretical condition. Under working condition 3, the maximum residual ratio at each measuring point of Z2 section is 12.87%, less than 20%, indicating that the structure is in elastic working condition. Under the load of working condition 4, the check coefficient of each measuring point of Z2 section range from 0.82 to 0.85. The maximum check coefficient is 0.85. The minimum check coefficient is 0.82. All are less than 1, indicating that the actual working condition of the bridge span structure is better than the theoretical condition. Under working condition 4, the maximum residual ratio at each measuring point of Z2 section is 13.06%, less than 20%, indicating that the structure is in elastic working condition.
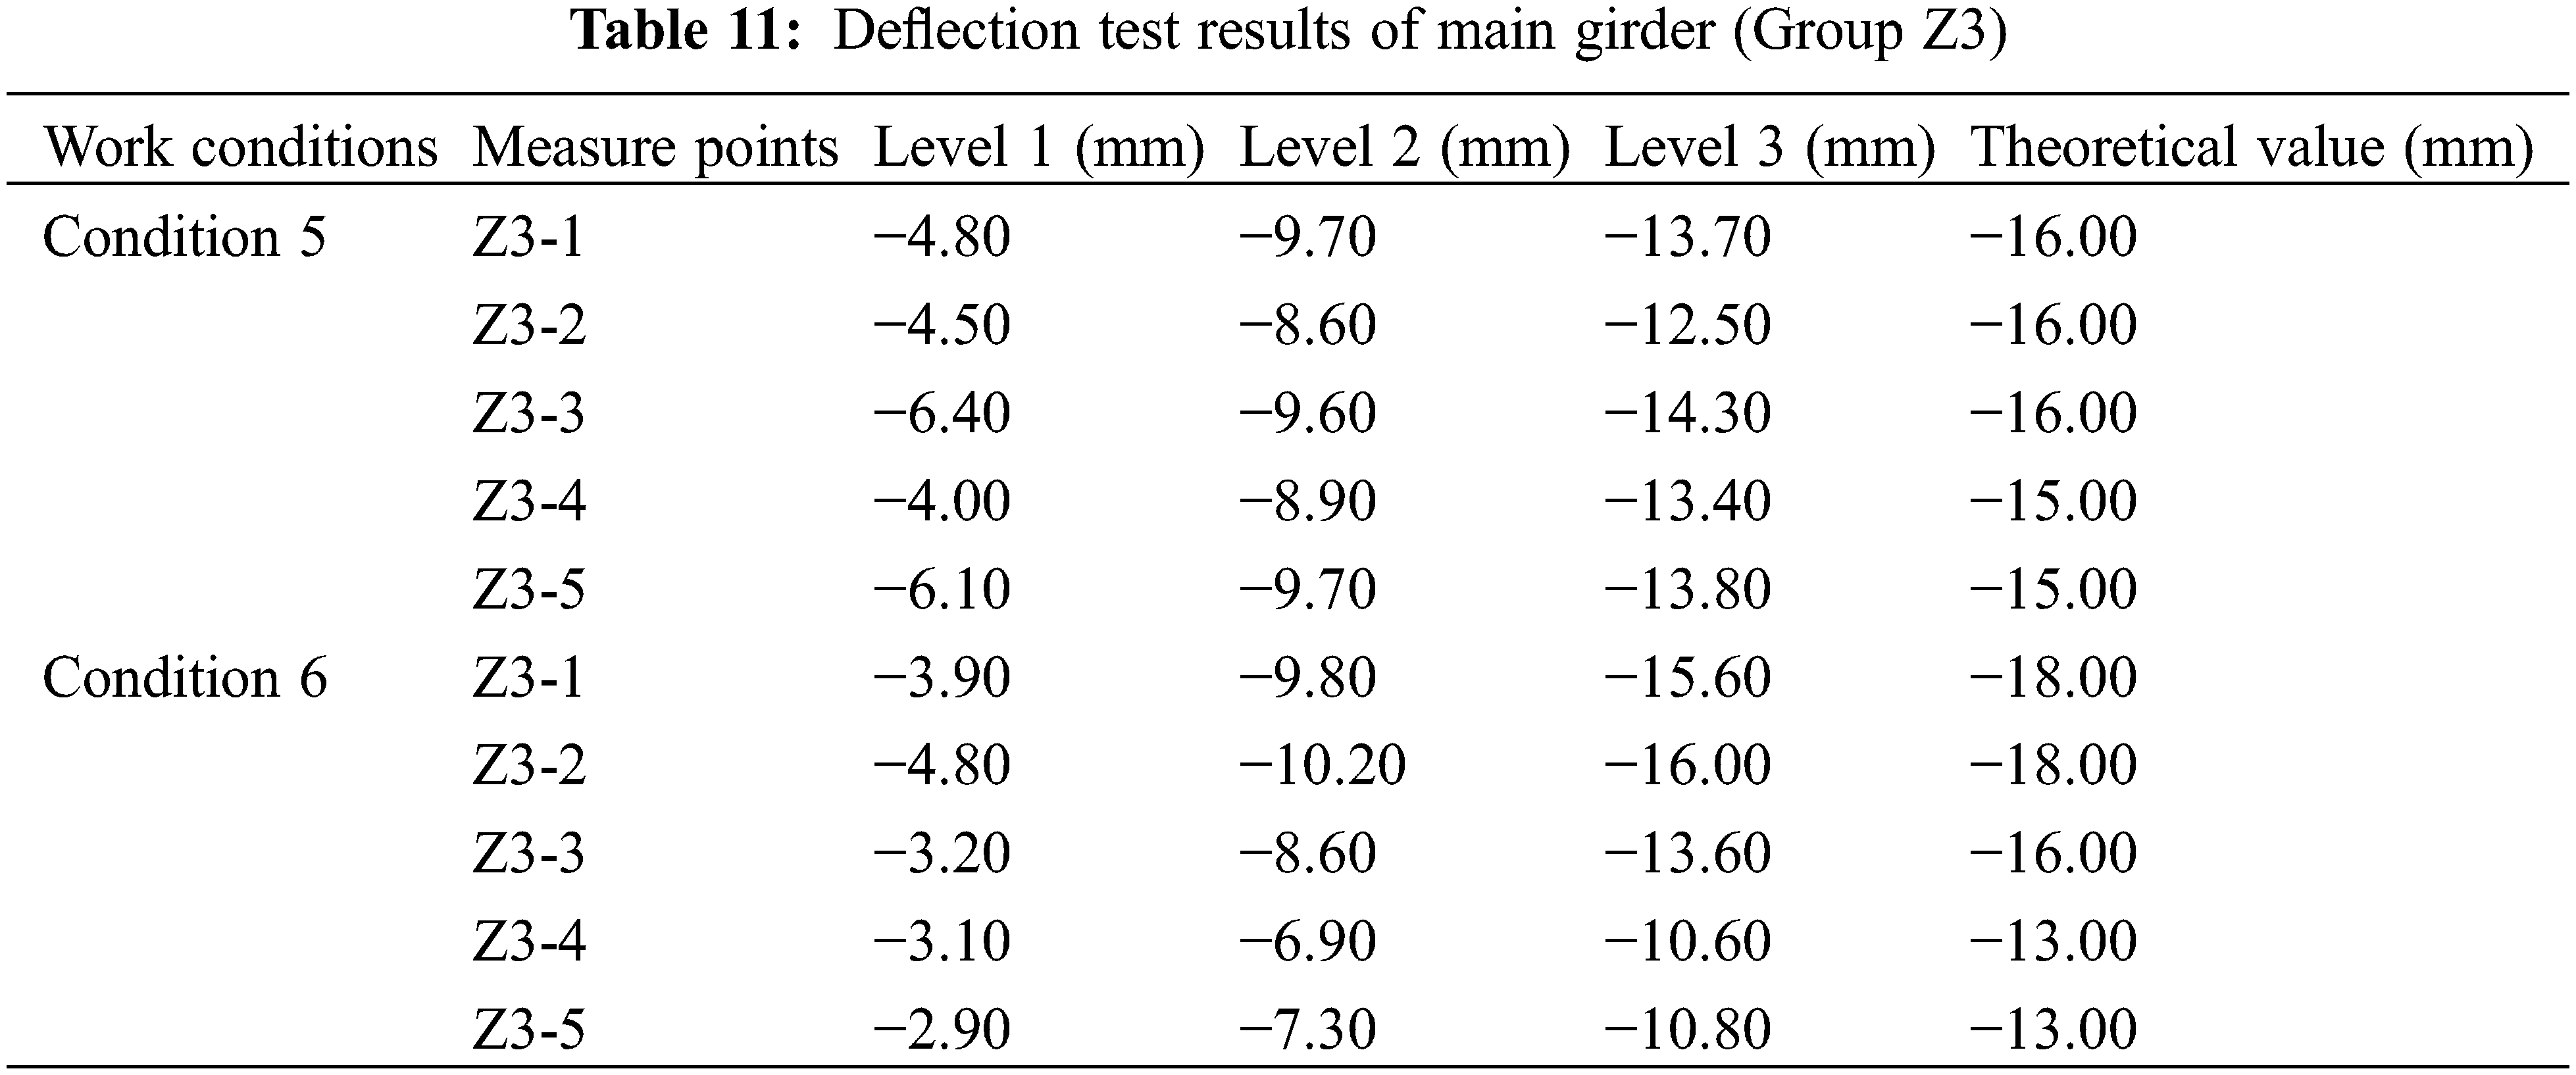
The test results of main girder deflection under working conditions 5 and 6 are shown in Table 11. From the layout direction of deflection measuring points, under working condition 5, the measured value of main girder deflection reaches the maximum at Z3-3, which is −14.30 mm, lower than the theoretical value of −16.00 mm. Under working condition 6, the measured value of main girder deflection reaches the maximum at Z3-2, which is −16.00 mm. The measured deflection of the midspan section of the main girder in the test group is less than the theoretical calculation value, indicating that the bearing capacity of the structure meets the design requirements.
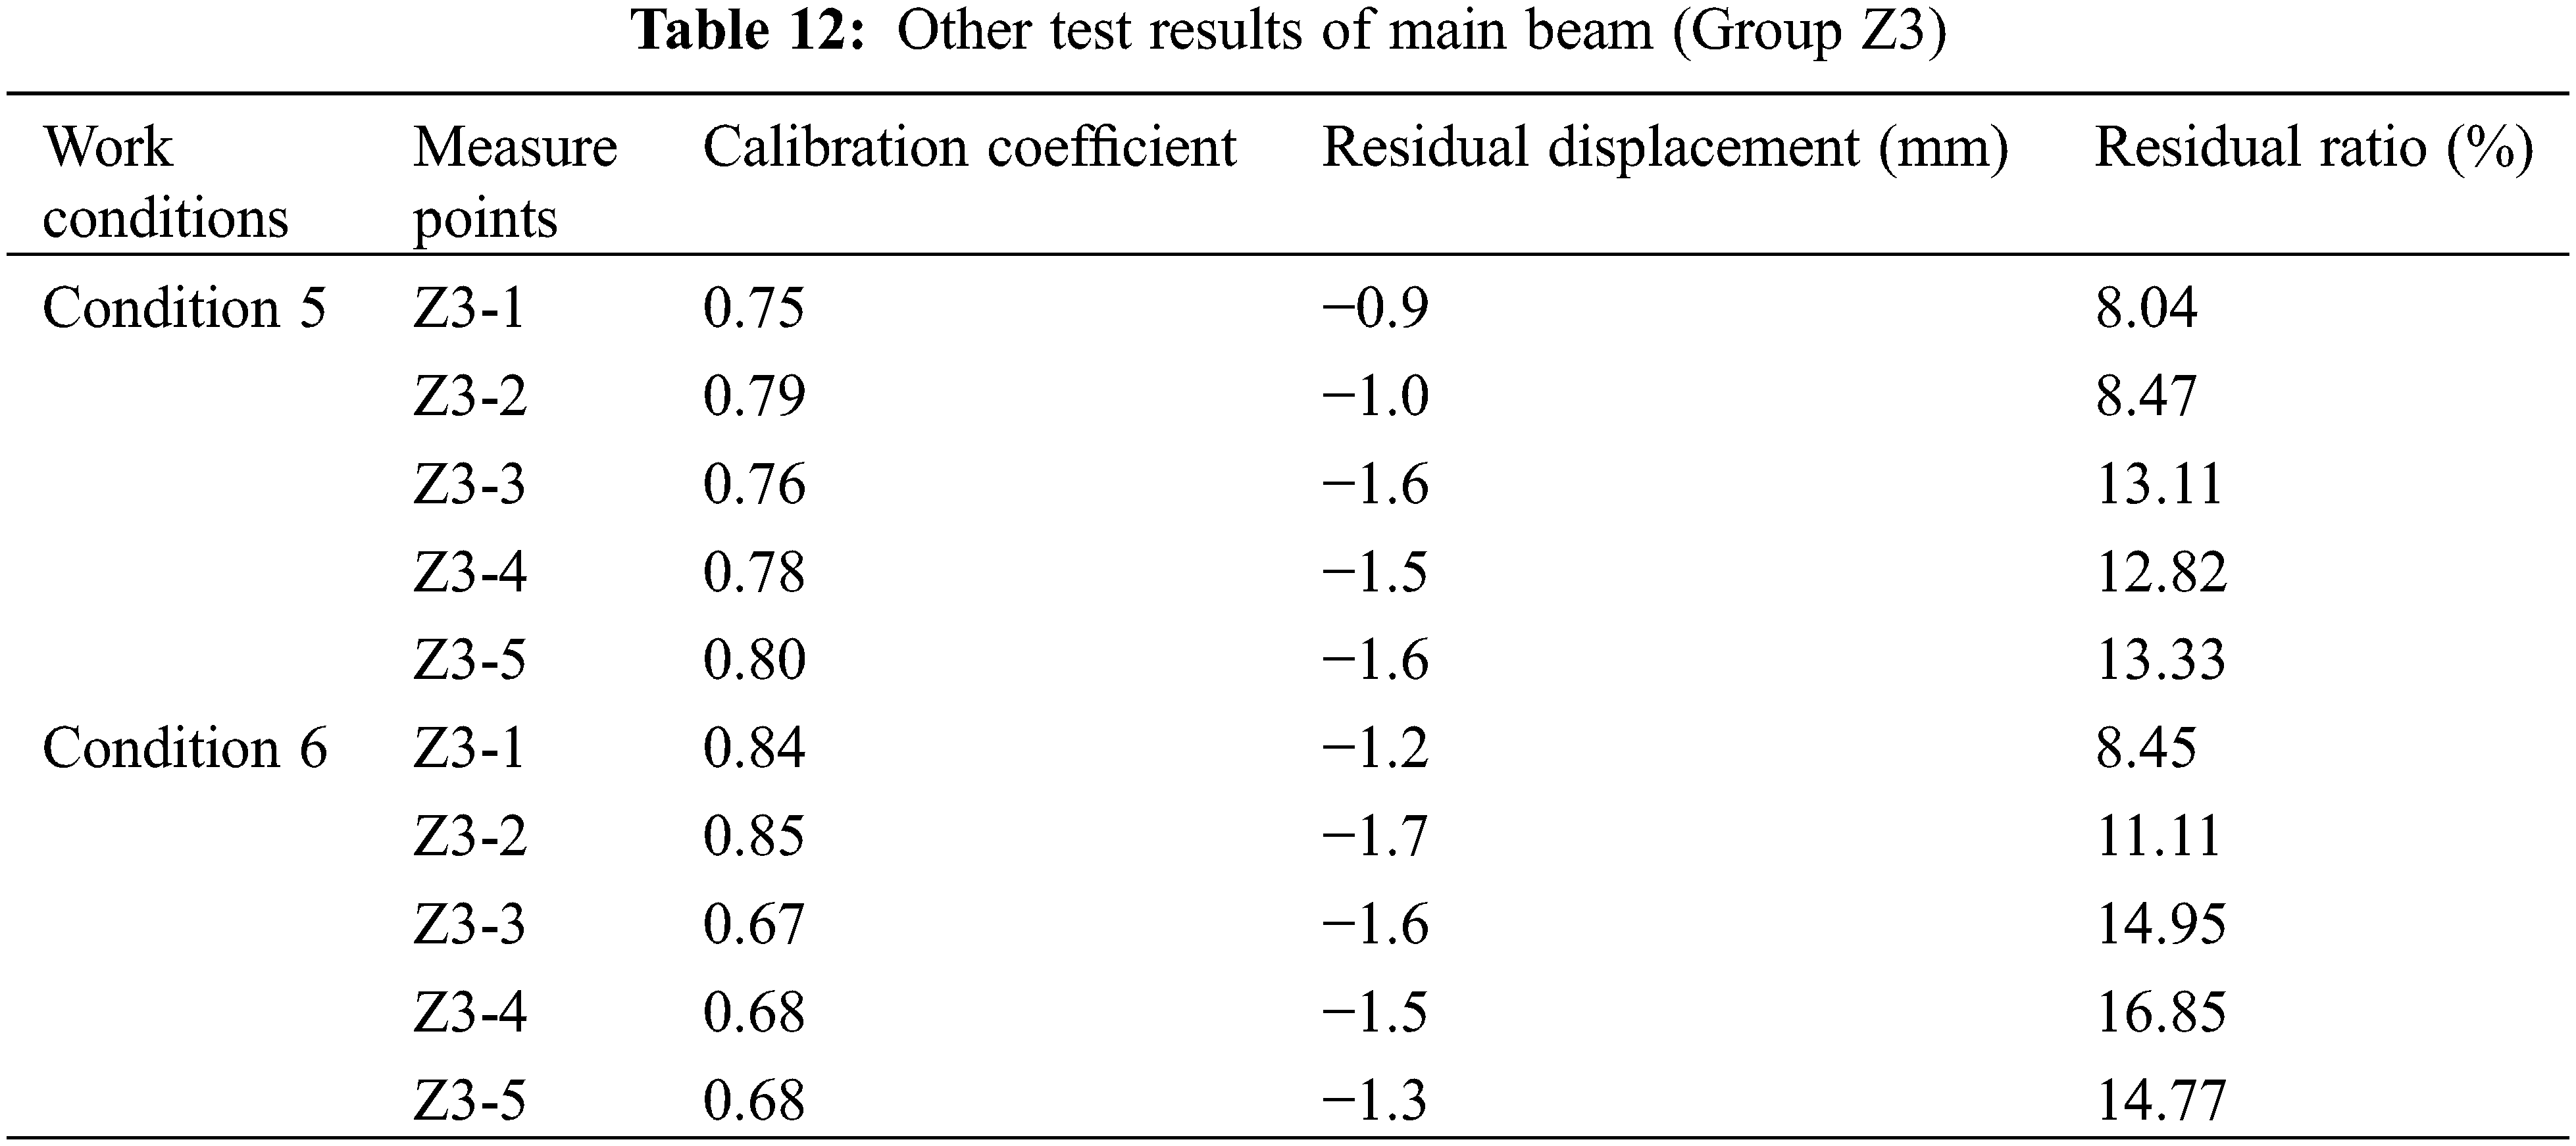
It can be seen from Table 12 that, under the load of working condition 5, the check coefficient of each measuring point of Z3 section is between 0.75 and 0.80. The maximum check coefficient is 0.80. The minimum check coefficient is 0.75. All are less than 1, indicating that the actual working condition of the bridge span structure is better than the theoretical condition. Under working condition 5, the maximum residual ratio at each measuring point of Z3 section is 13.33%, less than 20%, indicating that the structure is in elastic working condition. Under the load of working condition 6, the check coefficient of each measuring point of Z3 section is between 0.67 and 0.85. The maximum check coefficient is 0.85. The minimum check coefficient is 0.67. All are less than 1, indicating that the actual working condition of the bridge span structure is better than the theoretical condition. Under working condition 6, the maximum residual ratio at each measuring point of Z8 section is 16.85%, less than 20%, indicating that the structure is in elastic working condition.
5.1.2 Strain Test Results of Main Girder
The test results of the transverse strain of the main girder are shown in Fig. 20. The measuring point strain curve in the figure represents the variation law of the main girder strain under six working conditions. Figs. 20a and 20b show that the transverse strain of the main girder presents an inverted trapezoidal distribution law under the load of condition 1 and condition 2. Under working condition 1, the measured strain values of measuring points Z1-3 and Z1-4 are the largest, which are −11.1, less than the theoretical values −28.1 and −27.1. It is obvious that the strain of measuring point Z1-3 under condition 2 is also greater than other measuring points upward of the main girder transverse bridge. In fact, the measured value is −10.3, which is also less than the theoretical value −30.6. The measured value of the main girder strain of group Z1 is less than the theoretical value, and the stress at the measuring point is in tension, which meets the design requirements.
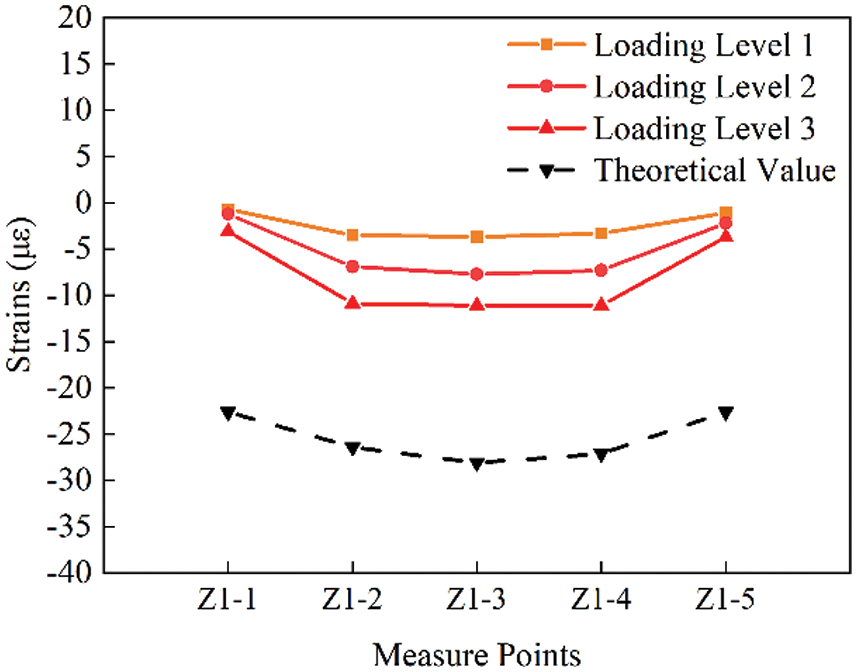
Figure 20a: Strain distribution diagram of each measuring point on Z1 section under working condition 1
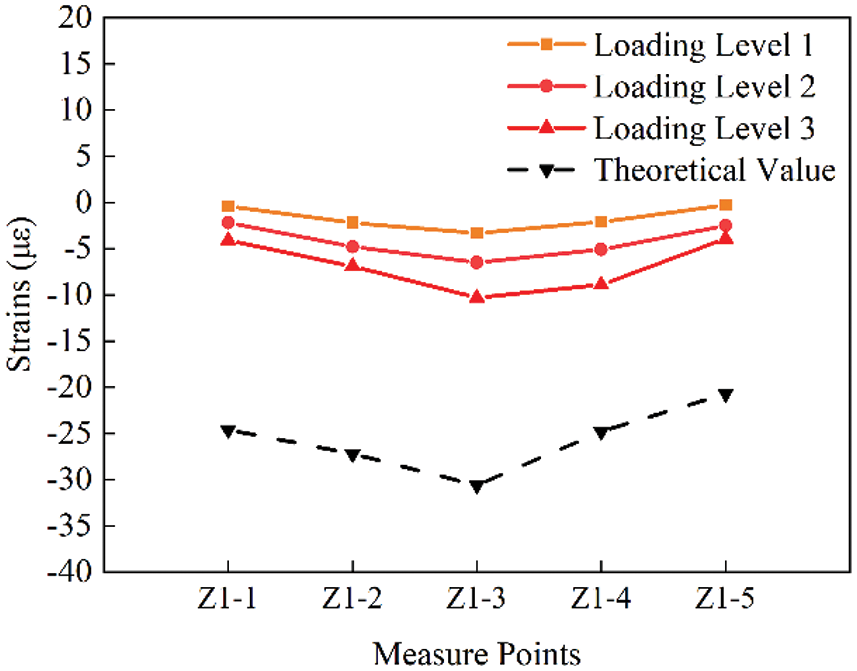
Figure 20b: Strain distribution diagram of each measuring point on Z1 section under working condition 2
The measuring point strain curve of group Z2 is shown in Figs. 20c and 20d. Compared with group Z1 and group Z3, group Z2 has 5 loading levels, so the number of curves is also increased. In addition, under condition 3 and condition 4, the most obvious difference of group Z2 is that the strain values and theoretical strain values of the five measuring points are positive. At this time, these measuring points on the main girder are subjected to tensile strain. Under work condition 3, the tensile strain of measuring point Z2-3 is the largest, which is 15.00, lower than 18.00 of the theoretical value. Under condition 4, the maximum tensile strain also appears at measuring point Z2-3, and the strain value is 15.40, which is lower than 21.40 of the theoretical value.
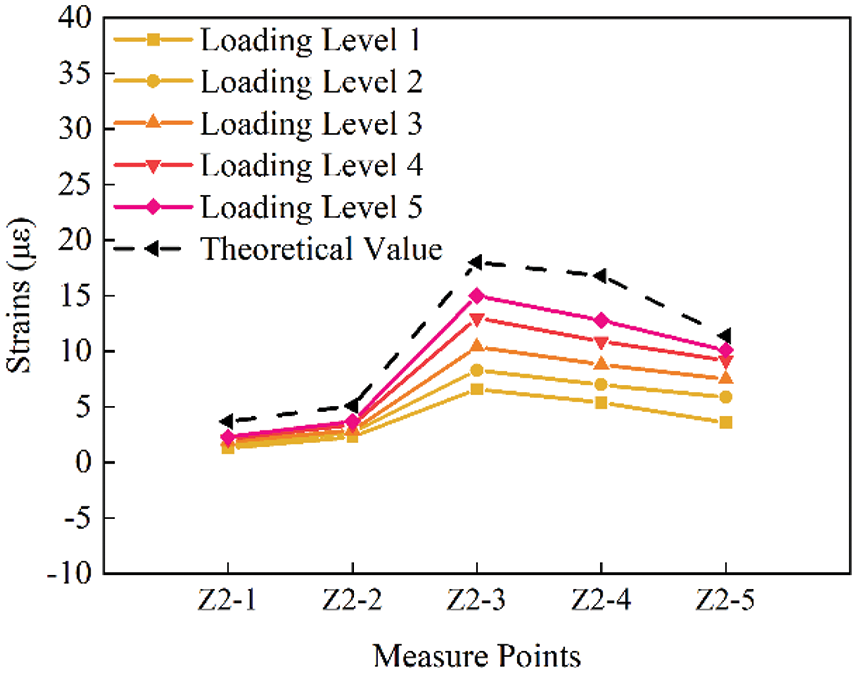
Figure 20c: Strain distribution diagram of each measuring point on Z2 section under working condition 3
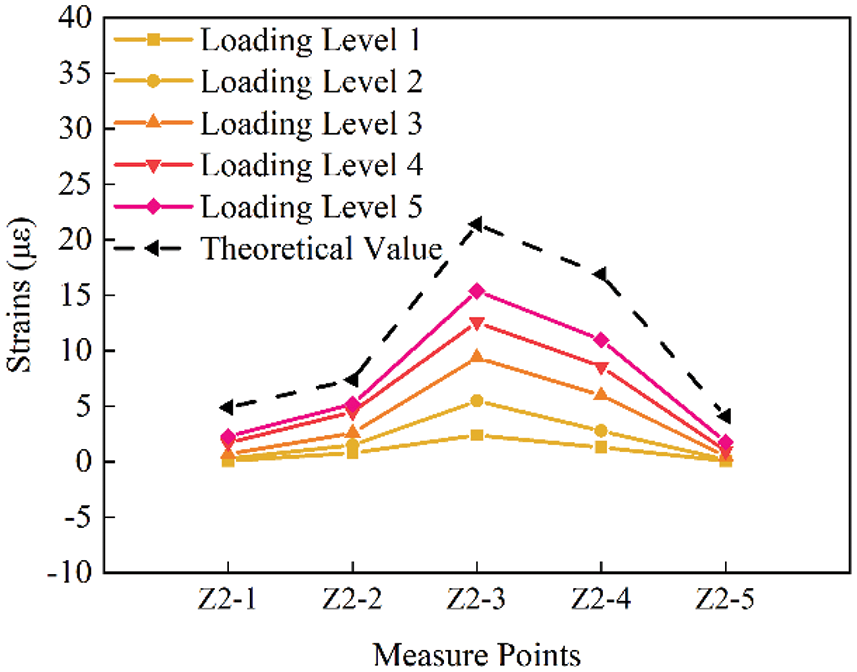
Figure 20d: Strain distribution diagram of each measuring point on Z2 section under working condition 4
The measuring point strain curves of group Z3 are shown in Figs. 20e and 20f. Similar to group Z1, group Z3 has three loading levels and all five measuring points are subjected to compressive strain. However, the curve variation laws of the two groups are obviously different. The measuring point-strain curves under conditions 5 and 6 show a ‘W’ shape. The maximum strain value of working condition 5 appears at Z3-2 and Z3-4, and the maximum value is −27.00, which is greater than −30.90 and −32.20 of the theoretical strain values. Under working condition 6, the compressive strain of measuring point Z3-2 is the largest, and the strain value is −30.00, which is lower than −34.30 of the theoretical value.
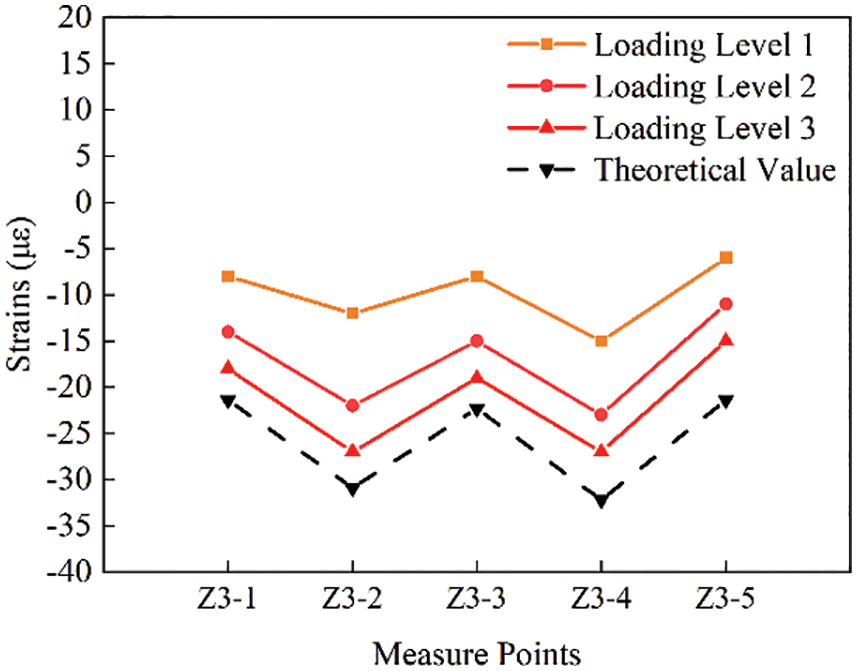
Figure 20e: Strain distribution diagram of each measuring point on Z3 section under working condition 5
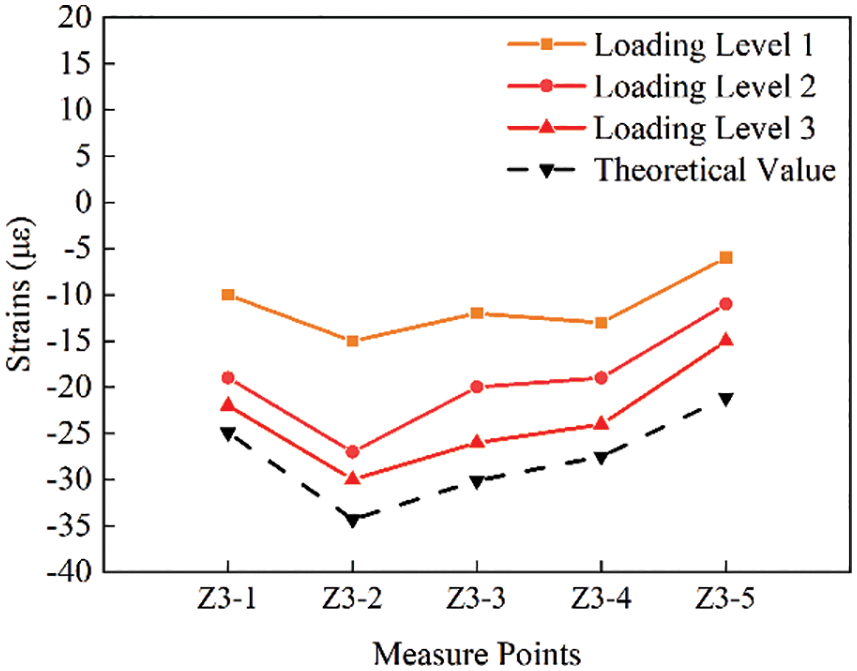
Figure 20f: Strain distribution diagram of each measuring point on Z3 section under working condition 6
5.2.1 Structural Natural Frequency Results
To obtain the vertical and horizontal vibration modes of the bridge structure, all the sensors are placed vertically and horizontally. The environmental excitation method is used to collect data. Time-velocity curve is shown in Fig. 21. Fast Fourier analysis was performed on the collected time- histories signal. The spectrum is shown in Fig. 22. After obtaining the spectrum of the measured signal, the transfer function method is used to identify the parameters of the selected frequency peak. Finally, the, 2nd, 3rd, 4th and 5th order natural frequencies of the structure are 0.781, 1.563, 1.953 and 1.954 Hz.
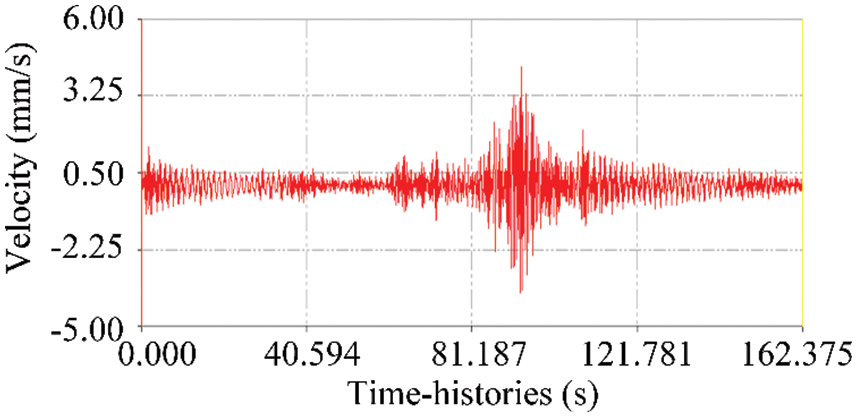
Figure 21: Time-velocity curve of corresponding channel for vertical sensor
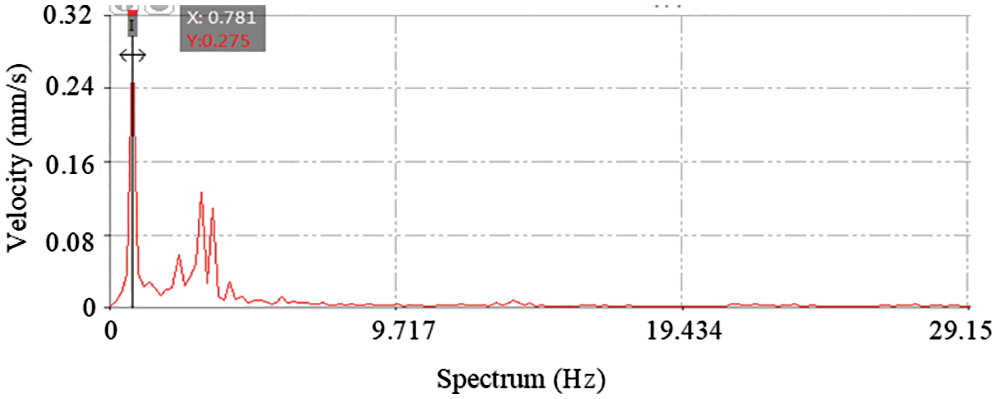
Figure 22: Signal spectrum of vertical sensor
Theoretical modal diagram of bridge span structure is shown in Fig. 23.
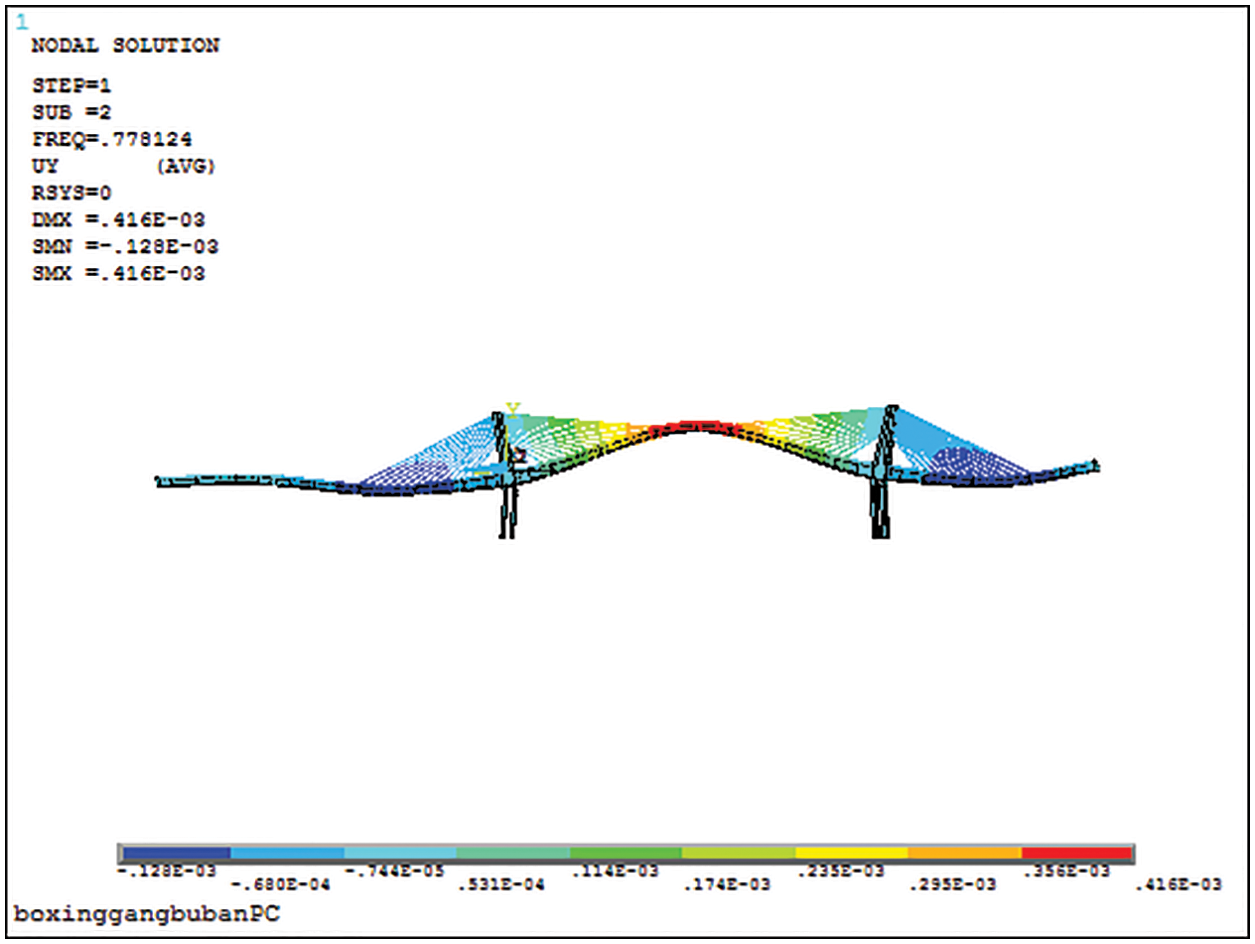
Figure 23a: Second-order mode of main beam
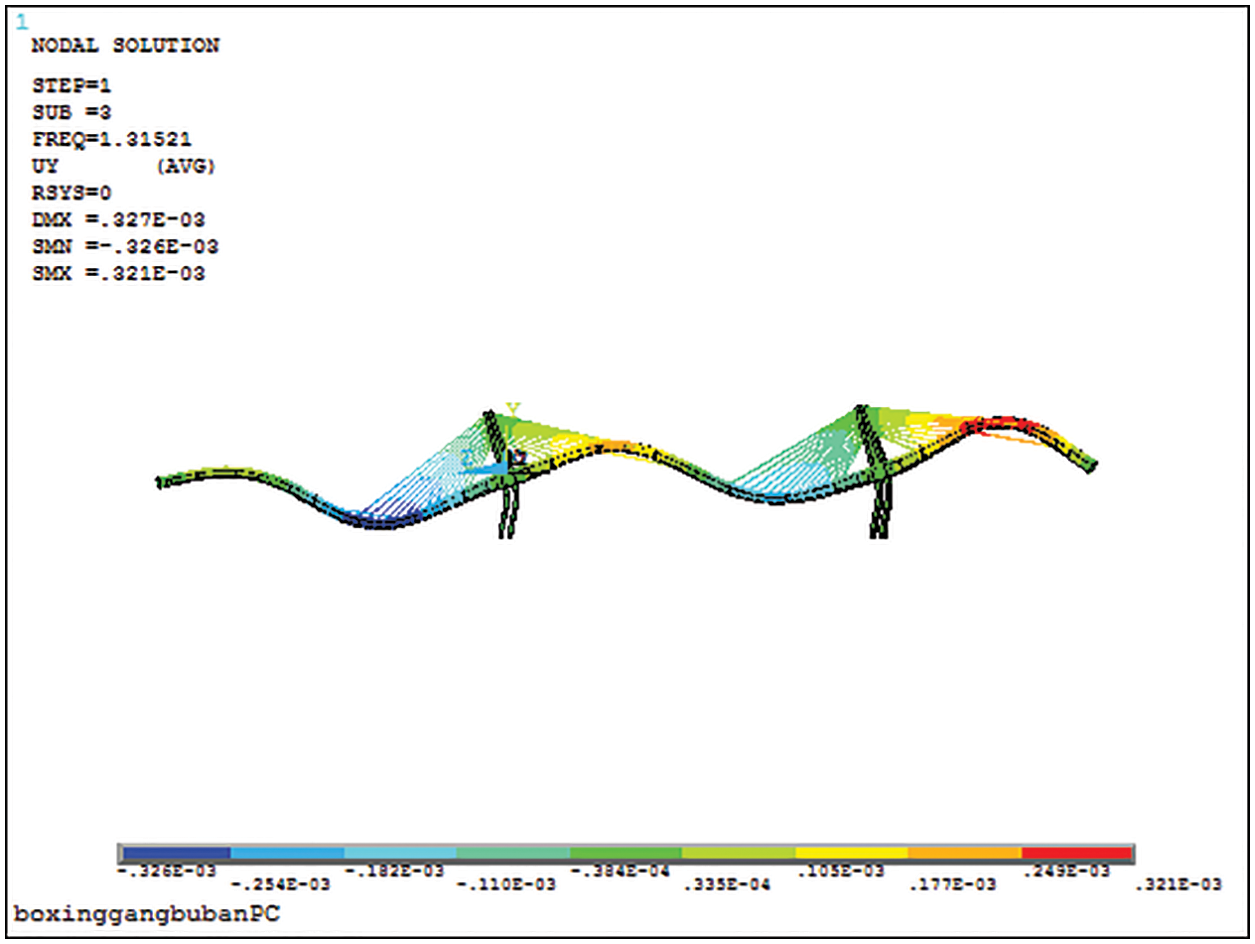
Figure 23b: Third-order mode of main beam
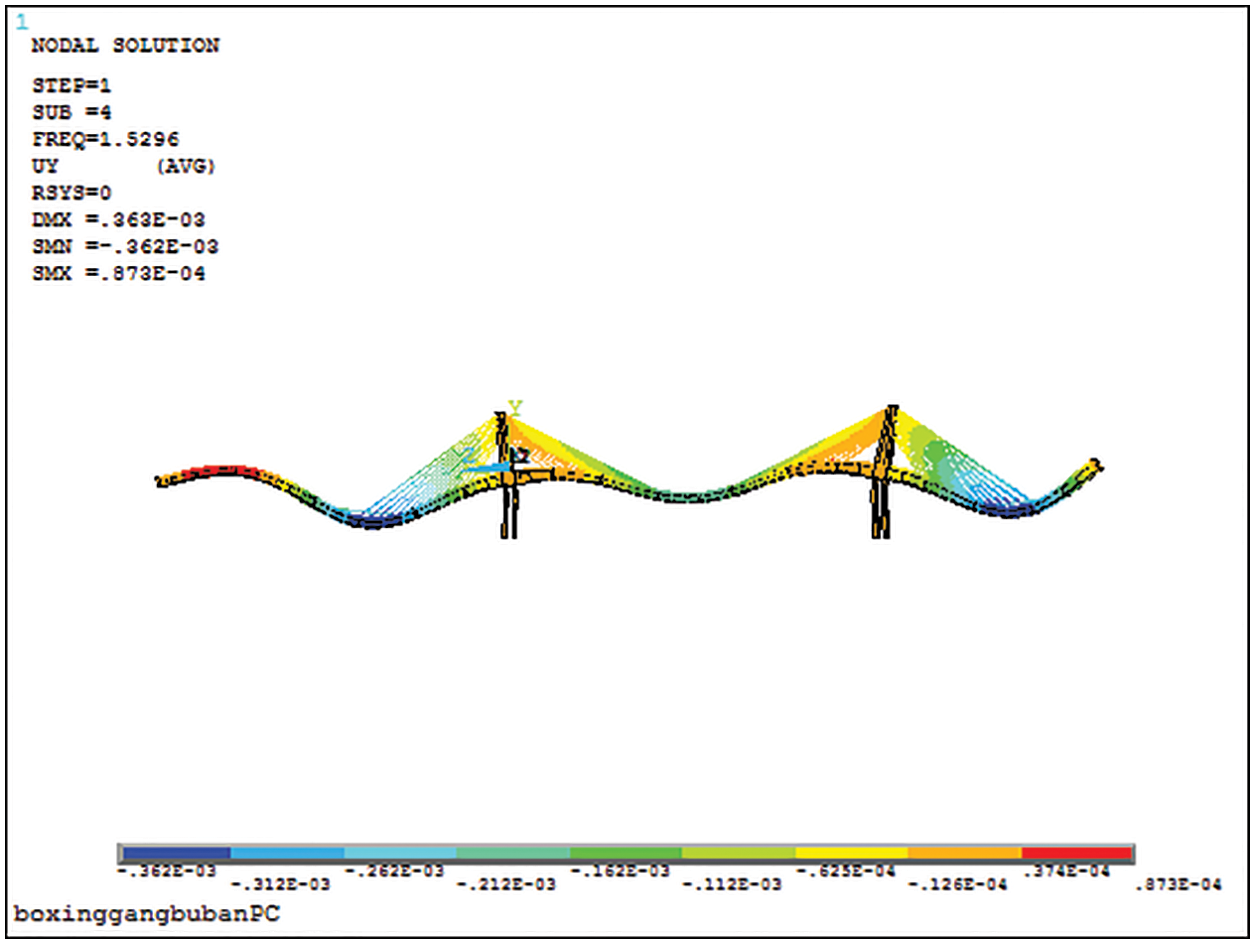
Figure 23c: Fourth-order mode of main beam
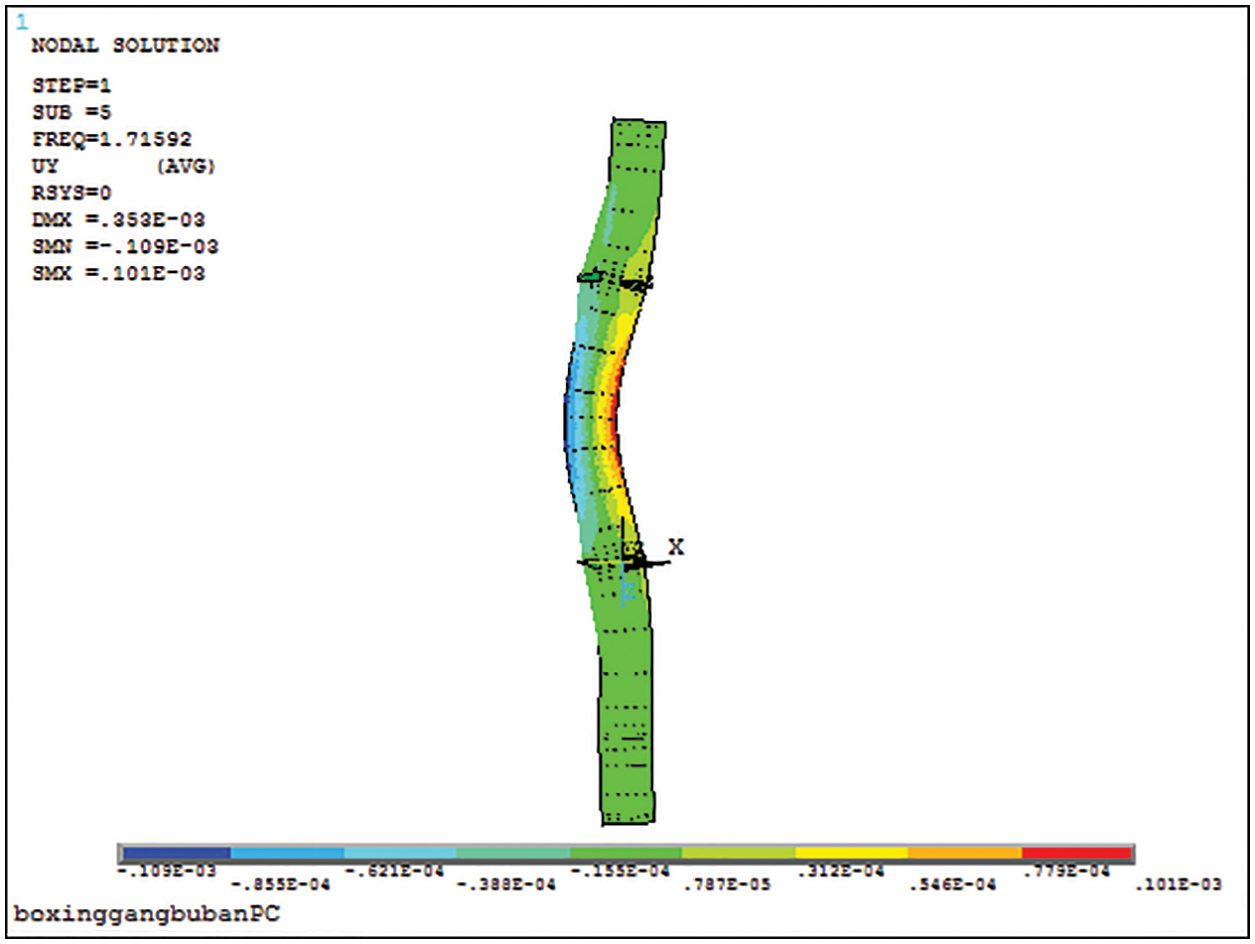
Figure 23d: Signal spectrum of vertical sensor
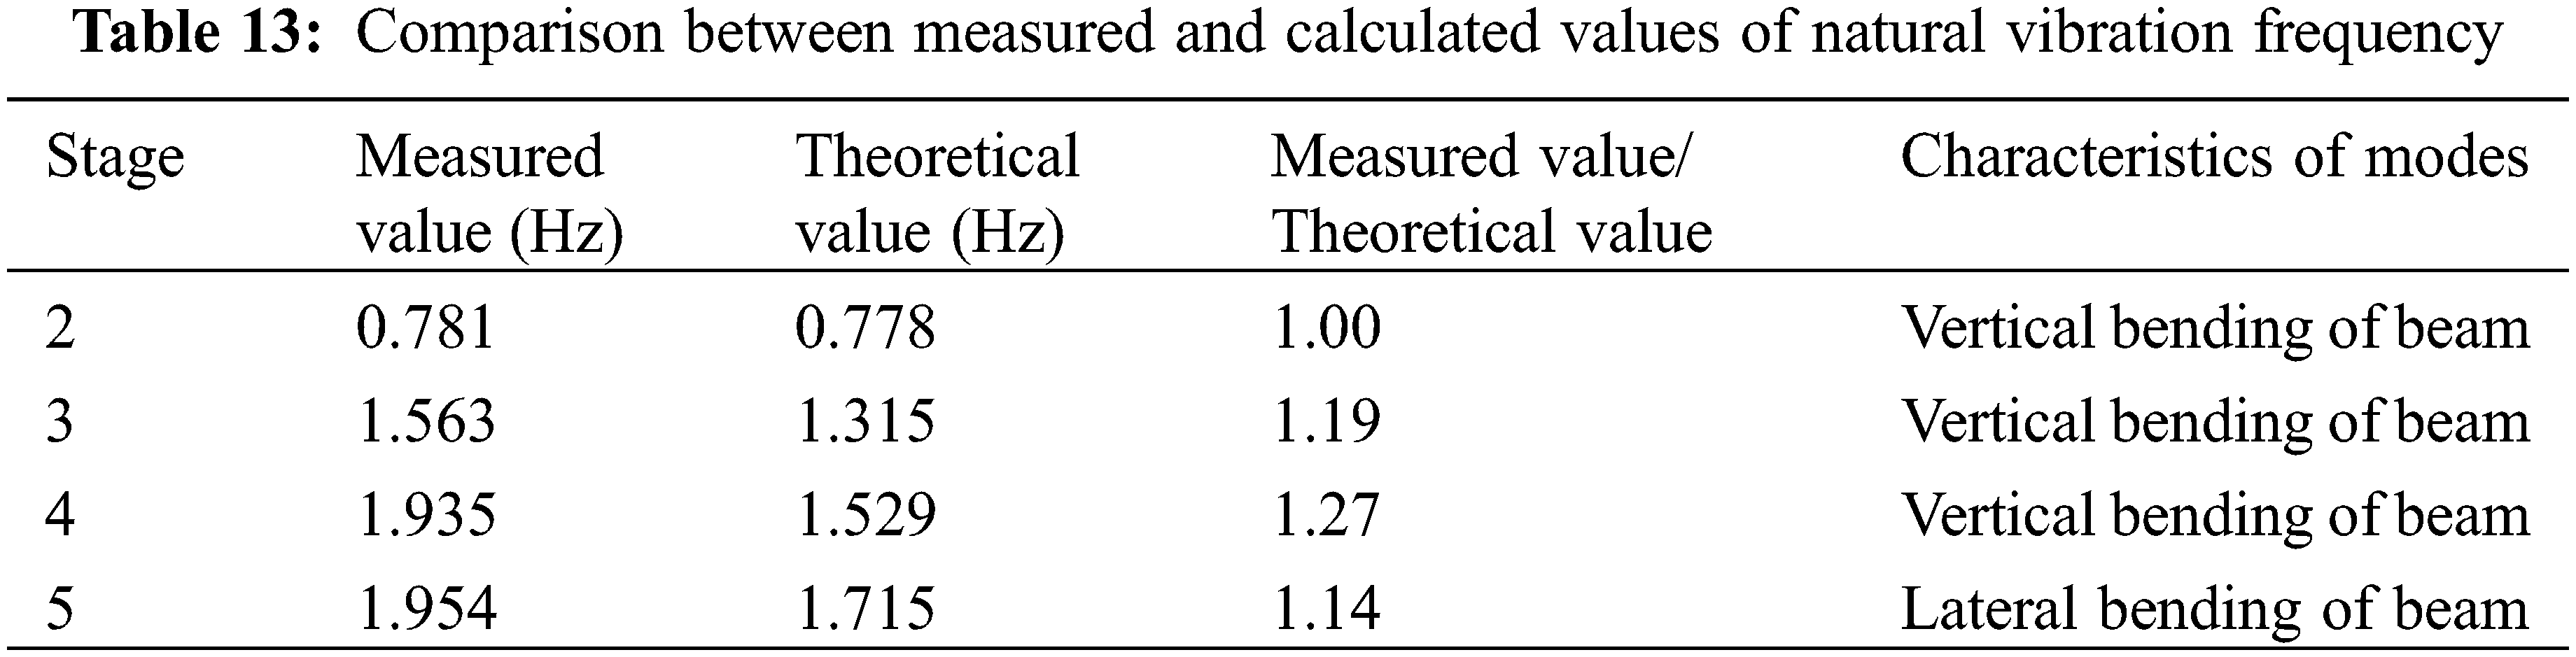
It can be seen from Table 13 that the measured values of the 2nd~5th order natural vibration frequencies of the bridge structure are larger than the corresponding theoretical calculation values. The ratio of measured value to theoretical value is between 1.00 and 1.27. The results show that the actual overall stiffness of the bridge span structure is greater than the theoretical stiffness, and the frequency distribution is consistent with the theory.
5.2.2 Determination of Damping Ratio
The damping characteristics of bridge structures are generally expressed by logarithmic decay rate
Then the damping ratio:
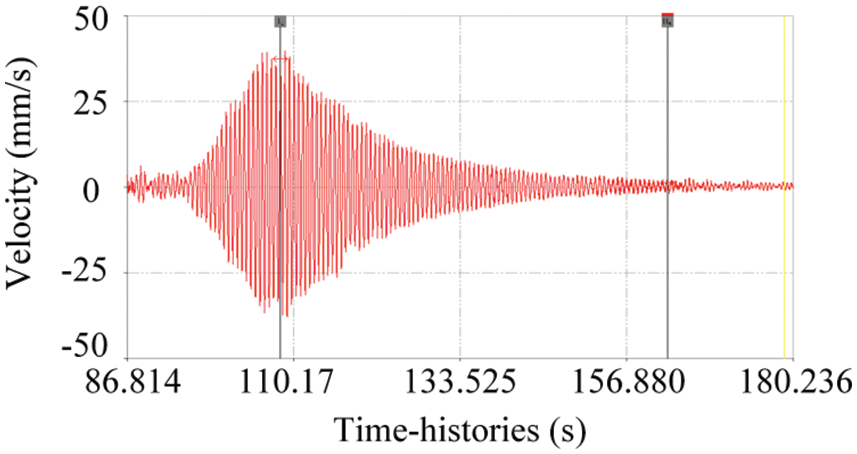
Figure 24: Bridge vibration attenuation curve under vehicle load (40 km/h running test)
(1) In the construction monitoring, the stress of each point of the monitoring section of the cable-stayed bridge is consistent with the theoretical analysis, and the measured value of the stress of the main girder control section is consistent with the theoretical value. The actual stress of the main girder is far less than the allowable compressive stress of the concrete, and in the whole construction process, all sections are in the full section compression state, and the structural stress state is well. The structure is in a safe stress state during construction. After the bridge completed, the bridge alignment is smooth and meets the specification requirements. The variation of cable force is consistent with the theoretical analysis, and the cable force value is consistent with the theoretical value. The construction monitoring ensures the construction quality and safety of the bridge and achieves the expected goal.
(2) The static load test results show that the measured strain at each measuring point of the bridge is basically linear along the girder height under the test load condition. This shows that the structure basically conforms to the plane section assumption. The measured deflection of the midspan section of the main girder is less than the theoretical calculation value, and the difference is no more than 10%, indicating that the bearing capacity of the structure meets the design requirements. The measured natural vibration frequencies of the bridge are 0.781, 1.563, 1.935 and 1.954 Hz, respectively, which are larger than the theoretical values of corresponding orders. The ratio of measured value to theoretical value is between 1.00 and 1.27. The actual stiffness of the bridge structure is greater than the theoretical stiffness. The measured damping ratio of bridge structure is 0.0067, and the logarithmic attenuation rate is 0.042. The damping ratio of the bridge is in the normal range, indicating that the bridge structure has a good ability to dissipate the external energy input.
Funding Statement: We would like to express our deep gratitude to the 2021 Liaoning Province Doctoral Research Start-Up Fund Project (2021-BS-168) for financial support.
Conflicts of Interest: The authors declare that they have no conflicts of interest to report regarding the present study.
References
1. Kiymaz, G., Coskun, E., Cosgun, C., Seckin, E. (2010). Transverse load carrying capacity of sinusoidally corrugated steel web girders with web openings. Steel & Composite Structures, 10(1), 69–85. https://doi.org/10.12989/scs.2010.10.1.069 [Google Scholar] [CrossRef]
2. Choi, K., Lee, J., Chung, C. H., An, D., Yoon, J. (2021). Structural behavior evaluation of a cable-stayed bridge subjected to aircraft impact: A numerical study. Journal of the Computational Structural Engineering Institute of Korea, 34(3), 137–149. https://doi.org/10.7734/COSEIK.2021.34.3.137 [Google Scholar] [CrossRef]
3. Liu, S., Corte, W. D., Ding, H., Taerwe, L. (2021). Mechanical properties of curved composite box girders with corrugated steel webs. Steel and Composite Structures, 41(1), 65–84. [Google Scholar]
4. He, J., Liu, Y., Chen, A., Yoda, T. (2012). Shear behavior of partially encased composite I-girder with corrugated steel web: Numerical study. Journal of Constructional Steel Research, 77(6), 193–209. https://doi.org/10.1016/j.jcsr.2012.05.005 [Google Scholar] [CrossRef]
5. Metwally, A. E., Loov, R. E. (2003). Corrugated steel webs for prestressed concrete girders. Materials and Structures, 36(2), 127–134. https://doi.org/10.1007/BF02479526 [Google Scholar] [CrossRef]
6. Aizon, N. H., Adnan, A. N. (2022). Seismic damage-level prediction model of cable-stayed bridge using nonlinear time history analysis for intelligent structural health monitoring under earthquake events. Internet Optimized Publicity Conference Series: Earth and Environmental Science, 971(1), 12033. https://doi.org/10.1088/1755-1315/971/1/012033 [Google Scholar] [CrossRef]
7. Wolff, M., Starossek, U. (2009). Cable loss and progressive collapse in cable-stayed bridges. Bridge Structures, 5(1), 17–28. https://doi.org/10.1080/15732480902775615 [Google Scholar] [CrossRef]
8. Sousa Tomé, E., Pimentel, M., Figueiras, J. (2019). Online early damage detection and localisation using multivariate data analysis: Application to a cable-stayed bridge. Structural Control and Health Monitoring, 26(11), e2434. https://doi.org/10.1002/stc.2434 [Google Scholar] [CrossRef]
9. Lu, Y., Ji, L. (2018). Behavior of optimized prestressed concrete composite box-girders with corrugated steel webs. Steel and Composite Structures, 26(2), 183–196. [Google Scholar]
10. Lozano-Galant, J. A., Paya-Zaforteza, I. (2017). Analysis of Eduardo Torroja’s Tempul Aqueduct an important precursor of modern cable-stayed bridges, extradosed bridges and prestressed concrete. Engineering Structures, 150(10), 955–968. https://doi.org/10.1016/j.engstruct.2017.07.057 [Google Scholar] [CrossRef]
11. Shiratani, H., Ikeda, H., Imai, Y., Kano, K. (2010). Flexural and shear behavior of composite bridge girder with corrugated steel webs around middle support. Doboku Gakkai Ronbunshu, 724, 49–67. [Google Scholar]
12. Keita, N., Teruhiko, Y., Kouichi, S., Michihiro, S. (2010). Study on out-of-plane bending of concrete dowels in a composite girder with corrugated steel web. Doboku Gakkai Ronbunshu, 647, 267–279. [Google Scholar]
13. Wang, Z. Y., Wang, Q. Y., Jiang, R. J. (2015). Finite element based fatigue assessment of corrugated steel web girders in highway bridges. International Journal of Civil Engineering, 13(4), 419–431. [Google Scholar]
14. Moon, J., Ko, H. J., Sung, I. H., Lee, H. E. (2015). Natural frequency of a composite girder with corrugated steel web. Steel and Composite Structures, 18(1), 255–271. https://doi.org/10.12989/scs.2015.18.1.255 [Google Scholar] [CrossRef]
15. Eldib, A. H. (2009). Shear buckling strength and design of curved corrugated steel webs for bridges. Journal of Constructional Steel Research, 65(12), 2129–2139. https://doi.org/10.1016/j.jcsr.2009.07.002 [Google Scholar] [CrossRef]
16. Berényi, A., Lovas, T., Barsi, Á., Dunai, L. (2009). Potential of terrestrial lasers canning in load test measurements of bridges. Periodica Polytechnica Civil Engineering, 53(1), 25–33. https://doi.org/10.3311/pp.ci.2009-1.04 [Google Scholar] [CrossRef]
17. Wang, P. H., Lin, H. T., Tang, T. Y. (2002). Study on nonlinear analysis of a highly redundant cable-stayed bridge. Computers & Structures, 80(2), 165–182. https://doi.org/10.1016/S0045-7949(01)00166-3 [Google Scholar] [CrossRef]
18. Casciati, S., Elia, L. (2017). Damage localization in a cable-stayed bridge via bio-inspired metaheuristic tools. Structural Control and Health Monitoring, 24(5), e1922. https://doi.org/10.1002/stc.1922 [Google Scholar] [CrossRef]
19. Guntorojati, I. (2017). Flutter analysis of cable stayed bridge. Procedia Engineering, 171, 1173–1177. https://doi.org/10.1016/j.proeng.2017.01.484 [Google Scholar] [CrossRef]
20. Farhangdoust, S., Mehrabi, A. (2020). Non-destructive evaluation of closure joints in accelerated bridge construction using a damage etiology approach. Applied Sciences, 10(4), 1457. https://doi.org/10.3390/app10041457 [Google Scholar] [CrossRef]
21. Singh, P., Baig, M. J., Pandey, B., Papreja, K. (2020). Designing and 3-D modelling of a sustainable cable stayed bridge-a case study. E3S Web of Conferences, 220(6), 01070. https://doi.org/10.1051/e3sconf/202022001070 [Google Scholar] [CrossRef]
22. Soe, T., Khaing, S. Y. (2020). Evaluation of cable force changes effects on cable stayed bridge. Civil Engineering Journal, 6(11), 2159–2174. https://doi.org/10.28991/cej-2020-03091609 [Google Scholar] [CrossRef]
23. Pakos, W., Grosel, J. (2019). Reduction of cable vibrations in a cable stayed bridge under biharmonic excitation. Engineering Structures, 189(15), 1–10. https://doi.org/10.1016/j.engstruct.2019.03.054 [Google Scholar] [CrossRef]
24. Hester, D., Brownjohn, J., Bocian, M., Xu, Y. (2017). Low cost bridge load test: Calculating bridge displacement from acceleration for load assessment calculations. Engineering Structures, 143(15), 358–374. https://doi.org/10.1016/j.engstruct.2017.04.021 [Google Scholar] [CrossRef]
25. Sundru, S. (2018). Assessment of replacement bridge using proof load test. Journal of the Institution of Engineers (IndiaSeries A, 99(1), 155–163. https://doi.org/10.1007/s40030-017-0259-2 [Google Scholar] [CrossRef]
26. Bekturov, A., Chymbyldaev, N. T., Toguztoroev, A. T., Ashyraliev, T. A. (2019). Surveying of vertical displacement of a bridge on the Kara-Unkur river during a load test. Herald of the Russian Academy of Sciences, 19(8), 106–110. [Google Scholar]
27. Shoushtari, E., Saiidi, M. S., Itani, A., Moustafa, M. A. (2020). Pretest analysis of shake table response of a two-span steel girder bridge incorporating accelerated bridge construction connections. Frontiers of Structural and Civil Engineering, 14(1), 169–184. https://doi.org/10.1007/s11709-019-0590-y [Google Scholar] [CrossRef]
28. Briseghella, B., Fa, G., Aloisio, A., Pasca, D., He, L. et al. (2021). Dynamic characteristics of a curved steel-concrete composite cable-stayed bridge and effects of different design choices. Structures, 34, 4669–4681. [Google Scholar]
29. Zhang, L., Qiu, G., Chen, Z. (2021). Structural health monitoring methods of cables in cable-stayed bridge: A review. Measurement, 168(4), 108343. https://doi.org/10.1016/j.measurement.2020.108343 [Google Scholar] [CrossRef]
30. Farhangdoust, S., Mehrabi, A. (2019). Health monitoring of closure joints in accelerated bridge construction: A review of non-destructive testing application. Journal of Advanced Concrete Technology, 17(7), 381–404. https://doi.org/10.3151/jact.17.381 [Google Scholar] [CrossRef]
Cite This Article
 Copyright © 2023 The Author(s). Published by Tech Science Press.
This work is licensed under a Creative Commons Attribution 4.0 International License , which permits unrestricted use, distribution, and reproduction in any medium, provided the original work is properly cited.
 Downloads
 Citation Tools