
 Submit a Paper
 Propose a Special lssue
 Open Access
ARTICLE

Impact Damage Identification of Aluminum Alloy Reinforced Plate Based on GWO-ELM Algorithm
1
School of Control Science and Engineering, Shandong University, Jinan, 250061, China
2
Communication Technology Division, Shandong Institute of Space Electronic Technology, Yantai, 264000, China
* Corresponding Author: Faye Zhang. Email:
Structural Durability & Health Monitoring 2023, 17(6), 485-500. https://doi.org/10.32604/sdhm.2023.025989
Received 09 August 2022; Accepted 08 February 2023; Issue published 17 November 2023
 View Full Text
 Download PDF
Abstract
As a critical structure of aerospace equipment, aluminum alloy stiffened plate will influence the stability of spacecraft in orbit and the normal operation of the system. In this study, a GWO-ELM algorithm-based impact damage identification method is proposed for aluminum alloy stiffened panels to monitor and evaluate the damage condition of such stiffened panels of spacecraft. Firstly, together with numerical simulation, the experimental simulation to obtain the damage acoustic emission signals of aluminum alloy reinforced panels is performed, to establish the damage data. Subsequently, the amplitude-frequency characteristics of impact damage signals are extracted and put into an extreme learning machine (ELM) model to identify the impact location and damage degree, and the Gray Wolf Optimization (GWO) algorithm is employed to update the weight parameters of the model. Finally, experiments are conducted on the irregular aluminum alloy stiffened plate with the size of 2200 mm × 500 mm × 10 mm, the identification accuracy of impact position and damage degree is 98.90% and 99.55% in 68 test areas, respectively. Comparative experiments with ELM and backpropagation neural networks (BPNN) demonstrate that the impact damage identification of aluminum alloy stiffened plate based on GWO-ELM algorithm can serve as an effective way to monitor spacecraft structural damage.Keywords
In recent years, the rapidly developing aerospace industry and activities have led to a surge in space debris [1–3], which not only increases the risk of space exploration, but also threatens the safety of manned spacecraft and astronauts. Due to the ongoing requirements for the space capsule structure, including high reliability, low quality and high performance, increasing efforts has been carried out to improve the structural properties of materials. At present, featuring low density, high specific strength, high specific stiffness, good corrosion resistance and plasticity, aluminum alloy has been widely employed as structural material for large sealed tanks [4]. In addition, the stiffened structure also allows for an excellent post-buckling bearing, serving as a critical part of the cabin structure. Although the performance of aluminum alloy plates has been improved by adding these reinforcement structures, plate waves, which may be impact signals, propagate through the aluminum alloy reinforcement plates and cause complex changes such as reflection, scattering, attenuation, and superposition when passing through these reinforcement ribs and frames [5]. Consequently, it will affect the judgment of impact damage.
Time difference localization and intelligent algorithm are employed to identify the impact location [6–8]. The former is to calculate the position of impact point using at least three sensors to detect the arrival time of acoustic emission signals generated by impact events [9–11]. Wang et al. [12] managed to determine the precise location of wind turbine blade (WTB) surface impact by employing fiber Bragg grating (FBG) and time difference, where the Teager energy operator (TEO) was utilized to amplify the instantaneous energy of the reconstructed signal to identify the time difference between FBGs. Then, the impact location was confirmed after solving the hyperbolic mode with the time difference. Liu et al. [13] proposed a newly generalized regression neural network-based acoustic emission (AE) source localization method to improve localization accuracy. Ebrahimkhanlou et al. [14] suggested a deep learning-based framework to locate and characterize the AE sources in plate-like structures with complex geometric features, including multipliers and rivet connections. For isotropic plates, the wave velocity can serve as a constant. However, in terms of the anisotropic plate or the stiffened plate with an irregular shape, the propagation is accompanied by scattering and mode transformation of impact stress waves, in which the wave velocity could not be treated as a constant. The time difference positioning will cause a severe error.
The booming computer technology witnesses prominent progress in intelligent algorithms [15–17]. Supported by signal processing technology and intelligent algorithm, the identified impact damage of complex structures based on sensors-acquired acoustic emission signals could be achieved via neural network [18,19], machine learning [20] and other algorithms [21]. Djemana et al. [22] realized the damage location based on ELM algorithm with the damage data collected from piezoelectric sensors. Pan et al. [23] proposed a two-stage rolling bearing life prediction method using the relative root mean square value (RRMS) and ELM, where the correlation analysis could select the sensitive features and predict the remaining service life by multivariable feedback ELM. Fu et al. [24] revealed the prediction of the impact position of aluminum plate using the fast-learning characteristics of ELM, and the ELM had much faster application efficiency in comparison with support vector machine (SVM) or back propagation neural network (BPNN). Yu et al. [25] studied the motor rotor fault diagnosis based on ELM model by employing the discrete Fourier transform (DFT) to extract fault features. In the study of Ghadimi et al. [26] using Euler beam to identify the structures of cracks, the authors employed ELM to learn sensitive features from such parameters as modal strain energy and natural frequency, and detected the structural damage. Shu et al. [27] proposed the validity of variance and covariance calculated from the structural dynamic response analysis to train the damage identification model as the input of artificial neural network (ANN), and realized the evaluation of the location and damage condition of bridge structure. Benefitting from the high adaptability and powerful function approximation capability of ANN, Qiu et al. [28] explored wind turbines damage identification at different locations and levels, taking the dynamic response parameters as the network input. Coelho et al. [29] employed the time-delay embedding feature extraction to realize the accurate identification of low-speed impact damage based on SVM. Liu et al. proposed a distributed dynamic load identification method based on a hierarchical clustering radial basis function framework [30], as well as and a dynamic force reconstruction method under multi-source uncertainty based on an artificial neural network (ANN)-Bayesian probability framework (BPF) [31], which can be applied to identify the impact load localization. However, those methods mainly identify the position of impact damage regarding the flat aluminum alloy plate, without obtaining the position identification and the damage of aluminum alloy reinforced plate. In the plate, the accuracy of low impact damage identification could fall.
Considering the complex characteristics of impact stress wave in aluminum alloy reinforced structure, the traditional ways of damage identification could not be accurate, following the insufficient stability and poor classification effect due to the randomly generated weights in the standard ELM algorithm-based methodology. To solve this problem, an impact damage identification for aluminum alloy stiffened plate based on GWO-ELM algorithm is proposed. Firstly, an aluminum alloy stiffened plate was employed as the carrier, and the acquisition system of impact damage signal was established by combining the ground simulation with the numerical one. Afterwards, based on the analysis of the propagation characteristics of impact acoustic emission signal, the acquired signals were utilized to establish the impact damage sample library. Finally, the parameters of the ELM model were optimized with the Gray Wolf algorithm, and the obtained impact damage intelligent identification model of the aluminum alloy stiffened plate was verified for performance via experiments.
As for the framework of this paper, Section 2 mainly introduces the technical principle and implementation process of impact damage identification method for aluminum alloy stiffened panels. Section 3 describes the construction of impact damage signal acquisition system. Section 4 depicts the experiments and experimental results analysis. Section 5 summarizes the paper.
2 Impact Damage Identification Algorithm
2.1 Impact Stress Wave Propagation Analysis of Aluminum Alloy Stiffened Plate
The complex structure of aluminum alloy stiffened plate will make changes in impact stress wave, such as reflection, scattering, attenuation and superposition. Therefore, to understand the propagation characteristics of stress waves in the aluminum alloy stiffened plate, the impact simulation model of the spacecraft bulkhead aluminum alloy stiffened plate was established based on ANSYS, as depicted in Fig. 1. The impact process was simulated using aluminum alloy projectile to impact the target plate with high speed. Four observation points on the target plate were set to acquire the high-speed impact acoustic emission signals. The specific parameters of the simulation model are shown in Table 1.
Figure 1: The impact simulation model of aluminum alloy stiffened plate
Fig. 2 shows the propagation process of impact stress wave generated by high-speed projectile impacting aluminum alloy stiffened plate. In the plate, when the steel ball touches the aluminum alloy stiffened plate, the stress wave is concentrated near the impact point. Then, the stress wave propagates uniformly around, and begins to reverse propagate when propagating to the boundary or the stiffener. Among them, the reflection, scattering and attenuation aluminum of stress wave induced by complex stiffener structure and the varying process of overlay are shown in Fig. 2.
Figure 2: The propagation process of impact stress waves
As the impact velocity increases, the damage by the projectile to aluminum alloy stiffened plate changes from cratering damage to perforation damage, as illustrated in Fig. 3. When the impact speed reaches over 200 m/s, the cratering damage begins to emerge in reinforced aluminum plate; and perforation damage when reaching 1200 m/s.
Figure 3: The damage degree of aluminum alloy stiffened plate under high-speed impact
Extreme learning machine serves as an algorithm to solve single hidden layer feedforward neural network [32,33], which allows faster learning speed on the premise of ensuring learning accuracy compared with the traditional neural network. The learning parameters between the ELM’s input layer and the single hidden one layer of ELM could be initialized randomly, with the obtained output layer’s weights based on the least square method, which made it free from manual tuning. The schematic diagram of ELM is depicted in Fig. 4.
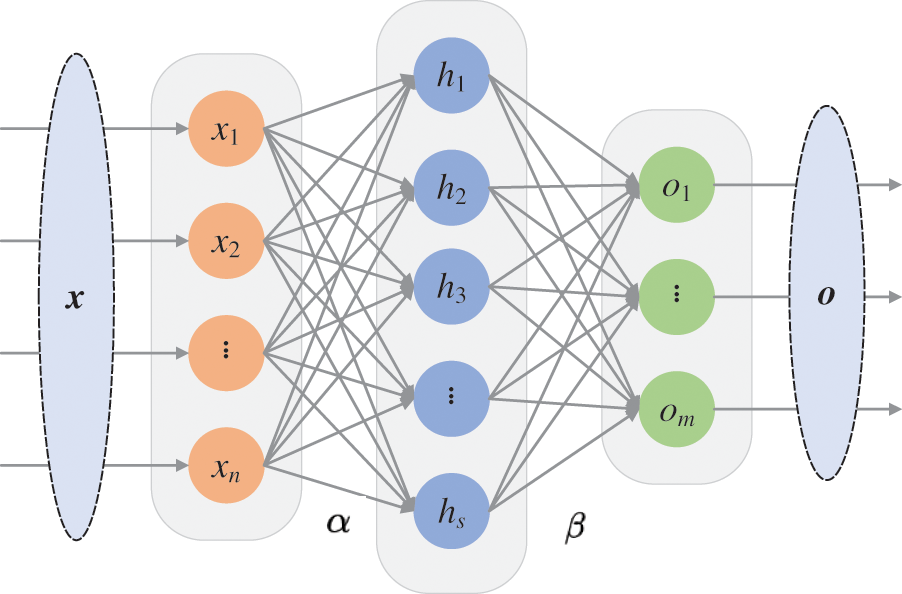
Figure 4: The schematic of ELM
For the single hidden layer feedforward neural network, assuming the length of the sample data set as n, a data set composed of
Assume that the connection weight between the hidden layer and the output layer is
The above N equations are pieced together into a matrix form, denoted as:
wherein,
For the desired output value
According to the least square method, the parameter
Therefore, a given test sample
In 2014, Mirjalili et al. firstly proposed Gray Wolf Optimization algorithm, which works by means of the imitation of the predation process of the strictly hierarchical natural gray wolf population. The gray wolf population involves four grades, namely
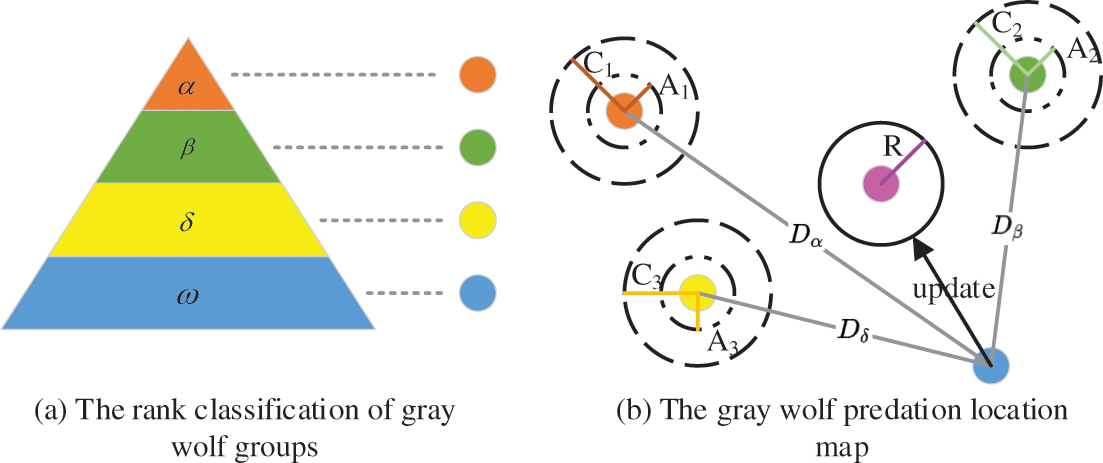
Figure 5: The gray wolf optimizer
Fig. 5b shows the position updating diagram of the Gray Wolf algorithm. First, the positions of
wherein,
Eqs. (8) and (9) depict the mathematical model of gray wolf individual tracking prey position:
After obtaining the relative distance, the individual will update the position according to Eq. (10), where a random number is in
Based on Eqs. (9) and (10), the next position of gray wolf individuals can be updated, which can be expressed as:
After the location model is obtained, the position of
To optimize the performance of the algorithm, the gray wolf
where,
2.4 Damage Identification Algorithm for Aluminum Alloy Stiffened Plate
To summarize the above mentioned analysis, the impact damage identification algorithm flow of aluminum alloy stiffened plate based on GWO-ELM can be depicted as Fig. 6.
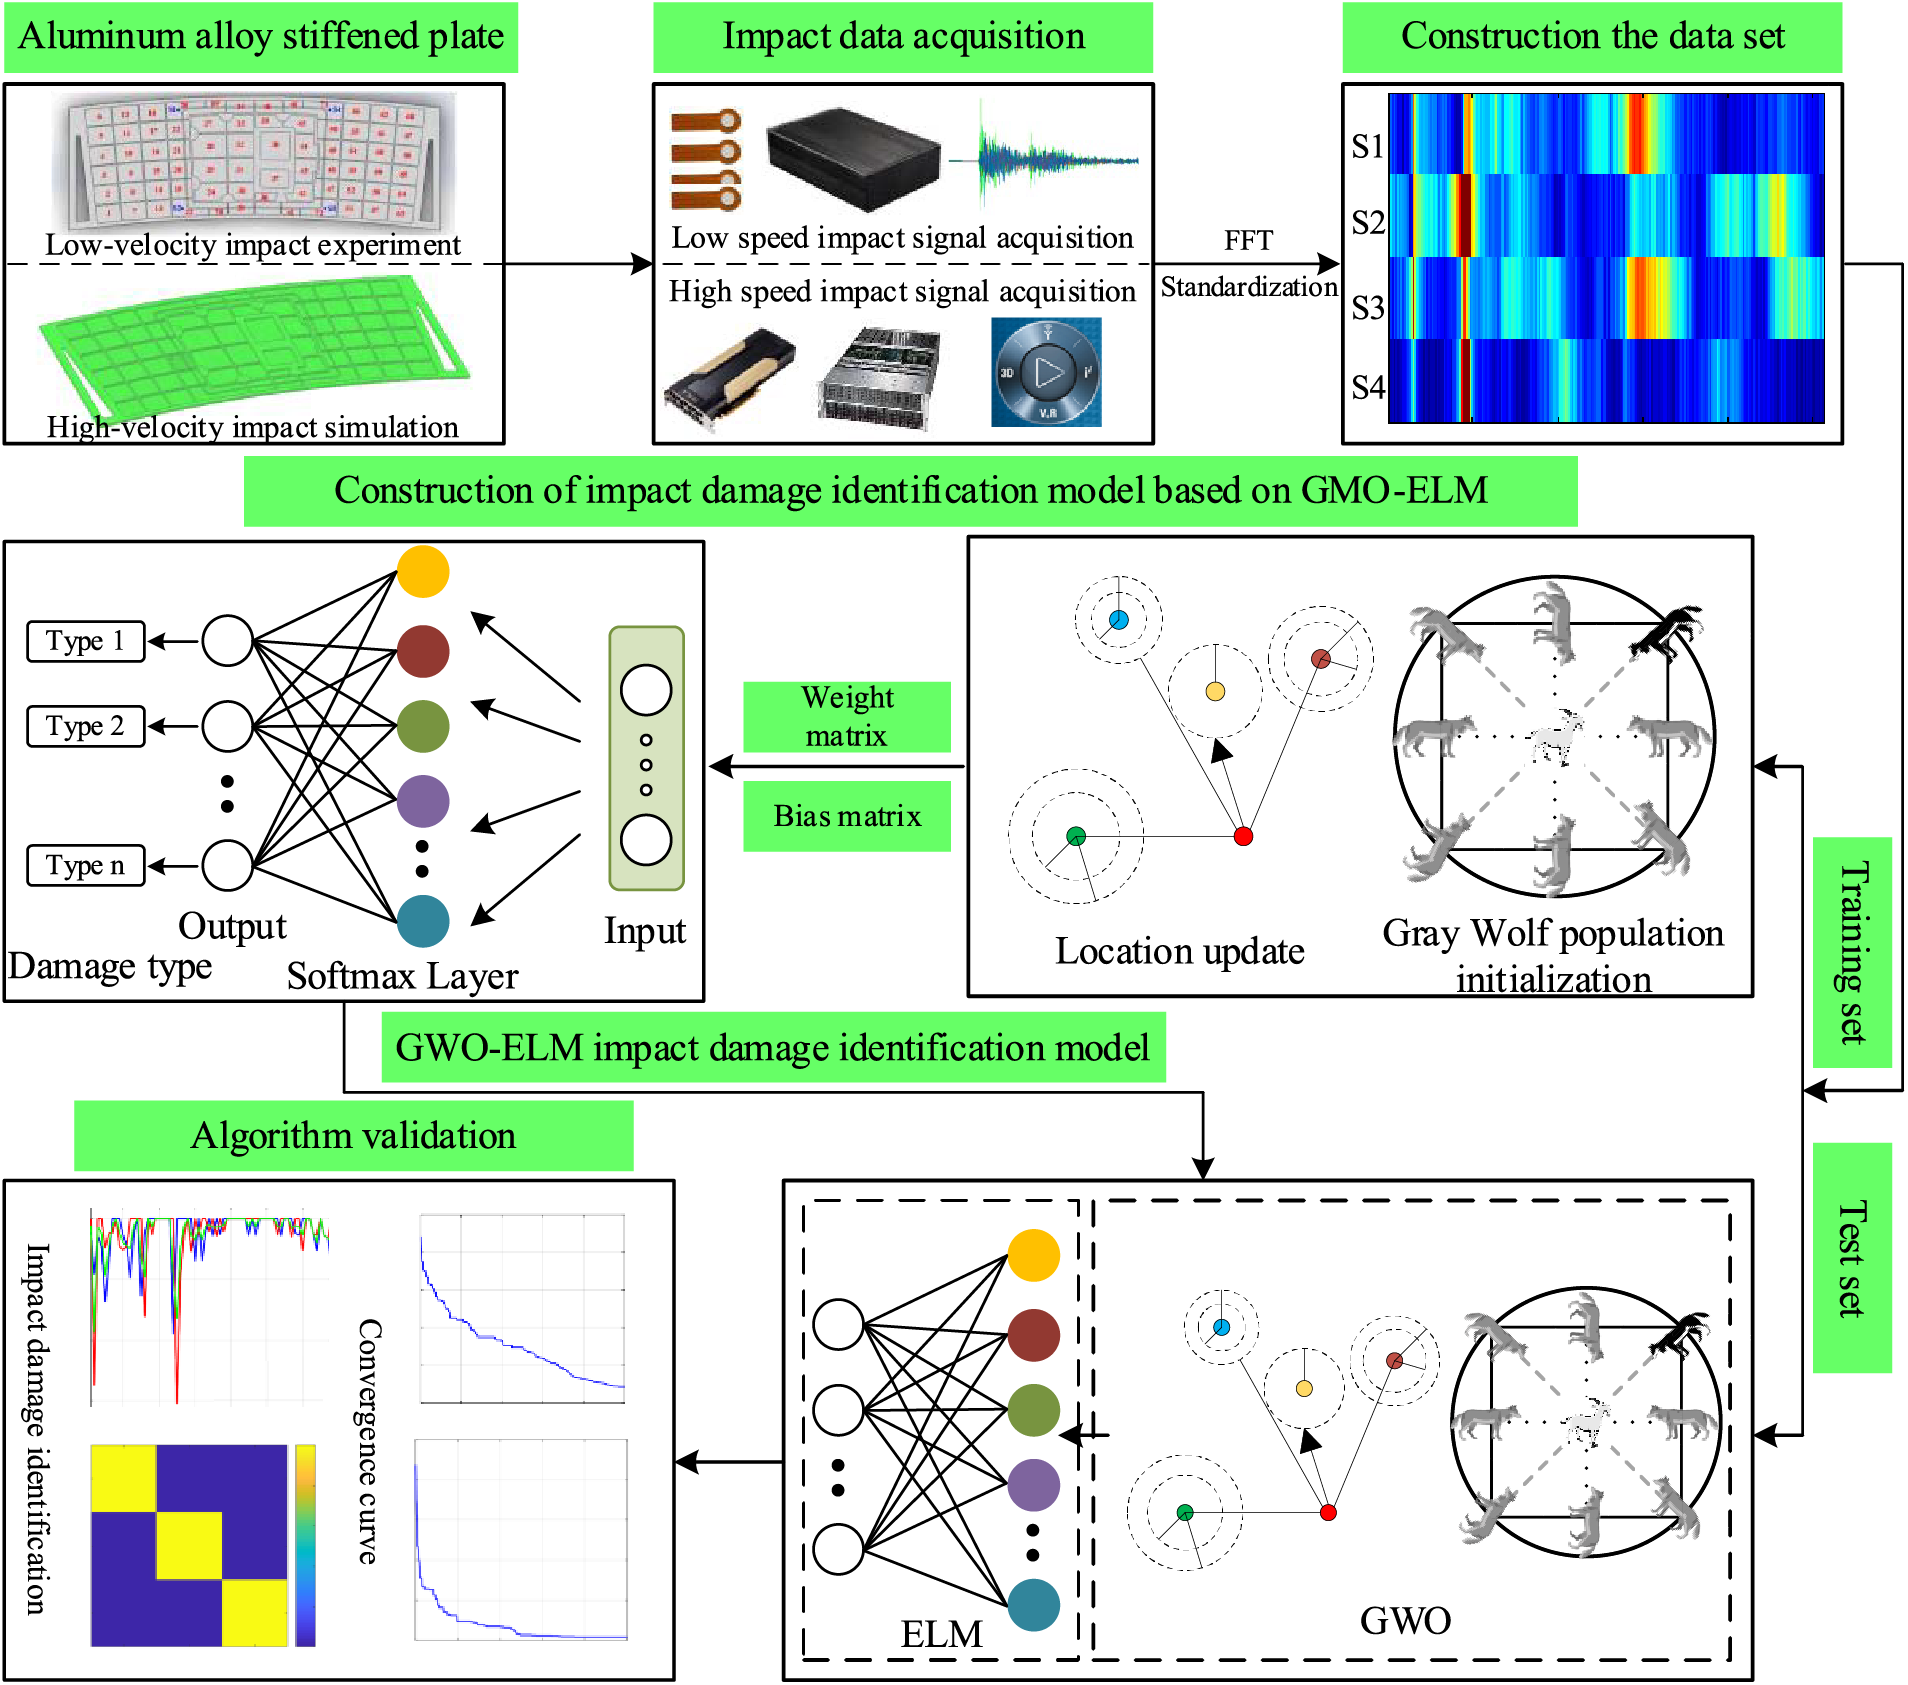
Figure 6: The flowchart of impact damage identification algorithm
(1) The aluminum alloy stiffened plate of the spacecraft cabin wall has 68 regions for identification. An electric simulation gun launched the plastic projectile with a diameter of 7 mm to simulate low-speed impact, and the generated acoustic emission signals were collected by the acoustic emission acquisition system as the original non-damage signals. By utilizing ANSYS software and Lagrange algorithm, the simulation model of aluminum alloy stiffened plate of a spacecraft bulkhead was established, and the original signals of cratering and perforation damage were obtained.
(2) The amplitude-frequency of the original signals obtained by FFT transform was applied to construct the data sample set, including the training set and test set with the ratio of 7:3.
(3) Depending on the training set and GWO algorithm, the impact damage identification model of the aluminum alloy stiffened plate was established based on GWO-ELM.
(4) The performance of damage identification model was verified in the test set.
(5) The algorithm outstood ELM and BPNN methods.
3 Construction of Impact Damage Signal Acquisition System
Impact damage signal acquisition systems have low-speed impact system as well as the high-speed one, as shown in Fig. 7. The former involves electric simulation gun, aluminum alloy stiffened plate, acoustic emission sensor, impact damage data acquisition device, computer and data acquisition software. The electric simulation gun accelerates a plastic projectile to about 50 m/s by compressing gas without damaging the stiffened plate. After impacting the stiffened plate, the plastic projectile will crack, producing an acoustic emission signal. Then, the signal is collected by acoustic emission sensor and converted into a voltage signal. Finally, the computer-manipulated data collection device acquires and stores the emission voltage signal.
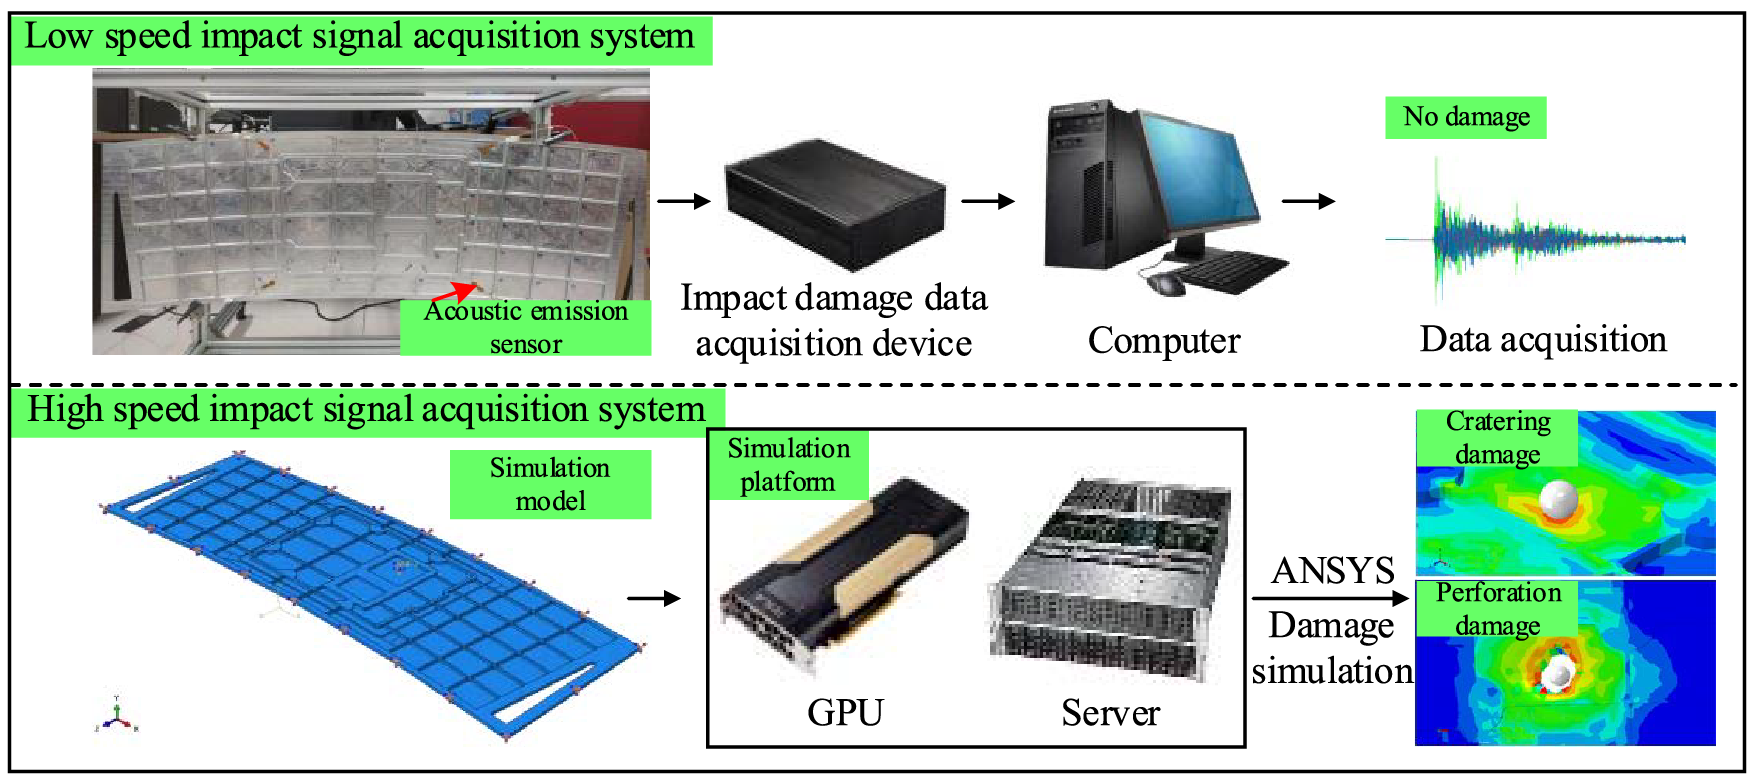
Figure 7: The impact damage signal acquisition system
The high-speed impact signal acquisition system obtains the impact acoustic emission signals by numerical simulation under cratering and perforation. Although more accurate high-speed impact acoustic emission signal can be acquired by the two-stage light gas gun in a high-speed impact experiment, it is challenging to design the damage data set due to the high expenditure. Target size is limited by the target cabin size, and it is difficult for projectile velocity and trajectory to accurately control, and experimental process to measure. Therefore, the selected data simulation methods are employed to achieve accurately control on experimental parameters and various impact conditions. Based on the numerical simulation platform of NVIDA Tesla V100 high performance computing GPU, the ANSYS is utilized to establish the numerical simulation model of aluminum alloy stiffened plate to simulate the process of cratering and perforation damage.
4 Impact Damage Signal Identification Experiment and Result Analysis
4.1 Impact Experiment of Aluminum Alloy Stiffened Plate
Taking the low-speed impact experiment as an example, the electric gun is adopted to shoot 68 areas on the aluminum alloy stiffened plate (as shown in Fig. 8). Each plate involves 5 impact points, and each impact point is hit for 150 times. The data collection process is as follows:
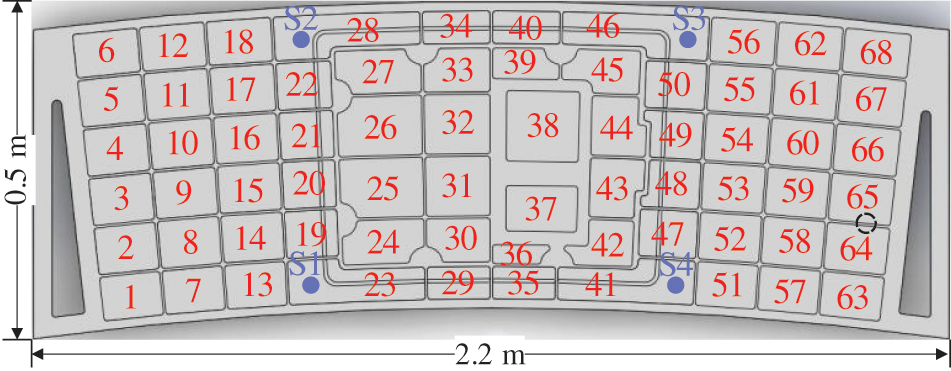
Figure 8: The area division of aluminum alloy stiffened plate
(1) Determine the first impact area
(2) Carry out the same test on the 5 points in the second impact area
(3) The data acquisition process of cratering and perforation in high-speed impact is continuously carried out to the low-speed one, and 51000 groups of cratering and perforation data are obtained, respectively.
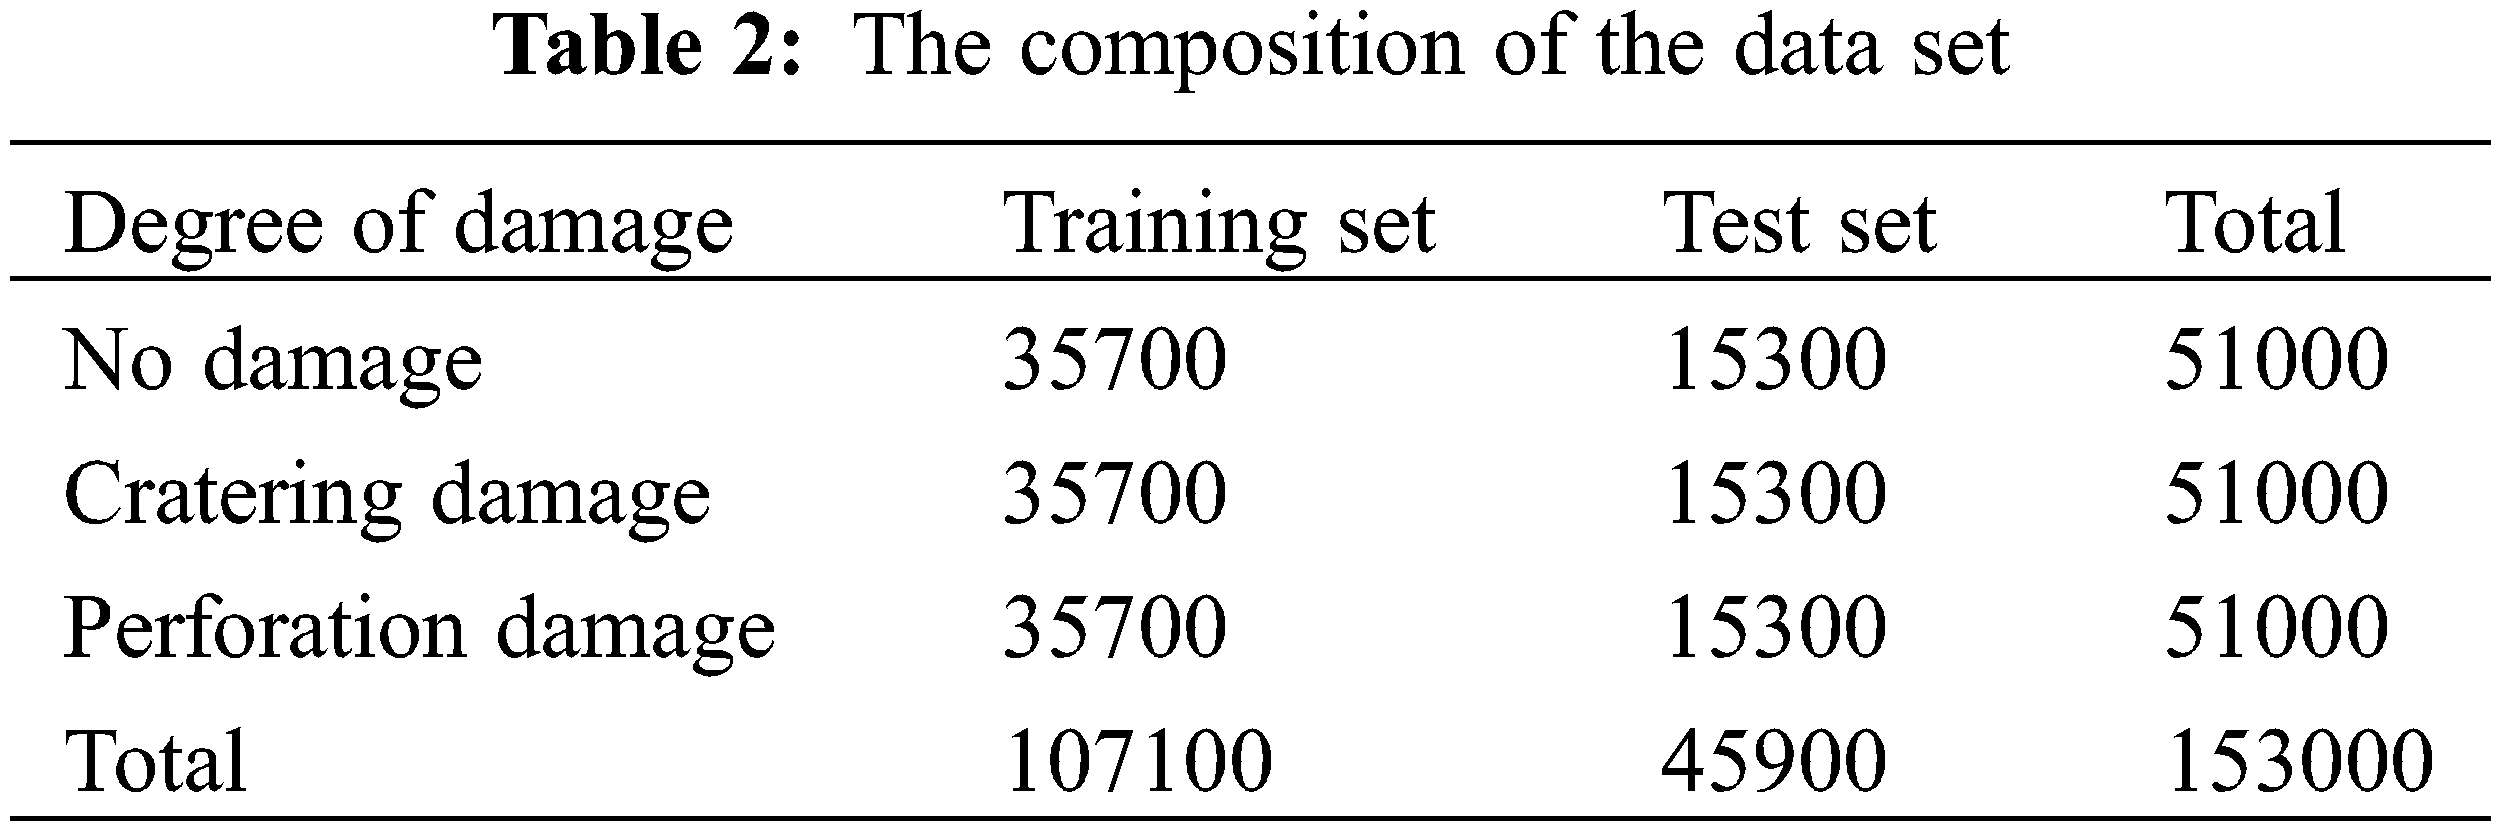
The data samples of each damage degree are divided into training sets and test sets in a ratio of 7:3, namely 35700 groups and 15300 groups, respectively, as listed in Table 2. In terms of the total data set, the training set contained 107100 groups of data, and the test set of 45900 groups.
4.2 Impact Damage Signal Analysis of Aluminum Alloy Stiffened Plate
Under three damage degrees, the FFT transform is to convert time-domain impact signals into frequency-domain signals. To clearly explore the relationship of amplitude-frequency with impact areas, Fig. 9 illustrates the frequency-domain signals of different impact areas under the same damage degree acquired by sensor S1 in the same coordinate system.
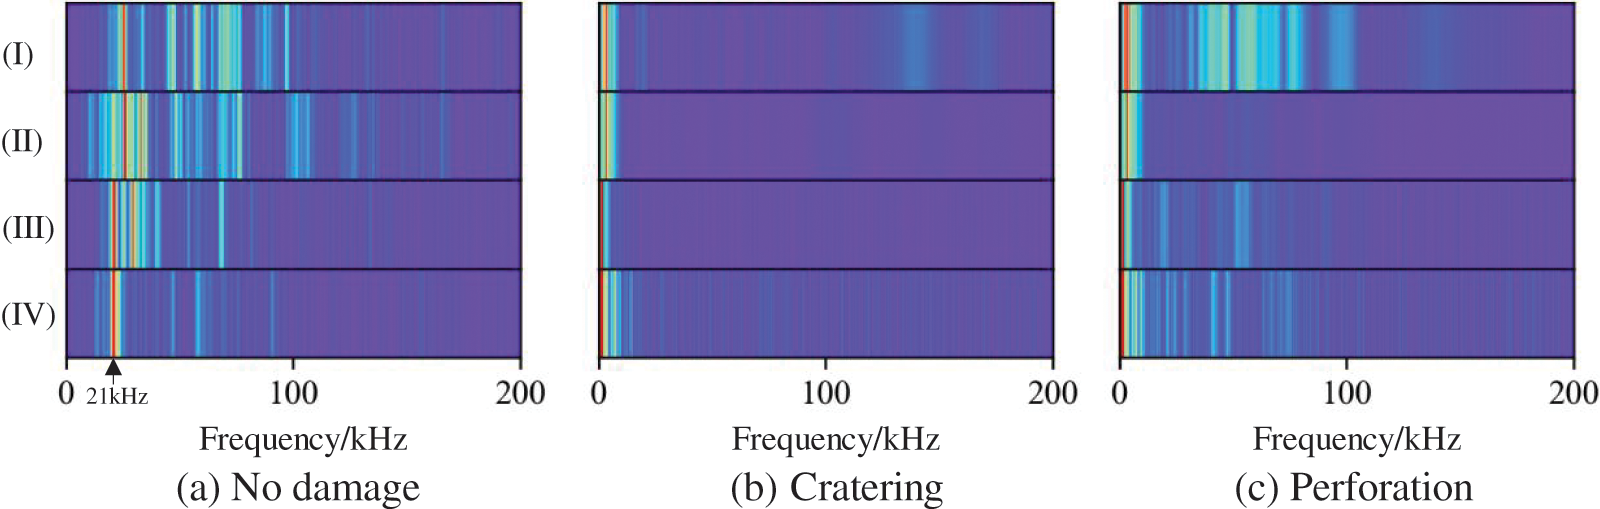
Figure 9: The comparison of signal amplitude-frequency characteristics in different areas under the same degree of damage
Fig. 9 depicts the amplitude-frequency of no damage, cratering and perforation respectively, in which (I), (II), (III) and (IV) represent the amplitude-frequency of area 1, 24, 42, and 64, respectively. For different damage areas, the signal amplitude differs at the same frequency. For example, in the non-damage state, the amplitudes of the four impact areas at 21 kHz are 0.02552, 0.05997, 0.11495, and 0.08624 dB, indicating the relation of the monitored amplitude-frequency by the acoustic emission sensor to the impact area. Hence, the amplitude-frequency characteristics of the impact signal can be adopted to identify the impact area.
To estimate the frequency characteristics with different damage degrees in the same impact area, the amplitude-frequency of the three damage degrees is represented in the same coordinate system. The amplitude-frequency characteristics of area 1, 32 and 65 are depicted in Figs. 10a–10c, respectively. Here, (I), (II) and (III) represent the amplitude-frequency characteristics of the aluminum alloy stiffened plate in no damage state, cratering and perforation state, respectively. It shows the varying amplitude-frequency characteristics with different damage degrees in the same area and suggests that the amplitude-frequency characteristics of the impact signal can identify the damage degree.
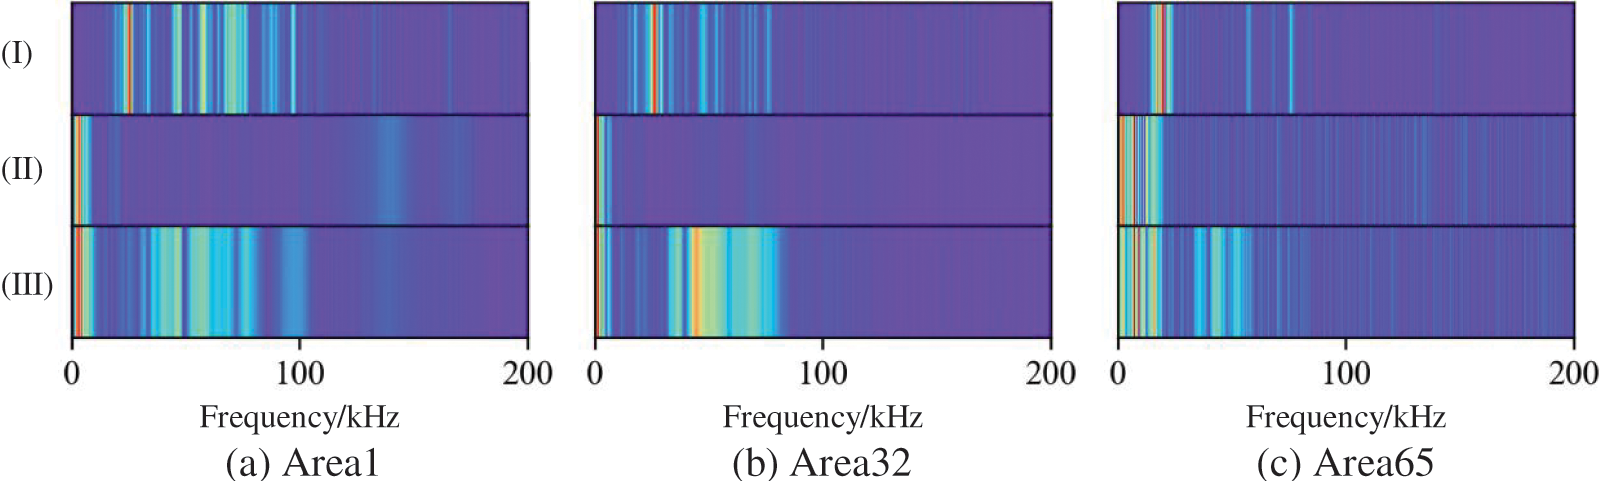
Figure 10: The comparison of signal amplitude-frequency characteristics of different levels of damage in the same area
4.3 Impact Damage Identification Based on GWO-ELM Aluminum Alloy Stiffened Plate
The optimizing idea of the Gray Wolf algorithm is to initialize ELM from the population parameter and avoid the limitation of ELM, in order to make the model with randomly generated initial weight matrices and bias matrix. The wolves are updated by spatial position error feedback to achieve the continuously optimized fitness of the Gray Wolf until getting a qualified global optimal solution, that is, obtaining the optimal weight matrix and deviation matrix of ELM impact damage identification, and the optimal damage identification model. Fig. 11 depicts the flow chart of GWO-ELM algorithm with the following specific steps:
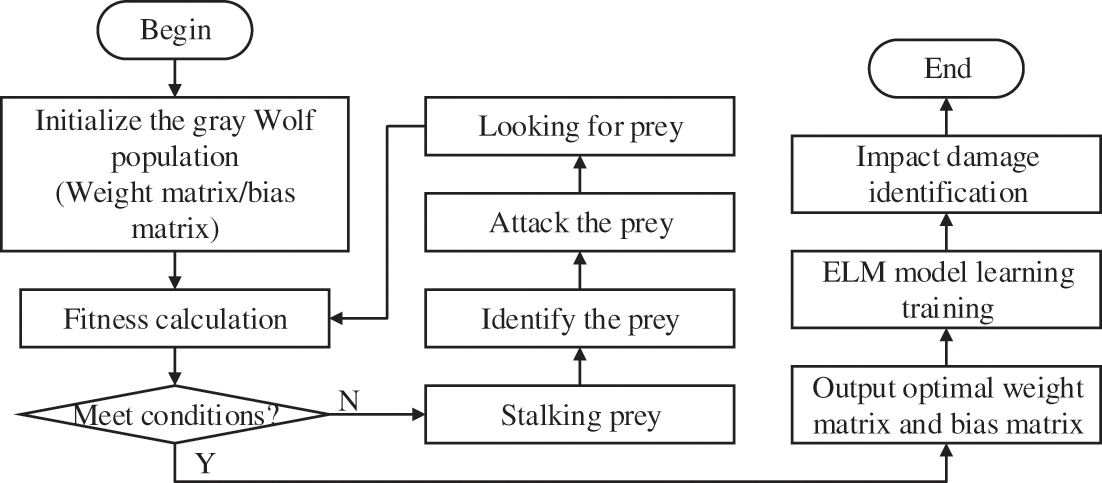
Figure 11: The flow chart of GWO-ELM
(1) Parameter initialization. The coordinate and displacement parameters of the Gray Wolf population are randomly set, following a random initialization of the weight matrix and bias matrix of ELM.
(2) Fitness calculation and prey search. The fitness value is calculated as the training error of the initial ELM network, and the lowest error network object rounded up as the prey.
(3) Update of ELM weights. The weights of ELM are updated according to the prey rounded up by gray wolves, followed by retraining of the ELM network.
(4) Iterative update. The new network is rounded up as the new prey object, and the calculated fitness value is returning to step (2). If the updated fitness value is below the previous generation, step (3) is performed. The update is stopped, when the fitness value is below the set value or the number of iterations reaches the maximum.
(5) Finally, test the trained ELM model to identify the location and degree of impact on the aluminum alloy stiffened plate.
After the intelligent damage identification model was established, the damage identification of the model became more accurate after optimizing such parameters as the activation function, the hidden layer and the model parameters (weight matrix, bias matrix, etc.). First, the experiment estimated the activation function and hidden layer, taking three damage degrees of aluminum alloy stiffened plates and the amplitude and frequency characteristics of 68 impact areas as the input. The experimental procedure and results are shown in Table 3 and Fig. 12, respectively.
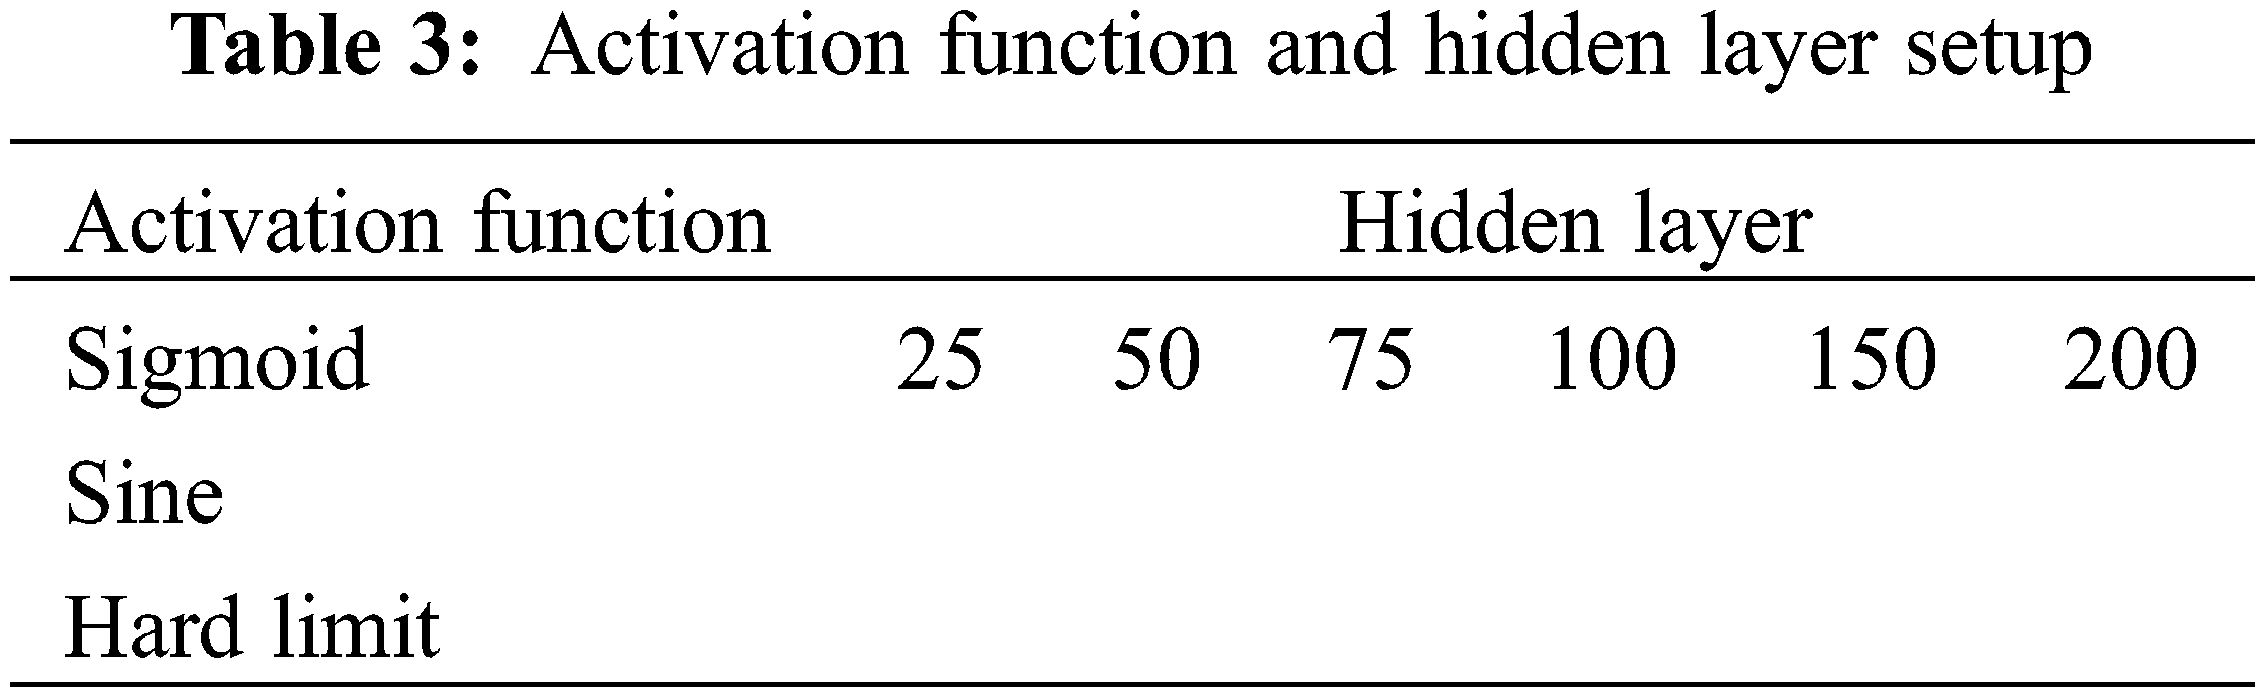
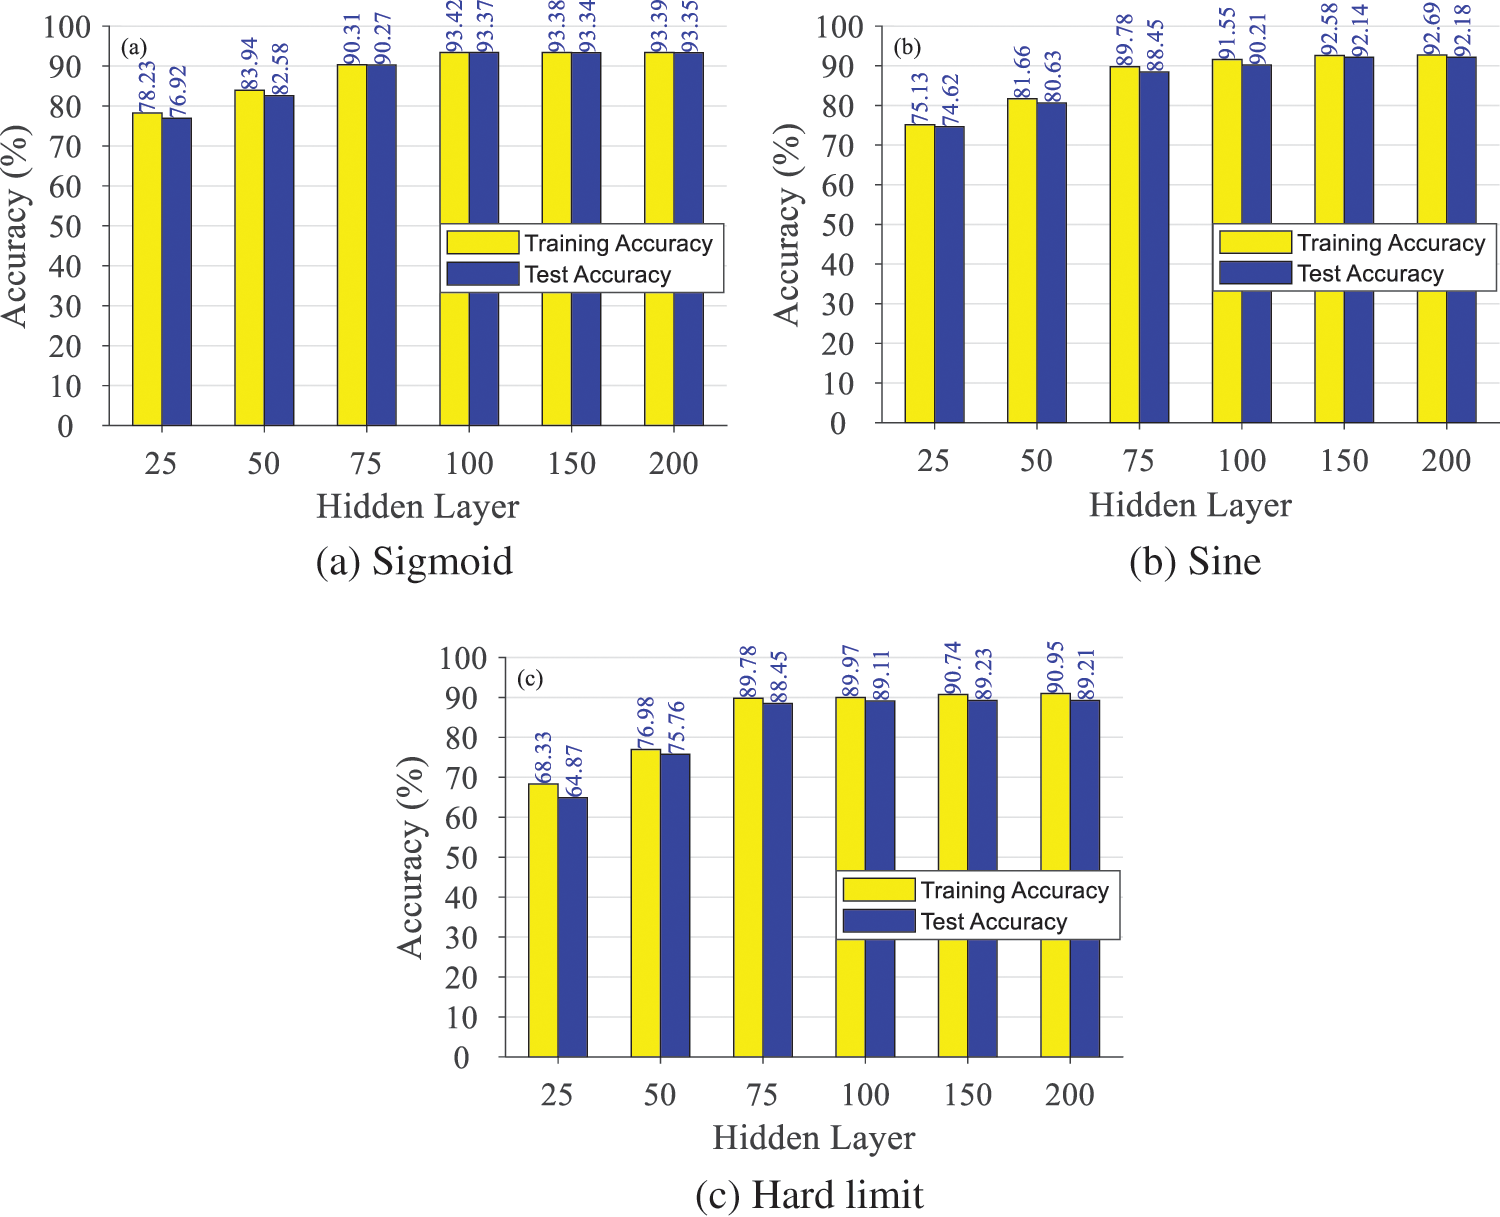
Figure 12: Activation function and hidden layer optimization experiment results
According to Fig. 12, taking the sigmoid or sine function as the activation function, the similar damage identification of the ELM model turns out to be accurate, overrunning the model with a hard limit function. In the same model, the damage identification’s accuracy is elevated in line with the increasing number of hidden layers. When the hidden layers exceed 100, changes in damage identification accuracy of the model are not significant and tend to be stable. As a result, the activation function is set to sigmoid and the hidden layer to 100.
Further, the Gray Wolf algorithm is adopted to optimize the model parameters, with the Wolf size of the GWO algorithm set to 30. Figs. 13a and 13b depict iterative convergence curve of the fitness training of the GMO-ELM model. According to Fig. 13, as the iteration times exceeds 1000, the iterative convergence curve tends to be stable. As a result, the maximum iteration times is set to 1000.
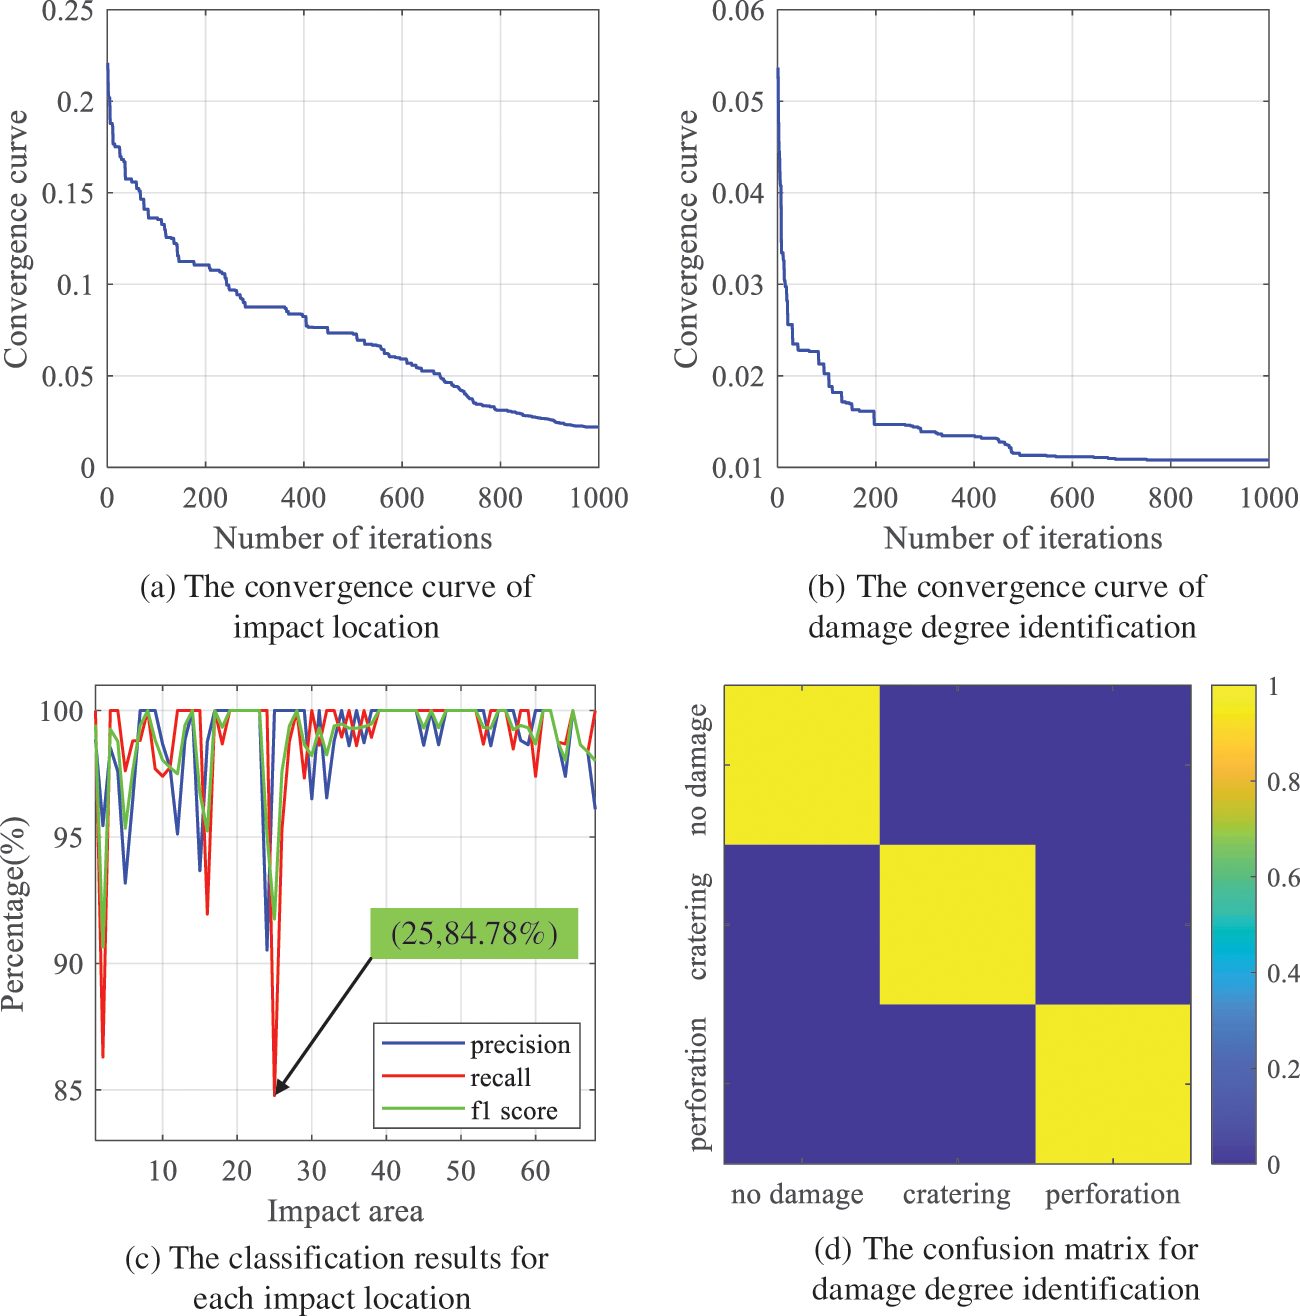
Figure 13: The iterative convergence curve and impact damage identification results of GMO-ELM
In terms of impact location, Fig. 13c shows the Precision, Recall and F1-score index curves of each impact location, and Fig. 13d identifies confusion matrix of damage degree. Compared with the standard ELM and BP neural network, the Precision, Recall and F1-score values of impact damage identification based on GWO-ELM are 98.90%, 98.90% and 98.88%, respectively. They outreach those of standard ELM and BP neural network. Table 4 and Fig. 14 display the details.
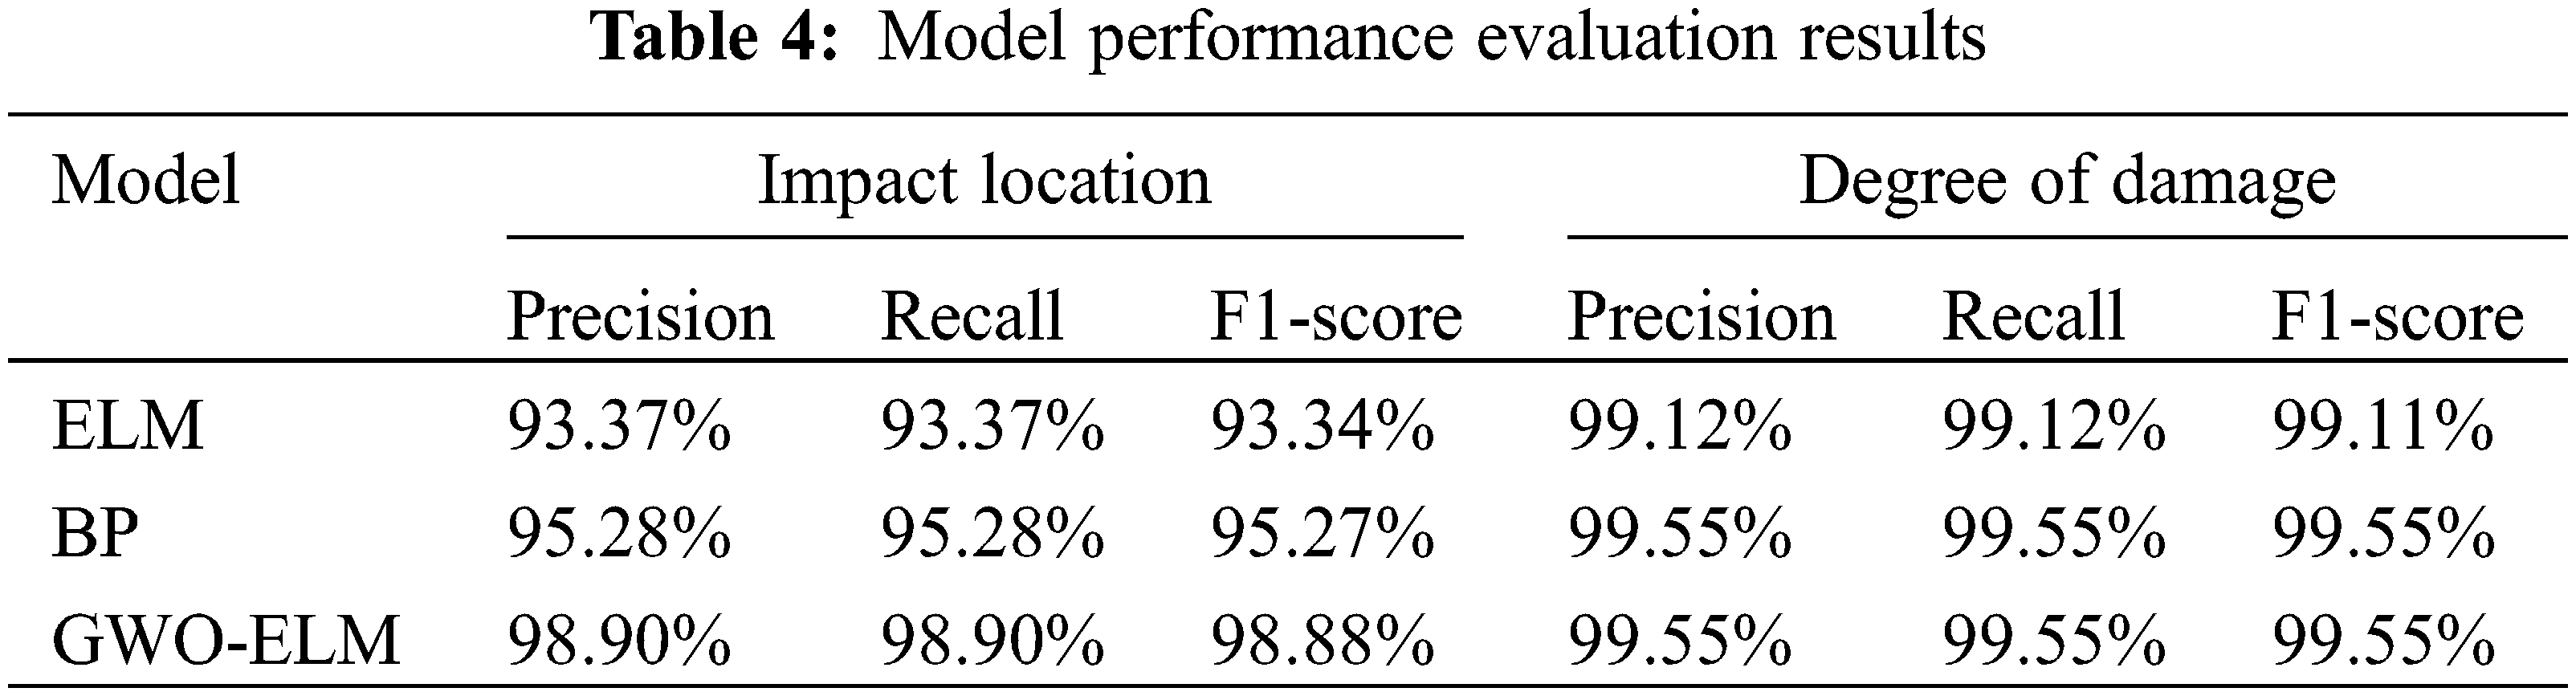
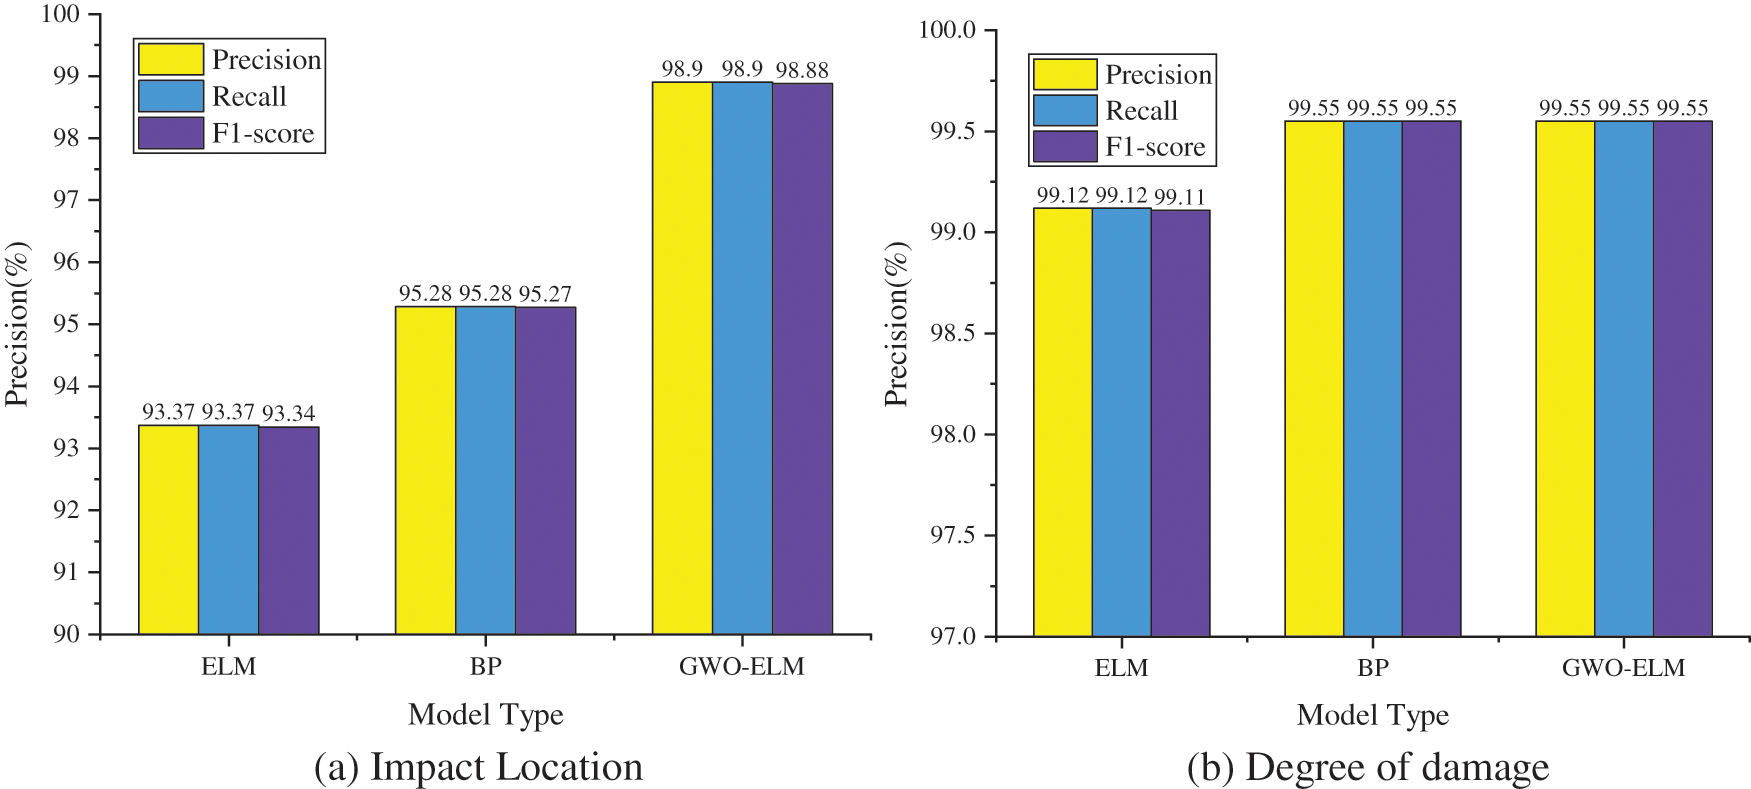
Figure 14: Model performance evaluation results
As Fig. 14 shows, as for location identifying, the Precision, Recall and F1-score of BP and GWO-ELM all exceed 95%, with an accuracy of GMO-ELM model 5.53% and 3.62%, higher than that of ELM and BP neural network, respectively. For damage degree identification, the Precision, Recall and F1-score of the three methods all exceed 99%, while the GWO-ELM model’s accuracy was 0.43%, higher than that of ELM and indicating the relatively better outcomes by CNN model.
To effectively monitor the engineering requirements of spacecraft structure, reverse the inaccurate traditional damage identification methods with the complex impact stress waves of aluminum alloy reinforced structures, and optimize ELM algorithm-generated random weights and its instability and poor classification effect, an impact damage identification method based on GWO-ELM for aluminum alloy stiffened plate is proposed. This method works in the impact location and damage degree identification of the ELM model, where the impact damage characteristics are extracted from the model, and its weight parameters are optimized by the GWO algorithm. The experimental results show the GWO-ELM model’s advantages to ELM and BP neural network in identification accuracy, with a higher accuracy of 5.53% and 3.62%, respectively. For damage degree identification, GWO-ELM and BP achieve the similar accuracy, but the GWO-ELM model overran ELM by 0.43%. The comparison shows that the GWO-ELM model is a practical with considerable generalization capability, which makes impact damage identification stable.
Acknowledgement: None.
Funding Statement: This work was supported by National Key Research and Development Project (2020YFE0204900), National Natural Science Foundation of China (Grant Nos. 61903224, 62073193, 61873333), and Key Research and Development Plan of Shandong Province (Grant Nos. 2019TSLH0301, 2021CXGC010204).
Author Contributions: The authors confirm contribution to the paper as follows: study conception and design: Wei Li, Benjian Zou, Faye Zhang; data collection: Benjian Zou; analysis and interpretation of results: Wei Li, Yuxiang Luo, Mingshun Jiang, Lei Jia; draft manuscript preparation: Wei Li, Ning Yang. All authors reviewed the results and approved the final version of the manuscript.
Availability of Data and Materials: The authors confirm that the data supporting the findings of this study are available within the article.
Conflicts of Interest: The authors declare that they have no conflicts of interest to report regarding the present study.
References
1. Yin, C., Huang, X., Cao, J., Dadras, S., Shi, A. (2021). Infrared feature extraction and prediction method based on dynamic multi-objective optimization for space debris impact damages inspection. Journal of the Franklin Institute, 358(18), 10165–10192. [Google Scholar]
2. Yu, Y., Hou, Q., Zhang, J., Zhang, W. (2020). Mission scheduling optimization of multi-optical satellites for multi-aerial targets staring surveillance. Journal of the Franklin Institute, 357(13), 8657–8677. [Google Scholar]
3. Castillo, O., Cervantes, L., Soria, J., Sanchez, M., Castro, J. (2016). A generalized type-2 fuzzy granular approach with applications to aerospace. Information Sciences, 354, 165–177. [Google Scholar]
4. Wang, R., Hu, Y., Sun, H., Li, G., Chen, J. et al. (2020). Research of high-strength and toughness aluminum structural panels for aerospace and warship. Structure & Environment Engineering, 47(5), 28–36. [Google Scholar]
5. Liu, Z., Pang, B., Liu, G. (2014). Hypervelocity impact induced AE wave mode conversion in a plate with vertical stiffeners. Journal of Vibration and Shock, 33(21), 114–118. [Google Scholar]
6. Zou, B., Li, W., Yang, N., Jiang, M., Zhang, F. et al. (2021). Impact-induced damage recognition of aluminium alloy stiffened plate structure based on convolutional neural network. IEEE Sensors Journal, 21(18), 20283–20295. [Google Scholar]
7. Chen, S., Ong, Z., Lam, W., Lim, K., Lai, K. (2020). Operational damage identification scheme utilizing de-noised frequency response functions and artificial neural network. Journal of Nondestructive Evaluation, 39(3), 66. [Google Scholar]
8. Zhao, G., Jiang, M., Luo, Y. (2022). Third harmonic approximate phase velocity matching nonlinear early fatigue damage detection. Measurement, 189, 110518. [Google Scholar]
9. Dang, X., Ma, W., Habets, E. A. P., Zhu, H. (2022). TDOA-based robust sound source localization with sparse regularization in wireless acoustic sensor networks. IEEE/ACM Transactions on Audio, Speech, and Language Processing, 30, 1108–1123. [Google Scholar]
10. Marzioli, P., Santoni, F., Piergentili, F. (2020). Evaluation of time difference of arrival (TDOA) networks performance for launcher vehicles and spacecraft tracking. Aerospace, 7(10), 151. [Google Scholar]
11. Jin, B., Xu, X., Zhang, T. (2018). Robust time-difference-of-arrival (TDOA) localization using weighted least squares with cone tangent plane constraint. Sensors, 18(3), 778. [Google Scholar] [PubMed]
12. Wang, B., Sun, W., Wang, H., Wan, Y., Xu, T. (2021). Location determination of impact on the wind turbine blade surface based on the FBG and the time difference. Sensors, 21(1), 232. [Google Scholar] [PubMed]
13. Liu, Z., Peng, Q., Li, X., He, C., Wu, B. (2020). Acoustic emission source localization with generalized regression neural network based on time difference mapping method. Experimental Mechanics, 60, 679–694. [Google Scholar]
14. Ebrahimkhanlou, A., Dubuc, B., Salamone, S. (2019). A generalizable deep learning framework for localizing and characterizing acoustic emission sources in riveted metallic panels. Mechanical Systems and Signal Processing, 130, 248–272. [Google Scholar]
15. Zheng, K., Li, Z., Ma, Z., Chen, J., Zhou, J. et al. (2019). Damage detection method based on Lamb waves for stiffened composite panels. Composite Structures, 225, 111137. [Google Scholar]
16. Li, X., Zhang, W., Ma, H., Luo, Z., Li, X. (2020). Data alignments in machinery remaining useful life prediction using deep adversarial neural networks. Knowledge-Based Systems, 197, 105843. [Google Scholar]
17. Zhang, B., Zhang, S., Li, W. (2019). Bearing performance degradation assessment using long short-term memory recurrent network. Computers in Industry, 106, 14–29. [Google Scholar]
18. Zenzen, R., Khatir, S., Belaidi, I., Le Thanh, C., Wahab, M. (2020). A modified transmissibility indicator and Artificial Neural Network for damage identification and quantification in laminated composite structures. Composite Structures, 248, 112497. [Google Scholar]
19. Jimenez-Martinez, M., Alfaro-Ponce, M. (2019). Fatigue damage effect approach by artificial neural network. International Journal of Fatigue, 124, 42–47. [Google Scholar]
20. Liu, J., Li, Q., Chen, W., Yan, Y., Wang, X. (2018). A fast fault diagnosis method of the PEMFC system based on extreme learning machine and Dempster-Shafer evidence theory. IEEE Transactions on Transportation Electrification, 5(1), 271–284. [Google Scholar]
21. Momeni, H., Ebrahimkhanlou, A. (2022). High-dimensional data analytics in structural health monitoring and non-destructive evaluation: A review paper. Smart Materials and Structures, 31(4), 043001. [Google Scholar]
22. Djemana, M., Hrairi, M., Al Jeroudi, Y. (2017). Using electromechanical impedance and extreme learning machine to detect and locate damage in structures. Journal of Nondestructive Evaluation, 36(2), 1–10. [Google Scholar]
23. Pan, Z., Meng, Z., Chen, Z., Gao, W., Shi, Y. (2020). A two-stage method based on extreme learning machine for predicting the remaining useful life of rolling-element bearings. Mechanical Systems and Signal Processing, 144, 106899. [Google Scholar]
24. Fu, H., Vong, C. M., Wong, P., Yang, Z. (2016). Fast detection of impact location using kernel extreme learning machine. Neural Computing and Applications, 27(1), 121–130. [Google Scholar]
25. Yu, H., Sun, C., Yang, X., Yang, W., Shen, J. et al. (2016). ODOC-ELM: Optimal decision outputs compensation-based extreme learning machine for classifying imbalanced data. Knowledge-Based Systems, 92, 55–70. [Google Scholar]
26. Ghadimi, S., Kourehli, S. S. (2017). Multiple crack identification in Euler beams using extreme learning machine. KSCE Journal of Civil Engineering, 21(1), 389–396. [Google Scholar]
27. Shu, J., Zhang, Z., Gonzalez, I., Karoumi, R. (2013). The application of a damage detection method using Artificial Neural Network and train-induced vibrations on a simplified railway bridge model. Engineering Structures, 52, 408–421. [Google Scholar]
28. Qiu, B., Lu, Y., Sun, L., Qu, X., Xue, Y. et al. (2020). Research on the damage prediction method of offshore wind turbine tower structure based on improved neural network. Measurement, 151, 107141. [Google Scholar]
29. Coelho, C. K., Hiche, C., Chattopadhyay, A. (2011). An application of support vector regression for impact load estimation using fiber bragg grating sensors. Structural Durability & Health Monitoring, 7(1), 65–82. https://doi.org/10.3970/sdhm.2011.007.065 [Google Scholar] [CrossRef]
30. Liu, Y., Wang, L., Li, M., Wu, Z. (2022). A distributed dynamic load identification method based on the hierarchical-clustering-oriented radial basis function framework using acceleration signals under convex-fuzzy hybrid uncertainties. Mechanical Systems and Signal Processing, 172, 108935. [Google Scholar]
31. Liu, Y., Wang, L., Gu, K., Wu, Z. (2022). Artificial neural network (ANN)—Bayesian probability framework (BPF) based method of dynamic force reconstruction under multi-source uncertainties. Knowledge-Based Systems, 237, 107796. [Google Scholar]
32. Zhao, Y., Chen, Y. (2022). Extreme learning machine based transfer learning for aero engine fault diagnosis. Aerospace Science and Technology, 121, 107311. [Google Scholar]
33. Huang, G. B., Zhu, Q. Y., Siew, C. K. (2006). Extreme learning machine: Theory and applications. Neurocomputing, 70(1–3), 489–501. [Google Scholar]
Cite This Article
 Copyright © 2023 The Author(s). Published by Tech Science Press.
This work is licensed under a Creative Commons Attribution 4.0 International License , which permits unrestricted use, distribution, and reproduction in any medium, provided the original work is properly cited.
 Downloads
 Citation Tools