
 Submit a Paper
 Propose a Special lssue
 Open Access
ARTICLE

Low-Strain Damage Imaging Detection Experiment for Model Pile Integrity Based on HHT
1 Faculty of Civil Engineering and Mechanics, Jiangsu University and National Center for International Research on Structural Health Management of Critical Components, Zhenjiang, 212013, China
2 Institute of Fluid-Flow Machinery, Polish Academy of Sciences, Gdańsk, 80-231, Poland
* Corresponding Author: Ziping Wang. Email:
Structural Durability & Health Monitoring 2023, 17(6), 557-569. https://doi.org/10.32604/sdhm.2023.042393
Received 29 May 2023; Accepted 09 August 2023; Issue published 17 November 2023
 View Full Text
 Download PDF
Abstract
With the advancement of computer and mathematical techniques, significant progress has been made in the 3D modeling of foundation piles. Existing methods include the 3D semi-analytical model for non-destructive low-strain integrity assessment of large-diameter thin-walled pipe piles and the 3D soil-pile dynamic interaction model. However, these methods have complex analysis procedures and substantial limitations. This paper introduces an innovative and streamlined 3D imaging technique tailored for the detection of pile damage. The approach harnesses the power of an eight-channel ring array transducer to capture internal reflection signals within foundation piles. The acquired signals are subsequently processed using the Hilbert-Huang Transform (HHT), a robust analytical tool known for its effectiveness in handling non-stationary signals. Through the development of a sophisticated multi-channel ring array imaging algorithm, this technique empowers engineers and researchers to identify various pile defects, including their specific type, precise location, and obtain detailed 3D imaging representations. The findings of this research offer a valuable blend of theoretical insights and practical guidance, significantly advancing the state-of-the-art in the realm of concrete pile integrity inspection. By simplifying and enhancing the assessment process, this innovative approach not only addresses the complexities of existing methods but also contributes to the overall safety and reliability of concrete engineering structures.Keywords
Piled foundations are characterized by good seismic performance, high bearing capacity, and limited settlement. They are widely used in bridges, high-rise buildings, heavy workshops, and other engineering buildings. However, due to the uncertainty of the external environment and construction methods, various types of defects will occur inside the foundation piles. Therefore, the integrity detection of foundation piles is very important.
Nowadays, the commonly used non-destructive testing methods include the static load method [1], the high strain method [2], the low-strain method [3], and the ultrasonic method [4]. The static load method has a long detection period, insufficient equipment accuracy, and strong subjectivity of personnel; the high-strain method uses heavy hammer excitation but the detection steps are cumbersome, it is easy to damage the top of the pile, the detection cost is high and waveform analysis is unreliable. It is easy to cause large errors in the results. The ultrasonic method and low-strain method are widely used due to their low cost and easy operation. In view of the shortcomings of the current methods of foundation pile defect detection, Yang et al. [5] proposed a new method of ‘one pile-one hole-one tube wave’ for the detection of foundation piles, based on the theory of tube wave propagation in liquid-filled boreholes. It avoids the difficulty of acquiring deep defect reflection signals and pile tip signals affected by the attenuation of stress wave energy along the pile. Sang et al. [6] proposed a curved beams defect detection system based on the swarm optimization algorithm. Through the analysis of the highly nonlinear waveform, the defect recognition rate of the Z axis of the foundation pile is close to 100%, which provides a theoretical basis for practical engineering applications. In 2017, Wang et al. [7] proposed a method for detecting pile integrity using lateral excitation, pile body defects were detected by Hilbert-Huang transform (HHT) analysis of shear waves, which was verified for the integrity assessment of foundation piles with constraints or structural constraints at the top.
In 2019, Yu [8] proposed a frequency domain method to determine the pile length from the fast Fourier transform spectrum of the lateral impulse response of the foundation pile, effectively correcting the length prediction based on the phase spectrum measured at the two receivers. In terms of imaging, Wang et al. [9] combined the adaptive optimisation ability of a genetic algorithm with the global search control ability of a simulated annealing algorithm. It has faster calculation speeds and more accurate imaging results for the detection of pile defect areas. Rizzo [10] proposed the use of ultrasonic phased array sensors for the health detection of underwater structures, such as pipe piles, which made up for the lack of ultrasonic flaw detection and slow detection in large structures. It can be seen that the phased array sensor is trending in the application of large-scale structural damage detection. Compared with linear arrays and matrices, annular arrays have the same sensitivity to damage in all directions of the annular array element, and have the same beam circumferential directivity [11], which can realise the all-round detection of foundation pile structures. In 2022, Zhang et al. [12] proposed a three-dimensional (3D) wave model for pile non-destructive wave testing, which realizes 3D wave modeling of large-diameter thin-walled pipe piles through an improved Rayleigh-Love rod model. The model simulates radial inertial effects and circumferential shear wave effects. In addition, Zhang et al. [13] also proposed a torsional low-strain integrity test (TLSIT) to establish a 3D soil pile coupling model based on the continuum theory. By comparing with 1D wave theory and finite difference method, the corresponding analytical solution of pile dynamic response is derived and verified. But their analysis methods are relatively complex and have large limitations. At present, Currently, pile integrity inspection requires easier 3D visualization of the target.
To enhance the benefits of array sensors in pile integrity assessment and achieve direct 3D inspection imaging, the low-strain reflection method is employed. By combining the Hilbert-Huang Transform (HHT) [14,15] and phase-controlled imaging techniques [16], the effectiveness of the ring array imaging algorithm is validated using a Lead Zirconate Titanate (PZT) transducer array on a model pile. The eight-channel ring array and HHT signal processing technology enable the 3D reconstruction of the model pile. This demonstrates the feasibility of 3D imaging for detecting loss in the model pile.
2 Basic Principles of the HHT-Based 3D Reconstruction Algorithm for Annular Arrays
This section is the theory of the HHT-based 3D reconstruction algorithm for annular arrays. The low-strain reflection method excites a longitudinal wave at the top of the pile. When the wave travels down the pile and encounters the discontinuous interface and the bottom of the pile, the reflected wave will be generated due to the change in the wave impedance. In order to avoid the interference of non-stationary signals generated inside the pile, the time-frequency signal that matches the damage of the pile is extracted. HHT transform is used for signal analysis in the experiment [17]. The collected pile signal is decomposed by empirical mode decomposition (EMD) to obtain several intrinsic mode function (IMF) components, and the Hilbert time spectrum can be obtained by Hilbert transform [18].
For the IMF component function cj (τ) decomposed from any pile signal, its definition to yj (t) is:
τ is the integral variable of the Hilbert transform.
The analytical signal is formed by cj (τ) (the real part) and yj (t) is the imaginary part:
aj (t) is the instantaneous amplitude of the signal and θj (t) is the signal phase.
zj (t) is also expressed as:
where A is the instantaneous amplitude of the signal, λ is the signal attenuation factor, f is the signal oscillation frequency, and φ is the initial phase of the signal.
After each IMF component completes the Hilbert transform, its amplitude spectral function X(t) is obtained and expressed as:
where ai (t) and ωi (t) are the instantaneous amplitude and angular velocity of the ith IMF component, respectively.
EMD can perform adaptive signal decomposition and noise reduction, which helps to solve the problem of non-stationary signal interference. The Hilbert envelope and spectrum analysis of the acoustic signal of the foundation pile can remove the noise to a great extent and retain more effective components and details of the signal.
Traditional 3D reconstruction algorithms can be divided into voxel-based, surface variation-based, patch-based, and depth-map-based, while target 3D reconstruction methods include active reconstruction and passive reconstruction [19]. All of these methods are based on the reflected light signal of the imaging object for processing, recognition, and modeling. In actual engineering, foundation piles often exist underground. The actual shape cannot be obtained. Therefore, the analysis of low-strain reflection signals can help in the 3D reconstruction of piles. The existing methods include 3D semi-analytical model of non-destructive low-strain integrity for large-diameter thin-walled pipe piles, and 3D soil-pile dynamic interaction model, in which the 3D semi-analytical model is modelled based on circumferential transverse wave propagation and radial inertial effects, and the 3D soil-pile dynamic interaction model is inferred according to the Finite Difference Method, both methods are different from the multi-channel ring array imaging algorithm based on the Hilbert-Huang transform in this paper.
The 3D reconstruction algorithm of an annular array based on HHT needs to perform HHT analysis on the low-strain reflection signal, to obtain the time-frequency-amplitude (energy) 3D Hilbert-Huang amplitude spectrum. By means of eight-channel superposition, the waveform signals of eight PZT sheets are superimposed in an annular array, to obtain a 3D deflection diagram of the distance-circular circumference-amplitude (energy) annular array. The X axis is the distance of wave propagation, the Y axis is the perimeter of the pile neck, and the Z axis is the amplitude axis, and its size can be expressed in grayscale, so the Z axis of the 3D deflection diagram is replaced by grayscale, and the 2D form of the 3D deflection graph can be obtained. The 2D map is coupled with the complete foundation pile model and the greyscale is set to reflect the unevenness. Defect reflections, pile bottom reflections, and multiple superimposed reflections are identified by processing 1D damage location results. The 3D reconstruction of the foundation pile can be realised by removing the multiple reflections after the reflection of the pile bottom in the 3D model.
3 Experiment of Annular Array Imaging Integrity Testing of Model Piles
3.1 Construction of Eight-Channel Annular PZT Array Damage Detection Experimental Platform
The multi-channel integrity detection experiment on the foundation pile is mainly used to judge whether the integrity of the foundation pile meets the requirements by analysing the acoustic signal transmitted through the pile body [20]. An eight-channel damage detection platform was built, as shown in Fig. 1. The length of the nylon pile was 2010 mm, the diameter of the non-damaged part was 103 mm, and the diameter of the damaged part was 51.5 mm. In order to reduce the reflection of the end, more than one wavelength distance should be taken for the PZT transducer exciting location. The PZT-51 material used in the experiment can serve both as an actuator and a sensor. PZT-51 possesses a high coupling coefficient, a wide range of dielectric constants, and low loss (d33 = 400 m/V, Qm = 100). Also, the propagating frequency of ultrasonic has limited coverage capabilities due to its time-domain width. So, eight PZT transducers were evenly arranged on the side of the pile body, at a distance of 80 mm from the top of the pile. For the ceramic PZT sheet, the central angle corresponding to each adjacent PZT sheet was 45°. The negative electrode of each PZT sheet and the pile body were bonded by epoxy resin.
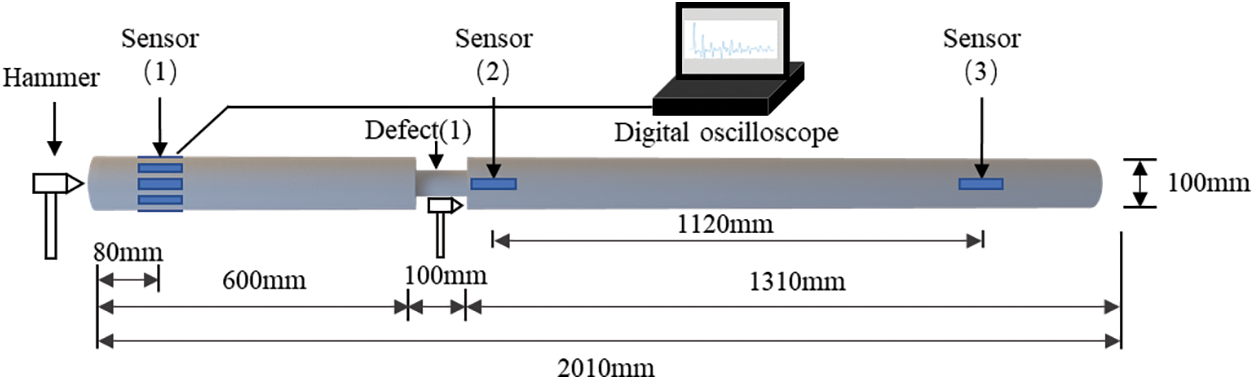
Figure 1: Schematic diagram of multi-channel integrity testing experiment of foundation piles
Fig. 2 shows an experimental platform for damage detection via eight-channel annular PZT transducer arrays for the location of model pile defects. The setup consisted of two oscilloscopes (Agilent DSO7054A and Tektronix MSO44), a steel hammer, and a model nylon pile pasted with a ring-shaped PZT array. Or the multi-channel phased array signal acquisition setup can also be used in the data gathering experiment. The steel hammer was used as the excitation source and each array element of the ring-shaped PZT transducer received the signal through multi-channel oscilloscopes.
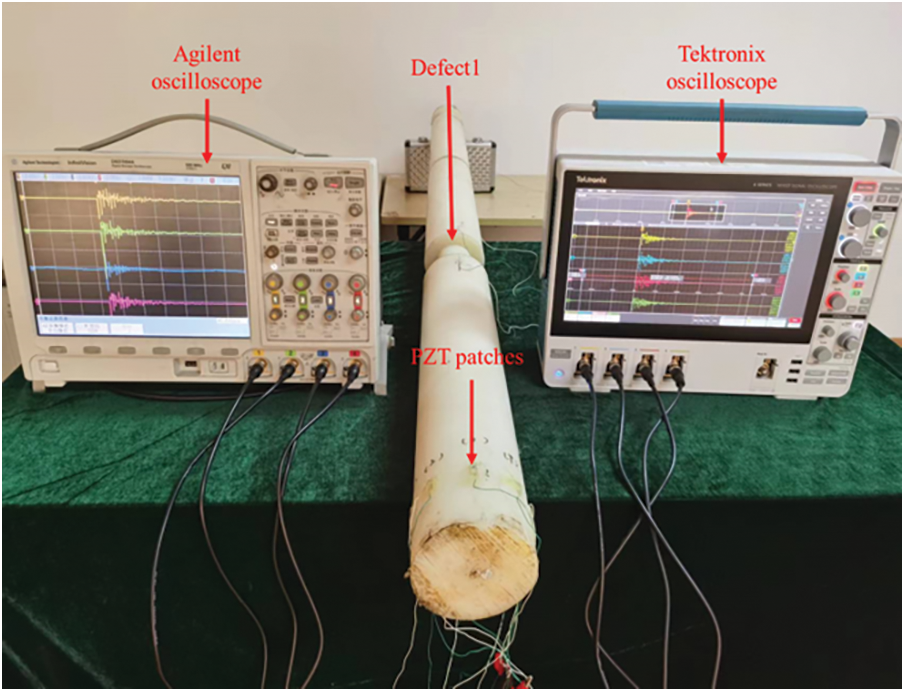
Figure 2: Experimental platform for damage detection of annular PZT transducer arrays
3.2 Optimal Arrangement of Multi-Channel Annular Array
For the uniform annular array of model piles, the beam directivity is optimised. Two parameters determine the beam directivity: the number of array elements M and the cross-sectional radius r of the model pile. The number of array elements was based on the calculation formula of the beam response of the uniform annular array.
where B(θ) is the beam response coefficient,
Fig. 3 is the beam directivity diagram of a uniform annular array, changing with the number of array elements, where the beam observation direction is 0°. When M is 2, 4 and 6, the grating lobes in the beam diagram are more obvious, and grating lobes with the same amplitude as the side lobes appear in multiple directions. When M is 8, the beam direction of the uniform annular array yielded better results. Combined with the parameters of the experimental model pile diameter, an 8-channel annular array was adopted in the experiment.
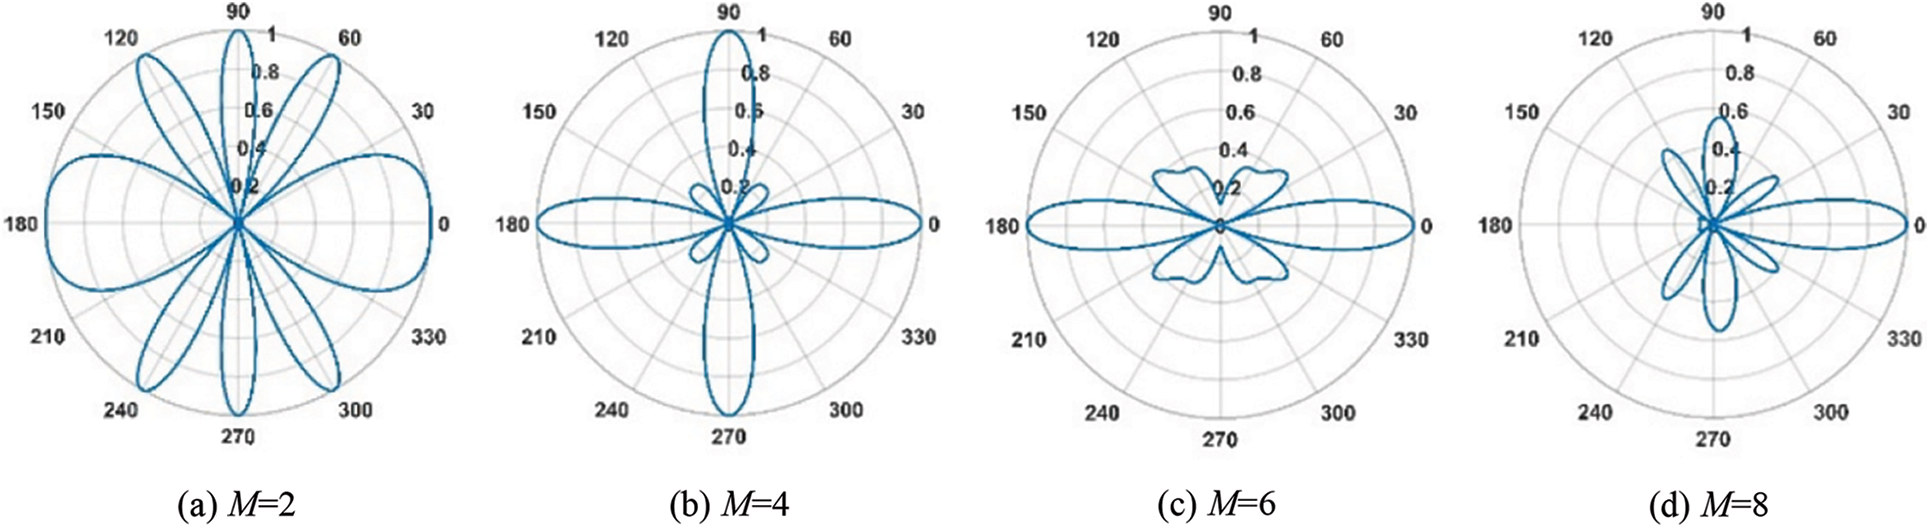
Figure 3: Beam directivity of uniform annular array with M
In the experiment, hammering on the top of the nylon pile, the excitation at the end of the foundation pile will generate longitudinal waves propagating in the direction of the pile body, in order to accurately locate the pile body defects, it is necessary to calibrate the standard value of the longitudinal wave velocity of the nylon pile, and the propagation speed of the longitudinal wave in the nylon pile is related to its material characteristics.
As shown in Fig. 1, by hammering the inner wall at defect 1 as the source, a gravitational wave along the depth of the pile is generated, and the vibration signal is excited when passing through the PZT sheet, and the time history curve of the hammer impact can be received through the oscilloscope. By calculating the time difference between the first wave received by sensor 2 and sensor 3, the time it takes for the longitudinal wave in the pile to pass through the two sensors can be calculated. The first wave crest appeared at 0.012654 s, the time difference was 6.84E-4 s, the longitudinal spacing between the two PZT sheets was 1.12 m, and the wave velocity was calculated to be 1637.43 m/s.
3.3 Preliminary Location Detection of Damage to Model Piles
In the experiment, the time-domain signal of each channel was obtained through the oscilloscope by taking the top of the pile as the excitation point and applying the excitation force through the stainless-steel hammer. The sampling frequency of the oscilloscope is 2.5 MHz. Fig. 4 shows the time-domain curve and signal attenuation curve obtained by the steel hammer excitation. After many experiments, it is found that the first negative peak is the arrival time of the first wave, the second negative wave peak to the fourth negative wave peak is the three reflections of the waveform in the first defect, and the obvious weakening phenomenon is shown, and the sudden increase of the fourth negative peak is judged to be the pile bottom reflection. By multiplying the measured wave velocity with the time difference between each reflected wave and the first wave, the experimental value x1 of the distance difference between the position where the wave is reflected during propagation and the end sensor can be obtained to determine the position of the reflection point. Fig. 1 calculates the standard value x2 for the distance difference between the location where the reflection occurred and the end sensor, and the difference between x1 and x2 is defined as Δx, which is 33, 7, 43, and 24 mm, respectively. Define Δx/x2 as σ. The maximum σ is not more than 6%, which indicates that the experimental values are in good agreement with the actual defect position.
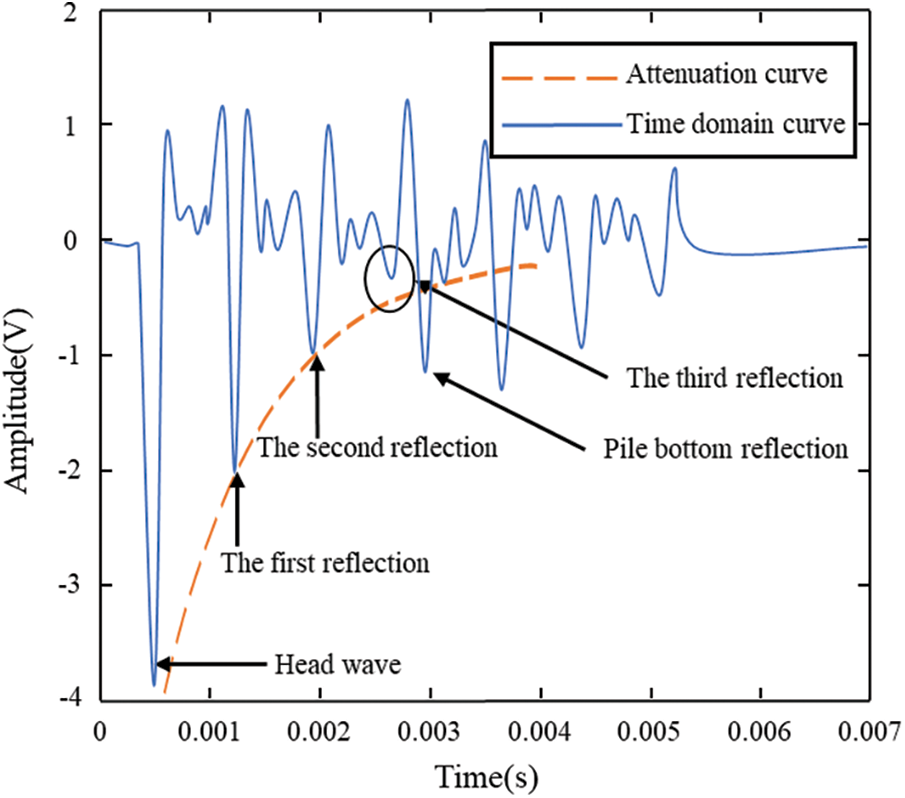
Figure 4: Experimental tap time domain signal and attenuation curve
In order to verify the accuracy of localization in this experiment, a controlled test was performed using a commercial RS-ST06D(P) multichannel cross-aperture ultrasound instrument. In order to keep the same experimental parameters, the sampling rate is adjusted to 2.5 MHz. The typical amplitude is also selected as a negative peak, because the RS-ST06D(P) accelerometer is different from the accelerometer used in the experiment, so the waveform amplitude will be different, so it is important to compare the time of arrival of the negative peak. The test results are shown in Fig. 5, after many experiments, it is found that the first negative peak is the arrival time of the first wave, the second negative wave peak to the fourth negative wave peak is the third reflection of the waveform in the first defect, and the sudden increase of the fourth negative peak is judged to be the pile bottom reflection. The definition of the difference between the calculated distance and the actual distance is the same as the previous paragraph which is 120 mm, 135 mm, and 60 mm, respectively. Since pile bottom reflection needs to be calibrated in RS-ST06D(P), it is the standard length of model piles. The definition of error is consistent with the previous paragraph, with a maximum error of 21%. It can be seen that the positioning error of the one-dimensional test using this experimental platform is smaller than that of a commercial low-strain instrument. At present, this experiment verifies the feasibility of this method in the laboratory, and we will focus on the application of this method in practical engineering in the future.
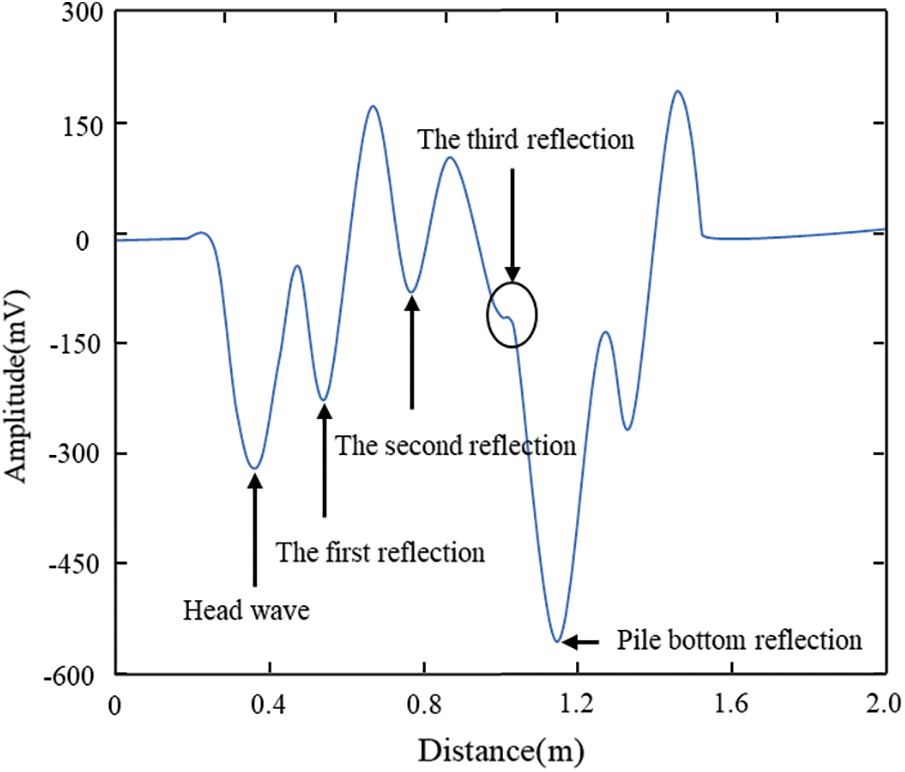
Figure 5: Waveform curve of commercial RS-ST06D(P) multichannel cross-aperture ultrasound instrument
The multiple reflections and the reflected waves of the pile body defects are influenced by unsteady harmonic vibration, which introduces errors to the reflection amplitude and the positioning accuracy. In order to further optimise the annular array damage detection platform and finally realise the 3D reconstruction of the model pile, the functional HHT method with multi-resolution analysis was used in the integrity detection of the model pile, to improve the positioning error caused by the unsteady harmonic vibration.
3.4 Eight-Channel Annular Array Signal Acquisition and HHT Analysis
Perform a Hilbert transform on valuable channel data. The results obtained are shown in Fig. 6. Since both signal amplitude and frequency are functions of time, amplitude and frequency can be superimposed on the timeline to form a Hilbert spectrum. Thus, the Hilbert spectrum can describe the variation of signal amplitude with frequency and time and the distribution of signal energy on time scales
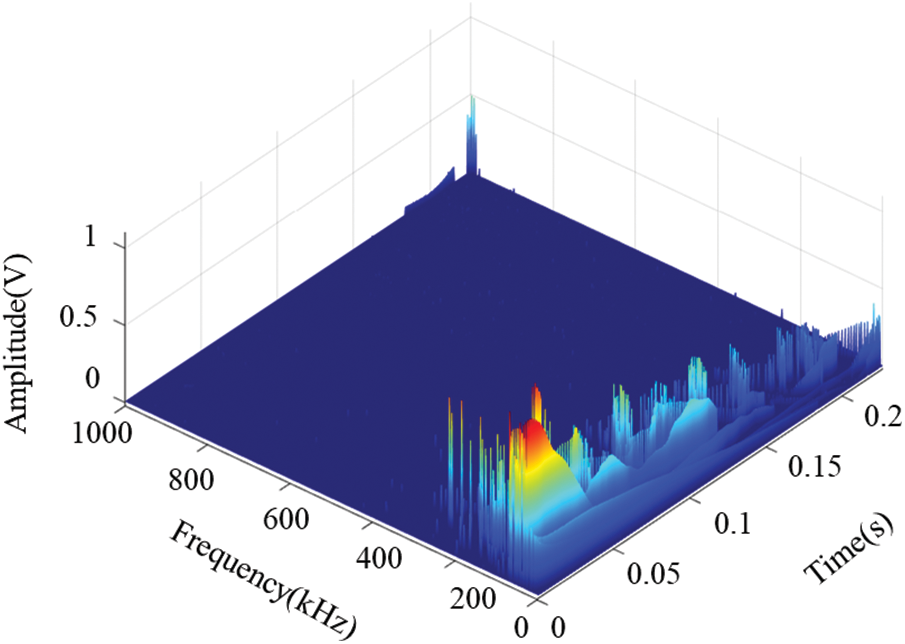
Figure 6: 3D Hilbert-Huang amplitude spectrum
In order to further realize the identification of specific damage magnitude, it is necessary to eliminate the influence of multiple reflections and unsteady harmonic vibrations to improve the target damage positioning accuracy. Taking the first channel as the typical signal for HHT analysis, a series of IMF functions (characterizing the intrinsic mode of the signal) are obtained by decomposing the collected EMD signal. Since the EMD method first extracts the high-frequency part of the signal, the frequency of IMF1 is the highest, and the frequency of the subsequent IMFs gradually decreases. Fig. 7(a) shows the IMF components with larger amplitudes of the first three orders, which represent the main components of the signal. Fig. 7(b) shows the spectrogram of the extracted IMF channel, and Fig. 7(c) shows the reconstructed signal of the IMF with a large amplitude of the first 3 orders, which can be seen by comparison with Fig. 4, which is very close to the original signal and can reflect the characteristics of the signal well. By subtracting the last few IMFs, the raw signal passes through an adaptive high-pass filter, which makes the effective signal containing impairment, such as the third reflected wave in the original signal, more pronounced. The absolute value of the amplitude of the third reflected wave in the original time-domain signal is 0.287 V. After filtering and decomposition, the signal amplitude of the third reflected wave is 0.928 V, indicating that the typical signal is obvious after HHT analysis, and it is easy to determine the main components of the original signal.
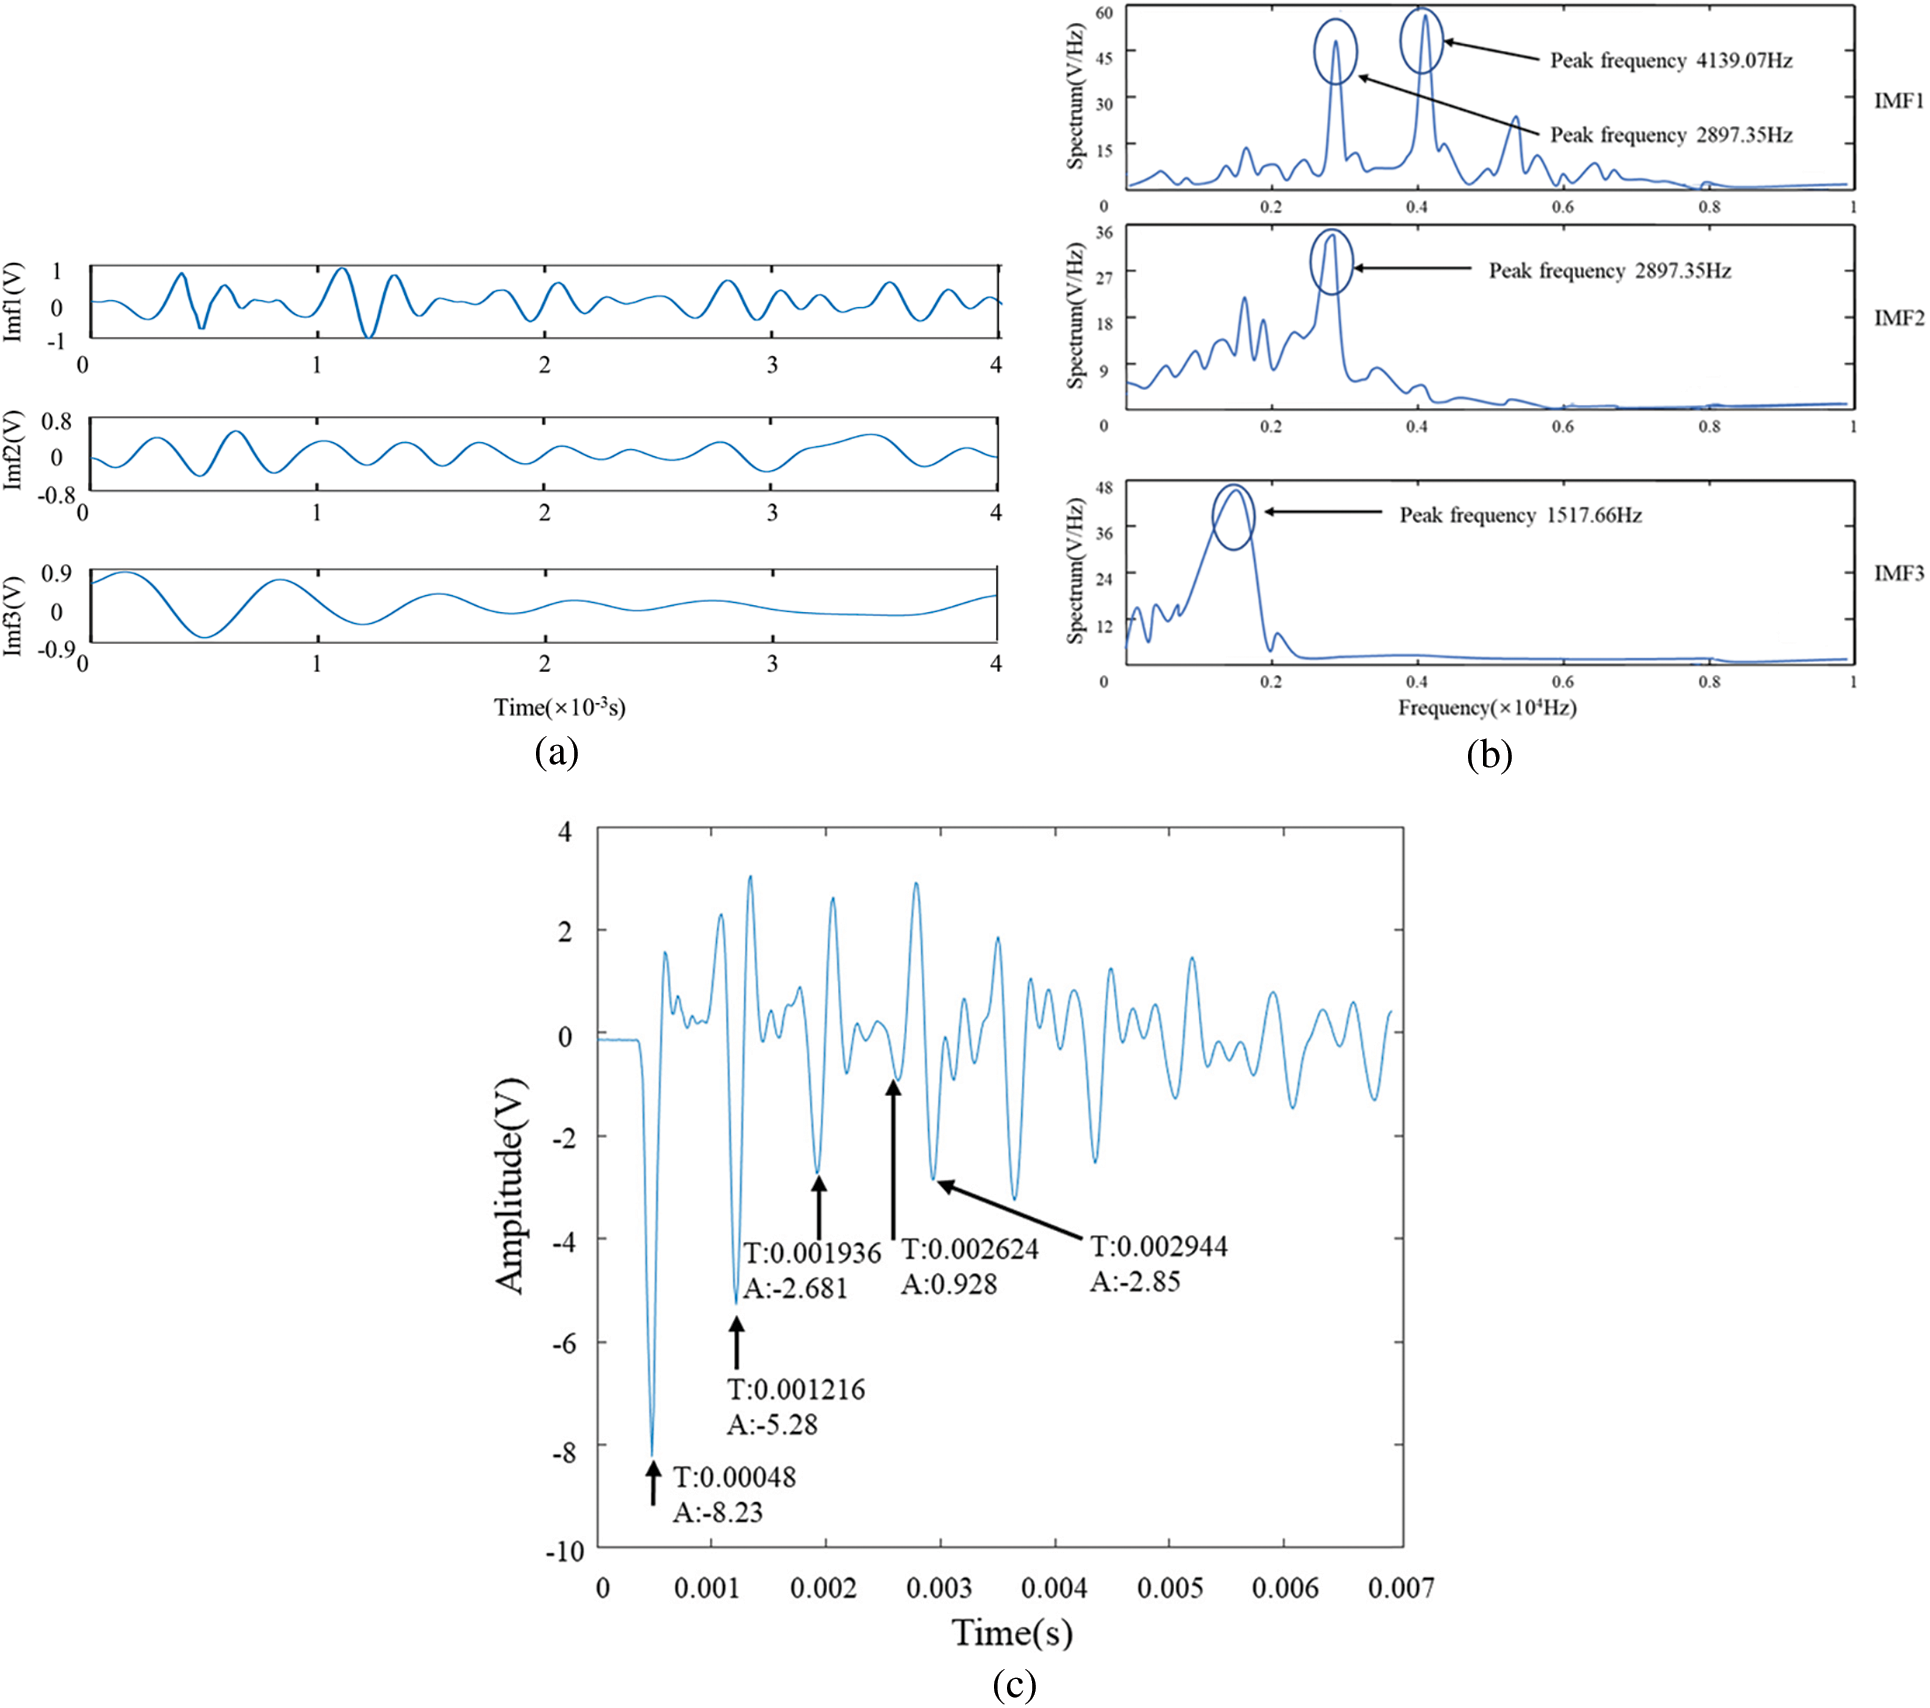
Figure 7: IMF components and instantaneous frequency of nylon pile signals: (a) IMF Components (b) Instantaneous Frequency (c) Time domain signal staking by IMF1 to IMF3
3.5 Imaging Study of Model Pile
In order to further realise the all-round visual inspection of the integrity of the foundation pile, eight-channel signal acquisition was used in the experiment. Fig. 8 shows the time-domain diagram of the received waveform during the damage detection of the annular PZT transducer’s array. The abscissa represents the time and the ordinate represents the number of the array element. The waveforms of all azimuths have good consistency. Fig. 9 is the time-domain signal waveform diagram of the damage reflected wave obtained by the superposition of eight channels. Each waveform has a high degree of similarity and each channel can locate the typical damage waveform. The superposition of the eight-channel waveform data enabled the signal wave to maintain consistency with the single-channel time-domain signal waveform while enhancing the strength of each signal.
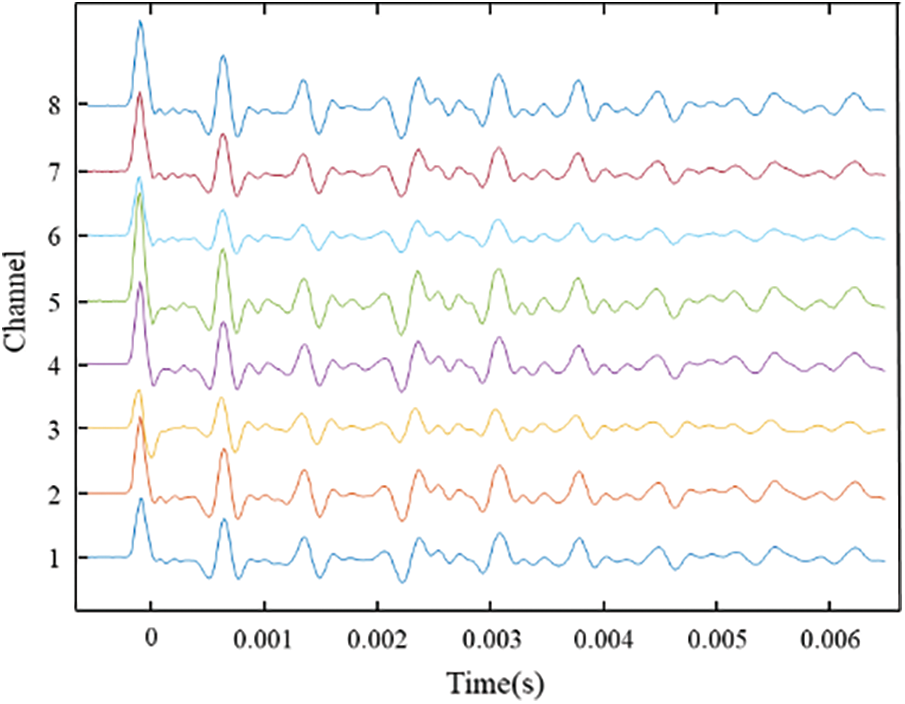
Figure 8: Time domain diagram of annular array waveform
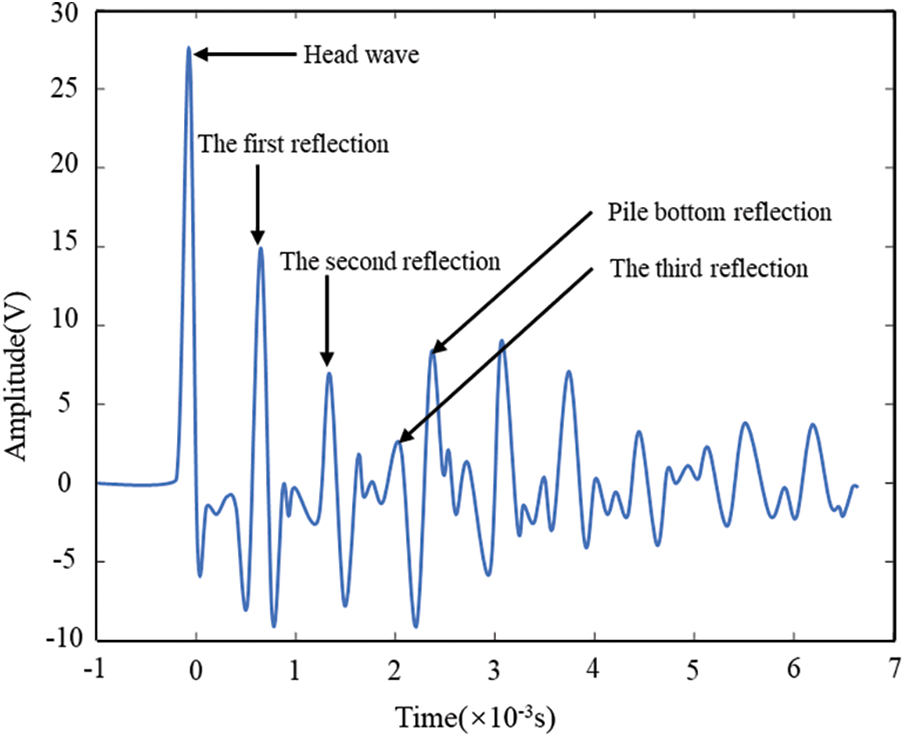
Figure 9: Eight-channel superimposed time domain diagram
By introducing the ring array coupling algorithm, the superposition effect of eight-channel detection can be realized. And the 3D reproduction of models is achieved using Cinema 4D software. This is done by converting the channel axis of Fig. 6 to the position of one PZT transducer as a base point, and the other PZT transducer is deflected around the PZT transducer. In Fig. 10, a deflection plot of the octal PZT transducer ring array of off-cycle amplitude (energy) is shown. The X axis is to multiply the timeline by the speed of the wave to convert the distance travelled by the wave. Starting with a PZT sheet, the Y axis passes through the other PZT sheets. The length of the entire Y axis is the transverse perimeter of the pile. The Z axis is the amplitude of the waveform, expressed in grayscale. The figure clearly shows the amplitude of the wave at the sensor location for the first time, the amplitude of the first, second, and third reflection points, and the amplitude at the reflection point at the bottom of the pile.
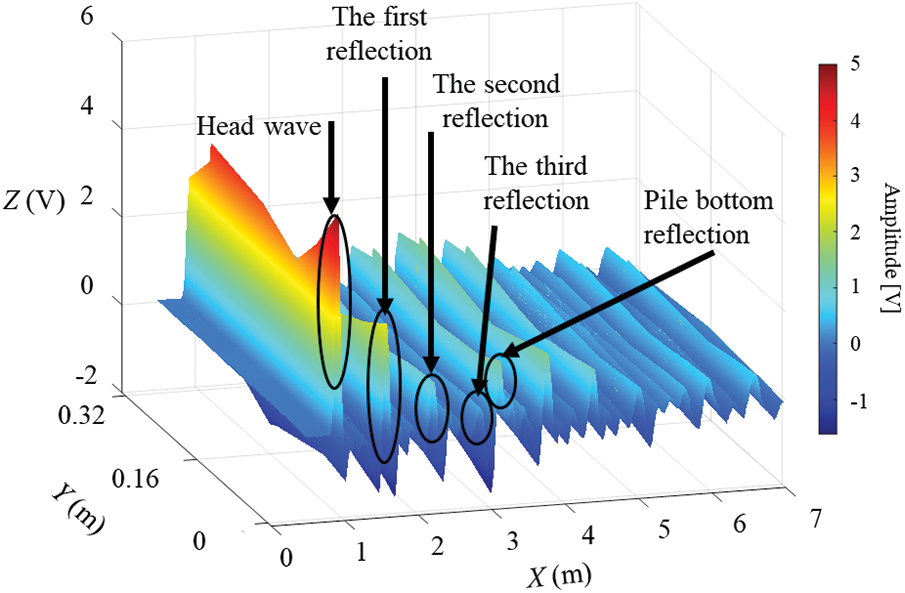
Figure 10: Deflection diagram of eight-channel PZT annular array
Since each highlighted light band in the greyscale image represents the reflection intensity of the reflected wave, its position is relatively fixed. The 3D reconstruction of the solid damage of the foundation pile can be realised by the position of the amplitude map of the 2D eight-channel annular array and the grey level. Since there are still multiple reflections in the original waveform after receiving the reflection from the bottom of the pile, the 3D greyscale image is converted into a prefabricated model with a diameter of 103 mm and a length of 5 m, and the annular array 3D imaging algorithm is imported to obtain imaging of the foundation piles for visual damage and defects.
Based on the results of 1D damage localization processing, multiple reflected waveform signals located at the bottom of the pile are removed, and an annular array 3D imaging algorithm is introduced to capture the highlight part and replace it in the uneven place in equal proportion. The X axis is the distance of wave propagation, the Y axis is the perimeter of the pile neck, and the Z axis is the amplitude axis, the magnitude of which can be expressed in grayscale, so replacing the Z axis of the 3D deflection diagram with grayscale can obtain the 2D form in the 3D deflection diagram. The 2D map is combined with a complete foundation pile model and grayscale is set to reflect inhomogeneity. Defect reflections, pile bottom reflections, and multiple superimposed reflections are identified by processing 1D damage, and the 3D reconstruction is shown in Fig. 11. The pile end to which the sensor is connected is point 0. It can be seen from the figure that the sensor position is 60 mm from the top of the pile, the center of the neck injury is 60.3 mm (length 10 mm), the second reflection is 117.9 mm, the third reflection is 178.2 mm, and the pile bottom is 200.4 mm. It can be seen that this method can directly identify the defect and the reflection position of the pile bottom, which is in good agreement with the actual position.
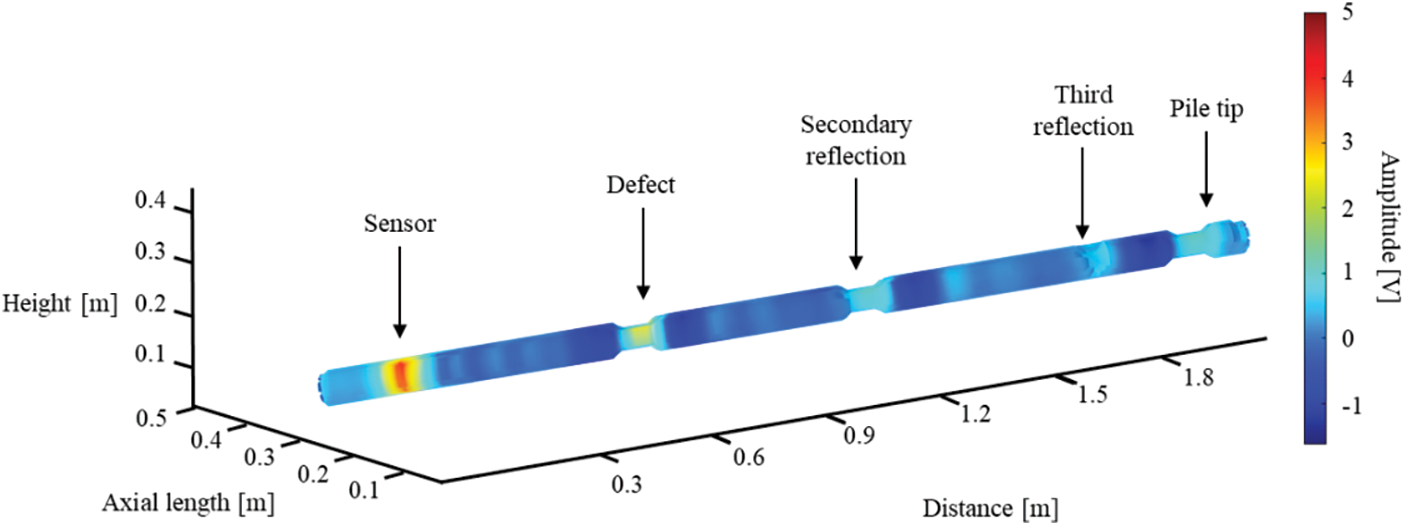
Figure 11: Schematic diagram of 3D reconstruction of model pile
Considering the problem that existing low-strain reflection methods of foundation piles cannot visually display damage imaging, an eight-channel annular array detection plat-form was built to obtain the reflected signals inside the foundation piles and perform signal coupling. Typical signals were selected for HHT analysis to eliminate instability. According to the influence of the state signal, the annular array imaging algorithm is applied to the pile integrity detection. The intuitive 3D foundation pile defect type and location reconstruction are obtained, which verifies the effectiveness of the multi-channel annular array imaging algorithm for pile integrity detection. Future research will mainly focus on the application in practical engineering and improve the detection accuracy of smaller sizes. It provides a theoretical method for the damage imaging of concrete foundation piles in practical engineering situations.
Acknowledgement: Thanks to all team members for their work and contributions.
Funding Statement: This work was supported by China Scholarship Council (No. 202008320084) and the National Natural Science Foundation of China (Nos. 11872191 and 11702118). Foreign Specialist Project of Ministry of Science and Technology (DL2022014011L). Thanks to Mr. Yang Zhang for contacting European Cooperation in Science and Technology CA21155, CA18203 and providing relevant open source knowledge.
Author Contributions: The authors confirm contribution to the paper as follows: study conception and design: Ziping Wang, Kan Feng; data collection: Ziyang Jiang; analysis and interpretation of results: Ziyang Jiang, Ziping Wang; draft manuscript preparation: Ziyang Jiang, Yang Zhang, Rahim Gorgin. All authors reviewed the results and approved the final version of the manuscript.
Availability of Data and Materials: The data used to support the findings of the study are available from the corresponding author upon request.
Conflicts of Interest: The authors declare that they have no conflicts of interest to report regarding the present study.
References
1. Bersan, S., Bergamo, O., Palmieri, L., Schenato, L., Simonini, P. (2018). Distributed strain measurements in a CFA pile using high spatial resolution fibre optic sensors. Engineering Structures, 160(1), 554–565. [Google Scholar]
2. Rizvi, S. M. F., Wang, K., Jalal, F. E., Wu, J., Dong, M. et al. (2022). Evaluation of capacity of power hammer machine foundation from high strain dynamic load test: Field test and axisymmetric numerical modeling. Transportation Geotechnics, 36, 100826. [Google Scholar]
3. Zhang, Y., El Naggar, M. H., Wu, W., Wang, Z. (2022). Torsional low-strain test for non-destructive integrity examination of existing high-pile foundation. Sensors, 22(14), 5330. [Google Scholar] [PubMed]
4. Bonagura, M., Nobile, L. (2021). Artificial neural network (ANN) approach for predicting concrete compressive strength by SonReb. Structural Durability & Health Monitoring, 15(2), 125–137. https://doi.org/10.32604/sdhm.2021.015644 [Google Scholar] [CrossRef]
5. Yang, J., Li, X. W., Sun, X. L. (2020). Extension of tube wave detection for quality evaluation of pile foundation. Geophysical Prospecting, 68(5), 1476–1491. [Google Scholar]
6. Sang, S., Wang, Z., Fan, J. (2023). Particle swarm optimization for curved beams in multistable structures. Journal of Mechanics of Materials and Structures, 17(5), 441–453. [Google Scholar]
7. Wang, X., Cui, Y., Qi, C., Zhang, S. (2017). In-situ study on non destructive detection of pile integrity using lateral excitation. Soil Mechanics and Foundation Engineering, 53, 398–404. [Google Scholar]
8. Yu, C. P. (2019). Evaluation of pile lengths using impact-induced flexural vibrations—A frequency domain approach. NDT & E International, 108, 102174. [Google Scholar]
9. Wang, K. H., Yu, Z., Xiang, C. X., Wu, J. T., Qiu, X. C. (2023). One-launcher-three-receiver sonic logging technique for pile foundation and its numerical simulation analysis. China Measurement & Test, 49(1), 1–6 (In Chinese). [Google Scholar]
10. Rizzo, P. (2022). Sensing solutions for assessing and monitoring underwater systems. Sensor Technologies for Civil Infrastructures, 355–376. [Google Scholar]
11. Rui, Y., Kechavarzi, C., O’Leary, F., Barker, C., Nicholson, D. et al. (2017). Integrity testing of pile cover using distributed fibre optic sensing. Sensors, 17(12), 2949. [Google Scholar] [PubMed]
12. Zhang, Y., Di, T., Naggar, E. I., Wu, W., Liu, H. et al. (2022). Modified Rayleigh-Love rod model for 3D dynamic analysis of large-diameter thin-walled pipe pile embedded in multilayered soils. Computers and Geotechnics, 149, 104853. [Google Scholar]
13. Zhang, Y., Wang, Z., El Naggar, M. H., Wu, W., Wang, L. et al. (2022). Three-dimensional wave propagation in a solid pile during torsional low strain integrity test. International Journal for Numerical and Analytical Methods in Geomechanics, 46(12), 2398–2411. [Google Scholar]
14. Zhang, Q., Wang, Y., Sun, Y., Gao, L., Yue, Y. (2016). Hilbert-Huang transform based method for monitoring the crack of concrete arch by using FBG sensors. Optik, 127(6), 3417–3422. [Google Scholar]
15. Roveri, N., Carcaterra, A. (2012). Damage detection in structures under travelling loads by Hilbert-Huang transform. Mechanical Systems and Signal Processing, 28, 128–144. [Google Scholar]
16. Moughty, J. J., Casas, J. R. (2017). A state of the art review of modal-based damage detection in bridges: Development, challenges, and solutions. Applied Sciences, 7(5), 1–24. [Google Scholar]
17. Huang, N. E., Shen, Z., Long, S. R., Wu, M. C., Shih, H. H. et al. (1998). The empirical mode decomposition and the Hilbert spectrum for nonlinear and non-stationary time series analysis. Proceedings of the Royal Society A: Mathematical, Physical and Engineering Sciences, 454(1971), 903–995. [Google Scholar]
18. Chen, B., Zhao, S. L., Li, P. Y. (2014). Application of Hilbert-Huang transform in structural health monitoring: A state-of-the-art review. Mathematical Problems in Engineering, 6, 1–22. [Google Scholar]
19. Kang, Z., Yang, J., Yang, Z., Cheng, S. (2020). A review of techniques for 3D reconstruction of indoor environments. ISPRS International Journal of Geo-Information, 9(5), 330. [Google Scholar]
20. Wang, Z., Zhou, A., Hao, D., Wang, J., Zhang, Y. (2023). Research on the sensing performance calibration of omni-directional broadband interdigital transducer based on PVDF substrate. Journal of Intelligent Material Systems and Structures, 34(1), 79–88. [Google Scholar]
Cite This Article
 Copyright © 2023 The Author(s). Published by Tech Science Press.
This work is licensed under a Creative Commons Attribution 4.0 International License , which permits unrestricted use, distribution, and reproduction in any medium, provided the original work is properly cited.
 Downloads
 Citation Tools