
 Submit a Paper
 Propose a Special lssue
 Open Access
ARTICLE

Research on Sleeve Grouting Density Detection Based on the Impact Echo Method
1 School of Civil Engineering, Zhengzhou University, Zhengzhou, 450000, China
2 Xixi Expressway Construction Co., Ltd., Nanyang, 474450, China
* Corresponding Author: Pinwu Guan. Email:
Structural Durability & Health Monitoring 2024, 18(2), 143-159. https://doi.org/10.32604/sdhm.2024.046986
Received 21 October 2023; Accepted 25 December 2023; Issue published 22 March 2024
 View Full Text
 Download PDF
Abstract
Grouting defects are an inherent challenge in construction practices, exerting a considerable impact on the operational structural integrity of connections. This investigation employed the impact-echo technique for the detection of grouting anomalies within connections, enhancing its precision through the integration of wavelet packet energy principles for damage identification purposes. A series of grouting completeness assessments were meticulously conducted, taking into account variables such as the divergent material properties of the sleeves and the configuration of adjacent reinforcement. The findings revealed that: (i) the energy distribution for the high-strength concrete cohort predominantly occupied the frequency bands 42, 44, 45, and 47, whereas for other groups, it was concentrated within the 37 to 40 frequency band; (ii) the delineation of empty sleeves was effectively discernible by examining the wavelet packet energy ratios across the spectrum of frequencies, albeit distinguishing between sleeves with 50% and full grouting density proved challenging; and (iii) the wavelet packet energy analysis yielded variable detection outcomes contingent on the material attributes of the sleeves, demonstrating heightened sensitivity when applied to ultrahigh-performance concrete matrices and GFRP-reinforced steel bars.Keywords
Prefabricated construction has been an important part of building industrialization and has formed a large scale of construction. Prefabricated buildings are the only way for the construction industry to achieve high-quality development [1]. The overall working performance of prefabricated concrete structures has attracted much attention, especially the connections between components, which are highly important for ensuring the overall performance of structures. The grouting connection of steel sleeves is one of the main connection methods commonly used, and the quality of this connection directly affects the safety of the structure [1,2], as shown in Fig. 1.
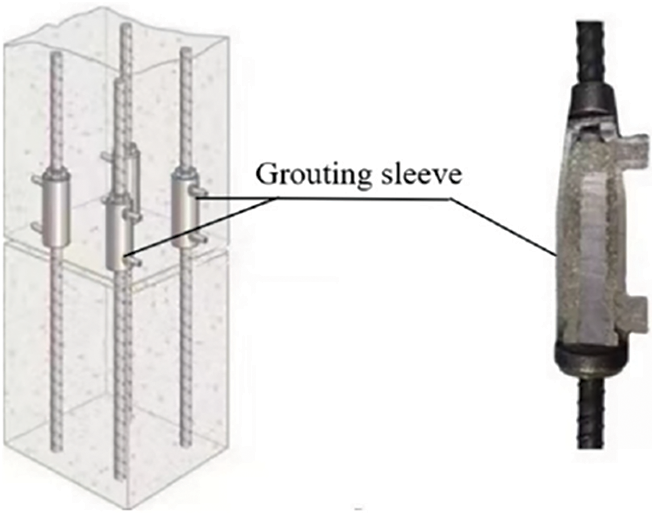
Figure 1: Schematic diagram of the steel sleeve connection
At present, the research applied to grouted sleeves involves the detection of different defect forms and materials with different characteristics [3–5], but there are still many problems to be solved in the defect detection of grouted sleeves. For example, when different materials are applied to grouted sleeves, the detection and analysis of grouted defects become more difficult. At present, radar detection methods, ultrasonic detection methods and impact echo methods are widely used in nondestructive testing of grouted sleeves [6–9]. Among them, the radar detection method is mainly used to locate the position of the sleeve, but it is impossible to determine the internal defects. The ultrasonic method has been used due to its low hardware requirements, excellent directivity, and strong penetration ability [10], but they require point-by-point measurements [11]. The impact echo method has many advantages such as easy operation, high efficiency, and low cost [9], which meet the application requirements of field detection technology for prefabricated building concrete structures. However, the signals received through this method often include surface waves and body waves, which can cause reflections and diffractions, leading to an unstable impact response of the structure. Fourier transform, which is based on stationary signals, further complicates the frequency spectrum and hinders the extraction of characteristic frequencies. As a result, the lack of detection accuracy persists.
As an advanced mathematical tool, wavelet packet analysis has been widely used in various signal extractions [10]. Due to the complexity of signals used for impact echo detection in sleeves, wavelet packet analysis has emerged as a viable solution as it can accurately distinguish between high-frequency and low-frequency components of such signals. By combining impact echo signals with wavelet packet energy analysis technology, impact echo signals can be decomposed through wavelet packet energy analysis and the sleeve defect is detected based on the different frequency bands of the wavelet packet energy. This novel approach significantly improves the accuracy of the impact echo detection method and effectively compensates for the deficiency in impact echo detection accuracy [12,13].
Based on the above background, this paper focuses on factors such as the defect degree of a typical semigrouting sleeve, sleeve material, specimen strength, the type of grouting material, and the type of connecting bars. The study aims to determine whether there are any defects present in the sleeve and to assess the influence of these various factors on the detection method. This is achieved by analyzing the differences in the frequency band distribution of the wavelet packet energy obtained through the decomposition of the impact echo signal using wavelet packet analysis. The findings from this research can provide valuable insights into nondestructive testing methods for grouting steel sleeves.
The impact echo method is a nondestructive testing method that is often used in the nondestructive testing of concrete structures. It has the characteristics of simplicity, rapidity, light equipment, little interference and repeatable testing. When the impact echo method is used to detect internal defects in concrete, the P-waves and S-waves generated by the impact of small steel balls are affected by the reflection, refraction or diffraction of the interface during propagation. Then, displacement signals caused by these reflections and resonances can be received and amplified by the sensor. Finally, the periodic waveform signals, i.e., the time-domain diagram, can be obtained. The frequency spectrum can be obtained by FFT of the waveform signal, and then the thickness and defect information of the concrete structure can be obtained. The whole process is shown in Fig. 2.
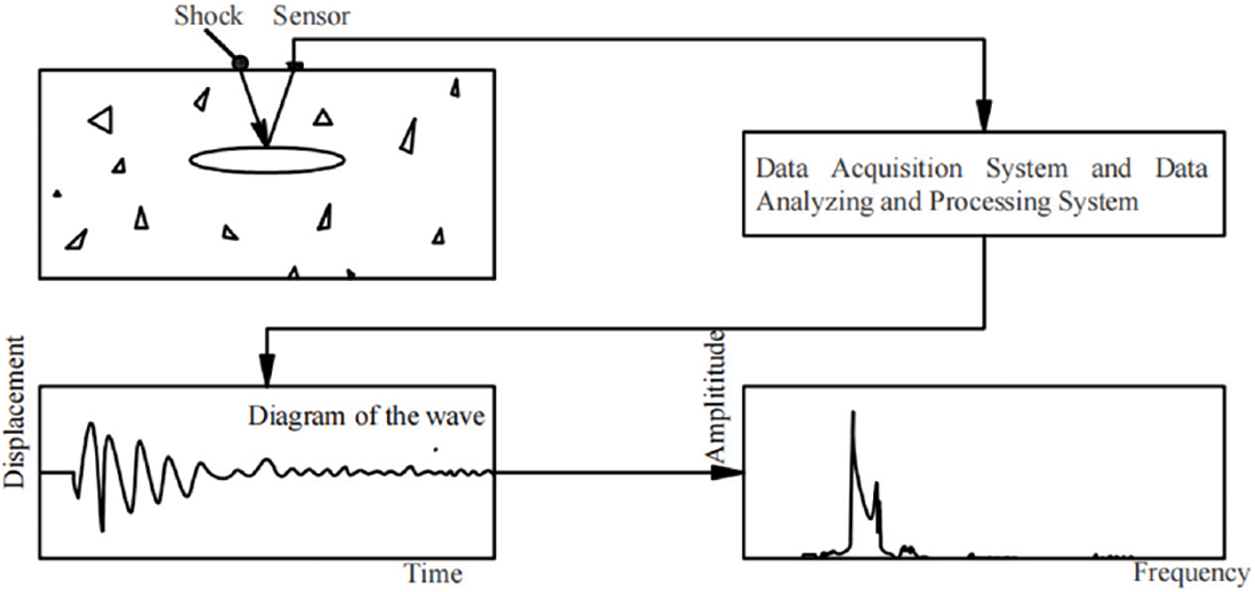
Figure 2: Schematic diagram of the half grouting sleeve
When the grouting sleeve is not full, a reflection interface between the concrete and air will be formed inside the concrete. Stress waves will reflect, refract or diffract on this reflection interface, which will lead to a longer propagation distance, longer propagation time, and lower thickness frequency. Fig. 3 shows a schematic diagram of the stress wave propagation in the structure, in which (a) is the stress wave propagation in the dense grouting area and (b) is the stress wave propagation in the insufficient grouting area. It is not difficult to see that when the grouting in the tunnel is not grouted or insufficient, the propagation distance of the stress wave is obviously longer than that in the dense grouting area, which increases the propagation time and decreases the thickness frequency. Therefore, when there is no grouting or insufficient grouting in the tunnel, defects can be found through the propagation of stress waves.
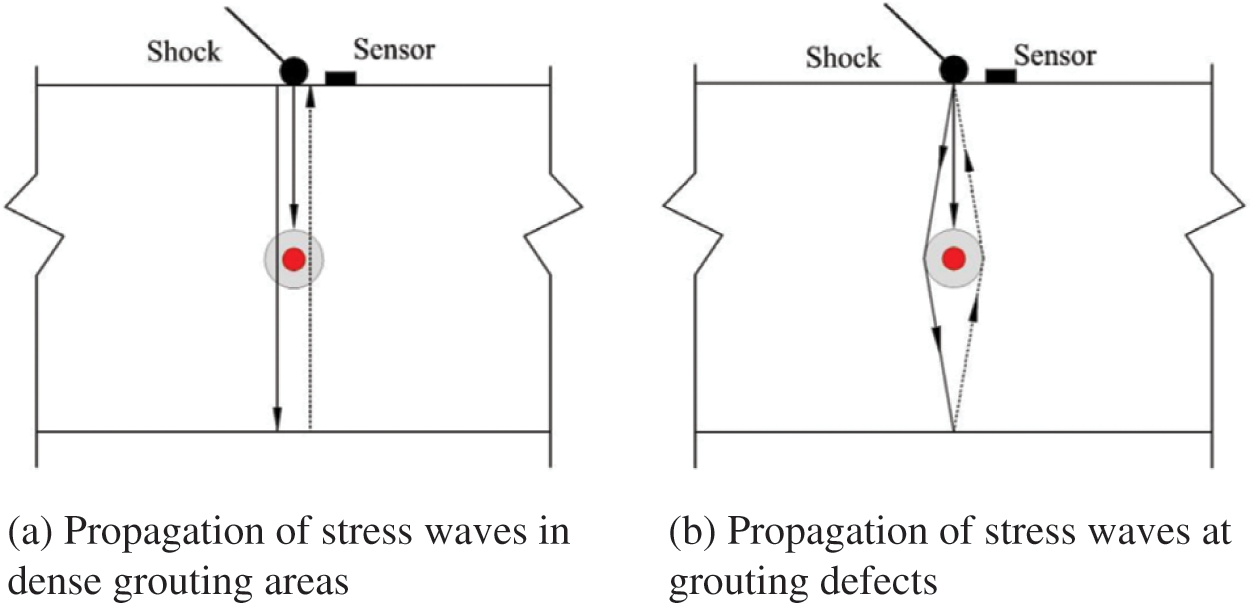
Figure 3: Propagation path of the stress wave
2.2 Wavelet Packet Energy Analysis
Wavelet analysis is further developed on the basis of the Fourier transform, and it is a signal processing method that has gradually emerged in the research direction of signal processing. The scale function of wavelet analysis is changed to binary, and the results obtained after the decomposition of the time-frequency of the detection signal are multiple frequency bands divided by exponential equal intervals. Therefore, the frequency resolution is poor in high-frequency bands, and the temporal resolution is poor in low-frequency bands. According to the characteristics of the detected signal, wavelet packet analysis decomposes the high-frequency part and the low-frequency part of the signal at the same time and adaptively selects the corresponding frequency bands to match the signal spectrum, thus improving the time-frequency resolution. Taking three-layer wavelet packet decomposition as an example, the wavelet packet decomposition tree is shown in Fig. 4.
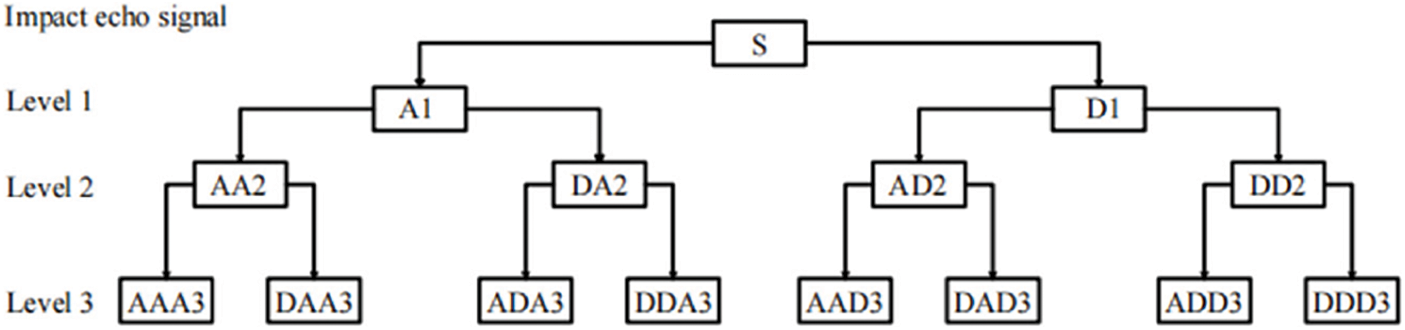
Figure 4: Schematic diagram of three-level wavelet packet decomposition
In Fig. 4, S represents the original impact echo signal that needs to be decomposed, A represents a low frequency, and D represents a high frequency. The decomposition relationship can be expressed as follows:
Assuming that the detection signal S of the impact echo is decomposed by an N-layer wavelet packet, the N-layer can obtain subsignals on
where
The energy
where i is the working condition serial number.
Then, the energy of the wavelet packet formed by decomposing the impact echo signal S by the N-layer wavelet packet under working condition i is expressed as:
Assuming that in the wavelet packet energy formed after the decomposition of the impact echo signal under working condition i, the wavelet packet energy of each frequency band in the excitation signal frequency range is
where the energy proportion of each frequency band can be obtained as follows:
By analyzing the variation in the wavelet packet energy distribution across different frequency bands, it is possible to determine whether a steel sleeve has been adequately grouted.
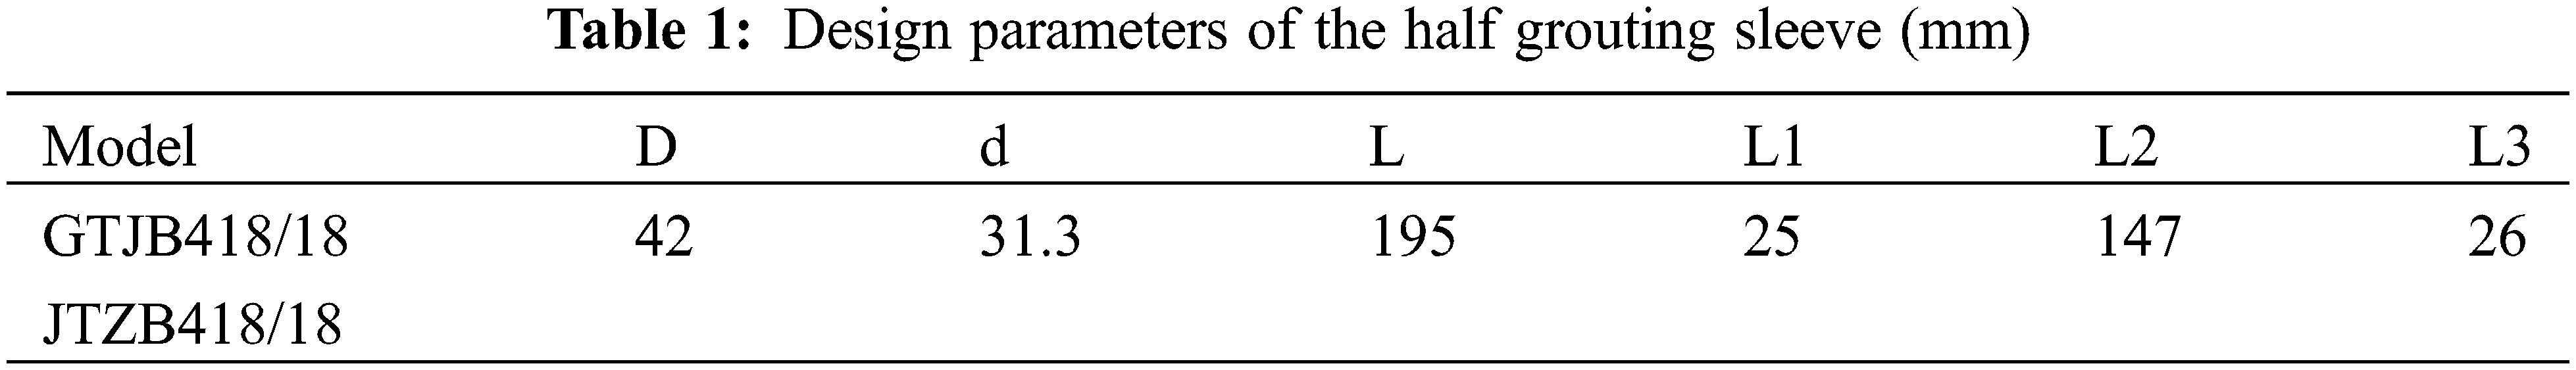
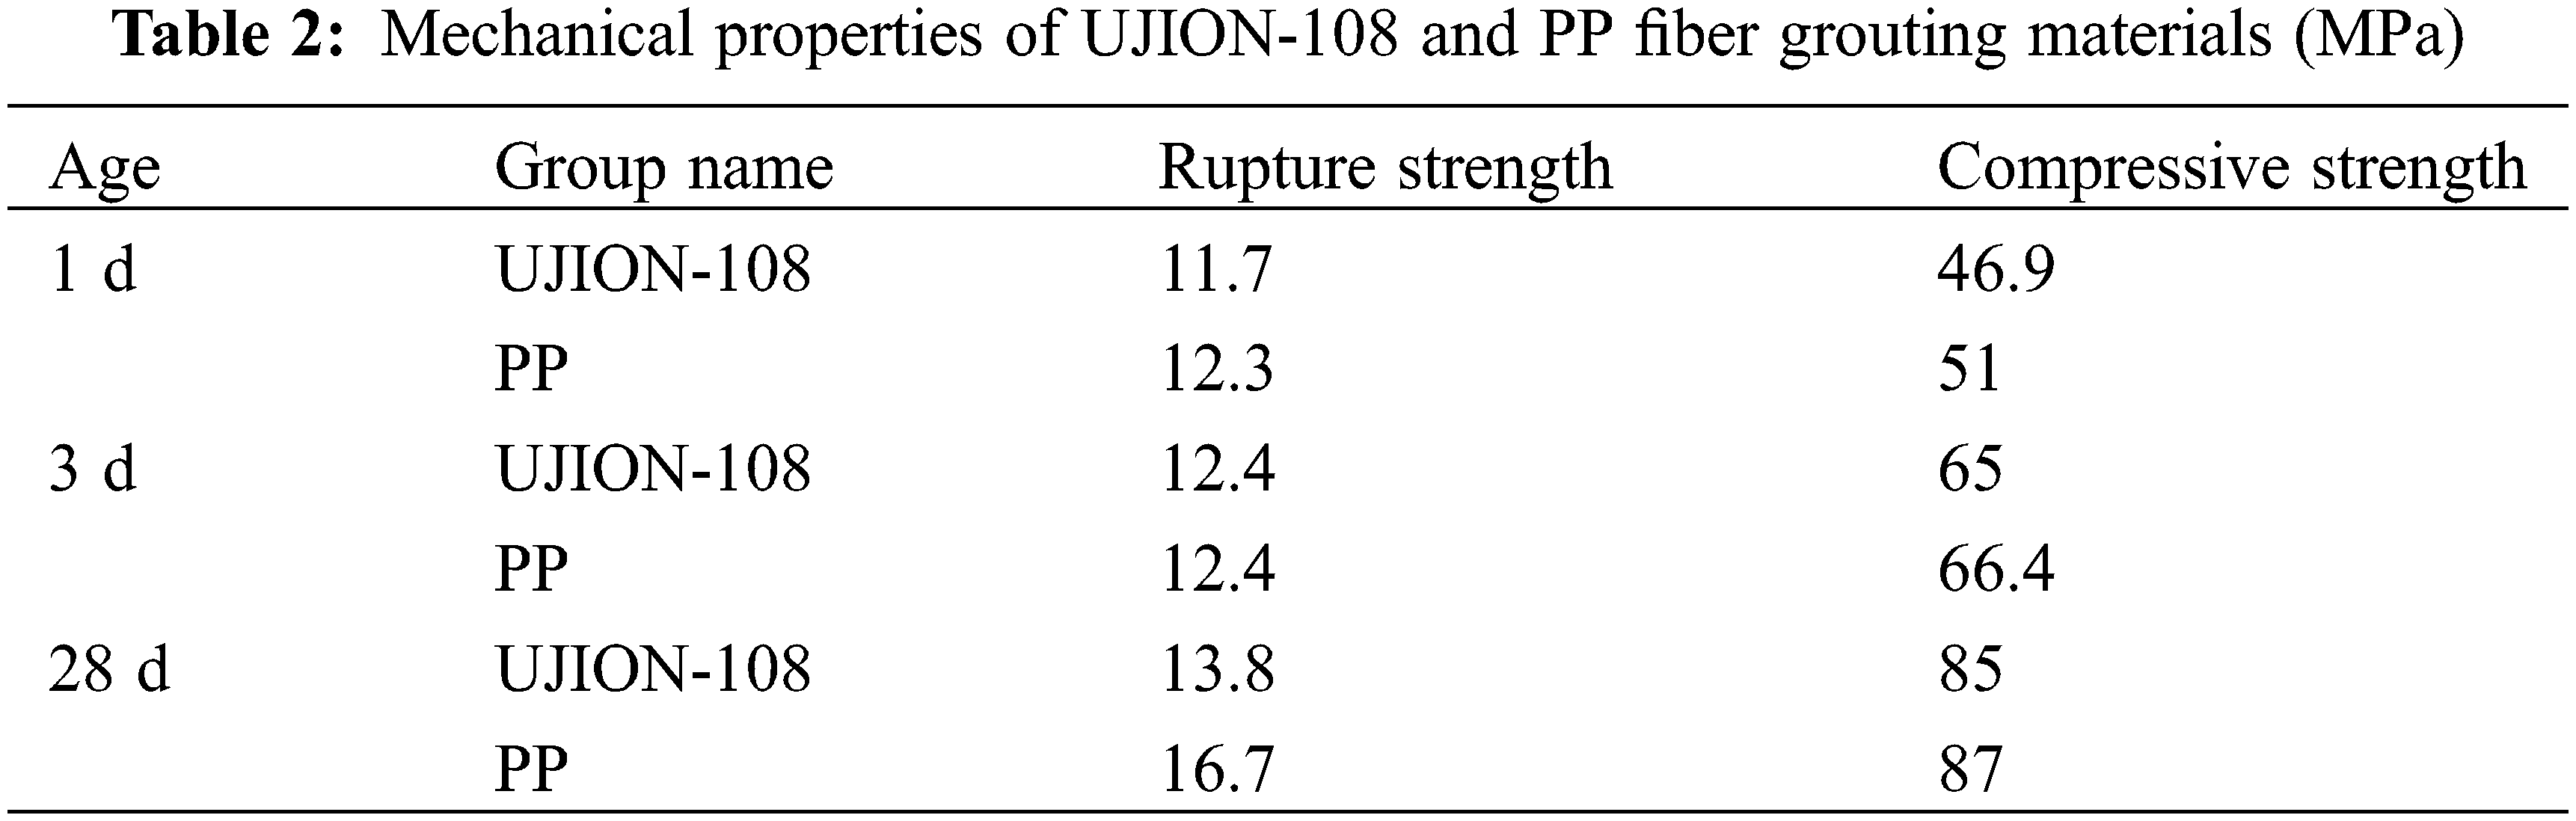
The semigrouting sleeves studied in this paper are carbon steel sleeves (JTZB 418/18) and ductile iron sleeves (GTJB4 18/18). The specific parameters are shown in Fig. 5 and Table 1. The grouting materials used include the ordinary grouting material UJION-108 and polypropylene (PP) fiber grouting material. The PP fiber used had the length of 9 mm, the diameter of 27 μm, and the density of 0.91 g/cm3 and a mixing content of 5%. The tensile strength and elastic modulus of PP fiber were 556 and 4186 MPa, respectively. The elongation of PP fiber was 18%. The water-material ratio is 0.13. The specimens are configured according to the JG/T408-2019 [14] and JGJ355-2015 [15]. The test method for determining the fluidity of the grouting material was in accordance with GB 50448-2015 [16], and the compression and resistance strength of the grouting material were measured according to the standard test block with the dimensions of 40 mm × 40 mm × 160 mm per GB/T 17671-1999 [17]. The specific parameters are shown in Table 2. Two types of connecting bars are considered as HRB400E reinforcing bars with a diameter of 18 mm, and glass fiber reinforced plastic (GFRP) bars with a diameter of 18 mm. Ultrahigh-performance concrete (UHPC) is used in the test except for 2–3 groups, and C30 concrete is used in the other steel sleeve specimens. The average compressive strength of C30 concrete is 35 MPa, and the average compressive strength of UHPC is 142.66 MPa.
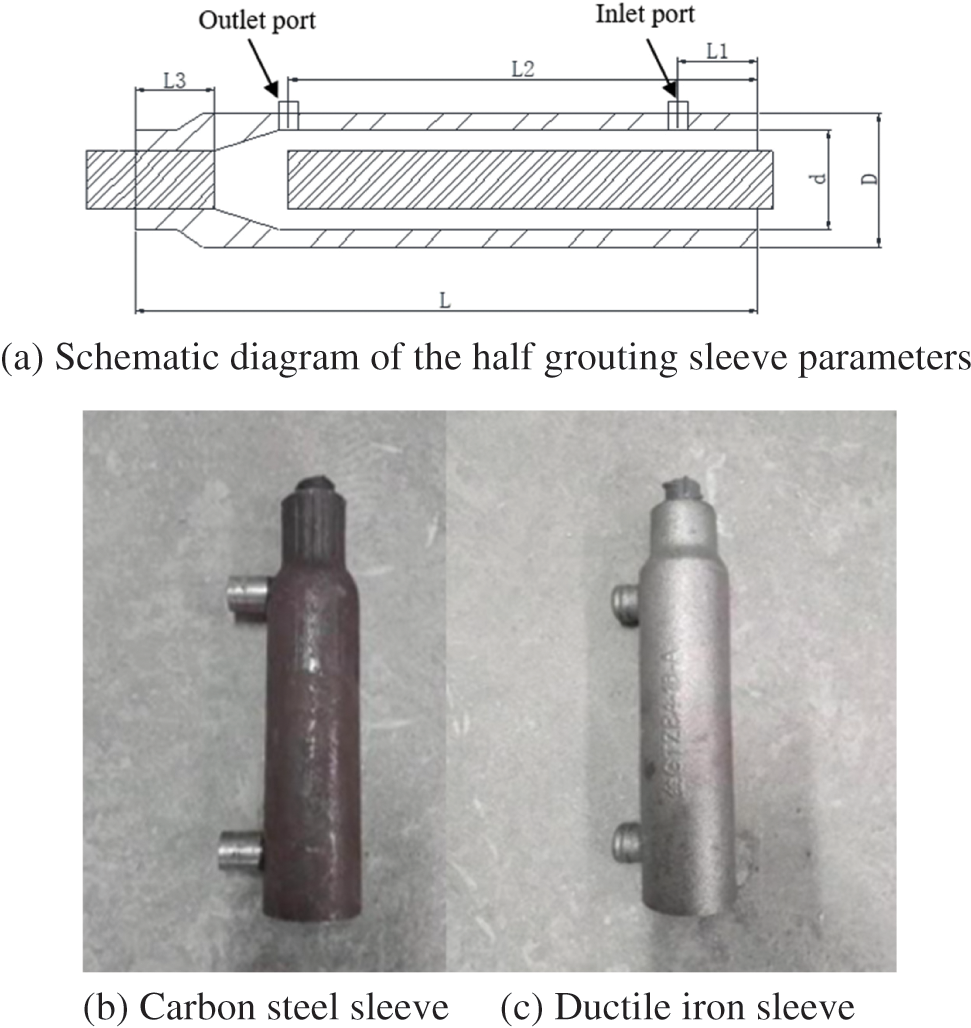
Figure 5: Schematic diagram of the half grouting sleeve
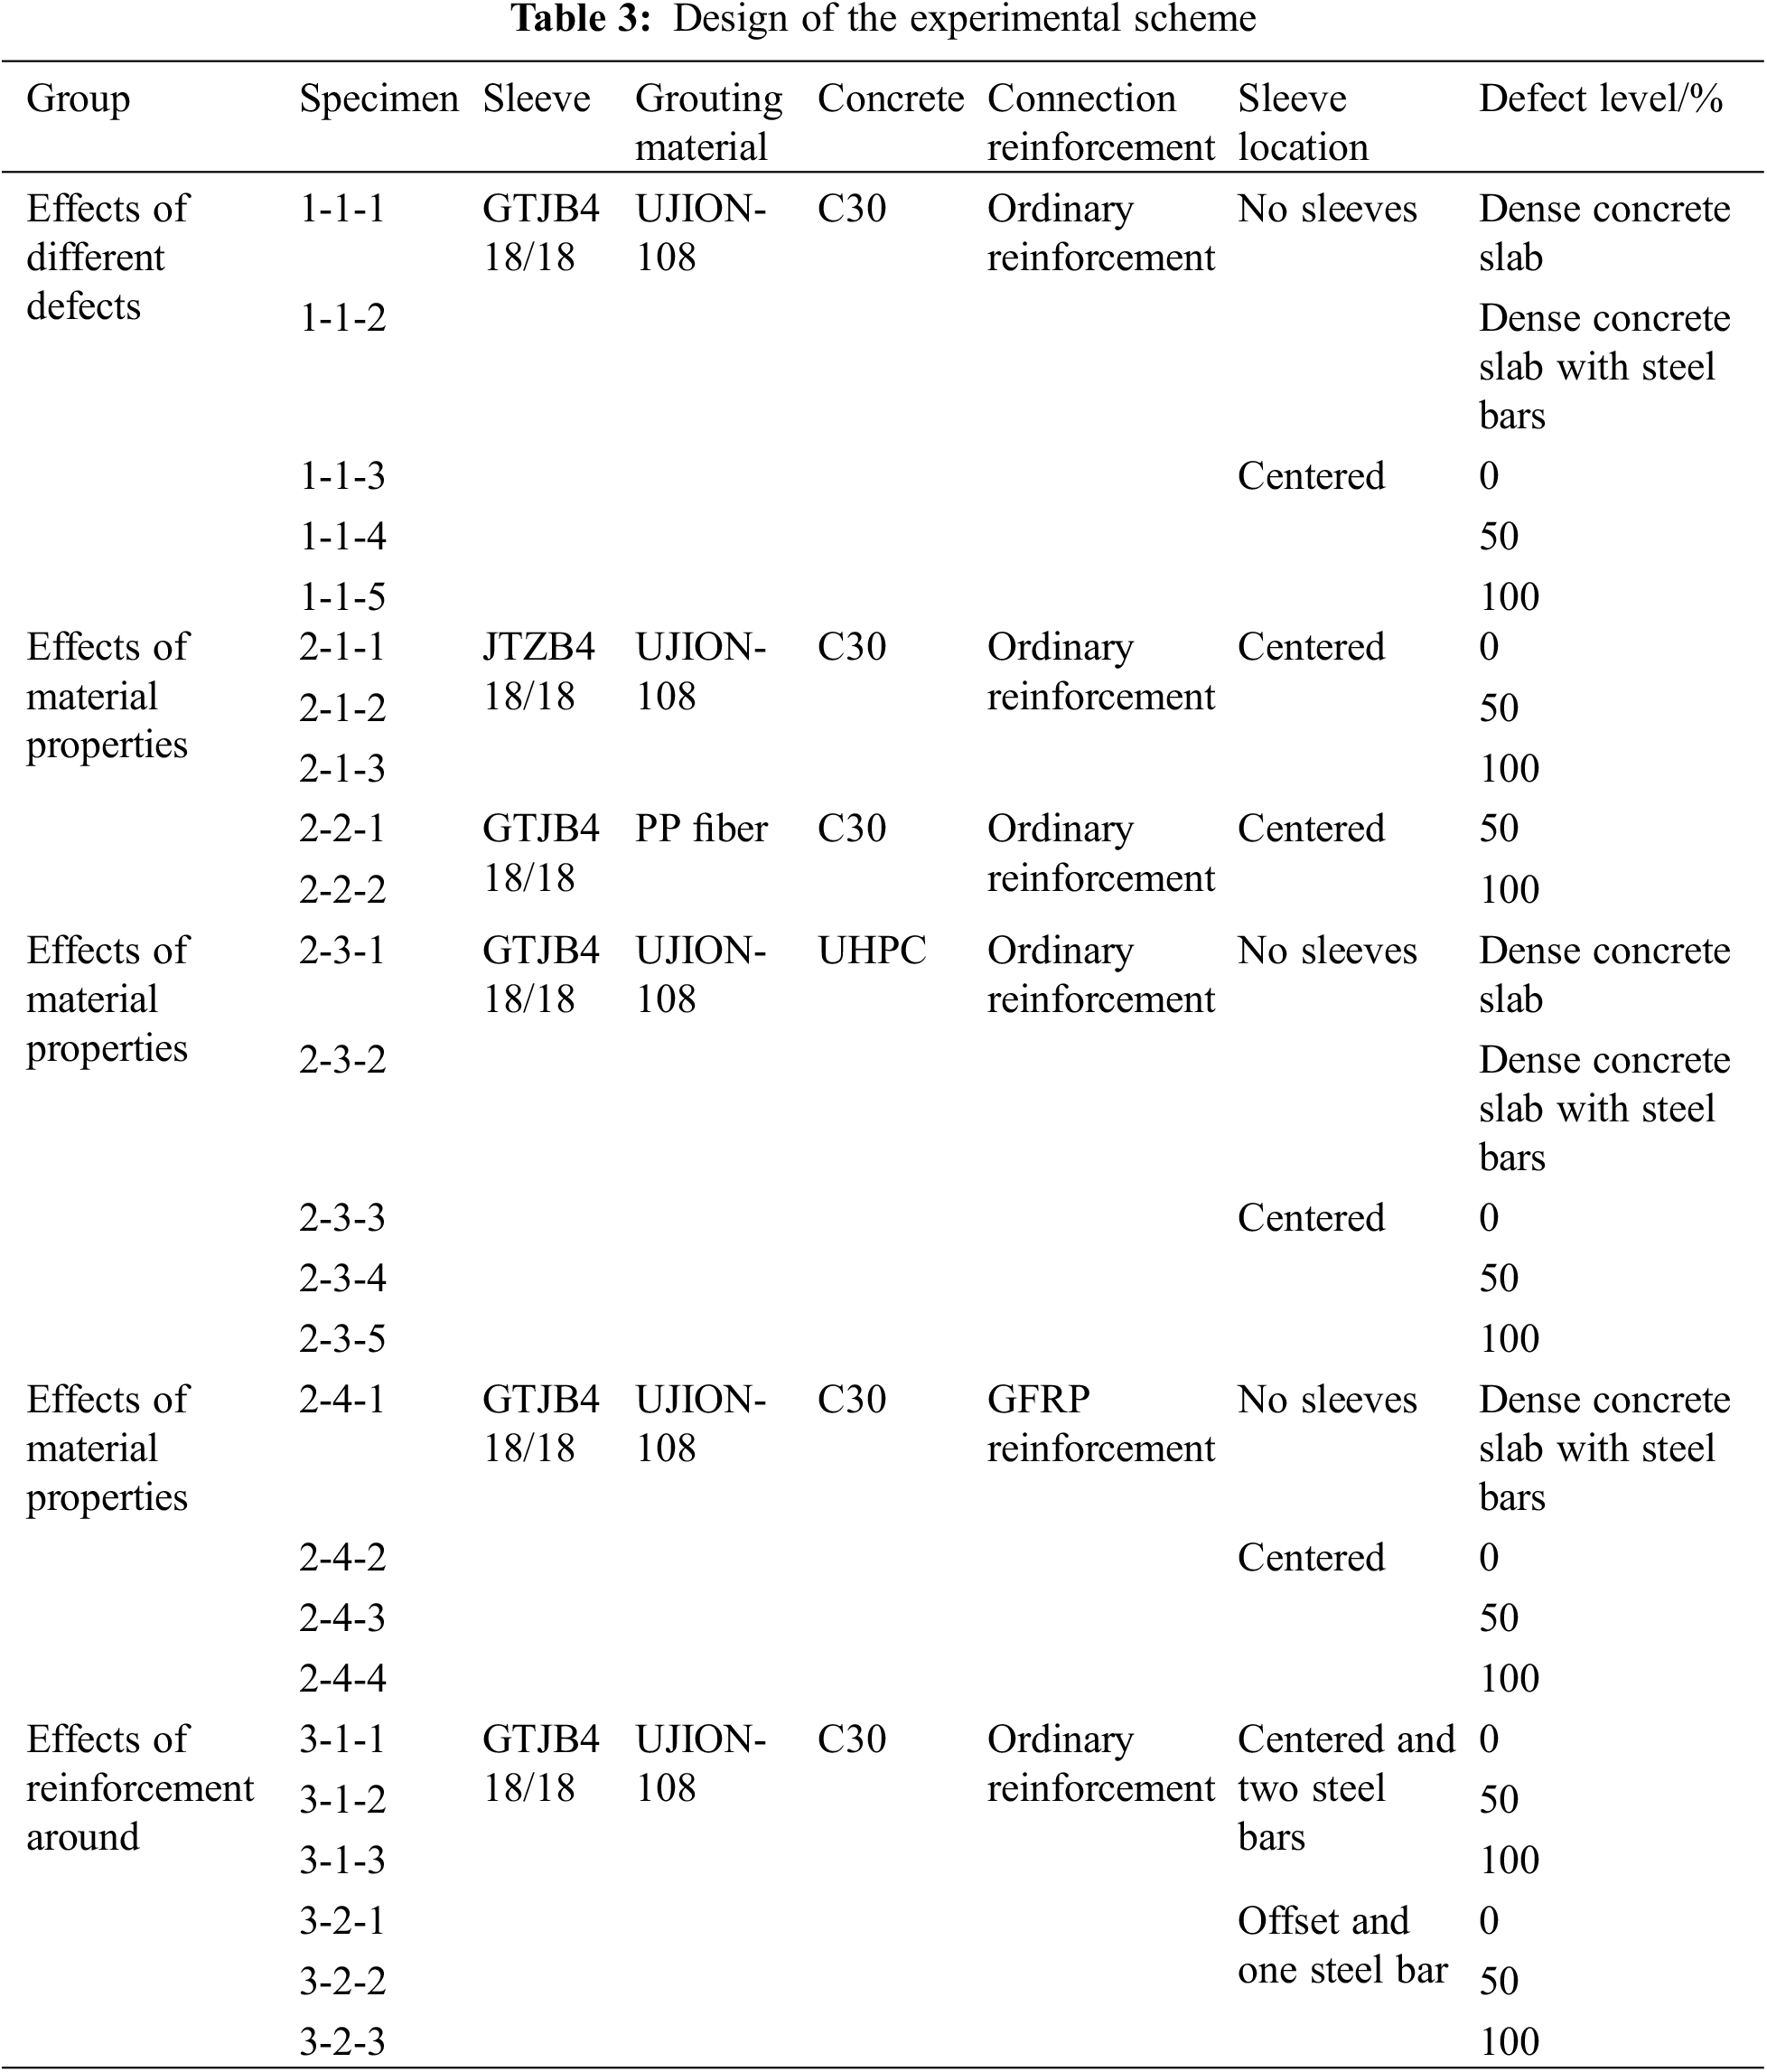
In this experiment, the feasibility of the impact echo method was verified by setting different defects, grouting materials, material characteristics, and layouts of steel bars around the sleeve on the detection results. According to the specifications of JGJ1-2014 [18], 15G365-1 [19] and 15G365-2 [20], three types of test specimens were designed as follows:
1. Control group: dense concrete slab, dense concrete slab with steel bars, and concrete with a sleeve that has different degrees of grouting defects arranged in the middle.
2. Material characteristics group: different materials (material sleeves, strengths of grouting material, concrete strength, and types of connecting bars) with a sleeve that has different degrees of grouting defects arranged in the middle.
3. Surrounding steel bar layout group: different sleeve layouts (sleeve arranged in the center with two steel bars symmetrically laid around the sleeve, offset sleeve with a steel bar laid beside the sleeve).
The specific scheme is shown in Table 3.
The specimens in each group have the same dimensions with 300 mm × 200 mm × 200 mm. When a specimen is subjected to impact, the stress wave first received by the signal receiver is reflected from the bottom of the specimen, and the stress wave reflected by the boundary has a long distance and slow reflection, which has no influence on the detection results. Thus, the boundary effect is almost negligible. The dimension of specimen is in line with the actual working conditions [21].
The specimens adopted the following naming rules: 1-1-X represents different defect groups, 2-1-X represents the JTZB4 18/18 sleeve group, 2-2-X represents the PP fiber grouting material group, 2-3-X represents the UHPC group, 2-4-X represents the GFRP connection reinforcement group, 3-1-X represents the central arrangement of the sleeve with two steel bars arranged symmetrically on both sides, and 3-2-X represents the offset arrangement of the sleeve with a steel bar arranged on the other side.
In this experiment, plastic foam and plastic pipes were used to simulate grouting defects. The specific methods were as follows: (i) plastic foam was wrapped on the steel bar, and then plastic pipes of the same length were used to wrap the plastic foam wrapped on the steel bar. (ii) After the plastic pipe was wrapped, the wrapped steel bar was put into the sleeve and fully grouted. At this time, the plastic pipe and plastic foam occupy the corresponding spaces, resulting in the grouting material not being filled to simulate the grouting defect there. The physical diagram of the defect simulation is presented in Fig. 6. Notably, the plastic pipe should not be close to the inner wall of the grouting sleeve to ensure that the grouting material can flow through the gap during grouting. A structural diagram of the 50% grouting defect is shown in Fig. 7. The steel bars used in the layout of the surrounding steel bar group were hot-rolled ribbed steel bars with a diameter of 8 mm. The arrangement of the steel bars was divided into two situations: the central arrangement of the sleeve with two steel bars arranged symmetrically on both sides, and the offset arrangement of the sleeve with a steel bar arranged on the other side. The specific arrangement is shown in Fig. 8.
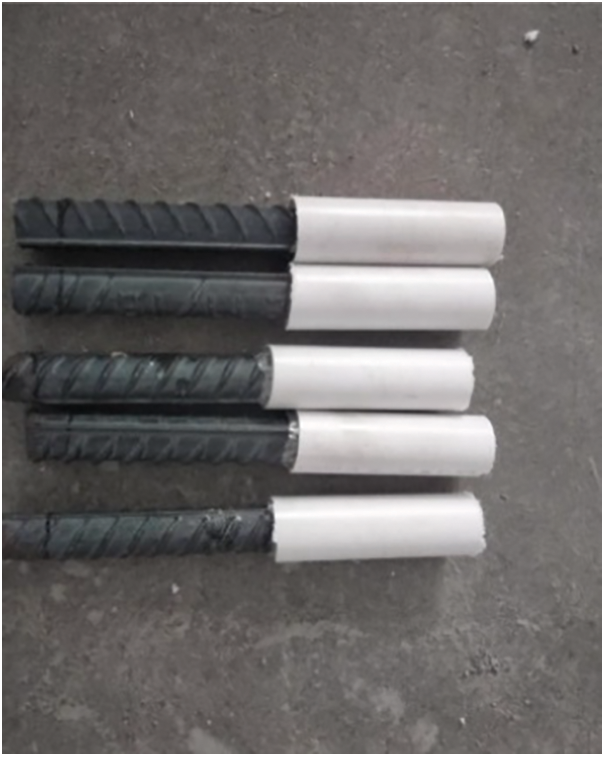
Figure 6: Physical diagram of the defect simulation
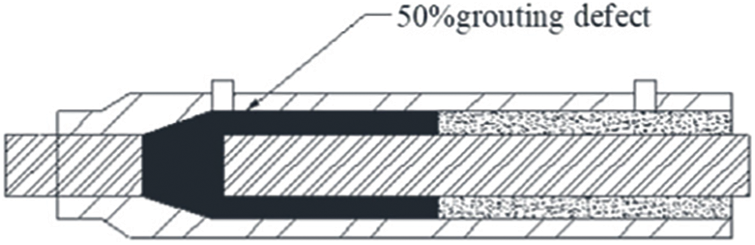
Figure 7: Structural diagram of the 50% grouting defect
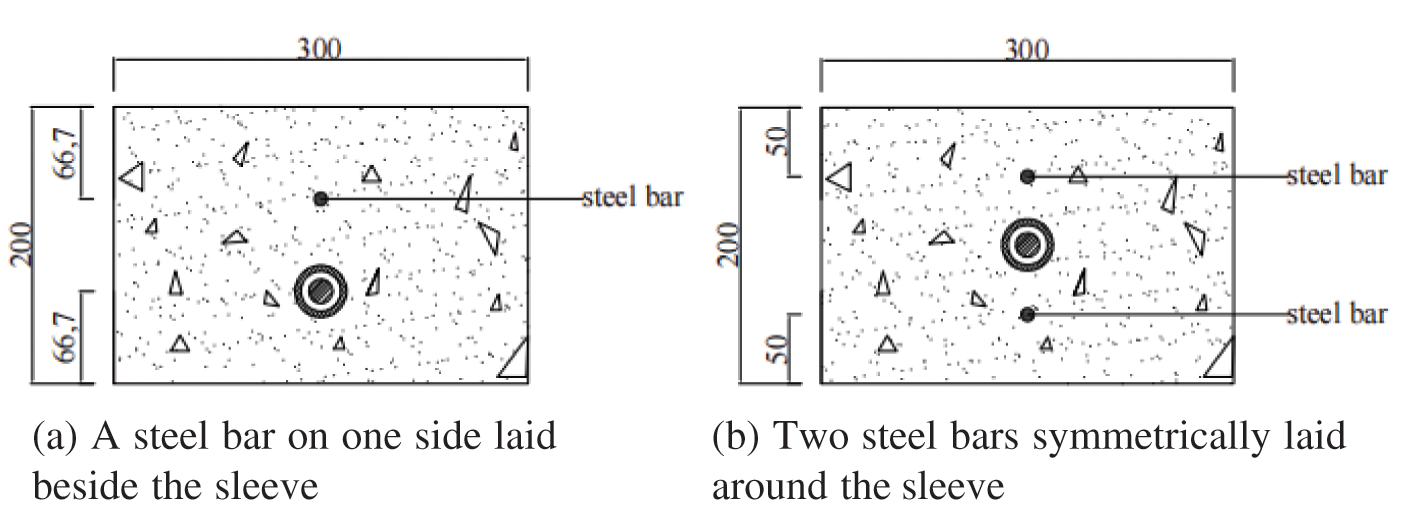
Figure 8: Layouts of the steel bars (unit: mm)
The surface of the specimen was treated, and then the measuring points and lines were arranged. The measuring line was set directly above the sleeve. Within the effective range of the sleeve, each measuring point was set every 20 mm, for a total of 9 measuring points, as shown in Fig. 9. Measuring points 1–7 are located on the connecting bars of the sleeve. For specimens with 50% grouting fullness in groups 1–3, the defects are mainly arranged at measuring points 4–7, and measuring points 1–3 belong to the dense grouting area. According to the arrangement of sleeve defects, measuring points 2 and 5 were randomly selected as the measuring points for wavelet packet energy analysis.
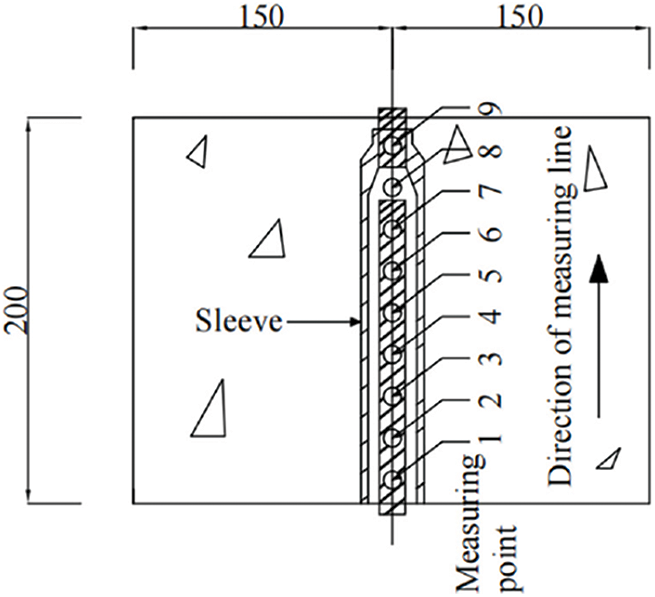
Figure 9: Layout of the measuring points and measuring line (unit: mm)
In this experiment, a prestressed concrete multifunctional detector (SPC-MATS) was used. According to the thickness of the specimen, a small steel ball with a diameter of 5 mm was selected as the impact source to knock the specimen. Before the test, it is necessary to denoise the equipment to ensure that the Voice Onset Time (VOT) of the noise signal is less than 0.02 ms and the signal-to-noise ratio is less than 2 db. A field test diagram is shown in Fig. 10.
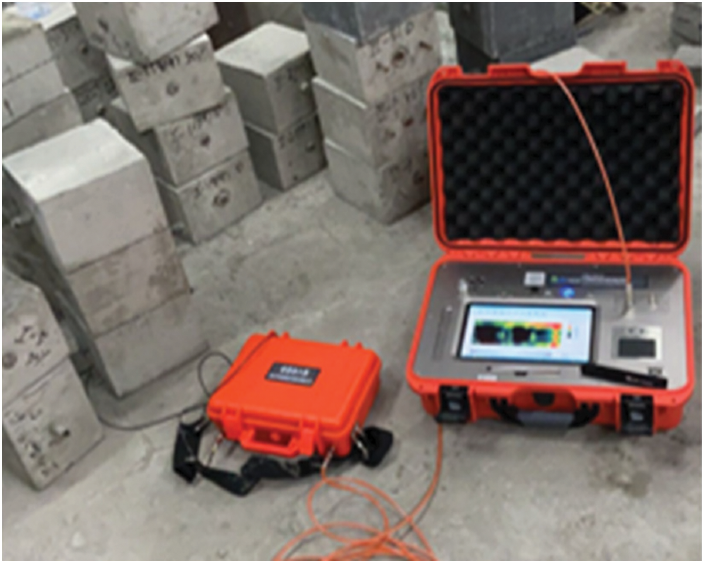
Figure 10: Diagram of the field test
The collected impact echo detection data signal was imported into MATLAB for further analysis. Wavelet packet decomposition was performed using the wavelet analyzer in MATLAB. The db22 wavelet function, known for its excellent characteristics across various wavelet bases, was used for the decomposition. A total of eleven layers of wavelet decomposition were carried out. The signals at measuring points 2 and 5 were taken from each group of specimens for wavelet packet energy analysis. Among them, three impact echo signals were collected at each measuring point to calculate the wavelet packet energy ratio, and the arithmetic average value was taken as the wavelet packet energy ratio.
4.1 Influence of Different Defects
Fig. 11 illustrates the specimens in group 1-1, showcasing the frequency bands with high energy ratios ranging from 38 to 41. The energy ratio of specimen 1-1-1 is primarily concentrated in frequency band 40, with the energy values at measuring points 2 and 5 both registering as 0.02085. Specimen 1-1-2 exhibits a similar concentration in frequency band 40, with the energy values at measuring points 2 and 5 recorded as 0.02088, indicating a minor difference of 0.00003 from the energy ratio of specimen 1-1-1. Similarly, specimen 1-1-3 primarily shows concentration in frequency band 38, with an energy ratio of 0.021, representing a deviation of 0.00025 from that of specimen 1-1-1. The detection signals of specimens 1-1-4 and 1-1-5 are mainly concentrated in frequency band 39.
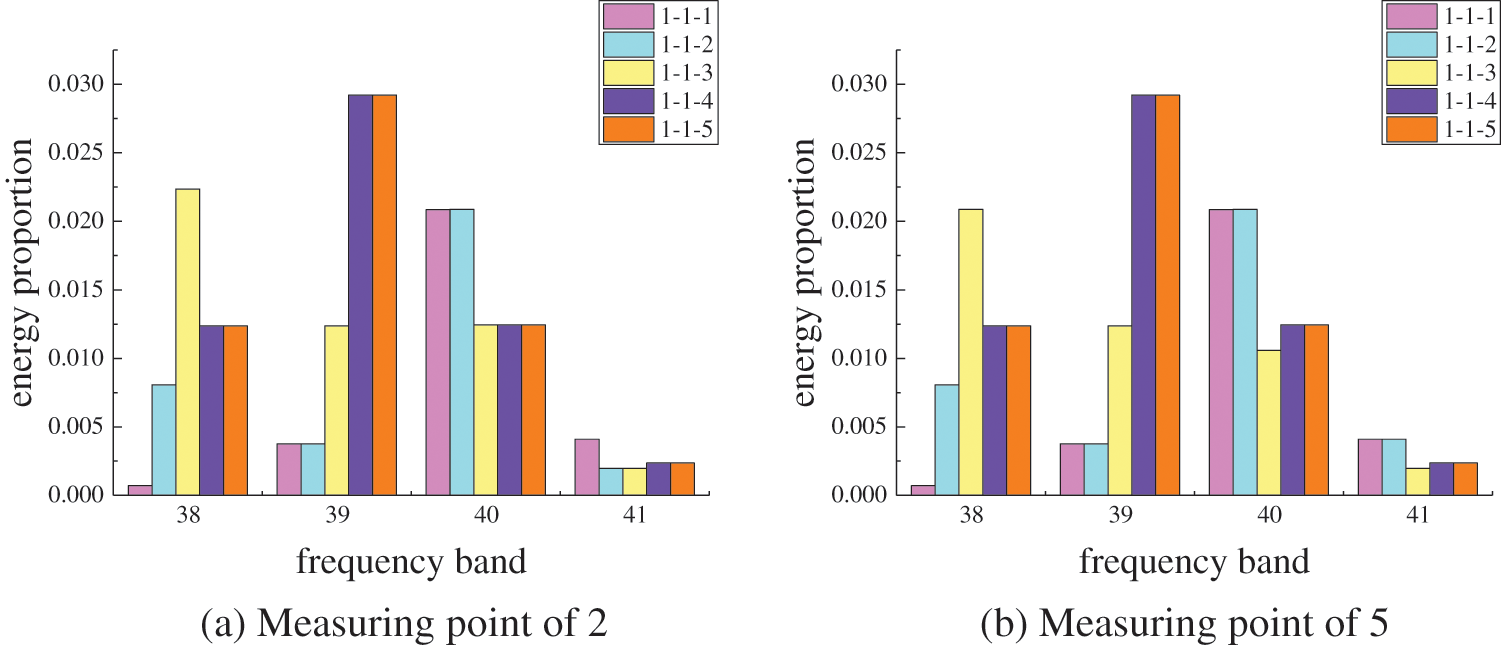
Figure 11: Wavelet packet energy ratio of each test point in group 1-1
According to the data, the frequency band of the specimen with 0% grouting fullness is the lowest band in the band range, so wavelet packet energy analysis can easily distinguish the sleeve with 0% grouting fullness. However, the frequency bands of the specimens with 50% grouting fullness and 100% grouting fullness are the same, indicating that the sleeve with 50% grouting fullness and 100% grouting fullness cannot be distinguished well. The reason was that due to the limitations of the accuracy of the method itself, the wavelet packet energy method cannot accurately judge defects with little difference in grouting degree.
4.2 Influence of Different Materials
By comparing the wavelet packet energy ratios of specimens in group 2-X with those of specimens in group 1-1, the influence of different materials on the wavelet packet energy analysis is analyzed.
Fig. 12 illustrates the specimens in group 2-1, showcasing the frequency bands with high energy ratios ranging from 38 to 41. The energy ratio of specimen 2-1-1 is chiefly concentrated in frequency band 38, with respective energy ratio values of 0.0287 and 0.0244 at measuring points 2 and 5. For specimen 2-1-2, the energy ratio is primarily concentrated in frequency band 39, featuring energy ratio values of 0.0248 and 0.0212 at measuring points 2 and 5. Specimen 2-1-3 exhibits a main concentration in frequency band 39, with energy values of 0.0274 and 0.0278 at measuring points 2 and 5, respectively.
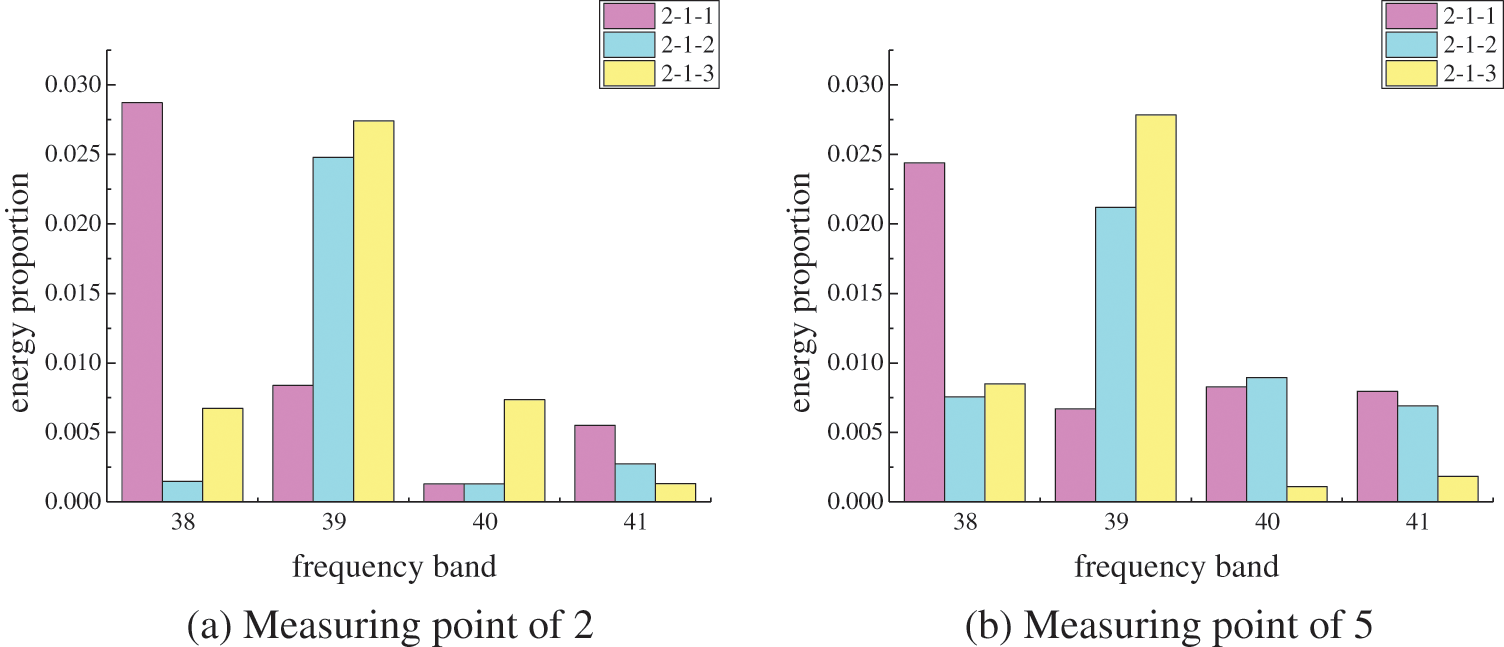
Figure 12: Wavelet packet energy ratio of each test point in group 2-1
According to the data, the frequency bands of specimens with 0%, 50%, and 100% grouting fullness are the same as those of the specimens in group 1-1. Compared with the wavelet packet energy ratios of specimens in group 1-1, the material of the sleeve does not affect the detection of grouting defects in the sleeve.
Fig. 13 illustrates the specimens in group 2-2, showcasing the frequency bands with high energy ratios ranging from 38 to 41. The energy ratio of specimen 2-2-1 is primarily concentrated in frequency band 38, with energy ratio values of 0.0275 and 0.0279 at measuring points 2 and 5, respectively. On the other hand, the energy ratio of specimen 2-2-2 exhibits a main concentration in frequency band 39, with energy ratio values of 0.0232 and 0.0238 at measuring points 2 and 5, respectively.
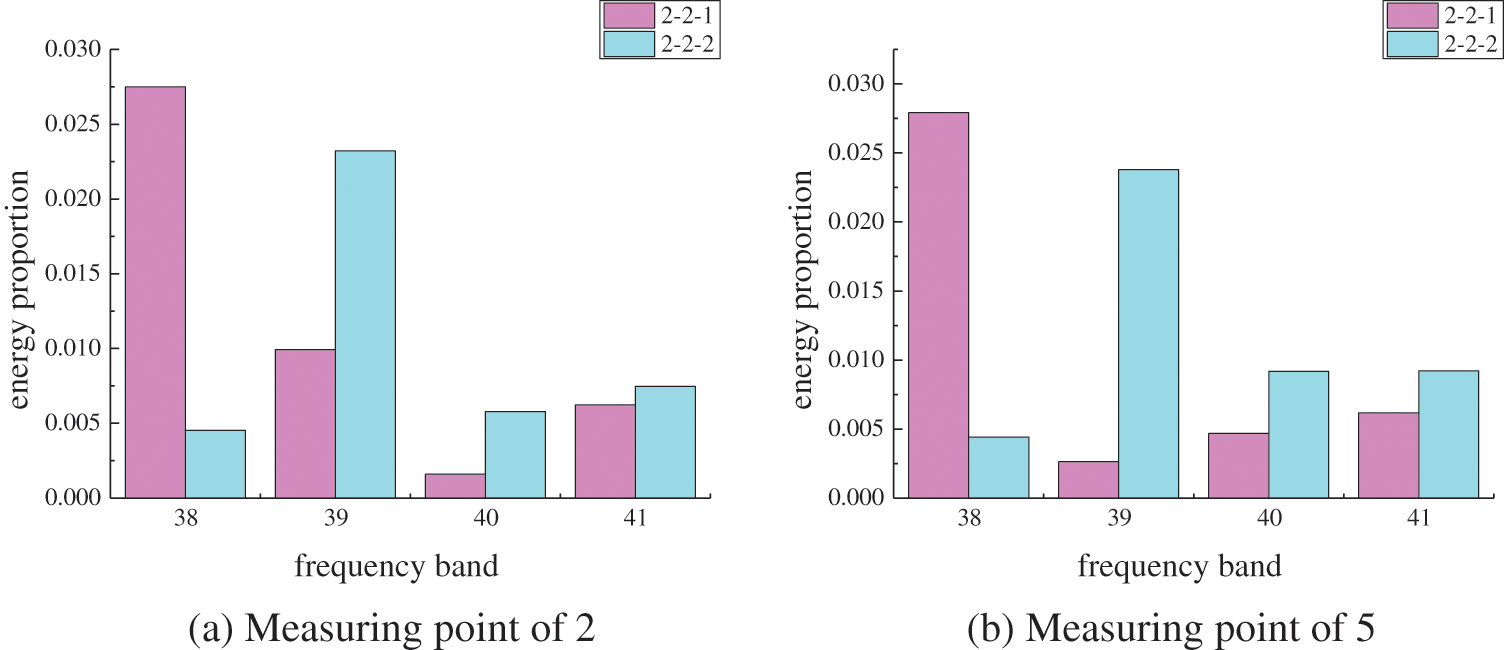
Figure 13: Wavelet packet energy ratio of each test point in group 2-2
Compared with the frequency bands of specimens in group 1-1, the frequency band of the PP fiber grouting material group is slightly lower than that of the ordinary concrete group, and the frequency band of specimens with 50% grouting fullness is not the same as that of 100% grouting fullness. This phenomenon may be attributed to the use of the PP fiber grouting material, which increases the influence of the defective specimens on the frequency band.
Fig. 14 illustrates the specimens in group 2-3, showcasing the frequency bands with high energy ratios ranging from 42 to 47. The energy ratio of specimen 2-3-1 is mainly concentrated in frequency band 45, with energy ratio values of 0.0273 and 0.0281 at measuring points 2 and 5, respectively. The energy ratio of specimen 2-3-2 is mainly concentrated in the frequency band 47, and the energy values at measuring points 2 and 5 are 0.0281 and 0.0289, respectively. The energy ratio of specimen 2-3-3 is concentrated in frequency band 42, with energy ratio values of 0.0273 and 0.0250 at measuring points 2 and 5, respectively. The energy ratio of measuring point 2 of specimen 2-3-4 is concentrated in the frequency band 45, with an energy value of 0.022, and the energy ratio of measuring point 5 is concentrated in frequency band 44, with an energy value of 0.022. The energy ratio of specimen 2-3-5 is mainly concentrated in frequency band 45, and the energy values at measuring points 2 and 5 are 0.0266 and 0.0281, respectively.
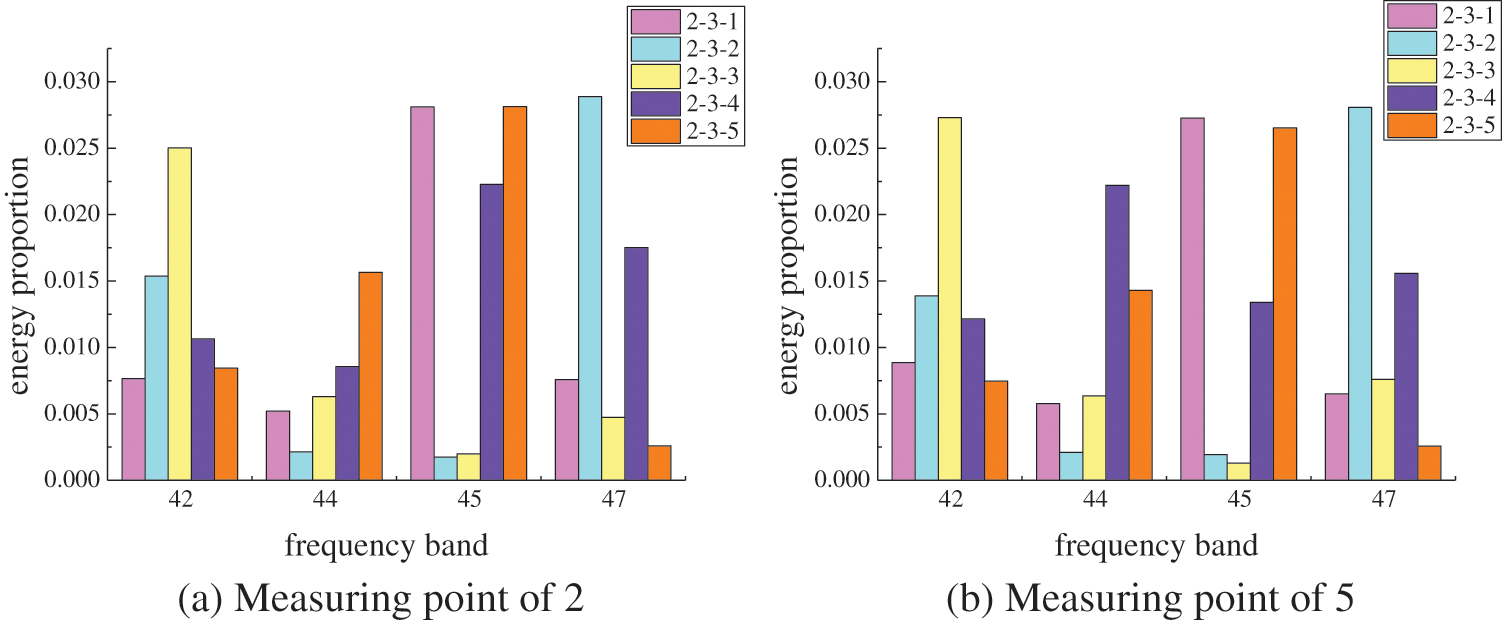
Figure 14: Wavelet packet energy ratio of each test point in group 2-3
Compared with the frequency bands of the specimens in group 1-1, the frequency band of the UHPC group is greater than that of the ordinary concrete group because UHPC can increase the propagation speed of stress waves and increase the frequency band of the wavelet packet energy in the concrete, greatly affecting the detection of grouting defects in the sleeve. Moreover, the frequency band will shift greatly if the steel sleeve is not grouted, so the frequency bands of measuring point 2 and measuring point 5 of the specimen with 50% grouting fullness are different, so that sleeves with 50% grouting fullness can be distinguished. We still find that the frequency band of the specimen with 0% grouting fullness is the lowest band in the band range.
Fig. 15 illustrates the specimens in group 2-4, showcasing the frequency bands with high energy ratios ranging from 37 to 40. The energy ratio of specimen 2-4-1 is mainly concentrated in frequency band 45, and the energy values at measuring points 2 and 5 are 0.0265 and 0.0270, respectively. The energy ratio of specimen 2-4-2 is mainly concentrated in frequency band 37, and the energy values of measuring points 2 and 5 are 0.0258 and 0.0257, respectively. The energy ratio of measuring point 2 of specimen 2-4-3 is concentrated in frequency band 39, with an energy value of 0.0283, and the energy ratio of measuring point 5 is concentrated in frequency band 38, with an energy value of 0.0263. The energy ratio of specimen 2-4-4 is mainly concentrated in frequency band 39, with energy ratio values of 0.0284 at measuring points 2 and 5.
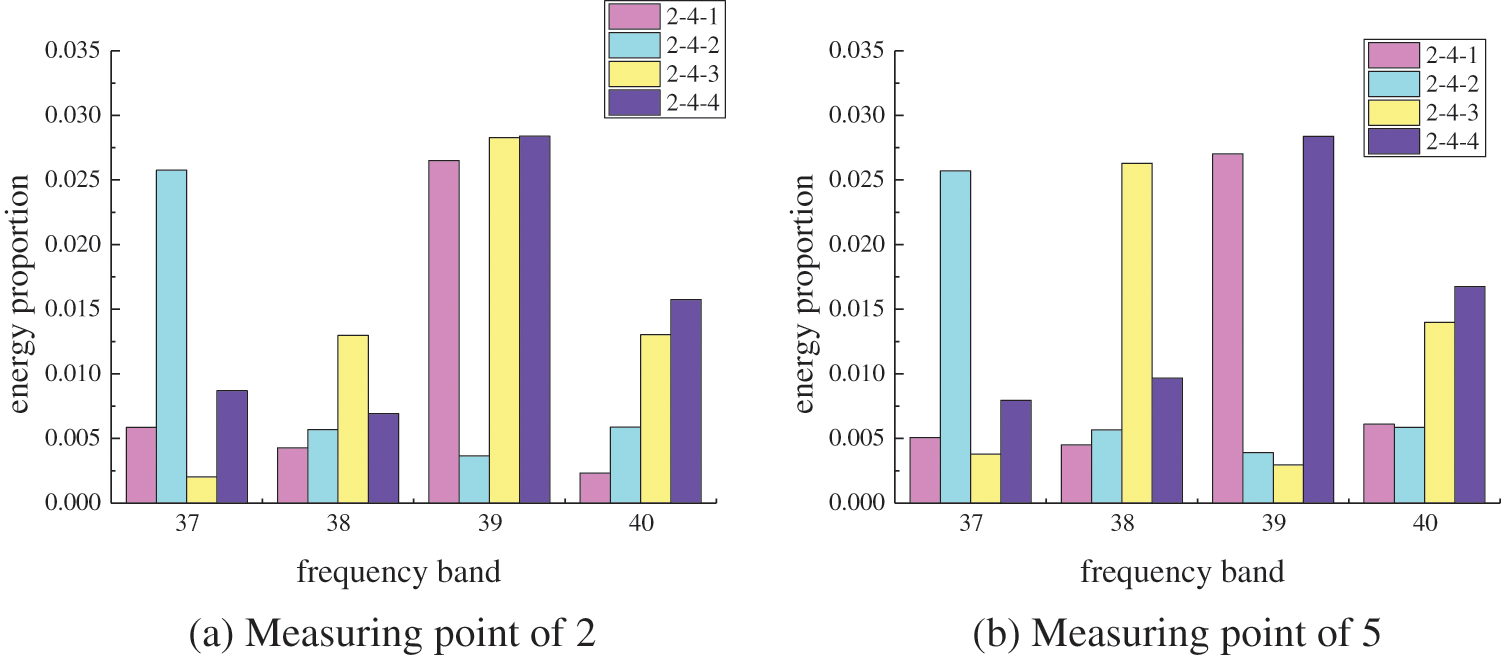
Figure 15: Wavelet packet energy ratio of each test point in group 2-4
Compared with the frequency band of specimens in group 1-1, due to the plastic characteristics of the GFRP connecting bar, the wavelet packet energy ratio frequency band of the GFRP connecting bar group is reduced. The frequency band of the wavelet packet energy ratio will be greatly shifted if the steel sleeve is not grouted so that sleeves with 50% grouting and 100% grouting can be distinguished.
In summary, the following conclusions are drawn from the analysis:
(1) Different material properties have different effects on wavelet packet energy analysis, while different sleeve materials have little effect on the wavelet packet energy frequency band. The application of PP fiber grouting material and GFRP connecting bars decreases the energy proportional frequency band of the wavelet packet, and the application of ultrahigh performance concrete increases the energy frequency band of the wavelet packet.
(2) The application of PP fiber grouting material deepens the influence of defective specimens on the frequency band, which makes the frequency bands of sleeves with 50% and 100% grouting fullness different, which makes it possible to distinguish between them.
(3) Wavelet packet energy analysis is more sensitive for detecting defects in specimens with UHPC and GFRP connecting bars. The application of these materials causes the frequency band of the wavelet packet energy ratio to greatly shift if the steel sleeve is not grouted, so the frequency bands of measuring point 2 and measuring point 5 of the specimen with 50% grouting fullness differ. This phenomenon makes it possible to identify 50% grouting fullness.
4.3 Influence of the Layout of Surrounding Steel Bars
By comparing the wavelet packet energy ratios of specimens in group 3-X with those of specimens in group 1-1, the influence of the layouts of steel bars around the sleeve on the wavelet packet energy analysis is analyzed.
Fig. 16 illustrates the specimens in group 3-1, showcasing the frequency bands with high energy ratios ranging from 38 to 41. The energy ratio of specimen 3-1-1 is mainly concentrated in frequency band 38, and the energy values of measuring points 2 and 5 are both 0.0292. The energy ratio of specimen 3-1-2 is mainly concentrated in frequency band 39, and the energy values at measuring points 2 and 5 are 0.0299 and 0.0292, respectively. The energy ratio of specimen 3-1-3 is mainly concentrated in frequency band 39, and the energy ratio values of measuring points 2 and 5 are 0.0285 and 0.0272, respectively.
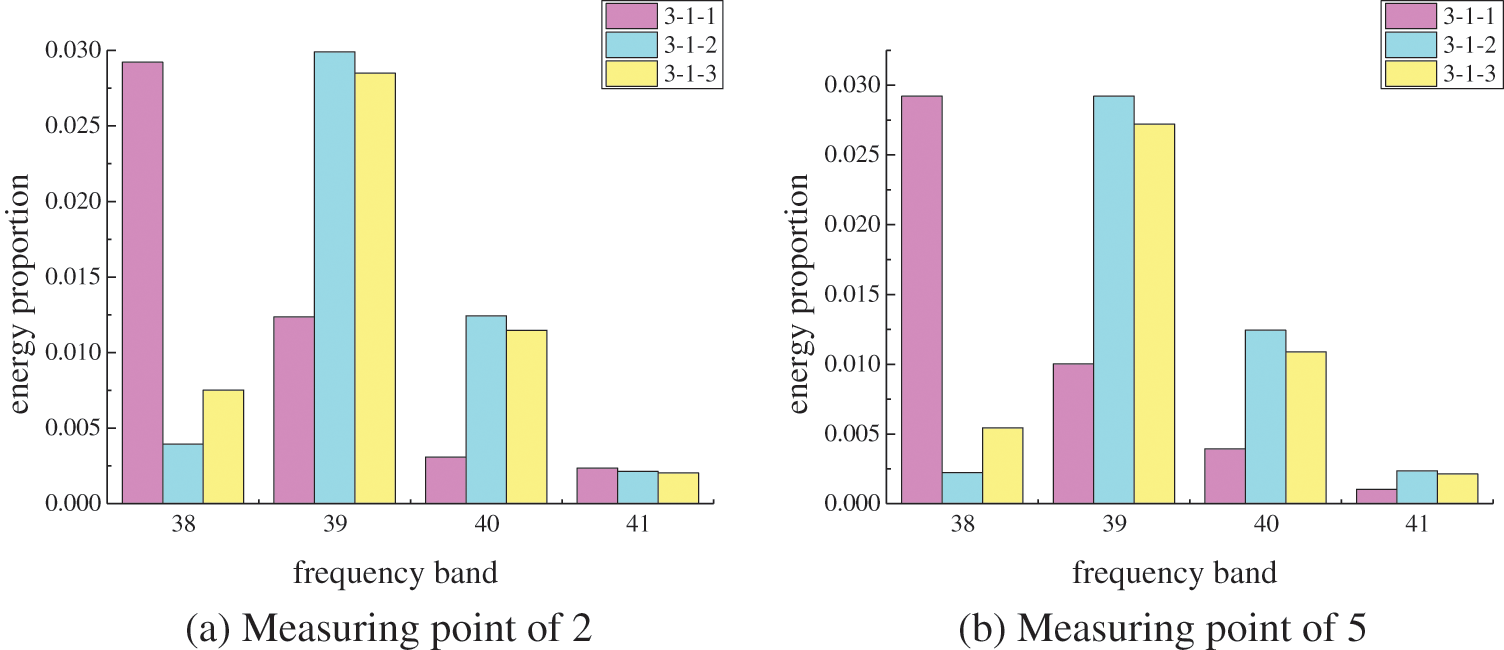
Figure 16: Wavelet packet energy ratio of each test point in group 3-1
Compared with the wavelet packet energy ratio of specimens in group 1-1, the symmetric steel bars on the two sides slightly increase the wavelet packet energy ratio value. However, the frequency bands of specimens with 0%, 50%, and 100% grouting fullness are the same as those of the specimens in group 1-1.
Fig. 17 illustrates the specimens in group 3-2, showcasing the frequency bands with high energy ratios ranging from 38 to 41. The energy ratio of specimen 3-2-1 is mainly concentrated in the infrequency band 38, and the energy values of measuring points 2 and 5 are 0.0242 and 0.0245, respectively. The energy ratio of specimen 3-2-2 is mainly concentrated in frequency band 39, and the energy values at measuring points 2 and 5 are 0.0272 and 0.0292, respectively. The energy ratio of specimen 3-2-3 is mainly concentrated in frequency band 39, and the energy values of measuring points 2 and 5 are 0.0256 and 0.0272, respectively.
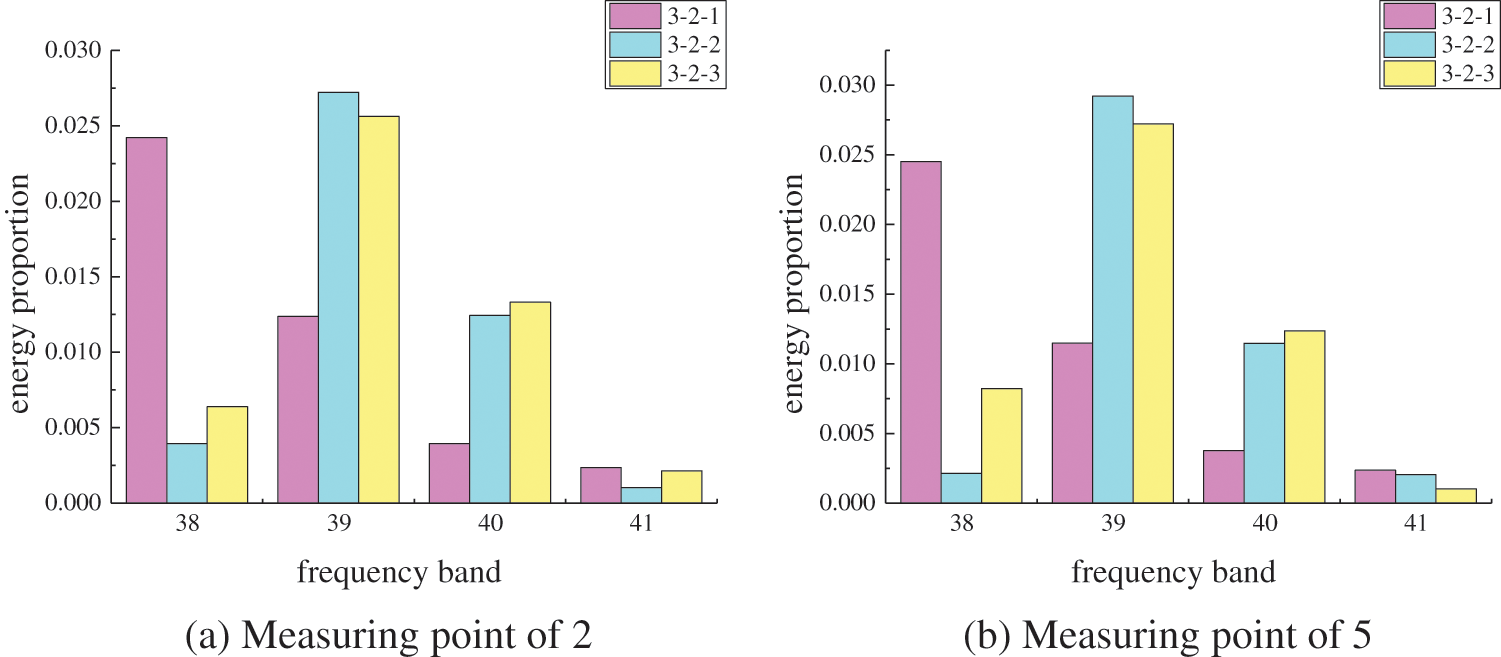
Figure 17: Wavelet packet energy ratio of each test point in group 3-2
Compared with the wavelet packet energy ratio of specimens in group 1-1, it can be seen that steel bars set on the offset side slightly improve the energy ratio of the wavelet packet but slightly reduce the energy ratio of specimens in group 3-1. However, the frequency bands of the specimens with 0%, 50%, and 100% grouting fullness do not change.
In summary, it can be seen from the analysis that laying steel bars around a sleeve increases the energy ratio of the wavelet packet, and the increase in the energy ratio is related to the number of steel bars laid around the sleeve. The more steel bars that lay around, the more likely the energy ratio is to increase. However, this increase will not affect the detection of sleeve defects, and the frequency bands of the specimens with 0%, 50%, and 100% grouting fullness are the same as those of the specimens in group 1-1.
In this paper, the impact echo method and wavelet packet energy principle are comprehensively applied to study the influence of different defects, material characteristics, and the layout of surrounding steel bars on the detection of the grouting fullness of steel sleeves. The conclusions are as follows:
1. Through experiments, the application of the wavelet packet energy principle improves the ability of the impact echo method to judge whether there are defects in sleeves. The frequency band of the specimen with 0% grouting fullness is the lowest band in the band range, which makes it effective to detect sleeves with 0% grouting fullness. However, due to the limitations of this method, the frequency bands of the sleeve specimens with grouting plumpness of 50% and 100% are not regularly distinguished, that is, the sleeve specimens with grouting plumpness of 50% and 100% cannot be quantitatively identified. This means that we need to continue our research in this area to determine a more appropriate approach.
2. Defects in sleeve grouting will affect the distribution of signals obtained by impact echo detection in the wavelet packet energy frequency band, reducing the wavelet packet energy ratio and having different effects on the frequency band of the wavelet packet energy. In addition, there are great differences in the energy ratio frequency band of the sleeves under different grouting conditions.
3. Different material properties have different effects on the defect detection method of steel sleeves based on wavelet packet energy analysis. The material of the sleeve has little influence on the frequency band of the wavelet packet energy ratio value and does not affect the detection of defects. The application of PP fiber grouting material slightly reduces the frequency band of the wavelet packet energy ratio but does not affect the detection of defects. The UHPC can improve the propagation speed of stress waves and increase the frequency band of the wavelet packet energy, which is mainly concentrated in frequency bands 42 to 47, and wavelet packet energy analysis is more sensitive to the detection of sleeve defects in UHPC specimens. Because of the plastic properties of GFRP connecting bars, the frequency band of the wavelet packet energy ratio is reduced and is mainly concentrated in frequency bands 37 to 40. The wavelet packet energy analysis is more sensitive to the detection of sleeve defects using GFRP connecting bars. Because of their sensitivity, the frequency bands of measuring points of 2 and 5 of the specimens with 50% grouting fullness are different, so that sleeves with 50% grouting fullness can be distinguished.
4. The arrangement of steel bars around the sleeve will increase the frequency band of wavelet packet energy, and the increase of the frequency band of wavelet packet energy is related to the number of surrounding steel bars. The more the surrounding steel bars, the more the energy ratio band increases, but this does not affect the frequency band of the specimens with 0%, 50%, and 100% grouting plumpness compared with the specimens in group 1-1.
Acknowledgement: None.
Funding Statement: This work was supported by financial support from the National Natural Science Foundation of China (U1904177), the Excellent Youth Natural Science Foundation of Henan Province of China (212300410079), the Subproject of the Key Project of the National Development and Reform Commission of China (202203001), the Project of Young Key Teachers in Henan Province of China (2019GGJS01), and Horizontal Research Projects (20230352A).
Author Contributions: The authors confirm contribution to the paper as follows: study conception and design: Pu Zhang, Pinwu Guan; data collection: Xinyu Zhu, Wei Liu, Yanwei Guo, Haibo Wang; analysis and interpretation of results: Xinyu Zhu. Yingjun Li; draft manuscript preparation: Xinyu Zhu, Yingjun Li. All authors reviewed the results and approved the final version of the manuscript.
Availability of Data and Materials: Due to the nature of this research, participants of this study did not agree for their data to be shared publicly, so supporting data is not available.
Conflicts of Interest: The authors declare that they have no conflicts of interest to report regarding the present study.
References
1. Shi, J. J., Hu, G. F., Zhang, X. F., Zhang, H. J., Chen, W. H. et al. (2019). Application status of rebar splicing by grout-filled coupling sleeve of precast concrete building. Building Structure, 49(S2) (In Chinese). [Google Scholar]
2. Jian, W. C., Wang, Z. W., Liu, Z. Y., Ju, S. L. (2022). Experimental investigation of mechanical properties of steel half-grouted sleeve splice with rebar bonding defects. Journal of Building Engineering, 50, 104113. [Google Scholar]
3. Chen, M., Zhao, L., Li, P. J., Xu, S. Z., Zhang, P. et al. (2022). Experimental study on mechanical properties of polypropylene fiber grouting material and its rebar sleeve connection. Acta Materiae Compositae Sinica, 39(2), 685–694. [Google Scholar]
4. Tao, F., Hou, J. P., Zhu, Z. X., Meng, L. X., Sun, Z. H. et al. (2022). Experimental study on UHPC-based grouting materials and mechanical performance of grouted splice sleeve joints. Frontiers in Materials, 9, 912509. [Google Scholar]
5. Sayadi, A. A., Abd Rahman, A. B., Sayadi, A., Bahmani, M., Shahryari, L. (2015). Effective of elastic and inelastic zone on behavior of glass fiber reinforced polymer splice sleeve. Construction and Building Materials, 80, 38–47. [Google Scholar]
6. Garg, S., Misra, S. (2021). Efficiency of NDT techniques to detect voids in grouted post-tensioned concrete ducts. Nondestructive Testing and Evaluation, 36(4), 366–387. [Google Scholar]
7. Zang, W. X., Wang, J., Zhang, J. Y., Cao, Y. D., Qin, P. et al. (2020). Experimental study on post-fire performance of half grouted sleeve connection with construction defect. Construction & Building Materials, 244, 118165. [Google Scholar]
8. Lv, P. M., Wu, Y. W., Sun, N. B. (2017). Research on the ultrasonic nondestructive test technology of bonding strength for the steel bridge deck pavement layer. Journal of Zhengzhou University (Engineering Science), 38(5), 55–60 (In Chinese). [Google Scholar]
9. Cao, D., Pan, Z. F., Zhang, Z., Zeng, B. (2023). Experimental and numerical study on detection of sleeve grouting defect with impact-echo method. Structures, 52, 632–650. [Google Scholar]
10. Chen, C. J., Long, Z. L., Wang, Y. (2019). Ultrasonic detection method for grouted defects in grouted splice sleeve connector based on wavelet pack energy. Sensors, 19(7), 1642. [Google Scholar] [PubMed]
11. Xie, L. L., Liu, Q., Wang, X. Y., Yang, C. T. (2023). Experimental study on seismic performance of precast concrete shear walls with defective and repaired grouted sleeve. Structures, 57, 105071. [Google Scholar]
12. Li, Z. H., Zheng, L. L., Li, W., Huang, Y. (2021). Impulse noise processing for an offshore platform based on kurtosis detection and wavelet packet decomposition. Journal of Vibration and Shock, 40(6), 220–226+242. [Google Scholar]
13. Zhu, Y. W., Yan, Q. S., Lu, J. B. (2020). Fault diagnosis method for disc slitting machine based on wavelet packet transform and support vector machine. International Journal of Computer Integrated Manufacturing, 33(10–11), 1118–1128. [Google Scholar]
14. JG/T 408-2019 (2019). Cementitious grout for sleeve of rebar splicing. Beijing, China: Standards Press of China. [Google Scholar]
15. JGJ 355-2015 (2015). Technical specification for grout sleeve of rebars. Beijing, China: China Architecture & Building Press. [Google Scholar]
16. GB 50448-2015 (2015). Technical code for application of cementitious grout. Beijing, China: China Architecture & Building Press. [Google Scholar]
17. GB/T 17671-2021 (2021). Method of testing cements determination of strength. Beijing, China: China Standard Press. [Google Scholar]
18. JGJ1-2014 (2014). Technical specification for fabricated concrete structures. Beijing, China: China Architecture & Building Press. [Google Scholar]
19. 15G365-1 (2015). Precast concrete shear wall exterior wall panel. Beijing, China: China Planning Press. [Google Scholar]
20. 15G365-2 (2015). Precast concrete shear wall panel. Beijing, China: China Planning Press. [Google Scholar]
21. Liu, Y. L., Shi, J. J., Huang, J. Q., Guang, S., Wu, Z. X. (2019). Grouting defect detection of lapped bar connections based on impact-echo method. Shock & Vibration, 2019, 1–14. [Google Scholar]
Cite This Article
 Copyright © 2024 The Author(s). Published by Tech Science Press.
This work is licensed under a Creative Commons Attribution 4.0 International License , which permits unrestricted use, distribution, and reproduction in any medium, provided the original work is properly cited.
 Downloads
 Citation Tools