
 Submit a Paper
 Propose a Special lssue
 Open Access
ARTICLE

A Deep Learning Estimation Method for Temperature-Induced Girder End Displacements of Suspension Bridges
1 School of Transportation, Southeast University, Nanjing, 210096, China
2 Department of Engineering, Guangzhou Expressway Operation Management Co., Ltd., Guangzhou, 510000, China
3 Department of Engineering, CCCC Highway Bridge National Engineering Research Center Co., Ltd., Beijing, 100088, China
4 Department of Engineering, Jiangsu Provincial Transportation Engineering Construction Bureau, Nanjing, 210004, China
* Corresponding Author: Xiang Xu. Email:
(This article belongs to the Special Issue: Advanced Data Mining in Bridge Structural Health Monitoring)
Structural Durability & Health Monitoring 2025, 19(2), 307-325. https://doi.org/10.32604/sdhm.2024.055265
Received 21 June 2024; Accepted 16 August 2024; Issue published 15 January 2025
 View Full Text
 Download PDF
Abstract
To improve the accuracy of thermal response estimation and overcome the limitations of the linear regression model and Artificial Neural Network (ANN) model, this study introduces a deep learning estimation method specifically based on the Long Short-Term Memory (LSTM) network, to predict temperature-induced girder end displacements of the Dasha Waterway Bridge, a suspension bridge in China. First, to enhance data quality and select target sensors, preprocessing based on the sigma rule and nearest neighbor interpolation is applied to the raw data. Furthermore, to eliminate the high-frequency components from the displacement signal, the wavelet transform is conducted. Subsequently, the linear regression model and ANN model are established, whose results do not meet the requirements and fail to address the time lag effect between temperature and displacements. The study proceeds to develop the LSTM network model and determine the optimal parameters through hyperparameter sensitivity analysis. Finally, the results of the LSTM network model are discussed by a comparative analysis against the linear regression model and ANN model, which indicates a higher accuracy in predicting temperature-induced girder end displacements and the ability to mitigate the time-lag effect. To be more specific, in comparison between the linear regression model and LSTM network, the mean square error decreases from 6.5937 to 1.6808 and R2 increases from 0.683 to 0.930, which corresponds to a 74.51% decrease in MSE and a 36.14% improvement in R2. Compared to ANN, with an MSE of 4.6371 and an R2 of 0.807, LSTM shows a decrease in MSE of 63.75% and an increase in R2 of 13.23%, demonstrating a significant enhancement in predictive performance.Keywords
Nomenclature
| | Discrete wavelet transform coefficient |
| | Discrete sequence |
| | Wavelet function |
| | Scaling coefficient |
| | Shifting coefficient |
| | Approximation signal |
| | Detail signal |
| | Approximation coefficient |
| | Detail coefficient |
| | Scaling function |
| | Wavelet basis function |
Due to the longitudinal girder motion, suspension bridges are particularly vulnerable to damages of girder end restraints, even leading to functional failure of the signature bridge [1,2]. Owing to the flexibility of long-span suspension bridges, the longer the bridge, the more serious the damage [3]. For instance, the Runyang Suspension Bridge, soon after its opening in 2005, underwent unfavorable longitudinal girder motion, leading to unexpected damages of bearings [4]. Due to the premature failure of expansion joints in 2003, the replacement action was taken within the subsequent three years for Jiangyin Yangtze River Bridge, as the result of excessive cumulative girder end displacements [5]. Therefore, studying the girder end displacement of suspension bridges holds considerable engineering significance.
In general, suspension bridges are exposed to temperature actions and other loads induced by traffics, winds, and ambient excitations, resulting in the motion of the girder end [6,7]. Among these factors, temperature is one of the significant contributors to the girder end displacement [8]. Xia et al. [9] proposed a Gaussian process metamodel-based model updating method to determine the optimal longitudinal boundary stiffness by using field measured temperature and displacement data, which showed that the longitudinal displacements using the updated model were in good agreement with the measurements. However, this approach excessively simplifies the bridge deck to a simple beam, inevitably introducing calculation errors. Li et al. [10] established a data-driven method based on the XGBoost model for quantifying the effect between temperature and girder end displacements, which demonstrated their negative relationship. However, under the circumstances, it did not specify the numerical relationship of temperature and girder end displacements. Chen et al. [11] established a finite element model to simulate the thermal effect and thermal-induced longitudinal girder end displacement, which was well aligned with the field measured data. On this occasion, the thermal effect of concrete was ignored, which might also introduce calculation errors. Ma et al. [12] introduced a technique that utilized radar and accelerometers to estimate the vertical displacement, addressing the issue of estimating obscured radar targets. Furthermore, a two-stage fusion technique based on the Finite Impulse Response filter was presented to estimate high-sampled structural displacements with high-sampled acceleration and low-sampled displacement data [13]. Xu et al. [14] analyzed the linear relationship between girder end displacements and temperatures and proposed a statistical method to predict the variation ranges of thermal-induced girder end displacements. Nevertheless, the aforementioned study did not discuss the non-linear temperature-displacement relationship, making it difficult to accurately predict temperature-induced displacements. Deng et al. [15] developed a sixth-order polynomial regression model to eliminate the temperature effect from girder end displacements, which demonstrated that the proposed method could effectively eliminate temperature complications from the time and frequency domain. Since the high-order model is sensitive to outliers, the proposed method will be influenced by insufficient data or poor data quality, e.g., data noise and outliers. Furthermore, the time-lag effect between temperature and temperature-induced girder end displacements can make the results of the prediction model deviate from the ground truth [16–19]. In this regard, further investigations regarding the temperature and girder end displacement are highly desired by using cutting-edge techniques.
Deep learning network is a multi-layer neural network structure that surpasses conventional machine learning methods by efficiently extracting data features and enhancing the capability to process variability and thus can be widely applied to real-world engineering challenges [20–22]. The Long Short-Term Memory (LSTM) network, a specialized neural network of deep learning, exhibits an outstanding ability in processing time series data in the domain of bridge engineering [23–27]. Wang et al. [28] and Qin et al. [29] utilized temperature and deflection data from a suspension bridge to train LSTM networks, predicting and filtering temperature-induced deflection components. Based on monitored temperature and deflection data, Yue et al. [30] constructed an LSTM-based digital model to predict thermal-induced deflection, which effectively eliminated the time lag effect between temperature and its induced deflection and greatly reduced the prediction error. Zhao et al. [31] developed an LSTM network model to predict temperature-induced strains, which showed that the model was able to capture most of the linear and non-linear features of the strain data. In addition, Huang et al. [32] developed a deep convolutional neural network LSTM to predict spatial-temporal nonlinear temperature-induced bearing displacement for a rigid frame bridge, achieving a more precise prediction model of temperature-induced bearing displacement. Due to its inherent capability to recognize time-dependent patterns [33], the LSTM network should be considered for predicting temperature-induced girder end displacements.
In this study, for the purpose of improving prediction accuracy and mitigating time-lag effect, the LSTM network, one of the deep learning networks, is built to predict temperature-induced girder end displacements for the Dasha Waterway Bridge, one of the suspension bridges constituting the Nansha Bridge and located in Guangdong Province, China. Initially, the basic information related to the bridge and its structural health monitoring system is introduced. Subsequently, the raw data for girder end displacement and temperature is processed and analyzed to handle data noise and outliers. Finally, with a comparative analysis against the linear regression model and Artificial Neural Network (ANN) model, the LSTM network is applied to predict temperature-induced girder end displacement of the suspension bridge, where the sensitivity of the hyperparameter is discussed.
2 Temperature and Displacement Data Analysis
The Nansha Bridge, a suspension bridge located in Guangdong Province, China, connects Guangzhou City with Dongguan City. The Nansha Bridge consists of two main bridges--the Dasha Waterway Bridge and the Nizhou Waterway Bridge. In this study, the field girder end displacement and temperature data are obtained from the Dasha Waterway Bridge, which has a main span of 1200 m.
Overall, the Dasha Waterway Bridge is equipted with 10 girder end displacement sensors and 10 temperature/humidity sensors. However, there are 6 girder end displacement sensors to monitor the deformation uniformity of expansion joints and only 4 temperature/humidity located inside the girder to monitor structural temperatures. Therefore, only 4 girder end displacement sensors and 4 temperature/humidity sensors can be considered for target sensor selection.
The sampling rate of girder end displacement sensors is 10 Hz, with 1 located at upstream of the Guangzhou side, 1 located at downstream of the Guangzhou side, 1 located at upstream of the Dongguan side, and 1 located at downstream of the Dongguan side. Their exact locations are shown in Figs. 1 and 2.
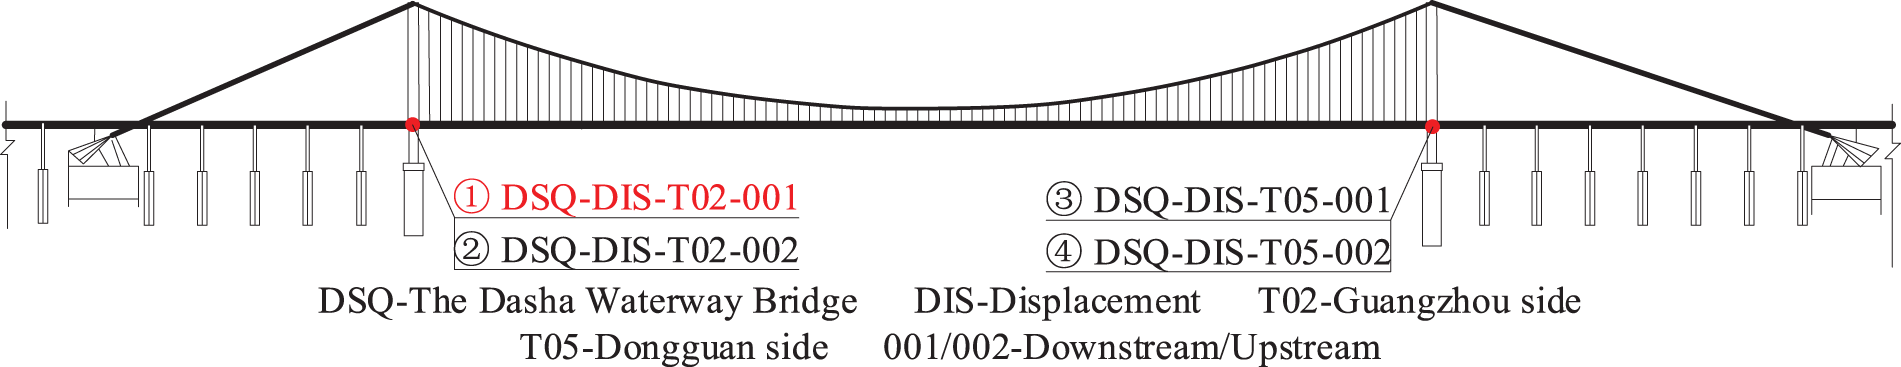
Figure 1: General arrangement of girder end displacements sensors
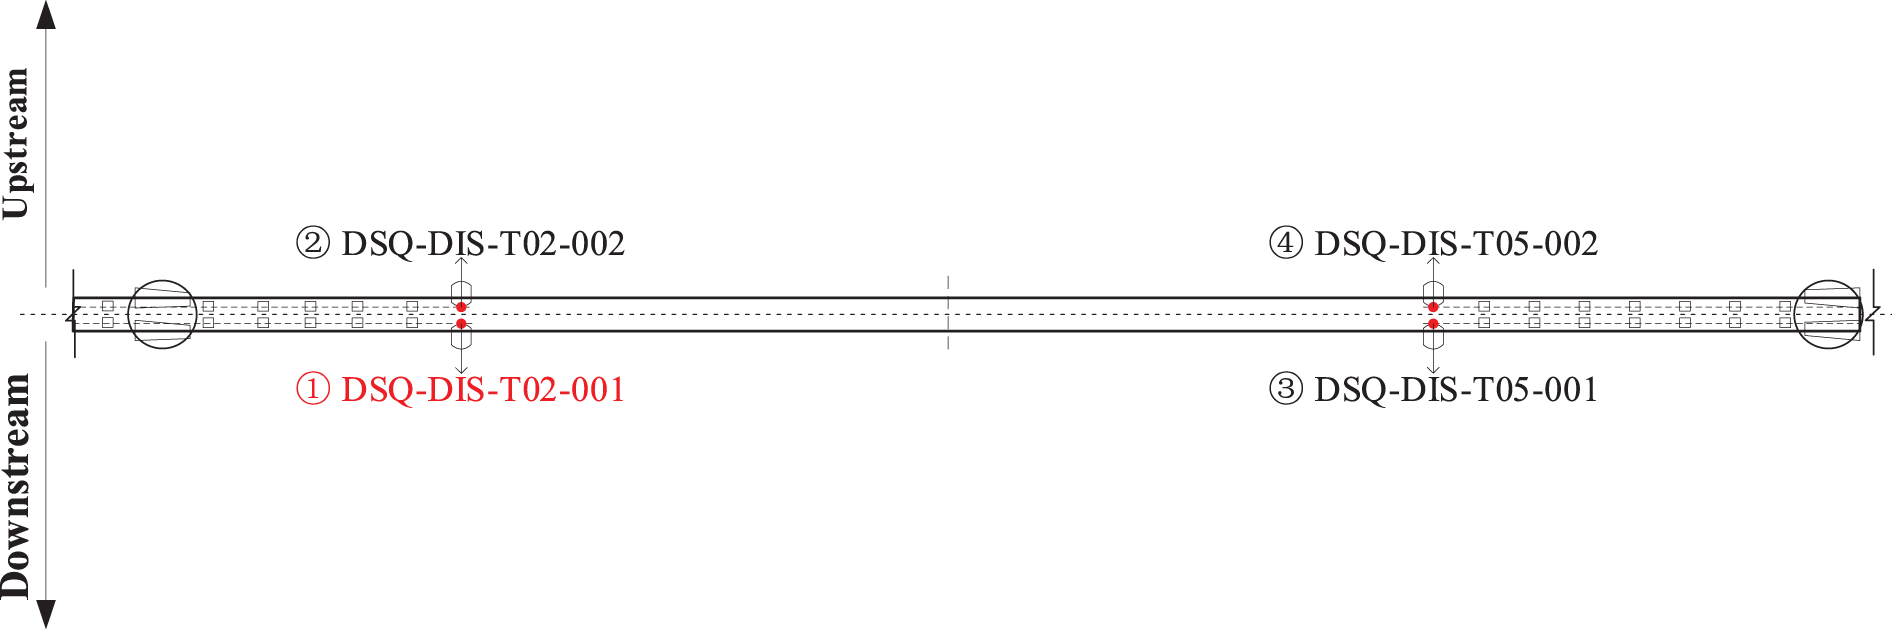
Figure 2: Detailed arrangement of girder end displacements sensors
The sampling frequency of temperature/humidity sensors is 10 Hz, with 1 located at one-fourth of the girder, 2 located at one-half of the girder, and 1 located at three-fourths of the girder. Similarly, their specific locations are shown in Figs. 3 and 4.
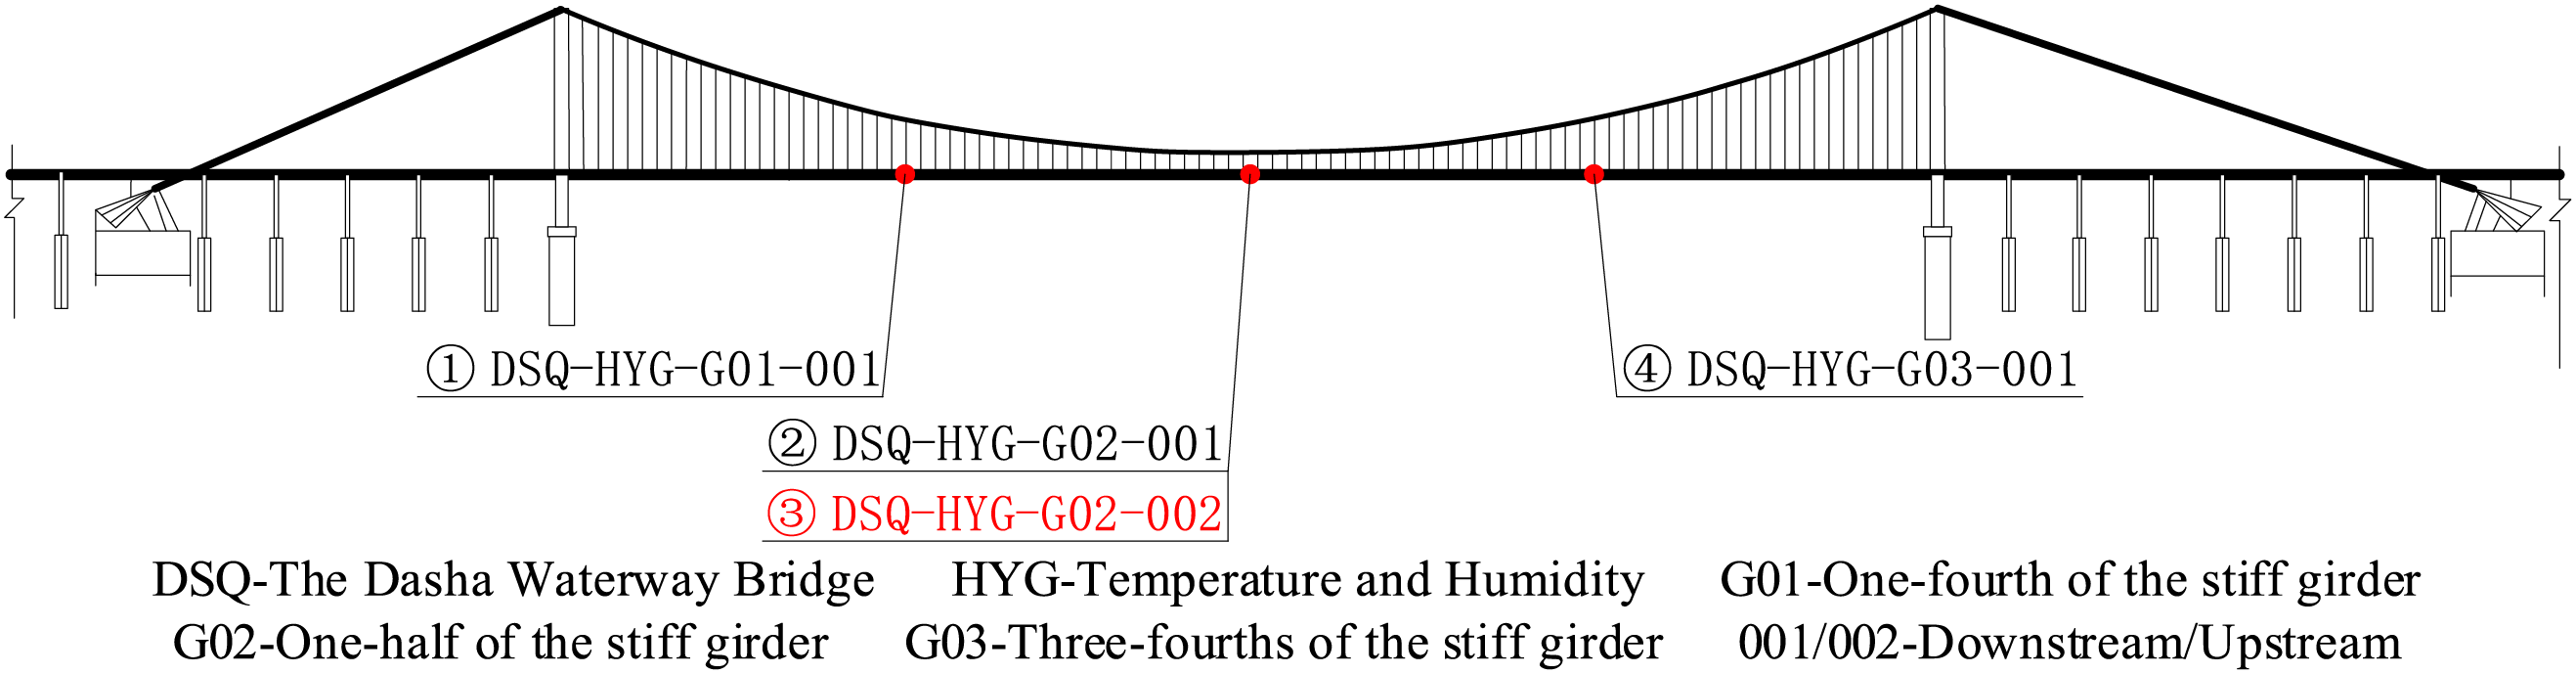
Figure 3: General arrangement of temperature sensors

Figure 4: Detailed arrangement of temperature sensors
In this study, the period of the monitoring data is from August 2020 to November 2022. In practical engineering, the temperature-induced structural response can be approximated by taking an average of 10 min or 1 h. Therefore, the raw data are downsampled by hourly mean.
Considering the practicality of data processing, this paper employs the sigma rule as a criterion for outlier detection. The girder end displacement data were computed using the 3-sigma rule, and the results of the anomaly rates and trends are shown in Table 1 and Fig. 5.
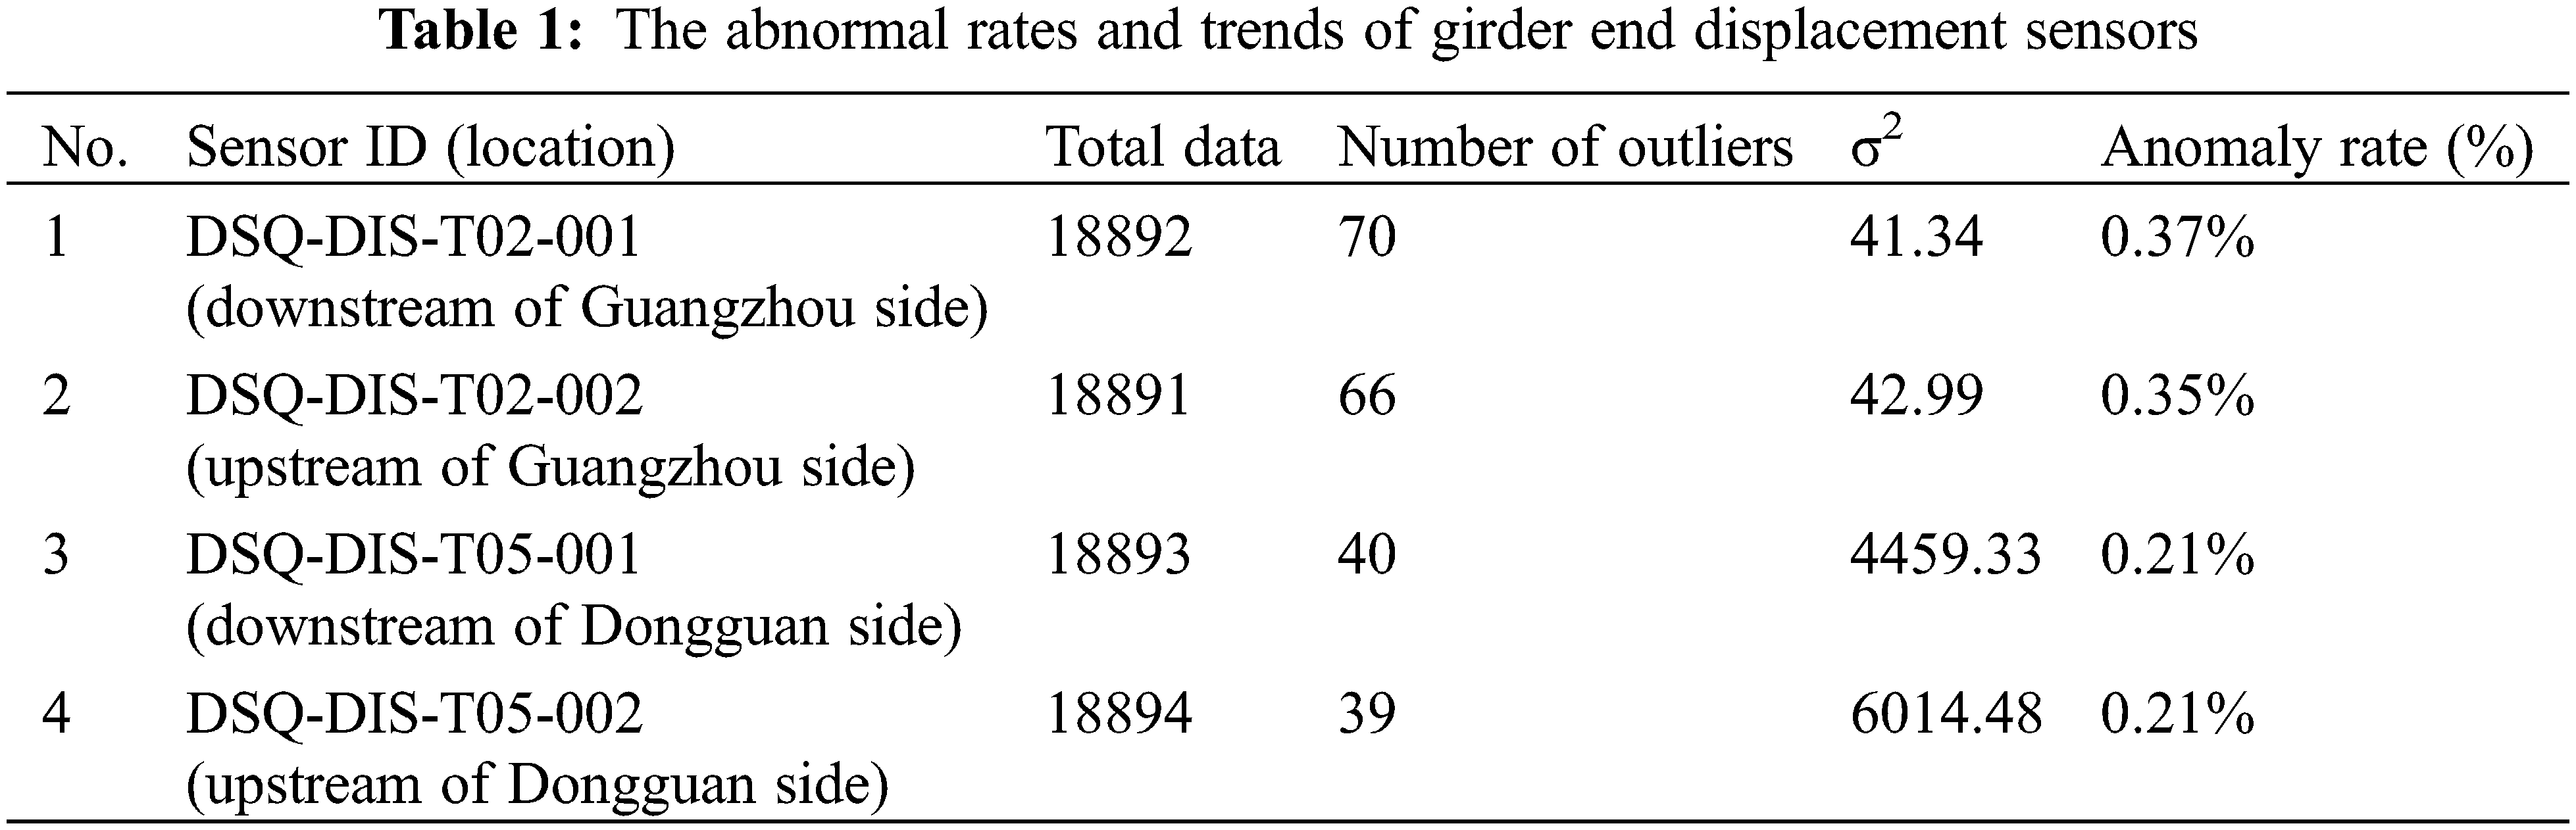
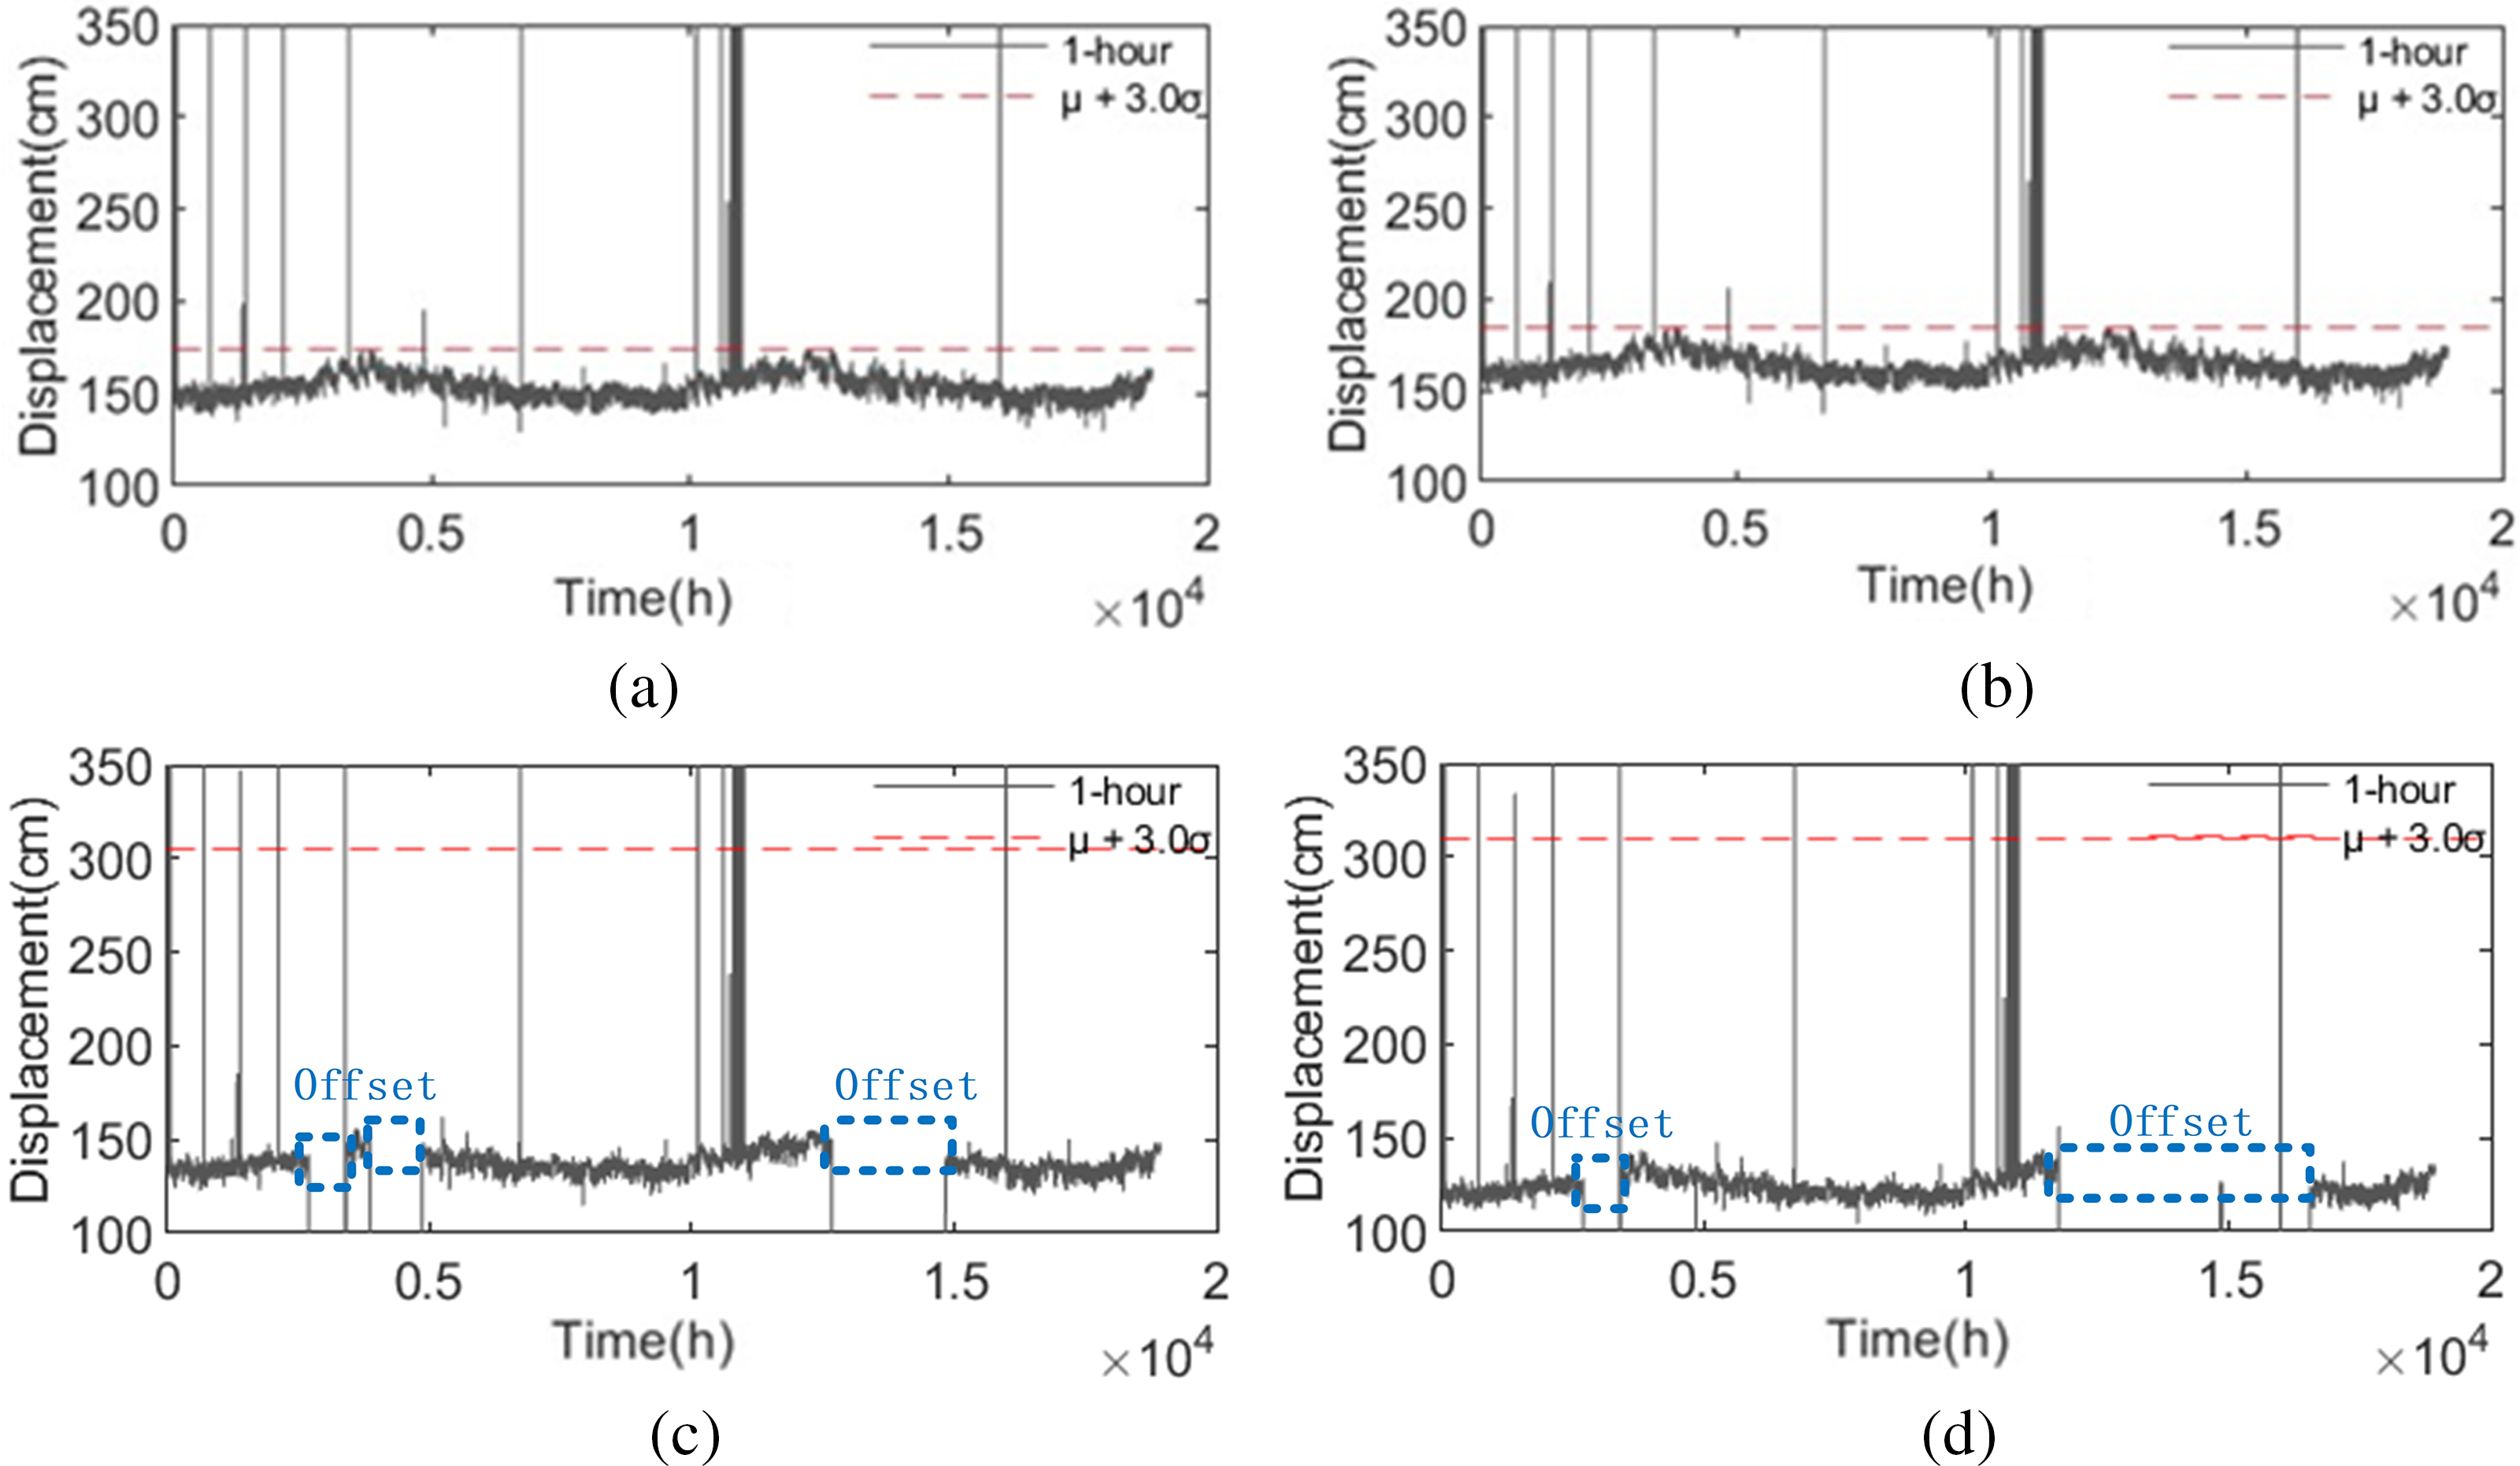
Figure 5: Raw data from girder end displacement sensors. (a) DSQ-DIS-T02-001. (b) DSQ-DIS-T02-002. (c) DSQ-DIS-T05-001. (d) DSQ-DIS-T05-002
According to Table 1 and Fig. 5, although the two sensors, which are located at downstream of the Dongguan side and upstream of the Dongguan side, have lower abnormal rates than the other two sensors, their σ2 are much higher and have significant offsets. Thus, sensors located at downstream of the Dongguan side and upstream of the Dongguan side are not considered in the following discussion. Then, comparing the downstream sensor with the upstream of the Guangzhou side, the difference in the abnormal rate is very small, about 0.02%, but the σ2 of the upstream sensor on the Guangzhou side is much larger than that of the downstream by 1.5, which indicates that the monitoring data from the upstream sensor of the Guangzhou side has a large dispersion. Therefore, DSQ-DIS-T02-001, the downstream sensor of the Guangzhou side is selected.
The temperature data were analyzed using the 2.5-sigma rule, and the results of the abnormal rates and trends are shown in Table 2 and Fig. 6.
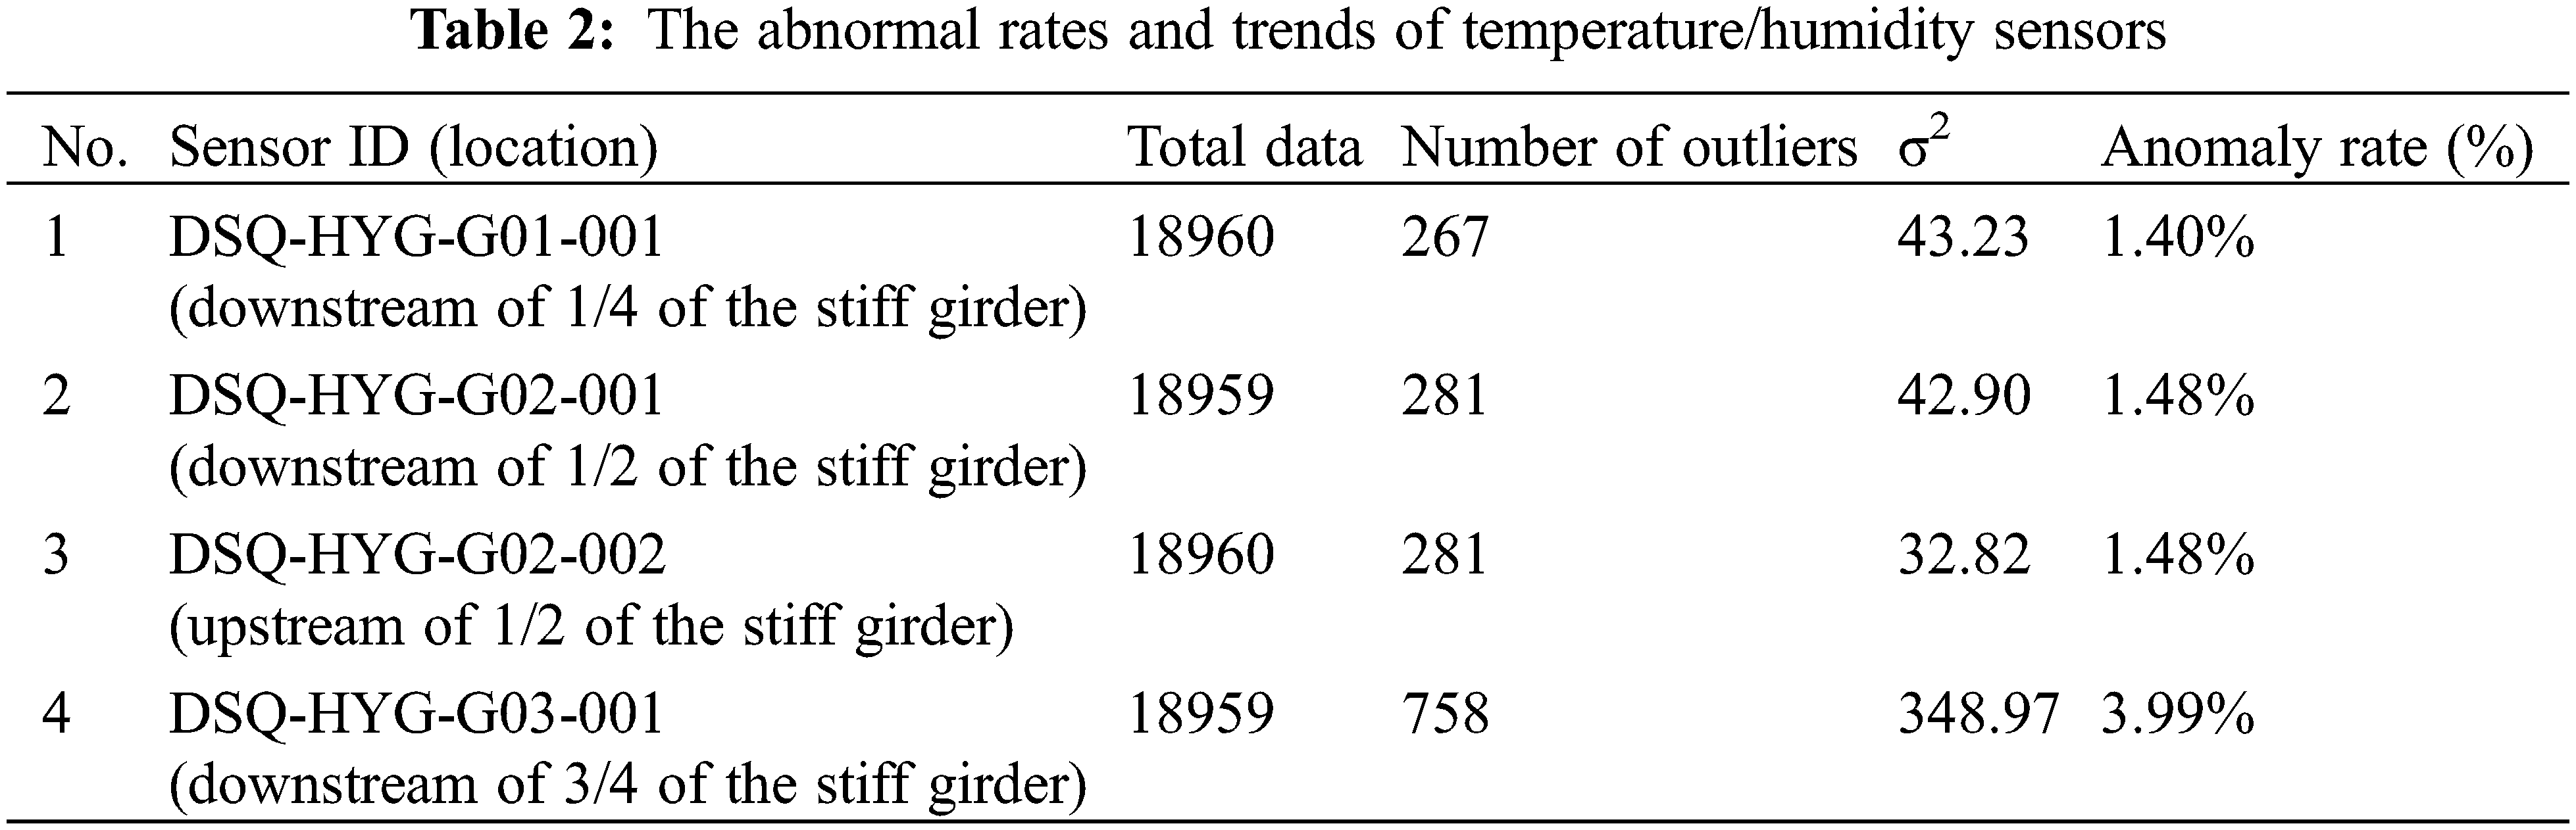

Figure 6: Raw data from temperature/humidity sensors. (a) DSQ-HYG-G01-001. (b) DSQ-HYG-G02-001. (c) DSQ-HYG-G02-002. (d) DSQ-HYG-G03-001
According to Table 2 and Fig. 6, the downstream sensor at 3/4 of the girder has a very large σ2 and a significant offset, so this sensor is not considered. Comparing the downstream sensor at 3/4 of the girder, the downstream sensor at 1/2 of the girder and the upstream sensor at 1/2, there is not much difference in the abnormal rate, which is about 0.08%. However, σ2 of the upstream sensor at 1/2 of the girder is smaller than those of the downstream sensor at 1/4 and downstream sensors at 1/2 by 10. Therefore, DSQ-HYG-G02-002, the downstream sensor at 1/2 of the girder is selected.
The target displacement sensor is DSQ-DIS-T02-001 (the downstream sensor of the Guangzhou side), and the target temperature/humidity sensor is DSQ-HYG-G02-002 (the downstream sensor at 1/2 of the girder), which are highlighted by the red sensor IDs in Figs. 2 and 4.
From Figs. 5 and 6, it can be observed that the downscaled data still has outliers, which can have a considerable effect on the accuracy of the model. In this study, outliers are handled through the sigma rule and nearest neighbor interpolation.
The outliers of the girder end displacement data are determined according to the 3-sigma rule, and the nearest neighbor interpolation method is used to deal with the missing data. After data preprocessing, the results are shown in Fig. 7. Comparing Figs. 5a and 7, there is no deviation from the obvious outliers after processing, and the variation trend of the displacement data is obvious. Hence, the outlier processing of displacement data using the 3-sigma rule is effective.

Figure 7: Preprocessed displacement data
The outliers of the temperature data are determined according to the 2.5-sigma rule, and the nearest neighbor interpolation method is used to fill the missing points. The preprocessed temperature data are shown in Fig. 8. Comparing Figs. 6c and 8, there is no deviation from the obvious outliers after processing, and the variation trend of the temperature data is obvious. Hence, the outlier processing of temperature data using the 2.5-sigma rule is effective.

Figure 8: Preprocessed temperature data
In order to check the details of the data quality, the girder end displacement and temperature data on 6 October 2020 are selected for analysis as shown in Fig. 9.

Figure 9: Data on 6 October 2020. (a) Displacement. (b) Temperature
Fig. 9 shows that the displacement and temperature data have significant periodicity with a period length of 24 h. In addition, the temperature data are smooth, which is shown in Fig. 9b, whilst the displacement data show significant local fluctuations due to the high-frequency loads, as shown in Fig. 9a. Therefore, further processing is required for the displacement data to obtain smooth displacement data for subsequent analyses.
2.4 Temperature-Displacement Correlation Discussions
In this study, the wavelet transform is used to process the displacement data in the time-frequency domain. This approach aims to eliminate the high-frequency components from the displacement signal, yielding a smooth displacement curve that aligns with the temperature curve.
Wavelet transform, developed from Fourier transform, has been successfully applied as a signal processing technique in numerous studies related to bridge structural health monitoring systems [34]. Besides, in the process of bridge data analysis, discrete wavelet transform (DWT) is more commonly used, which is given as [35]
where
The approximation signal
where
Since Coifet exhibits good stability in the process of discrete wavelet transform, this paper employs the discrete wavelet transform with the wavelet basis function of Coifet for smoothing the displacement data. Then, after extensive trial calculations with the monitoring data, the number of decomposition levels for the wavelet transform was finally determined to be eight with the high-frequency signals
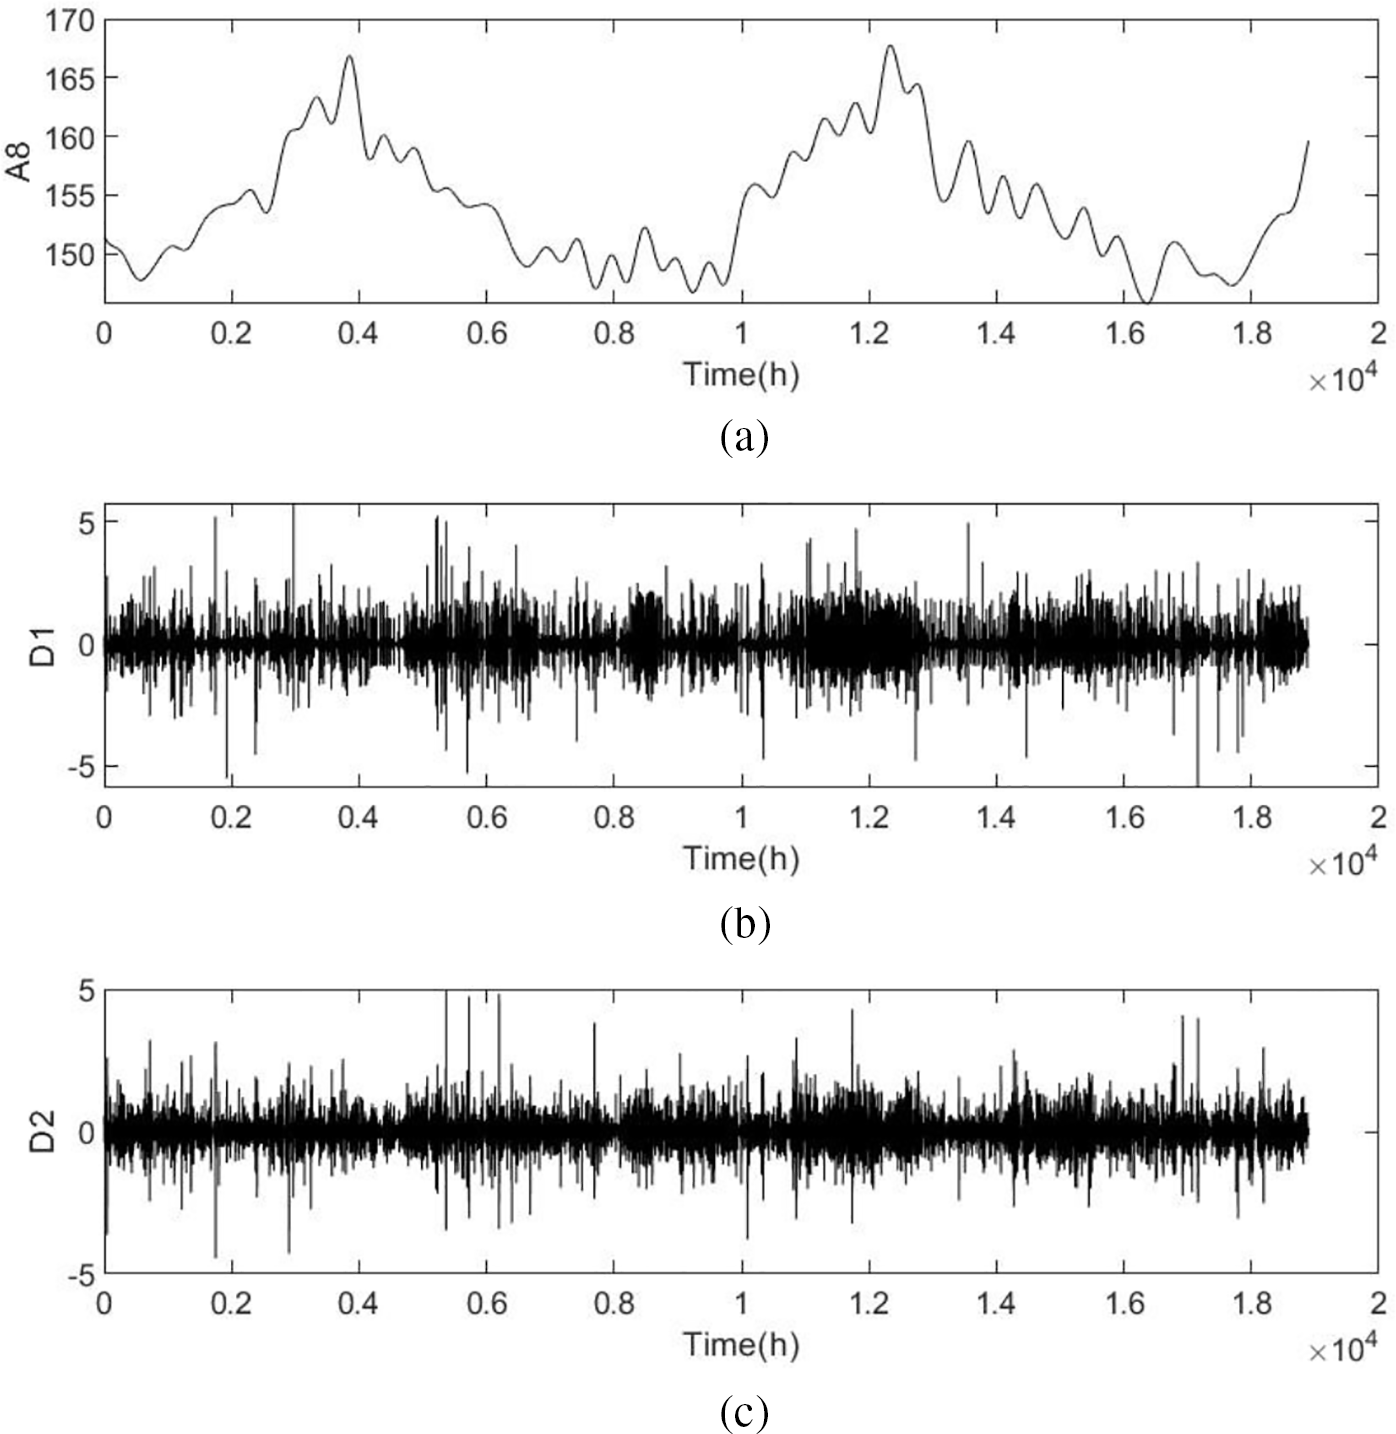
Figure 10: The signal components of DWT. (a)
Finally, by removing the first and second-order high-frequency components, the girder end displacement data after wavelet filter is obtained, as shown in Fig. 11.
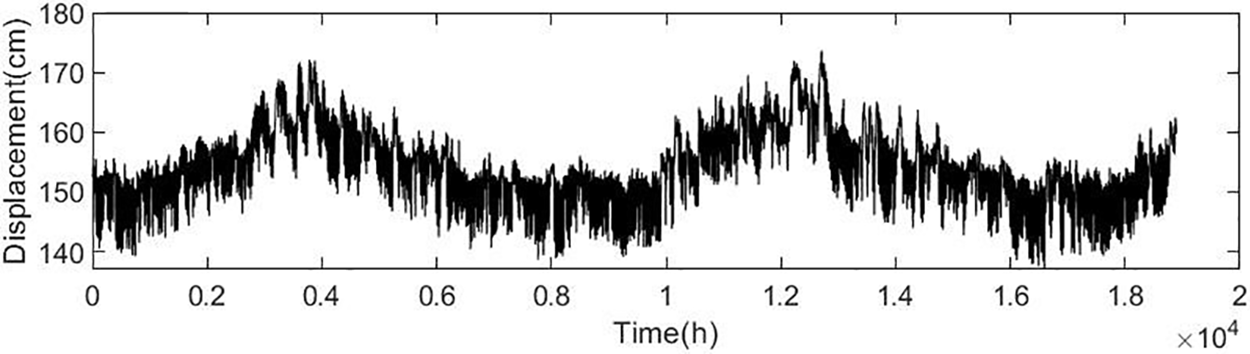
Figure 11: The girder end displacement data after wavelet separation
To evaluate the effectiveness of the DWT, Fig. 12 presents the temperature, hourly mean displacement, and wavelet-separated displacement curves on 6 October 2020. As shown in Fig. 12, compared to the hourly mean displacement curve, the wavelet-separated displacement curve is smoother and exhibits a significant negative correlation with the temperature trend. Hence, it can be concluded that the wavelet separation is effective.
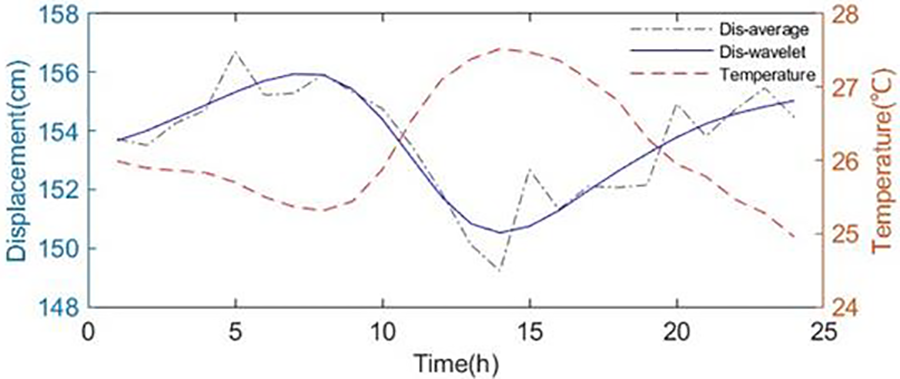
Figure 12: The data for 6 October 2020
Additionally, it is evident that there is a significant time-lag effect between the displacement and the temperature. The duration is random, making it difficult to eliminate. Therefore, it is necessary to develop a robust model that can effectively address the time-lag effect.
Linear regression is a common prediction method in engineering, and as a widely used mathematical and statistical method, it is often employed to analyze the quantitative relationship between two or more variables. 18,897-h girder end displacements and temperature samples after DWT processing are used as the database for the study, which is divided into training and testing sets with a ratio of 0.8:0.2. Linear fitting is performed using the training set data, with the results shown in Fig. 13a. The linear prediction model is then applied to predict the testing set, with the prediction results presented in Fig. 13b. The displacement-time curves of overall data, residuals of predicted and measured values, displacement-time curves of 25 h data, and time lag effect are respectively shown in Fig. 13c–f.
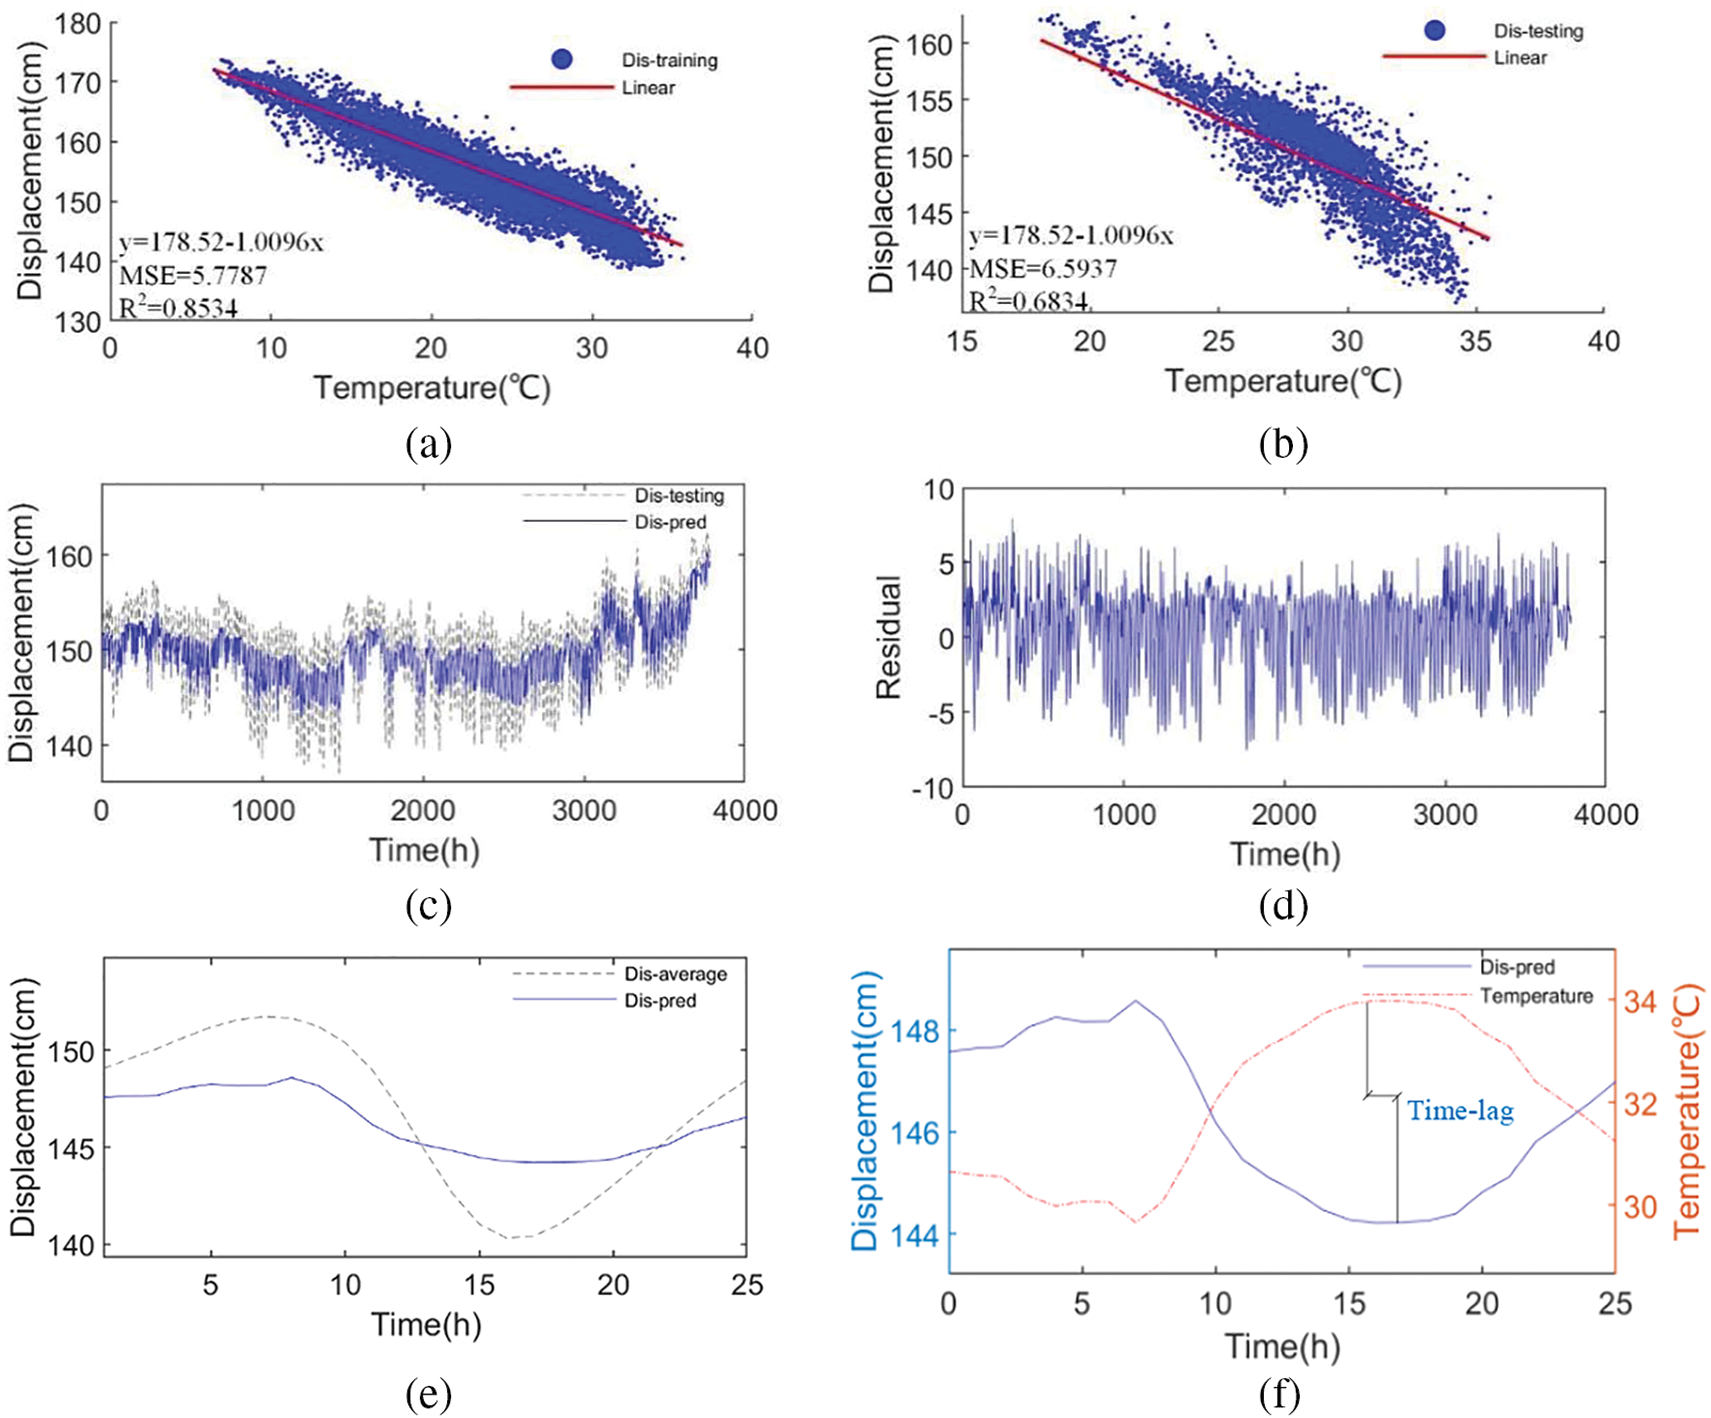
Figure 13: The results of the linear regression model. (a) Results of the training set. (b) Results of the testing set. (c) Displacement-time of overall data. (d) Residual. (e) Displacement-time of 25 h data. (f) Time lag
Eventually, the predicted linear equation is
3 Deep Learning Estimation Method
Artificial Neural Network (ANN), as a typical machine learning algorithm, has the ability to handle nonlinear problem and thus is widely employed in prediction problems [36]. Similarly, the ANN employs the entire dataset, which is divided into training, validation and testing sets at a ratio of 0.8:0.1:0.1. Similarly, the ANN model employs the processed 18,897-h girder end displacements and temperature data and its results are shown in Fig. 14.
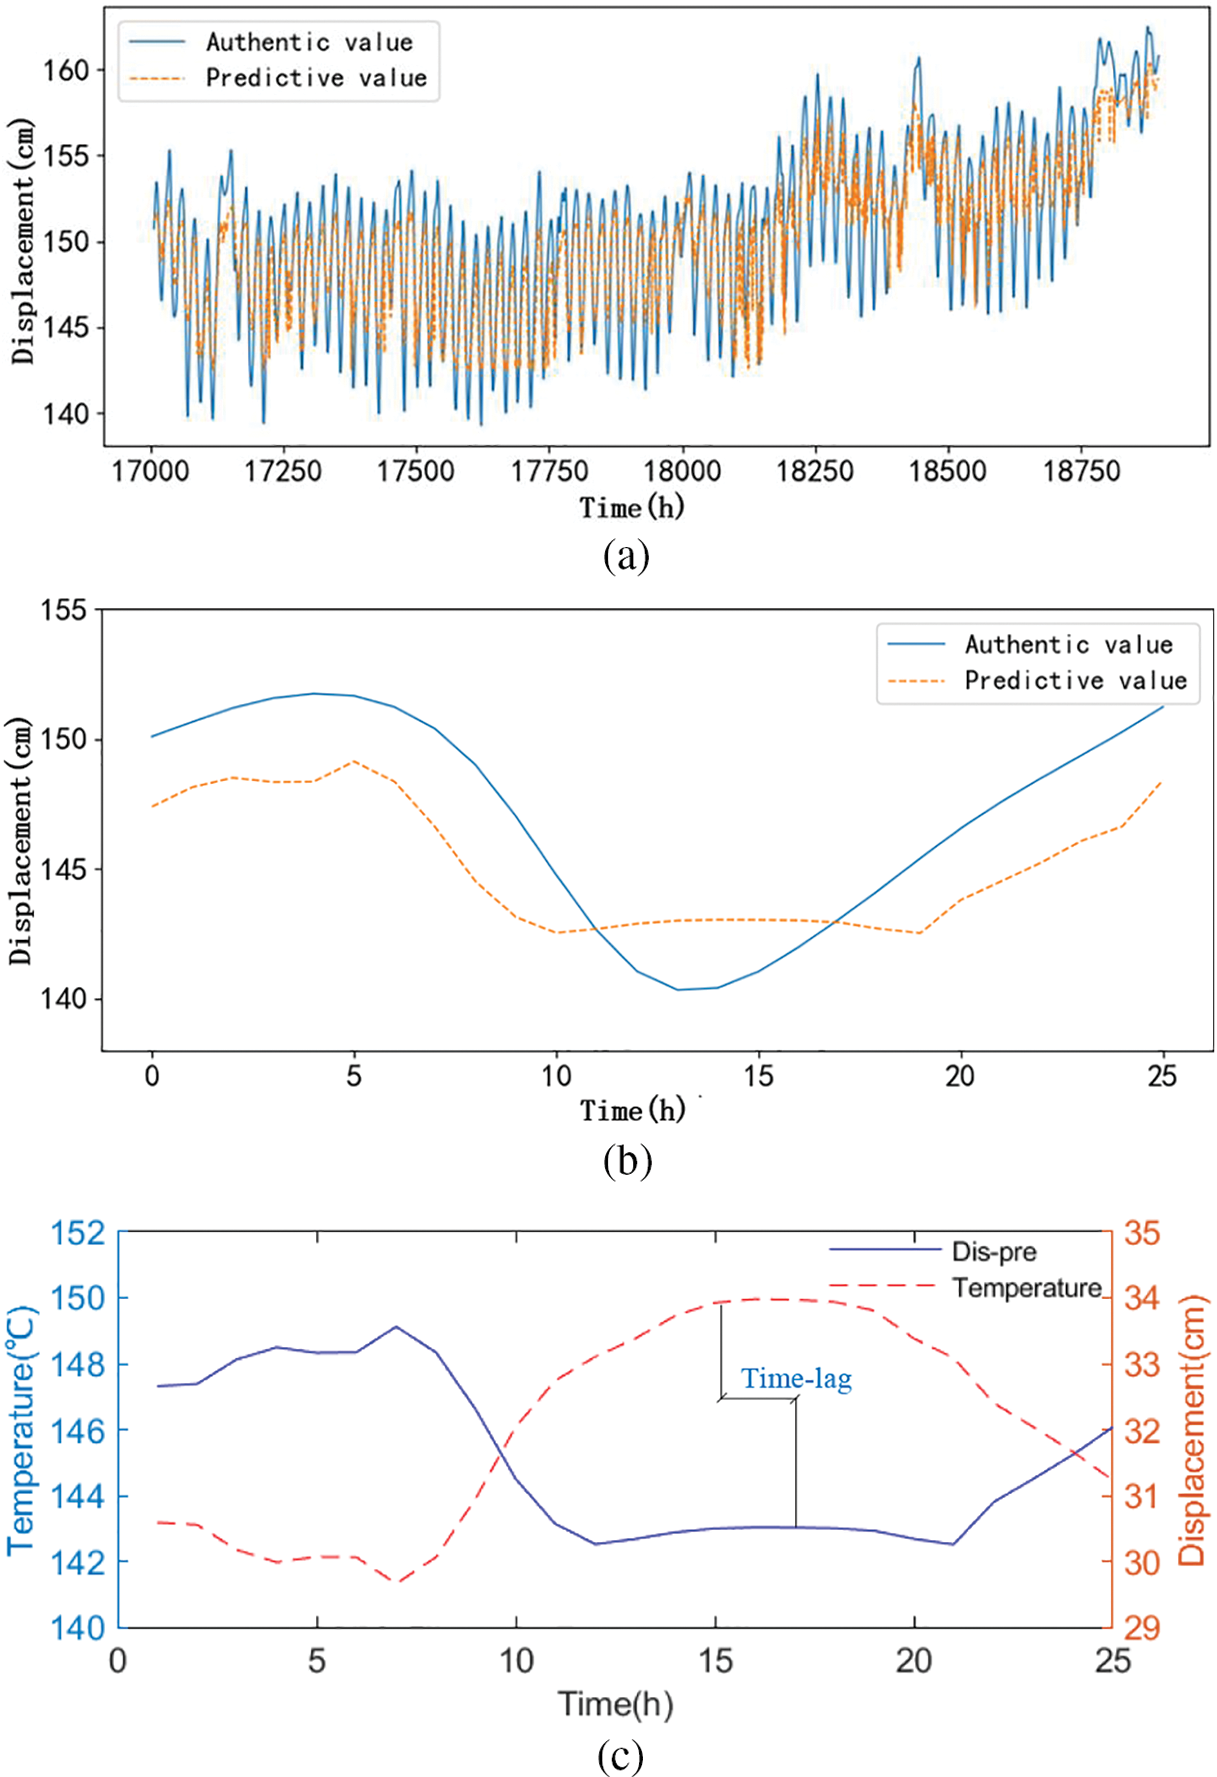
Figure 14: The results of the ANN network model. (a) Displacement-time of overall data. (b) Displacement-time of 25 h data. (c) Time lag
The MSE and R2 of the testing dataset are separately 4.6371 and 0.807. Fig. 14a,b separately shows the overall and 25 h results of the ANN network model, demonstrating that the model is capable of capturing nonlinear features, but its performance remains suboptimal. Fig. 14c illustrates that the ANN network model fails to reduce the time lag effect between temperature and displacements.
To improve the prediction accuracy of temperature-induced structural response, the LSTM network can be considered as an effective approach due to its inherent capability to recognize time-dependent patterns [37]. The LSTM network, initially proposed by Hochreiter and Schmidhuber, can address the long-term dependency and gradient vanishing problems caused by RNN when processing long sequence data [38]. Subsequently, the “forget gate” was introduced to the LSTM network, which allows its cells to reset at the appropriate time to free up memory and prevent the LSTM network from collapsing when the output is saturated [39]. The classic cell architecture of the LSTM network with multiple gate structures is shown in Fig. 15.
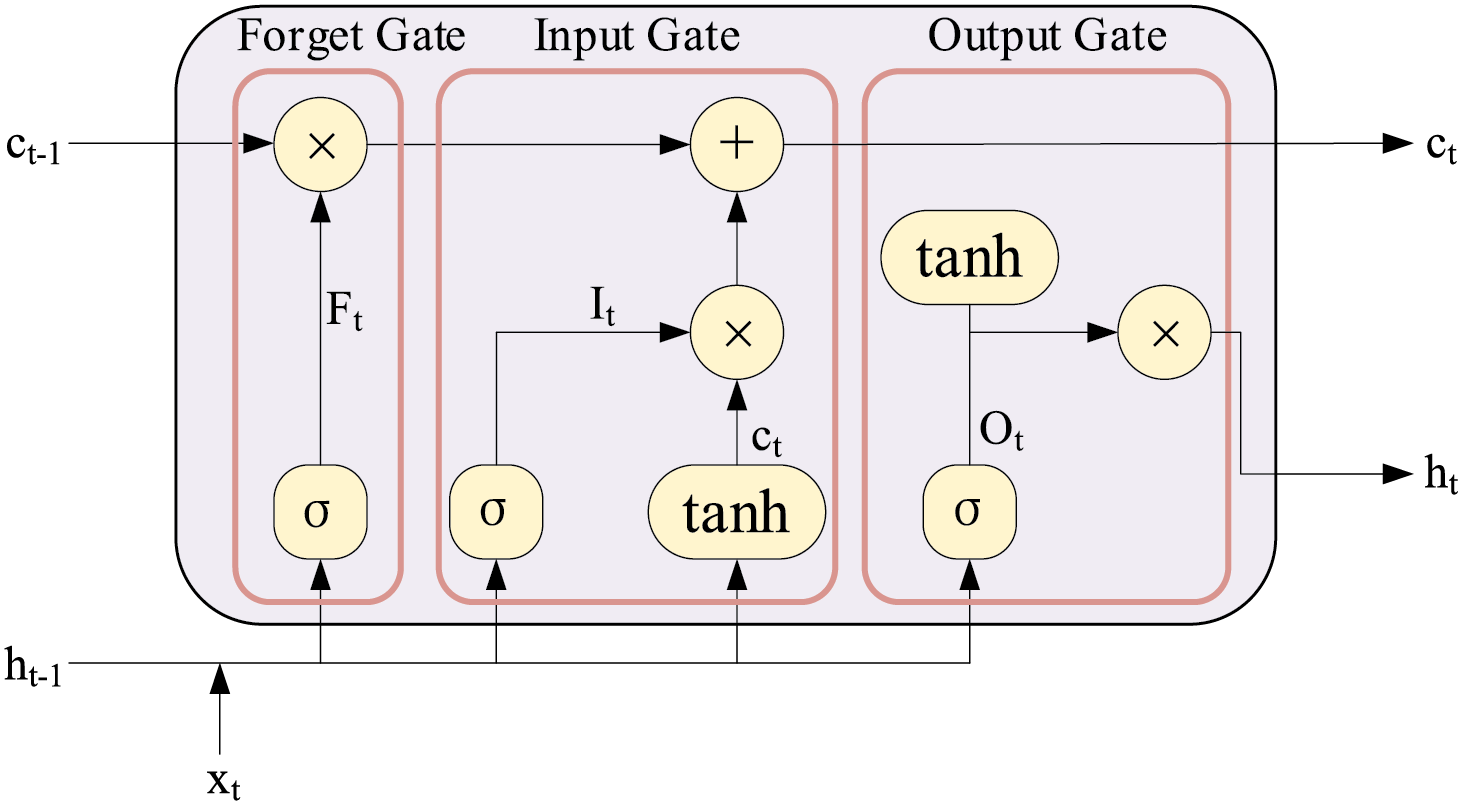
Figure 15: The line graph of girder end displacement sensors
As is shown in Fig. 15, first, the forget gate decides what information to discard, selectively forgetting the information from the cell state in the previous step. Then the input gate selectively records the new information into the cell state and updates it. Finally, the output gate determines which part consists of the output
3.3 Hyperparameter Sensitivity Analysis
In this paper, the ratio of the training, validation, and testing dataset is 0.8:0.1:0.1. To select the optimal parameters of the LSTM network, it is necessary to investigate the effects of data size, batch size, number of LSTM layers, number of neurons in the LSTM layer, and learning rate on the model.
A total of 18,897-h girder end displacements and temperature data are divided into five sizes to investigate the impact of data size on the performance of the LSTM network model, which is shown in Table 3.
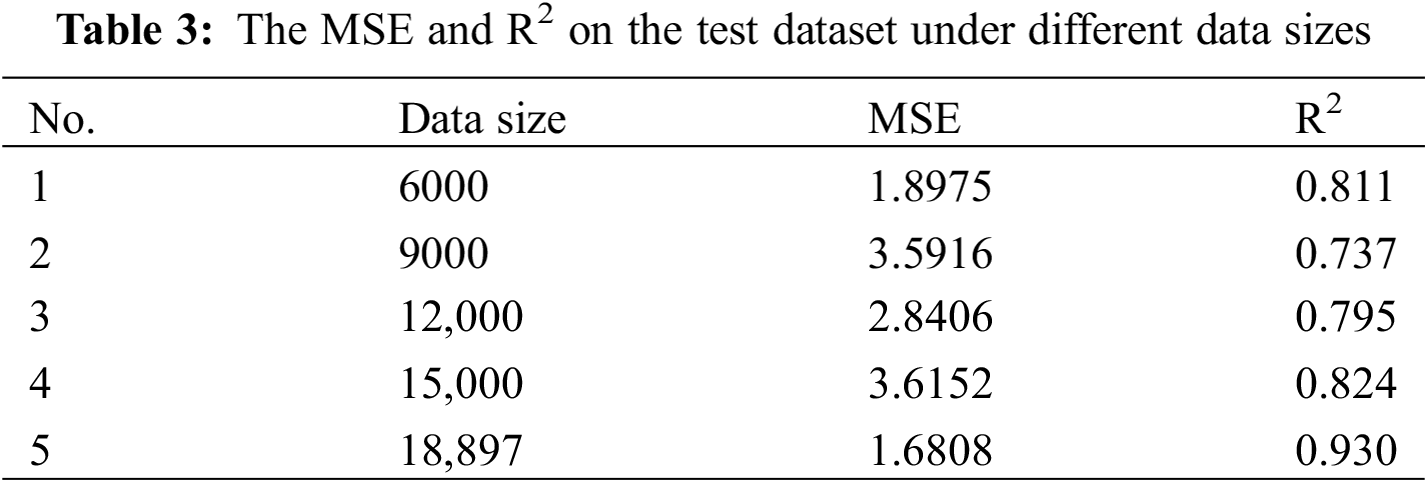
According to Table 3, as the data size increases, MSE undertakes several fluctuations while R2 initially decreases and subsequently grows. Hence, when utilizing the entire dataset which is 18,897 h, the LSTM network model achieves optimal performance with MSE of 1.6808 and R2 of 0.930. Furthermore, the results indicate the high sensitivity of data size.
To determine the optimal batch size, different scales of 18,897-h time series data are inputted into the model to analyze the effect of batch size on the model. The results are shown in Table 4.
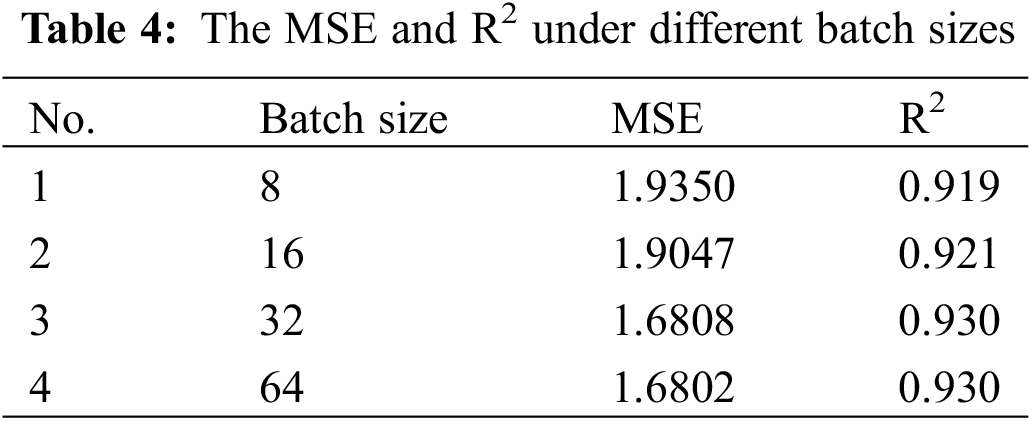
Table 4 demonstrates that as the batch size rises, MSE displays a downward trend and conversely R2 slightly goes up. However, comparing the models with batch sizes of 32 and 64, their MSE only have a slight difference and R2 are the same. Considering that a smaller batch size has a higher computational speed, the model with a batch size of 32 is selected.
3.3.3 Number of LSTM Layers and Number of Neurons in the LSTM Layer
To determine the optimal number of LSTM layers and number of neurons in the LSTM layer, the LSTM network model, applying the identified optimal parameters, computes under 12 scenarios. The results are shown in Table 5.
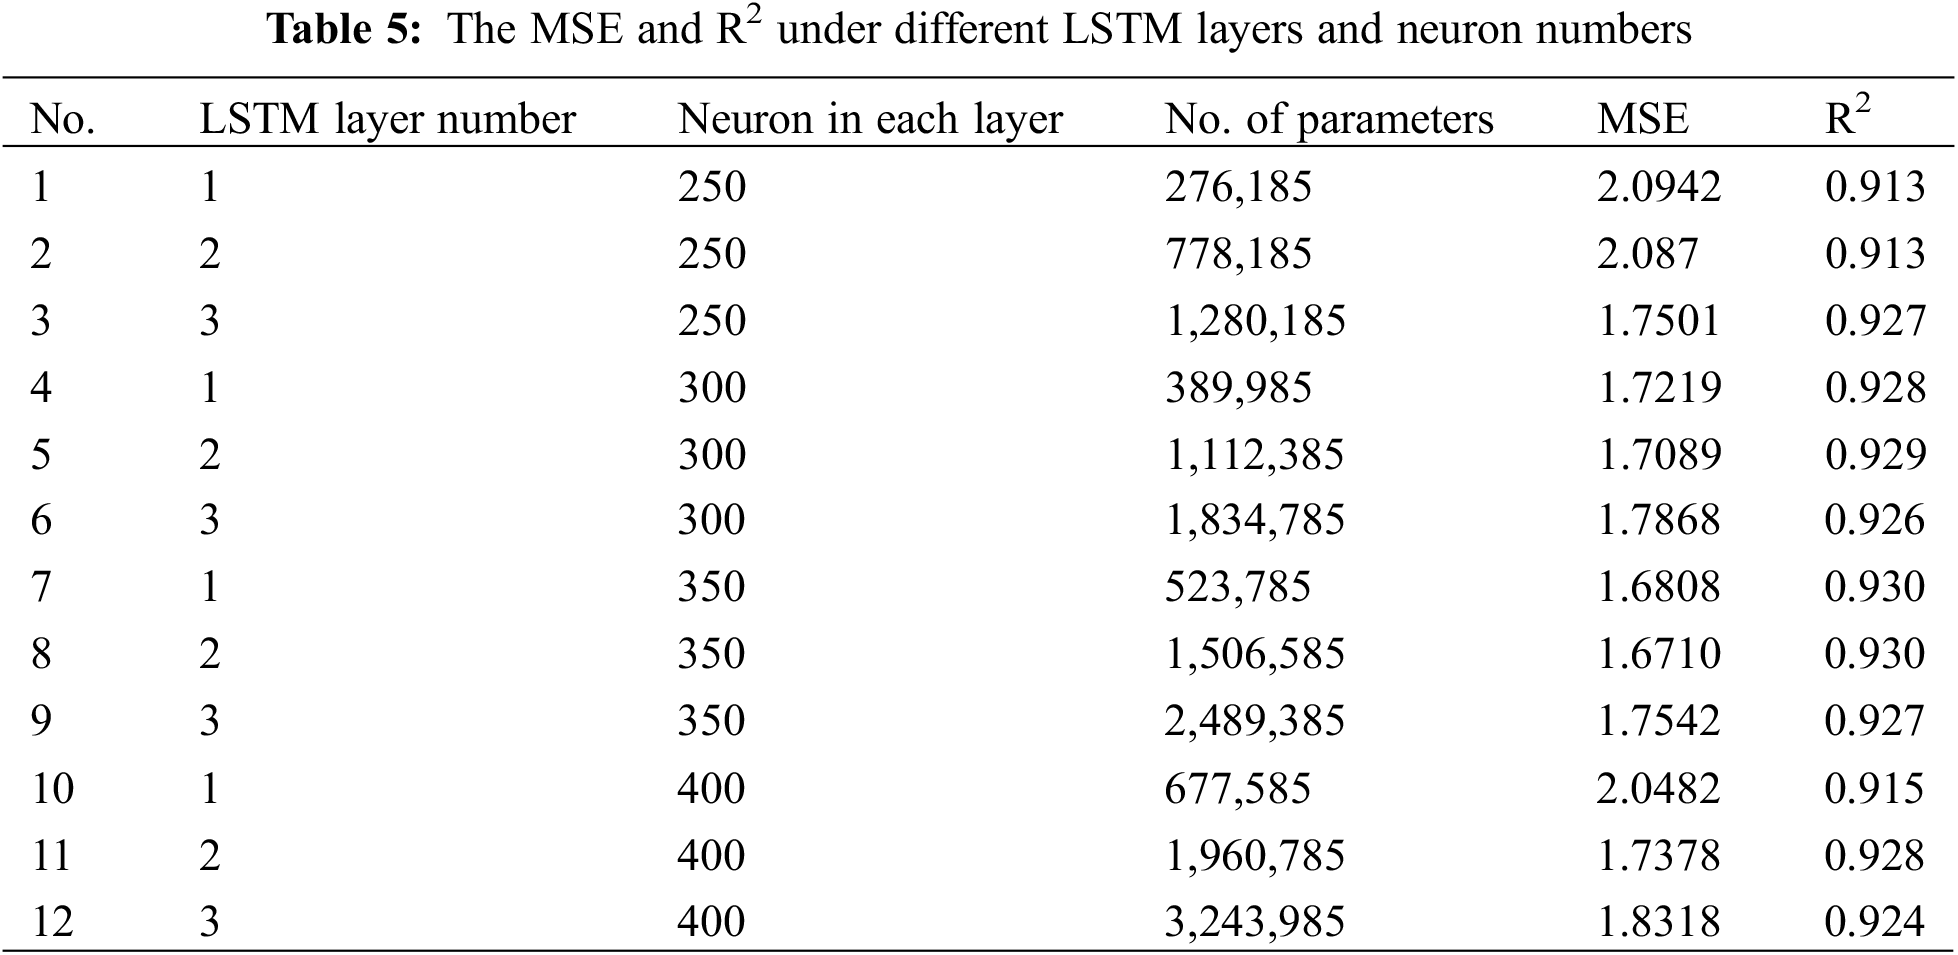
To sum up, the best-performing models are those with 1 LSTM layer and 350 neurons per layer and those with 2 LSTM layers and 350 neurons per layer. Specifically, the MSE and R2 of the model with 1 LSTM layer and 350 neurons per layer are respectively 1.6808 and 0.930. The MSE and R2 of the model with 2 LSTM layers and 350 neurons per layer are separately 1.6710 and 0.930. Considering that the model with 2 LSTM layers and 350 neurons per layer only reduces the MSE by 0.09 while increasing the parameters by approximately 1,000,000, significantly reducing the model’s computational speed, thus the model with 1 LSTM layer and 350 neurons per layer is eventually selected.
Similarly, the optimal learning rate is selected by using the determined parameters and the results are shown in Table 6.
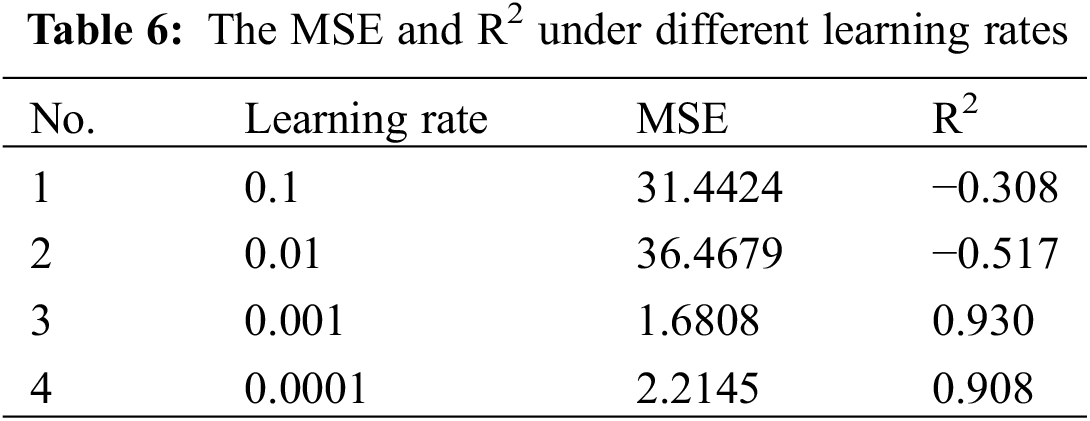
According to Table 6, the LSTM network model achieves the best prediction results when the learning rate is 0.001, with MSE of 1.6808 and R2 of 0.930. Nevertheless, when the learning rate is 0.01, the MSE and R2 of the model are respectively 36.4679 and −0.517. The reason accounting for this phenomenon is that an excessively high learning rate can result in gradient explosion and significant fluctuations in the loss function. Furthermore, the learning rate has the highest sensitivity. Hence, the model with a 0.001 learning rate is eventually selected.
The optimal LSTM network model with 18,897 h of data, batch size of 32, 1 LSTM network layer, 350 neurons per layer, and learning rate of 0.001 is finally selected.
The time series data of girder end displacements and temperature are input into the optimal LSTM model, and the results are shown in Fig. 16.

Figure 16: The results of the LSTM network model. (a) Displacement-time of overall data. (b) Displacement-time of 25 h data. (c) Time lag
The MSE and R2 of the testing dataset are respectively 1.6808 and 0.930, indicating that the predicted trends closely match the measured trends. Fig. 16a,b separately shows the overall and 25 h results of the LSTM network model, demonstrating that the model effectively captures the nonlinear relationships between girder end displacements and temperature. Fig. 16c illustrates that the LSTM network model successfully mitigates the time-lag effect between girder end displacements and temperature, enhancing the prediction accuracy and improving the effect of long-term prediction.
The results of the linear regression model, ANN model and LSTM network model are shown in Table 7.
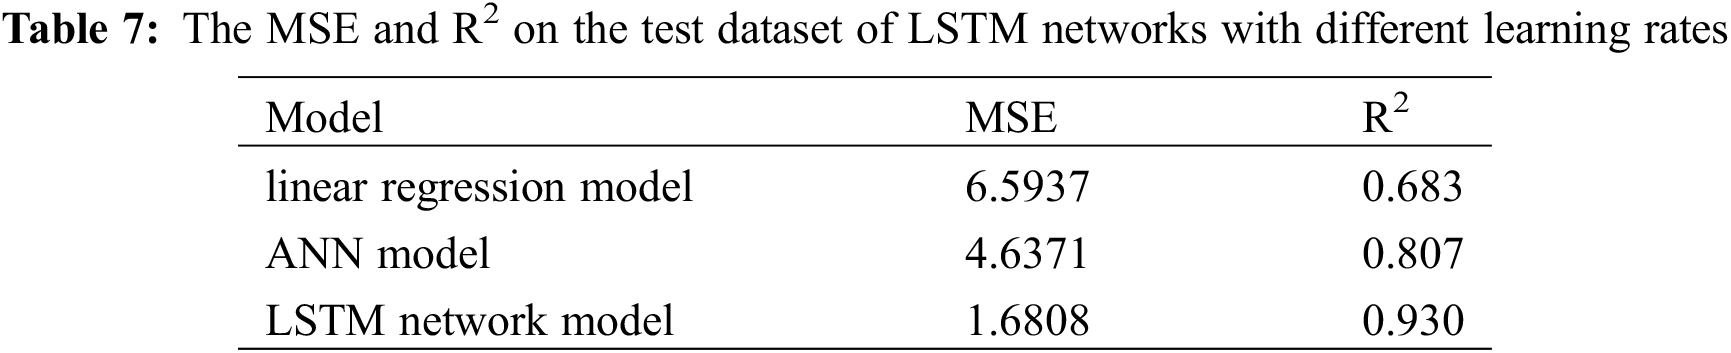
Compared to the linear regression model, the LSTM network’s MSE decreased by 4.9129 and R2 increased by 0.247, which corresponds to a 74.51% decrease in MSE and a 36.14% improvement in R2. Comparing the ANN and LSTM model, LSTM experience a reduction in MSE of 2.9563 and an increase in R2 of 0.123, which is equivalent to a decrease in MSE of 63.75% and an increase in R of 13.23%. Furthermore, comparing Figs. 14c, 16c with Fig. 13f, it is evident that the LSTM network more effectively captures the nonlinear characteristics of the data and significantly mitigates the time-lag effect, demonstrating a significant enhancement in predictive performance.
The predictive performance of the LSTM network model considerably surpasses that of the linear regression model and ANN model.
Aiming at the enhancement of predictive performance and mitigation of time-lag effects, an innovative deep learning-driven methodology is used to predict temperature-induced girder end displacements based on the monitoring temperature and girder end displacement data from the Dasha Waterway Bridge. The hyperparameter sensitivity analysis is conducted on the LSTM network model. With the optimal hyperparameter values for the LSTM network model, temperature-induced girder end displacement is predicted and the effectiveness of this prediction model is assessed. In summary, the conclusions drawn from this study are as follows:
1. A wavelet transform-based method is proposed to filter the high-frequency component for structural response. For structural response significantly affected by high-frequency loads, such as girder end displacement, simple downsampling is insufficient to eliminate the impact of high-frequency signals. By applying wavelet transform with a reasonable number of decomposition levels and wavelet basis function, high-frequency components can be filtered to achieve optimal data preprocessing results.
2. A temperature-girder end displacement prediction model driven by deep learning is established. The MSE and R2 of the LSTM network model on the test set are separately 0.930 and 1.6808, which can also mitigate the time-lag effect. Compared with the linear regression prediction, the MSE decreased by 74.51% and the R2 increased by 36.14%, indicating a significant improvement in predictive performance. In comparison between ANN and LSTM, LSTM shows a decrease in MSE of 63.75% and an increase in R2 of 13.23%.
3. The optimal hyperparameters for the LSTM network model were determined through its sensitivity analysis. Hyperparameters such as data size, batch size, number of LSTM layers, number of neurons in the LSTM layer, and learning rate were analyzed, with MSE and R2 used as evaluation metrics. Overall, the data size showed high sensitivity, batch size showed low sensitivity, the number of LSTM layers and neurons in the LSTM layer had optimal values, and the learning rate exhibited the highest sensitivity with an optimal parameter solution.
In conclusion, this study highlights the potential of a deep learning estimation method in understanding structural response patterns and improving the predictive performance of temperature-induced girder end displacements of suspension bridges. However, the temperature data based on single-point measurements is unable to represent the overall thermal dynamics, restricting the LSTM model with missing the spatial and temporal characteristics of temperature. Therefore, the temperature field, which encompasses the temperature distribution across the entire structures, should be taken into consideration.
Acknowledgement: The authors appreciate Guangzhou Expressway Operation Management Co., Ltd. for sharing structural health monitoring data.
Funding Statement: The National Key Research and Development Program of China grant No. 2022YFB3706704 received by Yuan Ren; the National Natural and Science Foundation of China grant No. 52308150 received by Xiang Xu.
Author Contributions: The authors confirm contribution to the paper as follows: study conception and design: Xiang Xu; data collection: Yuan Ren, Yao Jin, Chong-Yuan Guo, Chong Li, Zhao-Yuan Guo; analysis and interpretation of results: Yao Jin; draft manuscript preparation: Xiang Xu, Yao Jin. All authors reviewed the results and approved the final version of the manuscript.
Availability of Data and Materials: Some or all data, models, or code that support the findings of this study are available from the corresponding author upon reasonable request.
Ethics Approval: Not applicable.
Conflicts of Interest: The authors declare no conflicts of interest to report regarding the present study.
References
1. Ni YQ, Hua XG, Wong KY, Ko JM. Assessment of bridge expansion joints using long-term displacement and temperature measurement. J Perform Constr Facil. 2007;21(2):143–51. doi:10.1061/(ASCE)0887-3828(2007)21:2(143). [Google Scholar] [CrossRef]
2. Wang H, Shen R, Wen W, Dai Q, Bai L. Investigation of longitudinal movements of girder ends considering various longitudinal non-linear resistances in railway suspension bridges. J Constr Steel Res. 2024;214(2):108446. doi:10.1016/j.jcsr.2023.108446. [Google Scholar] [CrossRef]
3. Li G, Han W, Chen X, Guo T, Xie Q, Yuan Y. Wear evaluation on slide bearings in expansion joints based on cumulative displacement for long-span suspension bridge under monitored traffic flow. J Perform Constr Facil. 2020;34(1):04019106. doi:10.1061/(ASCE)CF.1943-5509.0001388. [Google Scholar] [CrossRef]
4. Guo T, Liu J, Zhang Y, Pan S. Displacement monitoring and analysis of expansion joints of long-span steel bridges with viscous dampers. J Bridge Eng. 2015;20(9):04014099. doi:10.1061/(ASCE)BE.1943-5592.0000701 [Google Scholar] [CrossRef]
5. Sun Z, Zhang Y. Failure mechanism of expansion joints in a suspension bridge. J Bridge Eng. 2016;21(10):05016005. doi:10.1061/(ASCE)BE.1943-5592.0000942 [Google Scholar] [CrossRef]
6. Huang G, Hu J, Liu H, Sun X. Girder longitudinal movement and its factors of suspension bridge under vehicle load. Adv Civ Eng. 2021;2021(1):1443996. doi:10.1155/2021/1443996. [Google Scholar] [CrossRef]
7. Hu J, Wang L, Song X, Sun Z, Cui J, Huang G. Field monitoring and response characteristics of longitudinal movements of expansion joints in long-span suspension bridges. Measurement. 2020;162(12):107933. doi:10.1016/j.measurement.2020.107933. [Google Scholar] [CrossRef]
8. Arsoy S. Proposed mathematical model for daily and seasonal thermal bridge displacements. Transp Res Rec. 2008;2050(1):3–12. doi:10.3141/2050-01 [Google Scholar] [CrossRef]
9. Xia Q, Xia Y, Wan HP, Zhang J, Ren WX. Condition analysis of expansion joints of a long-span suspension bridge through metamodel-based model updating considering thermal effect. Struct Control Health Monit. 2020;27(5):e2521. doi:10.1002/stc.2521. [Google Scholar] [CrossRef]
10. Li J, Meng X, Hu L, Bao Y. Quantifying the impact of environment loads on displacements in a suspension bridge with a data-driven approach. Sensors. 2024;24(6):1877. doi:10.3390/s24061877. [Google Scholar] [PubMed] [CrossRef]
11. Chen L, Deng J, Zhou L, Xia Y. Numerical simulation of temperature induced structural static responses for long-span suspension bridge. Procedia Eng. 2017;210(2):246–52. doi:10.1016/j.proeng.2017.11.073. [Google Scholar] [CrossRef]
12. Ma Z, Choi J, Sohn H. Continuous bridge displacement estimation using millimeter-wave radar, strain gauge and accelerometer. Mech Syst Signal Process. 2023;197(3):110408. doi:10.1016/j.ymssp.2023.110408. [Google Scholar] [CrossRef]
13. Ma Z, Liu P, Choi J, Sohn H. High-sampled structural displacement estimation through the FIR filter-based two-stage fusion of high-sampled acceleration and temporally aliased low-sampled displacement measurements. Mech Syst Signal Process. 2024;208:111056. doi:10.1016/j.ymssp.2023.111056. [Google Scholar] [CrossRef]
14. Xu YL, Chen B, Ng CL, Wong KY, Chan WY. Monitoring temperature effect on a long suspension bridge. Struct Control Health Monit. 2010;17(6):632–53. doi:10.1002/stc.340. [Google Scholar] [CrossRef]
15. Deng Y, Ding Y, Li A. Structural condition assessment of long-span suspension bridges using long-term monitoring data. Earthq Eng Struct Dyn. 2010;9(1):123–31. doi:10.1007/s11803-010-9024-5. [Google Scholar] [CrossRef]
16. Zhou HL, Zhou GD, Qiao ZQ, Chen B, Hu JL. Time-lag effect of thermal displacement and its compensation method for long-span bridges. J Civ Struct Health Monit. 2024;14(4):1–7. doi:10.1007/s13349-024-00769-x. [Google Scholar] [CrossRef]
17. Cao Y, Wang M. Structural behavior of a cable stayed bridge through the use of a long-term health monitoring system. In: Nondestructive characterization for composite materials, aerospace engineering, civil infrastructure, and homeland security 2010. San Diego, CA, USA; 2010 Apr 8. [Google Scholar]
18. Zhou GP, Du AX, Wang MY, Fan J, Li AQ. Performance degradation prediction of extra-wide concrete self-anchored suspension bridge under vehicle load considering time-dependent effects. J Cent South Univ. 2023;30(6):1932–47. doi:10.1007/s11771-023-5360-2. [Google Scholar] [CrossRef]
19. Cao Y, Yim J, Zhao Y, Wang ML. Temperature effects on cable stayed bridge using health monitoring system: a case study. Struct Health Monit. 2011;10(5):523–37. doi:10.1177/1475921710388970. [Google Scholar] [CrossRef]
20. Qian Y. Exploration of machine algorithms based on deep learning model and feature extraction. Math Biosci Eng. 2021;18(6):7602–18. doi:10.3934/mbe.2021376. [Google Scholar] [PubMed] [CrossRef]
21. Wang F, Chen L. The control of civil engineering projects based on deep learning and building information modeling. Inf Resour Manag J. 2023;36(1):1–4. doi:10.4018/IRMJ. [Google Scholar] [CrossRef]
22. Liu W, Wang Z, Liu X, Zeng N, Liu Y, Alsaadi FE. A survey of deep neural network architectures and their applications. Neurocomputing. 2017;234(4):11–26. doi:10.1016/j.neucom.2016.12.038. [Google Scholar] [CrossRef]
23. Gong X, Song X, Cai CS, Li G, Xiong W. Early warning for abnormal strains of continuous bridges using a proposed temperature-strain mapping model. Smart Mater Struct. 2023;32(12):125018. doi:10.1088/1361-665X/ad0c01. [Google Scholar] [CrossRef]
24. Zhang Q, Barri K, Babanajad SK, Alavi AH. Real-time detection of cracks on concrete bridge decks using deep learning in the frequency domain. Engineering. 2021;7(12):1786–96. doi:10.1016/j.eng.2020.07.026. [Google Scholar] [CrossRef]
25. Yazdanpanah O, Chang M, Park M, Kim CY. Seismic response prediction of RC bridge piers through stacked long short-term memory network. Structures. 2022;45(6):1990–2006. doi:10.1016/j.istruc.2022.10.015. [Google Scholar] [CrossRef]
26. Yessoufou F, Zhu J. Classification and regression-based convolutional neural network and long short-term memory configuration for bridge damage identification using long-term monitoring vibration data. Struct Health Monit. 2023;22(6):4027–54. doi:10.1177/14759217231161811. [Google Scholar] [CrossRef]
27. Kwon TH, Kim J, Park KT, Jung KS. Long short-term memory-based methodology for predicting carbonation models of reinforced concrete slab bridges: case study in South Korea. Appl Sci. 2022;12(23):12470. doi:10.3390/app122312470. [Google Scholar] [CrossRef]
28. Wang C, Ansari F, Wu B, Li S, Morgese M, Zhou J. LSTM approach for condition assessment of suspension bridges based on time-series deflection and temperature data. Adv Struct Eng. 2022;25(16):3450–63. doi:10.1177/13694332221133604. [Google Scholar] [CrossRef]
29. Qin Y, Li Y, Liu G. Separation of the temperature effect on structure responses via LSTM-particle filter method considering outlier from remote cloud platforms. Remote Sens. 2022;14(18):4629. doi:10.3390/rs14184629. [Google Scholar] [CrossRef]
30. Yue ZX, Ding YL, Zhao HW. Deep learning-based minute-scale digital prediction model of temperature-induced deflection of a cable-stayed bridge: case study. J Bridge Eng. 2021;26(6):05021004. doi:10.1061/(ASCE)BE.1943-5592.0001716 [Google Scholar] [CrossRef]
31. Zhao H, Ding Y, Li A, Sheng W, Geng F. Digital modeling on the nonlinear mapping between multi-source monitoring data of in-service bridges. Struct Control Health Monit. 2020;27(11):e2618. doi:10.1002/stc.2618. [Google Scholar] [CrossRef]
32. Huang M, Zhang J, Hu J, Ye Z, Deng Z, Wan N. Nonlinear modeling of temperature-induced bearing displacement of long-span single-pier rigid frame bridge based on DCNN-LSTM. Case Stud Therm Eng. 2024;53(8):103897. doi:10.1016/j.csite.2023.103897. [Google Scholar] [CrossRef]
33. Xu D, Xu X, Forde MC, Caballero A. Concrete and steel bridge structural health monitoring-insight into choices for machine learning applications. Constr Build Mater. 2023;402(5):132596. doi:10.1016/j.conbuildmat.2023.132596. [Google Scholar] [CrossRef]
34. Siringoringo DM, Fujino Y. Wavelet-based analysis for detection of isolation bearing malfunction in a continuous multi-span girder bridge. J Earthquake Eng. 2022;26(10):5237–67. doi:10.1080/13632469.2020.1868363. [Google Scholar] [CrossRef]
35. Xu X, Ren Y, Huang Q, Zhao DY, Tong ZJ, Chang WJ. Thermal response separation for bridge long-term monitoring systems using multi-resolution wavelet-based methodologies. J Civ Struct Health Monit. 2020;10(3):527–41. doi:10.1007/s13349-020-00402-7. [Google Scholar] [CrossRef]
36. Zhou X, Meng X, Li Z. ANN-LSTM-A water consumption prediction based on attention mechanism enhancement. Energies. 2024;17(5):1102. doi:10.3390/en17051102. [Google Scholar] [CrossRef]
37. Xu X, Xu D, Caballero A, Ren Y, Huang Q, Chang W, et al. Vehicle-induced deflection prediction using long short-term memory networks. Struct. 2023;54:596–606. doi:10.1016/j.istruc.2023.04.025. [Google Scholar] [CrossRef]
38. Hochreiter S, Schmidhuber J. Long short-term memory. Neural Comput. 1997;9(8):1735–80. doi:10.1162/neco.1997.9.8.1735. [Google Scholar] [PubMed] [CrossRef]
39. Gers FA, Schmidhuber J, Cummins F. Learning to forget: continual prediction with LSTM. Neural Comput. 2000;12(10):2451–71. doi:10.1162/089976600300015015. [Google Scholar] [PubMed] [CrossRef]
Cite This Article
 Copyright © 2025 The Author(s). Published by Tech Science Press.
This work is licensed under a Creative Commons Attribution 4.0 International License , which permits unrestricted use, distribution, and reproduction in any medium, provided the original work is properly cited.
 Downloads
 Citation Tools