
 Submit a Paper
 Propose a Special lssue
 Open Access
ARTICLE

Anti-Crack Analysis and Reinforcement Design of Transverse Diaphragm Based on Layered Modeling Analysis Method
1 China Communications Construction Company Highway Bridges National Engineering Research Center Co., Ltd., Beijing, 100088, China
2 Department of Bridge Engineering, School of transportation, Southeast University, Nanjing, 211189, China
* Corresponding Author: Wenwei Wang. Email:
(This article belongs to the Special Issue: Health Monitoring and Rapid Evaluation of Infrastructures)
Structural Durability & Health Monitoring 2025, 19(3), 549-574. https://doi.org/10.32604/sdhm.2024.055382
Received 25 June 2024; Accepted 30 August 2024; Issue published 03 April 2025
 View Full Text
 Download PDF
Abstract
To meticulously dissect the cracking issue in the transverse diaphragm concrete, situated at the anchor point of a colossal large-span, single cable plane cable-stayed bridge, this research paper adopts an innovative layered modeling analysis methodology for numerical simulations. The approach is structured into three distinct layers, each tailored to address specific aspects of the cracking phenomenon. The foundational first layer model operates under the assumption of linear elasticity, adhering to the Saint Venant principle. It narrows its focus to the crucial zone between the Bp20 transverse diaphragm and the central axis of pier 4’s support, encompassing the critically cracked diaphragm beneath the N1 cable anchor. This layer provides a preliminary estimate of potential cracking zones within the concrete, serving as a baseline for further analysis. The second layer model builds upon this foundation by incorporating material plasticity into its considerations. It pinpoints its investigation to the immediate vicinity of the cracked transverse diaphragm associated with the N1 cable, aiming to capture the intricate material behavior under stress. This layer’s predictions of crack locations and patterns exhibit a remarkable alignment with actual detection results, confirming its precision and reliability. The third and most intricate layer delves deep into the heart of the matter, examining the cracked transverse diaphragm precisely where the cable force attains its maximum intensity. By leveraging advanced extended finite element technology, this layer offers an unprecedented level of detail in tracing the progression of concrete cracks. Its findings reveal a close correlation between predicted and observed crack widths, validating the model’s proficiency in simulating real-world cracking dynamics. Crucially, the boundary conditions for each layer are meticulously aligned with those of the overarching model, ensuring consistency and integrity throughout the analysis. These results not only enrich our understanding of the cracking mechanisms but also underscore the efficacy of reinforcing cracked concrete sections with external steel plates. In conclusion, this study represents a significant contribution to the field of bridge engineering, offering both theoretical insights and practical solutions for addressing similar challenges.Keywords
List of Abbreviations
| CDP | Concrete Damaged Plasticity |
Long-span cable-stayed bridges are a prevalent bridge design due to their significant advantages, including their ability to span vast distances, visually appealing appearance, and simple structural form [1]. Not only can the vast distance span reduce the surrounding environment influence, but also the bridge deck extremely enlarges the traffic space [2]. The elegant and modern aesthetic created by the appealing appearance make these structures become some iconic landmarks in urban and natural settings [3]. Furthermore, the simple structural form, characterized by the direct loading transferring from the cables to the pylons, results in an efficient and effective utilization of engineering materials [4,5]. However, the anchorage zone of the cable-stayed cables experiences concentrated stress during extended service periods, which is also coupled with the increasing weight of vehicular traffic. The combination of multiple factors, along with the complex stress distribution from the concrete main beam, can lead to diagonal cracks forming surrounding the manhole corners in the transverse diaphragm [6–10]. If adequate measures are not promptly implemented, these cracks may further and widely aggravate, which potentially compromises the structural integrity and bridge safety.
Research on the diaphragm cracking of large-span cable-stayed bridges remains relatively insufficient [11–13]. At present, many scholars are exploring various reinforcement techniques for concrete and steel diaphragms, which is aimed to improve the bridge bearing capacity and longevity [14–16]. Cui et al. proposed an innovative steel shell-concrete composite structure tower in the bridge, which deployed coarse aggregate reactive powder concrete, and applied it to the main girder of the bridge to enhance and strengthen the structural load-bearing performance [17]. Qiang et al. employed shape memory alloy (SMA) to mend welding fatigue cracks in steel diaphragms, it found that the fatigue notch factor was reduced by 66.36% by bonding the Fe-SMA plate, and such a factor could be further reduced by about 14% after activating Fe-SMA [18]. Fang et al. examined the cracking behavior of mixed-mode steel diaphragms in their study, revealing that drilling holes ahead of the crack tips could effectively alleviate stress concentrations and prolong fatigue life [19].
In terms of numerical analysis, a simple finite element (FE) modelling of the collapsed Morandi Bridge was carried out by Orgnoni et al. [20] to understand the stress state when the bridge was subjected to a catastrophic sudden collapse. Furthermore, the Applied Element Method (AEM) has been applied to model impact scenarios on bridge decks and the advanced discrete element approaches was able to deal with both standard and non-standard loading scenarios [21].
However, the above-mentioned investigations hardly concentrate on the cracking analysis for concrete diaphragms of long-span cable-stayed bridges. To some extent, it plays a significant role in the bridge health monitoring, disaster reduction and prevention, and intelligent operation and maintenance [22–24].
Therefore, based on the practical engineering of a cable-stayed bridge, the following research works have been conducted to better understanding of the cracking behavior of concrete in complex areas: (1) the stress response of concrete diaphragms subjected to high cable tensions was comprehensively studied; (2) a list of numerical simulations was conducted to investigate the crack propagation patterns and damage mechanisms of concrete diaphragms; (3) a novel reinforcement method with using steel plates was proposed as a structural remedial measure.
The principal bridge is a prestigious five-span continuous single-tower, single-cable-plane prestressed concrete cable-stayed structure, boasting a total length of 510 m, comprising spans of (40 + 40 + 160 + 160) m. The primary tower features an innovative consolidation system that integrates the tower and pier, with the main beam resting securely on the piers. The tower stands at a majestic height of 85 m, boasting a ratio of tower height to middle span of 0.38 and a height-to-span ratio of 1/38 for the main beam’s main span. The tower column is a reinforced concrete structure designed to withstand eccentric compression forces, and the main tower is adorned with 22 pairs of cable stays on each side, ensuring stability and durability, shown as the Fig. 1.

Figure 1: Bridge type layout
The primary beam incorporates a substantial cantilever single-box, five-chamber section constructed from prestressed concrete. It boasts a full width of 35.50 m, with a roof width measuring 35.26 m and a bottom plate width spanning 20 m. The beam height at the central line of the box beam stands at 3.52 m. The middle chamber’s top plate is crafted with a thickness of 55 cm, while the remaining chambers feature a top plate thickness of 28 cm. The bottom plate thickness is uniform at 28 cm. The outer and secondary middle webs are designed with a thickness of 30 cm, while the middle web thickness is 35 cm. The spacing between these beams is precisely 4 m. Additionally, the beam thickness at the stay cable anchorage is 40 cm, while sections without cables maintain a thickness of 30 cm.
According to the Key Bridge Monitoring Report from the 2018 National and Provincial Trunk Highway Network Technical Condition Monitoring Project conducted by the Ministry of Transport of China, the most significant issue affecting the bridge is the diagonal cracking in the transverse diaphragm of the main bridge’s box girder [25–29]. These cracks are typically less than 0.2 mm wide and exhibit a characteristic inverted shape, concentrated near the corner of the manhole in the secondary side box room [30–34], as depicted in Fig. 2. During the monitoring period, the activity of these cracks was not significant, and the crack depths generally exceeded the thickness of the protective layer surrounding the steel reinforcement [35–38]. In addition, according to the needs of structure health monitoring (SHM), for concrete with complex and concealed areas, stress analysis should be conducted, and sensing elements should be installed at key locations for stress monitoring.

Figure 2: Typical cracks in transverse diaphragm
3 Technical Standards and Design Specifications
The road classification is an expressway, designed for a speed of 100 km/h. It features a total of six lanes in both directions. The bridge boasts a width of 35.5 m, comprising 0.75 m for the railing on each side, 3.5 m for the left and right-side shoulders, three lanes of 3.75 m each, 0.75 m for the left and right-side curbs, and a 3 m central partition. The longitudinal slope is graded as 2% on the smaller mileage side and −1.48% on the larger mileage side, with a slope change point at K3 + 030 (construction design pile number). The vertical curve radius measures 11,000 m.
Regarding the horizontal slope of the bridge deck, it traverses a circular curve with a radius of 920 m and a length of 38.903 m, followed by a moderate curve of 245 m, and concluding with a straight-line segment of 226.097 m. The design load adheres to Highway-Class I standards. The railway clearance underneath the bridge ensures a minimum height of 9 m.
The design wind speed considers a 100-year return period, with an average annual maximum wind speed of 28.6 m/s over a 10-min period. The seismic intensity is rated at VIII degree, with fortification according to IX-degree standards. The design basic seismic acceleration value is set at 0.2 g. The bridge structure’s design base period is 100 years.
3.2 Design Adoption Specification
The design and construction of the bridge adhere to a comprehensive set of Chinese codes and standards to ensure its structural integrity and safety. These include the Highway Bridge Reinforcement Design Code (JTG/T J22-2008), which outlines the principles for reinforcement design of highway bridges. The Concrete Structure Reinforcement Design Code (GB 50367-2013) provides guidance for the reinforcement of concrete structures. The Engineering Structure Reinforcement Material Safety Evaluation Technical Code (GB 50728-2011) ensures the safety of reinforcement materials used in engineering structures.
Additionally, the Concrete Structure After Anchoring Technical Code (JGJ145-2013) addresses technical considerations for concrete structures after anchorage is applied. The General Code for Design of Highway Bridges and Culverts (JTG D60-2004) serves as a general guideline for the design of highway bridges and culverts, while the Code for Design of Highway Reinforced Concrete and Prestressed Concrete Bridges and Culverts (JTG D62-2004) specifically addresses reinforced concrete and prestressed concrete bridges and culverts.
Lastly, the Technical Code for Construction of Highway Bridges and Culverts (JTG/TF50-2011) provides technical guidance for the construction of highway bridges and culverts, ensuring compliance with the design requirements and standards. By adhering to these codes and standards, the bridge is designed and constructed to meet the highest levels of safety and durability.
4 Calculation of Transverse Diaphragm Crack Width
In this paper, the Bd22 transverse diaphragm anchored by the N1 cable-stayed cable is identified as the key research object due to its strategic location at the boundary between the cable-stayed zone and the cable-free zone. This positioning is significant because the anchorage of the cable-stayed cable in close proximity to the bridge tower subjects the transverse diaphragm to the most unfavorable vertical force component. Therefore, analyzing the performance and behavior of this specific transverse diaphragm under such loading conditions is crucial for ensuring the overall structural integrity and safety of the bridge.
To thoroughly investigate the potential cracking of the Bd22 transverse diaphragm anchored by the N1 cable-stayed cable, including the location, shape, and geometry of any cracks, this paper employs a multi-stage local modeling approach. This methodology involves progressively creating and analyzing increasingly detailed local models of the structure. By gradually reducing the number of assumptions made in the modeling process, the study aims to achieve more realistic and accurate results. As depicted in Table 1, this staged analysis allows for a step-by-step evaluation of the concerned issues, providing insights into the structural behavior and potential cracking mechanisms.

Based on the findings from the global model, the analysis proceeds to the local modeling stage. The first-level local model focuses on the region around the anchor point of the N1 cable-stayed cable, encompassing a 54.3 m beam segment. It is worth noting that the reason why the model analyzes the region in this way also conforms to the Saint Venant principle. Initially, the material properties are assumed to be linear elastic. However, once the calculations reveal that the main tensile stress in the concrete exceeds 3 MPa, a more sophisticated material model is employed.
Specifically, a Concrete Damaged Plasticity (CDP) model is adopted in the second and third partial models to analyze the crack behavior of the concrete at the position of the transverse diaphragm. This model allows for the definition of separate tensile and compressive stress-strain curves, as shown in Fig. 3. By accurately specifying these curves based on the calculated stress directions, the model can provide insights into the general morphology of potential cracks.

Figure 3: Constitutive relation of C55 concrete plastic damage model
Once the general fracture morphology is identified, the analysis is further refined using the Extended Finite Element Method (XFEM). XFEM is a powerful technique for accurately simulating the geometric characteristics of fractures, but it is also computationally intensive and requires careful preprocessing. Therefore, in this study, the XFEM is applied only in the third local model, which focuses specifically on the location of the largest predicted crack. This targeted application of XFEM ensures that the most critical fracture characteristics are captured with the highest possible accuracy.
In the primary level of the local model, concrete is assumed to be a linear elastic material, meaning it does not exhibit failure under stress. However, upon reaching the yield strength, the stress continues to increase following the initial stiffness, analogous to a ‘steel bridge’ with a reduced elastic modulus. This approach fails to capture the actual mechanical behavior of concrete and, consequently, limits its ability to accurately assess concrete’s yield state. Therefore, this model primarily serves as an indicator for determining if concrete has reached its yield point, and the stress magnitude itself lacks significance in this context.
The second local model for concrete is optimized as a plastic damage model that accounts for damage and potential failure. Once the stress reaches the yield stress, the stress decreases as strain increases, resulting in energy dissipation and redistribution of internal forces to the surrounding concrete. This behavior can mimic the formation of cracks, but there are some limitations. While the cracking process is brittle in nature, the damage failure modeled is ductile, meaning the elements remain continuous. Consequently, the model does not accurately reflect the material’s fracture behavior, and the fracture geometry depicted in this model may be inaccurate. It provides a good approximation for the general trend of cracking but does not precisely capture the specific fracture patterns or discontinuities that occur in real-world concrete structures.
The third level local model employs the Extended Finite Element Method (XFEM) to simulate cracks in concrete. Once the concrete stress exceeds the cracking toughness, fracture failure occurs, resulting in a discontinuous material and brittle damage. After cracking, energy becomes concentrated at the crack tip and is dissipated through further cracking. This model incorporates the pin effect of reinforcement on cracks, which means that when the interface stress is below the bond stress, the reinforcement can hinder crack propagation. Conversely, if the bond stress is exceeded, the bond between the reinforcement and concrete is compromised, leading to slippage. Additionally, the XFEM approach allows cracks to develop independently of the mesh grid, enabling a more realistic crack path and thus providing more accurate calculations of crack geometry.
4.2 The First Level Local Model
The modeling scope of the first level local model spans from the transverse diaphragm of Bd20 to the center line of pier No. 4, as depicted in Fig. 4. Given the numerous variable sections and guiding angles within the model, the beam body, transverse diaphragm, and cable anchor block were modeled independently for the sake of convenient mesh generation. These three components were then assembled together, ensuring they are in contact with each other without any overlap or gaps.
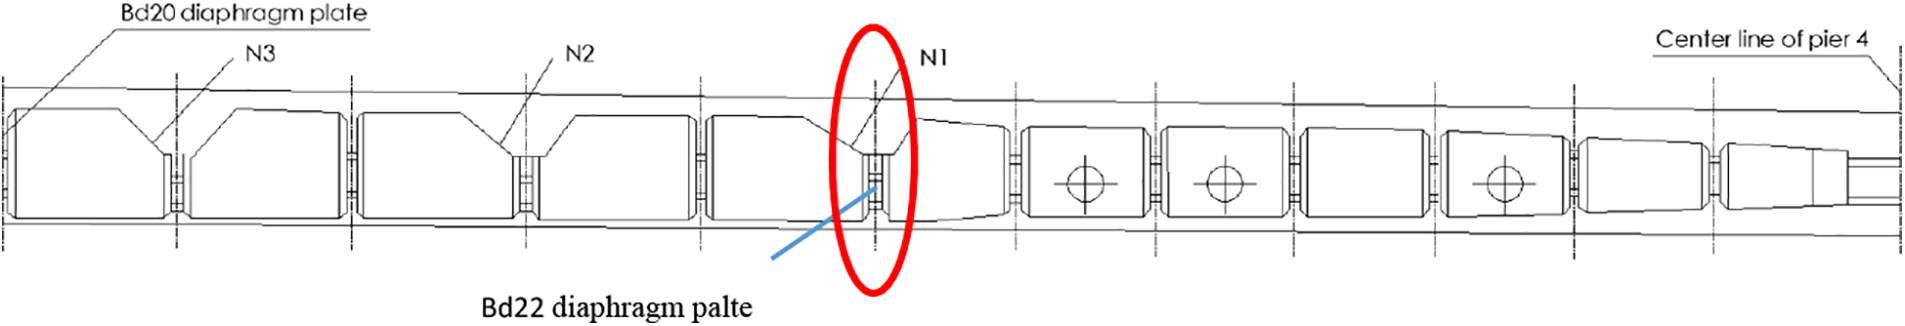
Figure 4: Modeling range
Although tetrahedral elements offer automatic division, they are inherently constant strain elements, thus resulting in lower calculation accuracy compared to hexahedral elements. To achieve more precise calculation outcomes, this model predominantly employs hexahedral meshes for the majority of regions, while reserving tetrahedral meshes solely for complex, variable cross-section areas that are not locally prioritized, as illustrated in Fig. 5. The basic unit size for division is approximately 30 cm in length. In the long side direction of geometric dimensions, the unit size is between 50 to 100 cm, which can reduce the number of units and facilitate structural calculations.

Figure 5: First level local model
The boundary conditions have a direct and significant impact on the effectiveness of the structure. Ensuring accurate boundary condition definitions is crucial to maintaining consistency in the internal forces and deformations between the local model and the overall model. Given that this local model is a higher-order statically indeterminate structure with asymmetric elastic constraints at its boundaries, directly defining these conditions can be challenging. Consequently, we employ the force method to simplify the structure into a statically indeterminate system. This approach replaces the excessive constraints with generalized forces, resulting in the basic structure depicted in Fig. 6. Upon comparing the global model developed in Midas Civil with the local model created in ABAQUS, it is conclusively demonstrated that the definition of boundary conditions in both instances is accurate, as shown in Fig. 7.
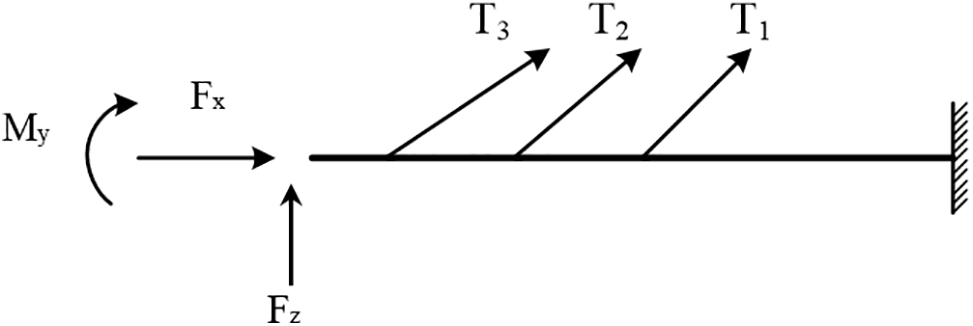
Figure 6: Boundary conditions

Figure 7: Comparison of internal force results between local model and global model
Loads acting on the structure encompass various factors, including gravity, second-phase constant load, prestress, vehicle live load, and temperature variations. These loads have a significant impact on the behavior and performance of the structure, requiring careful consideration and analysis during the design and analysis process.
For linear prestressed bars, the application of pressure to the loading block is utilized to simulate the prestressing effect, as depicted in Fig. 8. However, for curve prestressed bars, a truss model is established specifically to apply the prestress during the cooling process. This approach accounts for the unique geometry and behavior of curved prestressed elements.

Figure 8: Prestressed load
The beam section in question adopts a transverse cantilever design, fixed at its center, with four vehicles arranged on the outer edges. The loading position of the Bd22 transverse partition in the longitudinal direction is determined based on the influence line analysis, as illustrated in Figs. 9 and 10. This approach ensures that the loading is applied at the most critical locations, taking into account the specific structural configuration and loading conditions.

Figure 9: Determine the loading position according to the influence line

Figure 10: Vehicle loading
As depicted in Figs. 11 and 12, the distribution of the primary tensile stress and compressive stress within the transverse partition at the cable anchor is clearly illustrated. Specifically, the peak tensile stress, recorded at 11.7 MPa, is concentrated in the ① region of the N1 cable anchor’s transverse diaphragm Bd22. Conversely, the maximum compressive stress, amounting to 13.4 MPa, is significantly lower. Fig. 13 provides a visual representation of the N1 transverse diaphragm, highlighting the location of these stress concentrations.

Figure 11: Main tensile stress of the Bd22 transverse diaphragm

Figure 12: Main compressive stress of the Bd22 transverse diaphragm

Figure 13: Main tensile stress distribution of Bd22 transverse diaphragm
4.3 The Second Level Local Model
The second-level local model focuses on the Bd22 transverse diaphragm as its center and encompasses a 7 m beam section, as shown in Fig. 14. In this model, the concrete material properties are specifically optimized to incorporate the plastic damage (CDP) model, while the remaining aspects remain in alignment with the first-level local model. The boundary conditions for this model are determined based on the calculations performed in the first-level local model, allowing for a reduction in computational cost while ensuring accurate and reliable results.
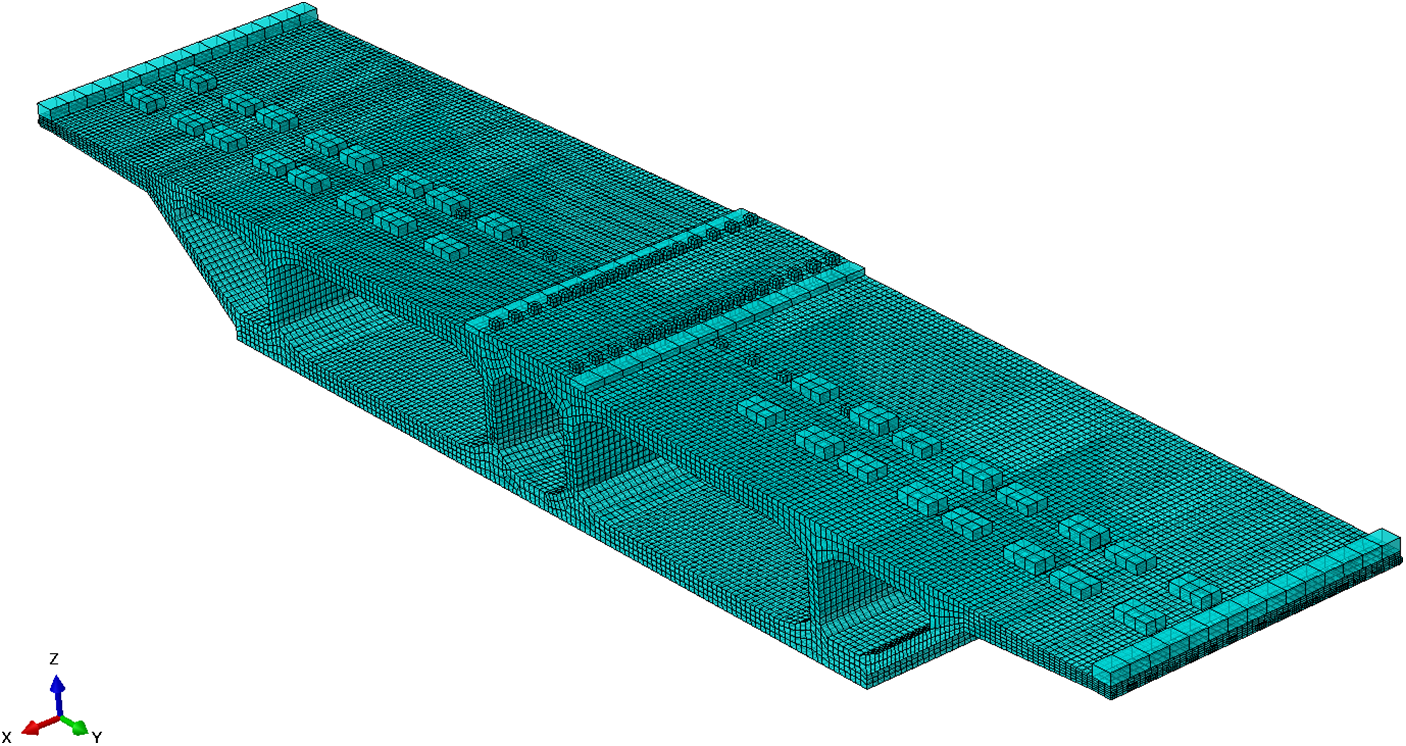
Figure 14: The second level local model
Before performing the calculation, the material properties of the second-level local model are initially set to be consistent with the first local model to verify the accuracy and correctness of the newly established local model. By comparing the main tensile stress figures of the two transverse diaphragm in both models, as indicated in Fig. 15, it is determined that the error falls within an acceptable range. This comparison serves as validation that the second-level local model is reliable and can provide accurate results.

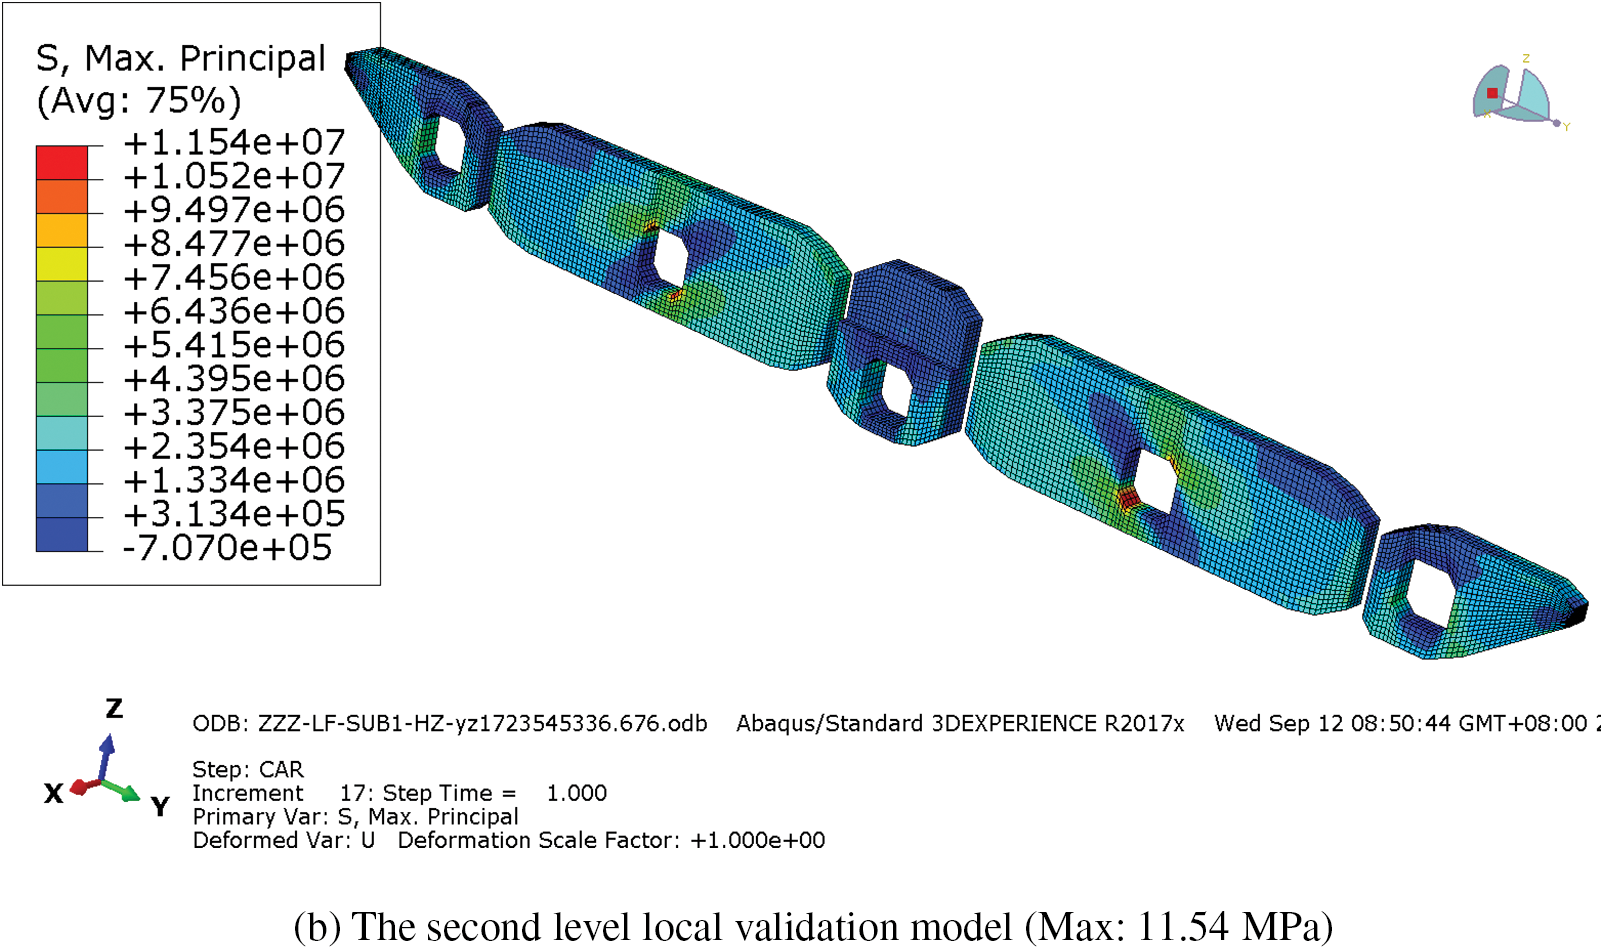
Figure 15: Waveform variations in corrosion. (a) 20% corrosion, (b) 25% corrosion, (c) 30% corrosion
4.3.3 Properties of Concrete Materials
The CDP model is an effective tool for simulating the stress-strain behavior of brittle materials, such as concrete, under a wide range of loading conditions, including monotonic, reciprocating, and dynamic loads, especially under moderate confining pressures. This model is a continuum damage calculation approach based on plasticity theory.
Within the CDP model, the tensile and compressive behavior of the material can be independently defined and tailored to specific conditions. This flexibility allows for a more accurate representation of the material’s response to different types of loads. Additionally, the model accounts for stiffness degradation due to damage accumulation, as well as stiffness recovery under reciprocating loading conditions. These features make the CDP model a valuable tool for analyzing the performance of concrete structures under complex loading scenarios.
The CDP model encompasses several crucial plastic parameters such as the flow potential offset value, expansion angle, the ratio of biaxial to uniaxial ultimate compressive strength, the second stress invariant ratio on the meridional plane pertaining to tension and compression, and the viscosity coefficient. Within this model, the flow motive force function is represented by a Drucker-Prager hyperbolic function, as delineated in Eq. (1).
where, the uniaxial compressive strength of concrete is
The irrelevant flow rule determines a loading surface, which represents the boundary between elastic and plastic behavior in a material. In the context of a concrete damage model, the loading function is typically used to characterize the conditions under which plastic deformation or damage occurs in the concrete. The specific loading function employed in the model may vary, but it generally depends on the stress state and material properties.
where,
where,
The damage factor serves as an indicator of the nonlinear material properties exhibited by concrete. Given the significant disparity between the tensile and compressive characteristics of concrete, the damage factor

Figure 16: Stress-strain development curve of the CDP model
The calculation methods of various strain intervals of tension concrete are as follows:
The calculation methods for various strain intervals in tension concrete are outlined as follows:
The damage factor
where,
Similarly, for the compressed concrete, the damage factor calculation formula is as follows:
where,
In the computation of the damage factor, the elastic modulus utilized corresponds to the cutting line modulus associated with tensile cracking. In accordance with the findings of the Birtel test,
where,
The aforementioned method relies on the fundamental assumption of strain equivalence, which posits that the strain experienced by a damaged unit under the application of stress is identical to the strain response exhibited by an undamaged unit under the influence of effective stress
Elastic residual energy of undamaged material:
Elastic residual energy of damaged material:
The effective stress is:
From the above conditions:
Fig. 17 presents a comparative analysis of the tensile and compression damage factors for C40 concrete, derived separately using strain equivalence and energy equivalence principles. The results indicate that damage factors calculated based on the energy equivalence method yield lower values compared to those obtained through strain equivalence. Furthermore, the disparity between the tensile damage factors is more significant than that observed in the compressive damage factors. This suggests that the energy equivalence approach may provide a more conservative estimate of damage, particularly in tensile conditions, while still maintaining a relatively close approximation for compressive damage.

Figure 17: Comparison of damage factors under different hypothesis conditions
Under the application of unidirectional axial force, concrete exhibits a unique unilateral stiffness recovery phenomenon. Specifically, when the external force is removed from tension and the load is reversed to compression, the tensile cracks tend to close, allowing for a partial restoration of compressive stiffness. Conversely, when the external force transitions from compression to tension, the cracks formed during compression remain open, rendering the tensile stiffness recovery largely ineffective.
In the ABAQUS concrete damage plasticity model, this behavior is accounted for by assigning separate recovery factors for the tensile and compressive directions. Under tensile and compressive cyclic loading, the tensile direction is associated with a tensile recovery factor
After thorough refinement, the outcomes of the analysis for the transverse partition and the beam body are presented in Figs. 18 and 19. Through the assessment of the yield strain, we can observe the crack morphology in the transverse partition. However, it is noteworthy that the concrete within the beam body remains uncracked. Furthermore, the maximum compressive stress has undergone a significant increase, reaching 28.9 MPa (as opposed to the 13.4 MPa recorded under the linear elastic model).

Figure 18: Strain and stress of transverse diaphragm

Figure 19: Strain and stress of beam body
4.4 The Third Level Local Model
After determining the cracking location and general shape of the crack, this paper continues to explore the geometric characteristics of the crack to verify the safety of the structure.
The finite element method divides the structure into a finite number of elements with small volume and clear boundary, and the deformation can be transferred between the elements with stiffness according to the established shape function, and the internal force can be obtained by multiplying the deformation and stiffness. The finite element calculation is convenient and fast, but it over-relies on the grid. When simulating cracking, the crack can only be developed along the grid line, rather than through the inside of the unit. And the connection between the elements cannot be broken, that is, the element is always continuous, which limits the scope of application of finite element, so researchers developed infinite elements, which makes the structure get rid of the bondage of the grid, any node can have a relationship with each other, can simulate discontinuous and uneven materials, but the shape function of infinite elements is very difficult to define, and the calculation cost is large. Therefore, some researchers have developed the extended finite element method, which inherits the advantages of convenient and fast finite element calculation. At the same time, by supplementing the shape function with discontinuity, the model gets rid of the shackles of the grid, and the element is no longer continuous under certain conditions, which can better simulate the problem of fracture failure, as shown in Fig. 20.
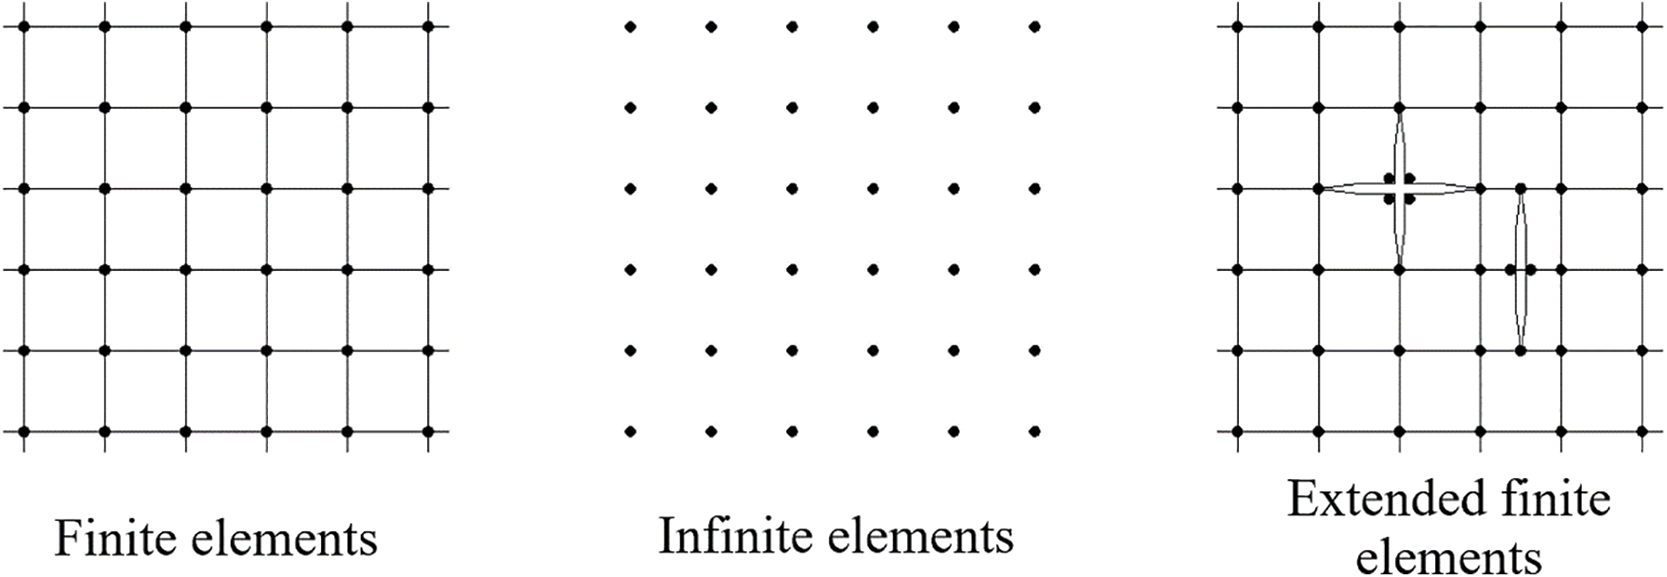
Figure 20: Finite, infinite and extended finite elements
Compared with the finite element method, the pre-processing and calculation of the extended finite element method are much more difficult. The maximum crack width is concerned in this paper, so only the most serious crack part is taken as the local model based on the previous calculation results. After cracking, the pin effect of the rebar cannot be ignored, but it also greatly increases the difficulty of convergence. In order to speed up the calculation, two rows of rebar etc., are replaced into one row, and a transition unit is established between the rebar and concrete to simulate the bond slip of the two, as shown in Fig. 21.

Figure 21: The third level local model
The treatment method of the third local model is the same as the second one, so the model validation is not carried out.
The calculation results of the third local model are shown in Figs. 22 and 23. From Fig. 22, the fracture surface can be seen significantly. Meanwhile, Fig. 23 reflects the development of the maximum crack width with the loading, and the maximum crack width is 0.19 mm, which meets the specification requirements.

Figure 22: Cracks indicate the distance function value (PHISM)

Figure 23: Crack width development (unit in mm)
The treatment of transverse partition cracks involves sealing the cracks through grouting, followed by reinforcement using strip-shaped steel plates. Each steel plate is 5 mm thick, 100 mm wide, and spaced 50 mm apart. The steel plates are oriented along the direction of the primary tensile stress, which is perpendicular to the crack’s direction. Given the inverted splayed distribution of cracks in the cable area’s partition plate, the steel plates are arranged accordingly in an inverted splayed configuration. To ensure full stress distribution, anchor steel plates are attached at both ends of the steel plates and around the manhole, as illustrated in Fig. 24.

Figure 24: Steel plate pasted on the transverse diaphragm in the cable area
5.2 Verification of the Reinforcement Effect
Firstly, the unreinforced box girder is analyzed to determine the stress distribution. As illustrated in Fig. 25, the main tensile stress in the Bd22 transverse diaphragm exhibits a shape resembling an inverted eight. The angle between this stress direction and the horizontal line is found to be between 38° and 42°.

Figure 25: Direction of the main tensile stress
When planning the reinforcement using steel plates, it is important to consider the practical aspects of installation and ensure that the steel plates align effectively with the stress distribution. One such consideration is the chamfering corner of the human hole, which could pose challenges for attaching the steel plates.
To facilitate the attachment of steel plates at the chamfering corner of the human hole, the direction of the steel plates is set to 45°, as shown in Fig. 26 (assuming this is a reference to a figure or diagram that depicts the steel plate layout). This angle is chosen as a compromise between aligning with the main tensile stress direction (between 38° and 42°) and ensuring ease of installation around the human hole.

Figure 26: Structural stress after 5 mm thick steel plate reinforcement
The steel plates are typically in strip shape, with each plate having a specified thickness, width, and spacing. The plates are attached to the box girder using suitable anchors or fasteners to ensure they are securely fastened and can effectively transfer loads and stresses.
By aligning the steel plates at 45°, the reinforcement system is able to provide maximum reinforcement in the direction of the main tensile stress, while also accounting for the practical constraints posed by the chamfering corner of the human hole. This approach helps restore the structural integrity of the box girder, prevents further crack development, and extends its service life.
Regarding the box girder model reinforced with steel plates, the plates possess a width of 100 mm, a net spacing of 50 mm, and thicknesses varying between 5 and 8 mm. The diagram below depicts the diaphragm representing the primary tensile stress zones in the reinforced concrete as well as the primary tensile stress regions in the steel plates. The specific stress values are outlined in Figs. 26 and 27 and Table 2.

Figure 27: Structural stress after 8 mm thick steel plate reinforcement

Based on the analysis of the results, it is evident that after affixing the steel plate, the main tensile stress of the concrete has decreased from 6.405 to 0.493 MPa. By increasing the steel plate thickness to 8 mm, the main tensile stress further reduces from 6.405 to 0.481 MPa, resulting in an average stress reduction of approximately 92%. Furthermore, the steel plates bear the main tensile stresses of concrete after unloading, which are 4.121 and 3.922 MPa, respectively. The thickness of the steel plate has a relatively limited impact on the reduction of concrete stress. Taking into account various construction considerations, a 5 mm steel plate is deemed suitable for pasting and reinforcement purposes.
This paper delves into the stress response of concrete diaphragms in cable-stayed bridges when subjected to significant cable tensions. Through a series of numerical simulations, the patterns of crack propagation were examined and subsequently proposed a reinforcement technique involving the application of steel plates. The key findings are summarized as follows:
1. In response to the intricate challenges of finite element numerical analysis and calculation for complex structures, a layered modeling numerical analysis method has been introduced. This method effectively narrows down the scope of the calculation model and minimizes the number of assumptions, thereby enabling efficient and accurate simulation of concrete cracking in regions of complex stress. The application of this method revealed that the maximum tensile stress in the transverse diaphragm beneath the N1 inclined cable reaches 11.7 MPa, suggesting that the concrete in that area is indeed experiencing cracking.
2. By selecting a local elastic analysis model established within a 54.3-m radius centered on the position of the transverse diaphragm experiencing maximum cable force, the cracking area of structural components can be initially identified. Additionally, by utilizing a local plasticity analysis model within a 7-m radius of the cracked transverse diaphragm, the predicted crack positions and distribution patterns align well with actual observation results. Utilizing the established extended finite element analysis model, the progression of cracks can be accurately deduced, resulting in a calculated crack width that closely matches the measured value.
3. The cracked transverse diaphragm has been reinforced through the application of steel plates. With a 5 mm-thick steel plate, the main tensile stress of the concrete has decreased from 6.405 to 0.493 MPa. By increasing the steel plate thickness to 8 mm, the main tensile stress further reduces from 6.405 to 0.487 MPa, resulting in an average stress reduction of approximately 92%. This significant decrease demonstrates a notable reinforcement effect.
The limitation of this study lies in the insufficiency of theoretical analysis to support the anti-crack checking and reinforcement design method, which impedes its further development for engineering applications. A more thorough theoretical framework would enhance the understanding of crack formation mechanisms and provide a stronger scientific basis for the proposed reinforcement techniques.
Acknowledgement: None.
Funding Statement: This study was financially supported by National Natural Science Foundation of China (Project No. 51878156, received by Wenwei Wang).
Author Contributions: The authors confirm contribution to the paper as follows: study conception and design: Yuanyin Song, Wenwei Wang; data collection: Yuanyin Song; analysis and interpretation of results: Yuanyin Song; draft manuscript preparation: Yuanyin Song, Wenwei Wang. All authors reviewed the results and approved the final version of the manuscript.
Availability of Data and Materials: The data and materials in the current study are available from the corresponding author on a reasonable request.
Ethics Approval: Not applicable.
Conflicts of Interest: The authors declare that they have no conflicts of interest to report regarding the present study.
References
1. Xu G, Yu X, Li J, Chen Z, Zong X. Research on long-term deformation monitoring of PC box girder bridge strengthened by a cable-stayed system. IOP Conf Ser: Earth Environ Sci. 2021;769(3):032028. doi:10.1088/1755-1315/769/3/032028. [Google Scholar] [CrossRef]
2. Liang R, Zhi F, Kai W. Design and behavior of super-long span cable-stayed bridge with CFRP cables and UHPC members. Compos Part B: Eng. 2019;164:72–81. doi:10.1016/j.compositesb.2018.11.060. [Google Scholar] [CrossRef]
3. Sun Y, Xu D, Chen B, Xu F, Zhu H. Three-dimensional reinforcement design method and program realization for prestressed concrete box-girder bridges based on a specific spatial lattice grid model. Eng Struct. 2018;175:822–46. doi:10.1016/j.engstruct.2018.08.058. [Google Scholar] [CrossRef]
4. Zhang K, Liu A, Fu J, Huang Y, Yang J, Yu Y, et al. Shaking table test of a new special-shaped arch bridge. Eng Struct. 2023;286:116075. doi:10.1016/j.engstruct.2023.116075. [Google Scholar] [CrossRef]
5. Wang J, Cheng B, Yan X, Zhang K, Zhou Z. Structural analysis and optimization of an advanced all-GFRP highway bridge. Structures. 2021;34:3155–71. doi:10.1016/j.istruc.2021.09.064. [Google Scholar] [CrossRef]
6. Rosalba F, Diego F, Egidio R, Carmelo G, Eleni N. Model updating of a historic concrete bridge by sensitivity- and global optimization-based Latin hypercube sampling. Eng Struct. 2019;179:139–60. doi:10.1016/j.engstruct.2018.08.004. [Google Scholar] [CrossRef]
7. He Z, Li W, Salehi H, Zhang H, Zhou H, Jiao P. Integrated structural health monitoring in bridge engineering. Autom Constr. 2022;136:104168. doi:10.1016/j.autcon.2022.104168. [Google Scholar] [CrossRef]
8. Sun P, Hou X, Zheng W, Qin H, Shao G. Risk assessment for bridge structures against blast hazard via a fuzzy-based framework. Eng Struct. 2021;232:111874. doi:10.1016/j.engstruct.2021.111874. [Google Scholar] [CrossRef]
9. Alamdari MM, Khoa DNL, Wang Y, Samali B, Zhu X. A multi-way data analysis approach for structural health monitoring of a cable-stayed bridge. Struct Health Monit. 2019;18:35–48. doi:10.1177/1475921718790727. [Google Scholar] [CrossRef]
10. Guo T, Liu Z, Pan S, Pan Z. Cracking of longitudinal diaphragms in long-span cable-stayed bridges. J Bridge Eng. 2015;20:4015011. doi:10.1061/(ASCE)BE.1943-5592.0000771. [Google Scholar] [CrossRef]
11. Li CX, Tang XS, Xiang GB. Fatigue crack growth of cable steel wires in a suspension bridge: multiscaling and mesoscopic fracture mechanics. Theor Appl Fract Mech. 2010;53:113–26. doi:10.1016/j.tafmec.2010.03.002. [Google Scholar] [CrossRef]
12. Li H, Ou J. The state of the art in structural health monitoring of cable-stayed bridges. J Civ Struct Health Monit. 2016;6:43–67. doi:10.1007/s13349-015-0115-x. [Google Scholar] [CrossRef]
13. Cui C, Xu Y-L, Zhang Q-H. Multiscale fatigue damage evolution in orthotropic steel deck of cable-stayed bridges. Eng Struct. 2021;237:112144. doi:10.1016/j.engstruct.2021.112144. [Google Scholar] [CrossRef]
14. Wang Y, Li ZX, Li AQ. Fatigue crack growth model for assessing reliability of box-girders for cable-stayed bridge combining SHMS with strain data. Theor Appl Fract Mech. 2011;55:60–7. doi:10.1016/j.tafmec.2011.01.006. [Google Scholar] [CrossRef]
15. Abedin M, Mehrabi AB. Health monitoring of steel box girder bridges using non-contact sensors. Structures. 2021;34:4012–24. doi:10.1016/j.istruc.2021.10.021. [Google Scholar] [CrossRef]
16. Wang C. Overview of integrated health monitoring system installed on cable-stayed bridge and preliminary analysis of results. J Croat Assoc Civ Eng. 2021;73:591–604. doi:10.14256/JCE.2940.2020. [Google Scholar] [CrossRef]
17. Cui B, Wu H, Zhao C, Liu J, Guo Z. Steel-concrete composite cable-stayed bridge-main bridge of the Jiangxinzhou Yangtze River Bridge at Nanjing. Struct Eng Int. 2023;33(1):107–14. doi:10.1080/10168664.2021.1999191. [Google Scholar] [CrossRef]
18. Qiang X, Wu Y, Wang Y, Jiang X. Novel crack repair method of steel bridge diaphragm employing Fe-SMA. Eng Struct. 2023;292:116548. doi:10.1016/j.engstruct.2023.116548. [Google Scholar] [CrossRef]
19. Fang L, Fu Z, Ji B, Kainuma S. Research on mixed mode crack drilling under out-of-plane shear in steel bridge deck. Int J Fatigue. 2022;156:106679. doi:10.1016/j.ijfatigue.2021.106679. [Google Scholar] [CrossRef]
20. Orgnoni A, Pinho R, Moratti M, Scattarreggia N, Calvi GM. Critical review and modelling of the construction sequence and loading history of the Morandi bridge. Int J Bridge Eng. 2023;10(3):37–62. [Google Scholar]
21. Scattarreggia N, Orgnoni A, Pinho R, Moratti M, Calvi GM. Failure analysis of the impact of a falling object on a bridge deck. Eng Fail Anal. 2023;148:107229. doi:10.1016/j.engfailanal.2023.107229. [Google Scholar] [CrossRef]
22. Zhang P, Jiang X, Gan H. Research on the overall and local mechanical behaviors of steel box girder cable-stayed bridge via incremental launching construction. Insight–Civ Eng. 2020;6(1):333. doi:10.18282/ice.v6i1.333. [Google Scholar] [CrossRef]
23. Wang C, Wang Y, Cui B, Duan L, Ma N, Feng J. Numerical simulation of distortion-induced fatigue crack growth using extended finite element method. Struct Infrastruct Eng. 2020;16:106–22. doi:10.1080/15732479.2019.1650076. [Google Scholar] [CrossRef]
24. Yazdani M, Habibi H. Residual capacity evaluation of masonry arch bridges by extended finite element method. Struct Eng Int. 2023;33:183–94. doi:10.1080/10168664.2021.1944454. [Google Scholar] [CrossRef]
25. Anghileri M, Biondini F. Formulation and experimental validation of nonlinear finite element analysis of PC bridge deck beams. In: Bridge saf maint manag life-cycle resil sustain. Florida: CRC Press; 2022. [Google Scholar]
26. Ho LV, Khatir S, Roeck GD, Bui-Tien T, Wahab MA. Finite element model updating of a cable-stayed bridge using metaheuristic algorithms combined with Morris method for sensitivity analysis. Smart Struct Syst. 2020;26:451–68. doi:10.12989/sss.2020.26.4.451. [Google Scholar] [CrossRef]
27. Scattarreggia N, Galik W, Calvi PM, Moratti M, Orgnoni A, Pinho R. Analytical and numerical analysis of the torsional response of the multi-cell deck of a collapsed cable-stayed bridge. Eng Struct. 2022;265:114412. doi:10.1016/j.engstruct.2022.114412. [Google Scholar] [CrossRef]
28. Purba MR, Tulus T, Syahputra MR, Sawaluddin S. Implementation of extended finite element method in crack propagation of concrete. J Fundam Math Appl JFMA. 2022;5:1–8. doi:10.14710/jfma.v5i1.14454. [Google Scholar] [CrossRef]
29. Agarwal P, Pal P, Mehta PK. Finite element analysis of reinforced concrete curved box-girder bridges. Adv Bridge Eng. 2023;4:1. doi:10.1186/s43251-023-00080-7. [Google Scholar] [CrossRef]
30. Song T, Yang CS, Scott DW, Shen Y, Li G. Novel finite element analysis of curved concrete box girders using hybrid box elements. J Struct Eng. 2021;147:4020284. doi:10.1061/(ASCE)ST.1943-541X.0002837. [Google Scholar] [CrossRef]
31. Liu Y, Chen Z, Zeng J, Li C, Peng H, Gao Y. Study of secondary effects of fatigue cracks in cross partitions of steel plate reinforced steel box girders. Appl Sci. 2022;12:7198. doi:10.3390/app12147198. [Google Scholar] [CrossRef]
32. Shi Z, Yang S, Pu Q, Zhang Y. Fatigue performance of orthotropic steel decks in long-span cable-stayed steel-box girder railway bridges. J Bridge Eng. 2019;24:4019035. doi:10.1061/(ASCE)BE.1943-5592.0001399. [Google Scholar] [CrossRef]
33. Sharry T, Guan H, Nguyen A, Oh EN, Hoang. Latest advances in finite element modelling and model updating of cable-stayed bridges. Infrastructures. 2022;7(1):8. doi:10.3390/infrastructures7010008. [Google Scholar] [CrossRef]
34. Lin K, Xu Y-L, Lu X, Guan Z, Li J. Cluster computing-aided model updating for a high-fidelity finite element model of a long-span cable-stayed bridge. Earthq Eng Struct Dyn. 2020;49:904–23. doi:10.1002/eqe.3270. [Google Scholar] [CrossRef]
35. Sharry T, Guan H, Hoang N, Nguyen A, Oh E. Finite element model updating of a cable-stayed bridge using structural health monitoring data. In: Proceedings of the 10th International Conference on Structural Health Monitoring of Intelligent Infrastructure (SHMII-102021; Porto, Portugal. Available from: https://web.fe.up.pt/~shmii10//ficheiros/eBook_SHMII_2021.pdf. [Accessed 2024]. [Google Scholar]
36. Xing C, Zhou C. Finite element modeling of crack growth in thin-wall structures by method of combining sub-partition and substructure. Eng Fract Mech. 2018;195:13–29. doi:10.1016/j.engfracmech.2018.03.023. [Google Scholar] [CrossRef]
37. Yan B, Li L, Qiu M, Zhu Y, Yang P, Qin G, et al. Study on transverse structural performance of large cantilever steel-UHPC composite bridge deck. J Constr Steel Res. 2024;217:108667. doi:10.1016/j.jcsr.2024.108667. [Google Scholar] [CrossRef]
38. Schlicke D, Tue NV, Gomes J, Sousa C, Azenha M. Analytical assessment of restraint forces and crack widths in end-restrained building slabs. Eng Struct. 2020;224:111218. doi:10.1016/j.engstruct.2020.111218. [Google Scholar] [CrossRef]
Cite This Article
 Copyright © 2025 The Author(s). Published by Tech Science Press.
This work is licensed under a Creative Commons Attribution 4.0 International License , which permits unrestricted use, distribution, and reproduction in any medium, provided the original work is properly cited.
 Downloads
 Citation Tools