
 Submit a Paper
 Propose a Special lssue
 Open Access
ARTICLE

Optimizing Computed Tomography Processing Parameters for Accurate Detection of Internal Defects in Reinforced Concrete
1 School of Civil Engineering Architecture and Environment, Department of Architectural Engineering, Hubei University of Technology, Wuhan, 430068, China
2 Key Laboratory of Intelligent Health Perception and Ecological Restoration of Rivers and Lakes, Ministry of Education, Hubei University of Technology, Wuhan, 430068, China
3 Changjiang International Water Conservancy and Hydropower Engineering Construction Co., Ltd., Wuhan, 430040, China
* Corresponding Author: Yueshun Chen. Email:
Structural Durability & Health Monitoring 2025, 19(3), 575-592. https://doi.org/10.32604/sdhm.2024.057005
Received 05 August 2024; Accepted 22 October 2024; Issue published 03 April 2025
 View Full Text
 Download PDF
Abstract
Computed tomography (CT) can inspect the internal structure of concrete with high resolution, but improving the accuracy of measurements remains a key challenge due to the reliance on complex image processing and significant manual intervention. This study aims to optimize CT scanning parameters to enhance the accuracy of measuring crack widths and rebar volumes in reinforced concrete. Nine sets of specimens, each with varying rebar diameters and concrete cover thicknesses, were scanned before and after corrosion using an Optima CT scanner, followed by three-dimensional reconstructions using Avizo software. The effects of threshold values and “Erosion” coefficients on measurement accuracy were evaluated. The results demonstrated that an optimal lower threshold of 2950, combined with an ‘Erosion’ coefficient of 6, effectively limits the measurement error of rebar volumes to within 1%. The optimal threshold for measuring crack widths was influenced by the crack width, rebar diameter, and concrete cover thickness. Additionally, an optimized formula for determining crack measurement thresholds was proposed. This study significantly improves the accuracy of CT-based non-destructive testing (NDT) techniques, providing valuable insights for structural health monitoring (SHM).Keywords
The corrosion of rebar leads to the premature failure of reinforced concrete structures, significantly reducing their durability [1]. Therefore, detecting rebar corrosion within concrete is a critical task. However, current NDT methods still face significant challenges in practical applications. For example, infrared thermography is highly sensitive to external temperature conditions, making it susceptible to environmental noise interference [2]; ultrasonic rebound testing results are often influenced by the surface roughness of concrete [3]; ground-penetrating radar has limited resolution for small defects and struggles with accuracy when detecting complex structures [4]; and the metal magnetic memory (MMM) method is mainly suitable for ferromagnetic materials, with limited resolution in complex structures and susceptibility to external magnetic field interference [5]. Moreover, fibre Bragg grating (FBG) sensor technology requires embedding sensors within the material during construction, which limits its applicability in existing structures and complicates installation [6].
In contrast, CT scanning, as an NDT method, offers significant advantages in overcoming these limitations. It provides detailed three-dimensional imagery of the internal structure of concrete, enabling more accurate detection of rebar corrosion, cracks, and voids [7]. Unlike traditional NDT methods, CT scanning can capture micro-level damage and provide data for detailed meoscale analysis of concrete structures [8].
Currently, the primary research areas utilizing CT scanning for concrete include meso-damage analysis within concrete [9–12], the examination of internal aggregate microscopic models and mechanical properties [13–16], and the investigation of crack and pore evolution during the corrosion of reinforced concrete [17–20]. Additionally, studies have explored the corrosion conditions and damage mechanisms of reinforcing rebar in various environments [21–24]. CT technology has also been applied to studying the freeze-thaw cycle of concrete under internal structural changes [25], the distribution of initial defects in concrete components [26], and the NDT of concrete components [27,28].
Despite its widespread application in concrete research, CT-based detection is susceptible to errors arising from improper threshold selection, image resolution, and manual processing. For example, Ren et al. [29] noted that segmenting concrete CT images of aggregates requires significant manual intervention, leading to uncertain accuracy. Homel et al. [30] observed substantial variations in pore contrast across different locations during NDT of concrete components, complicating detection. Zhao et al. [31] found that threshold segmentation results are influenced by CT image resolution. Hao et al. [32] emphasized the need for extensive experiments to determine the optimal threshold for crack segmentation, highlighting the potential for human error in processing method selection. Yu et al. [33] stressed the high degree of randomness introduced by heavy reliance on human selection for determining the optimal threshold in concrete pore recognition methods. Ning et al. [34] cautioned that excessively high CT resolution could lead to inaccurate modelling of concrete crack evolution, while too low a resolution could result in overexposure. Therefore, improving the accuracy of threshold segmentation and reducing manual intervention are crucial areas for further research.
To address these challenges, this study optimizes the CT scanning parameters to enhance the accuracy of detecting internal defects in concrete, such as rebar volume and crack width. The Optima CT scanner [35] was used to scan concrete specimens before and after corrosion, with three-dimensional reconstructions performed using Avizo software [36]. By adjusting image thresholds and other key parameters, this study primarily analyzes the impact of these parameters on the accuracy of measuring crack width and rebar volume.
The main contributions of this study are as follows: First, it provides systematic verification of the effects of various parameters on measurement accuracy, offering essential data support for the NDT of concrete structures. Second, an optimized parameter selection scheme is proposed, clearly defining criteria for selecting key parameters, significantly reducing manual intervention and enhancing the reliability and repeatability of the detection process. The structure of this paper is as follows: Chapter 2 introduces the experimental system and methods, Chapter 3 describes the image greyscale value analysis and threshold segmentation, and Chapters 4 and 5 respectively discuss the effects of parameters on measuring crack width and rebar volume, propose an optimized parameter scheme, and conduct experimental verification, and Chapter 6 summarizes the research findings and presents future research directions.
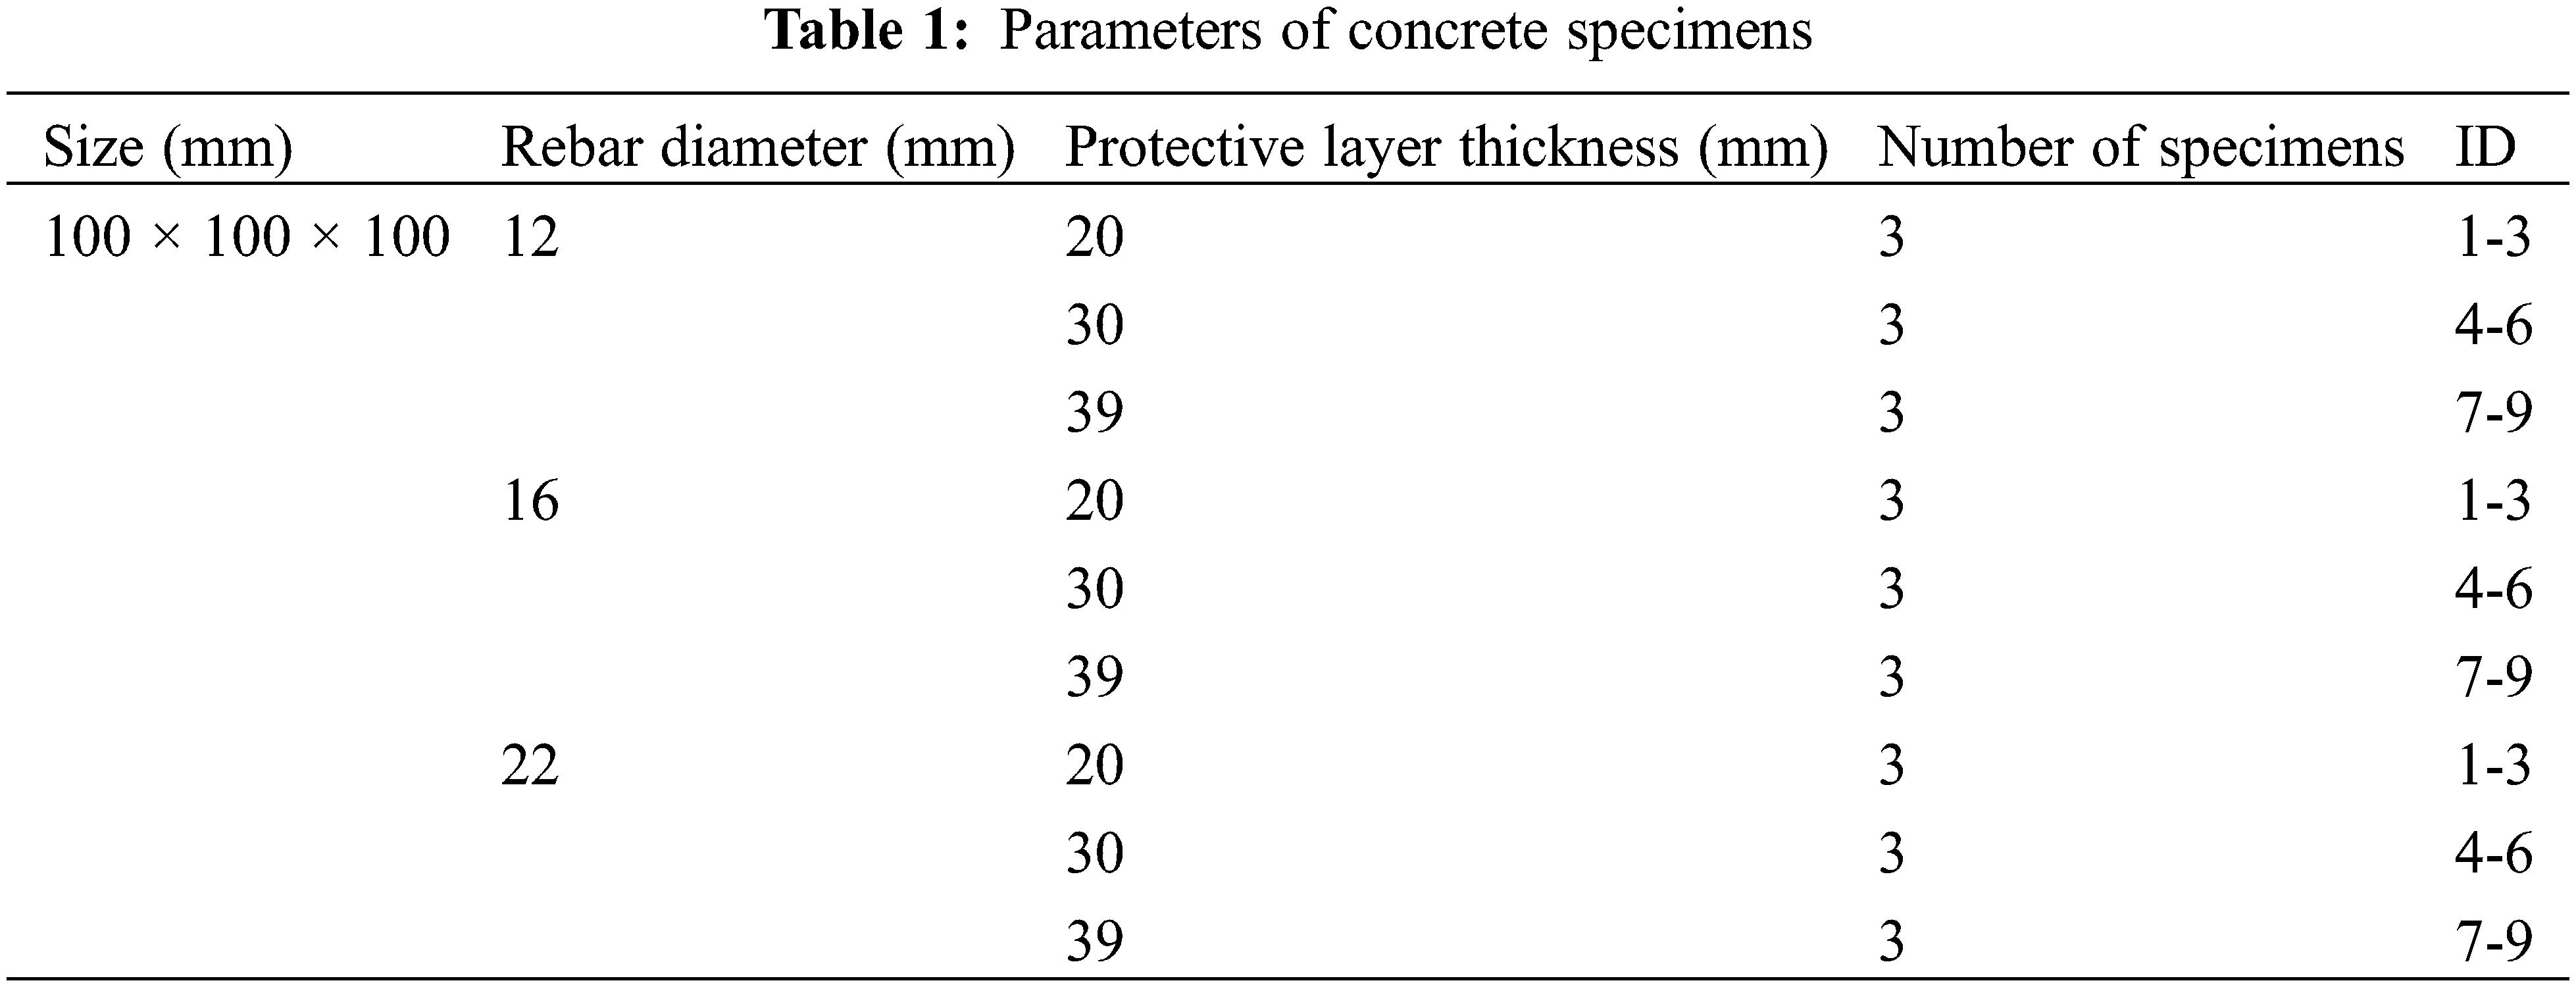
Custom moulds were employed to ensure precise positioning of rebar within the concrete. The concrete used was of strength grade C30, and the specimens were cubic with side lengths of 100 mm. To maintain consistency with standard engineering practices, cover thicknesses of 20, 30, and 39 mm were selected, representing typical values used in reinforced concrete structures to provide sufficient protection for rebar against environmental exposure and corrosion. These cover thicknesses are by design requirements for structural elements exposed to varying degrees of environmental stress. Similarly, rebar diameters of 12, 16, and 22 mm (HRB400) were chosen to reflect the range of sizes typically used in reinforced concrete structures, from smaller elements like slabs to larger components such as beams and columns. This selection ensures that the experimental setup accurately simulates real-world conditions across a variety of structural applications. A total of nine groups of specimens were prepared, with three specimens in each group, as illustrated in Table 1.
2.2 CT Scanning and Image Processing
The experiment utilized CT scanning technology to assess the volumetric changes in internal pores and reinforcement within a concrete specimen before and after cracking. A high-resolution Optima CT scanner, depicted in Fig. 1, was used for this purpose. The scanner’s parameters were set to a current of 10 mA and a voltage of 120 kV. The selection of 120 kV is critical, as higher voltage produces X-rays with greater energy, which is necessary for penetrating dense concrete material to obtain clear images of both internal pores and rebar. This voltage setting ensures sufficient contrast between the concrete matrix, cracks, and rebar, thereby enabling precise measurements. The specimen was centrally positioned on the scanning platform, with an X-ray scanning output spacing of 0.625 mm. Each scan produced cross-sectional slice images with a resolution of 0.391 mm × 0.391 mm.
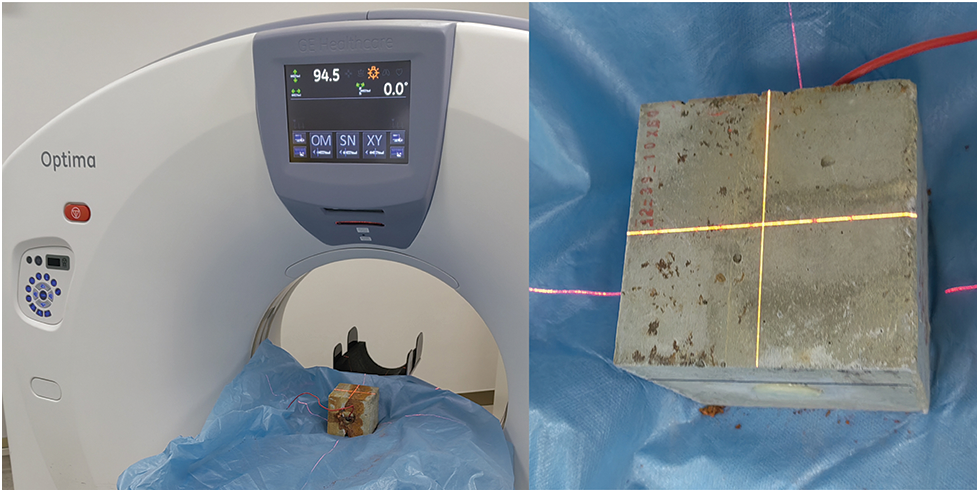
Figure 1: CT system
Upon completing the CT scan, the data were imported into 3D visualization software for reconstruction and processing. Due to the varying density values of concrete, reinforcement, and pores, as well as their different X-ray absorption capacities, the CT images displayed distinct greyscale values. The software used these greyscale value differences to segment and accurately analyze the internal structure of the concrete. After reconstruction, the “Ring Artifact Removal” command was employed, applying median filtering to eliminate ring artefacts and noise from each CT image. Next, the “Extract Subvolume” command was used to isolate the desired section of the concrete specimen. Finally, the “Resample” command enhanced the pixels of the extracted concrete specimen by subdividing its pixel slices using the Lanczos interpolation algorithm. This algorithm interpolates the image along both the X and Y axes and mitigates ringing and jagged effects effectively [37]. The formula is provided as follows [38]:
where L(x) represents the reconstructed kernel of the filter, a is the size parameter that determines the kernel’s size and x represents an image sample.
The enhanced resolution CT image of the concrete specimen revealed finer details and smoother transitions. By first enhancing the resolution and then applying threshold segmentation, the accuracy in delineating the concrete specimen’s boundaries was significantly improved. Figs. 2 and 3 illustrate this: Fig. 2 presents the original image of the specimen slices, while Fig. 3 displays the enhanced resolution image. It is evident that resolution resolution enhancement significantly increased the accuracy of threshold segmentation and subsequent measurements.

Figure 2: Pre-upgrade resolution state
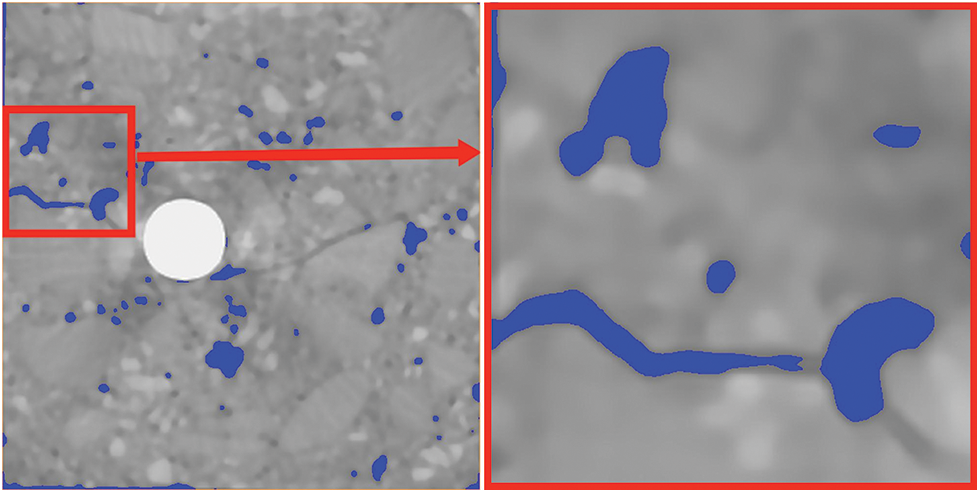
Figure 3: Post-resolution upgrade
2.3 Experimental Process Summary
Fig. 4 provides a clear representation of the sequence of steps involved in image reconstruction and analysis, outlining the preparation of concrete specimens, CT scanning, image reconstruction and processing, and subsequent data analysis. The flowchart ensures that each step is carried out systematically, enhancing the consistency and reliability of the outcomes.
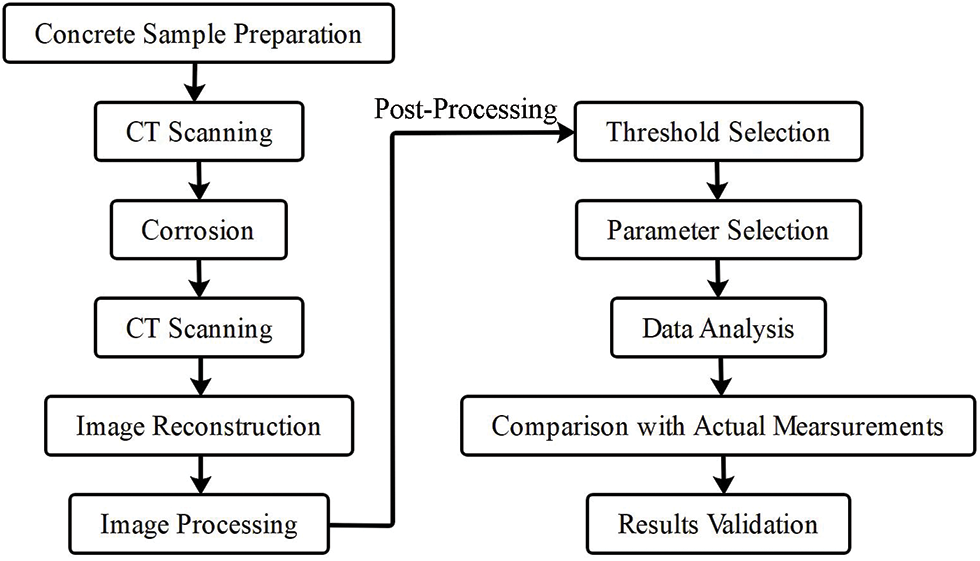
Figure 4: Experimental workflow diagram
3 Analysis of Image Greyscale Values
Statistical analysis of the greyscale values from a series of CT images allows for plotting greyscale variation curves for each specimen. For specimens with the same rebar diameter and concrete cover thickness, these greyscale variation curves demonstrate consistency (see Fig. 5a). However, for specimens with different rebar diameters and cover thicknesses, discrepancies appear in these curves, although the greyscale values at critical nodes remain relatively stable (see Fig. 5b,c).
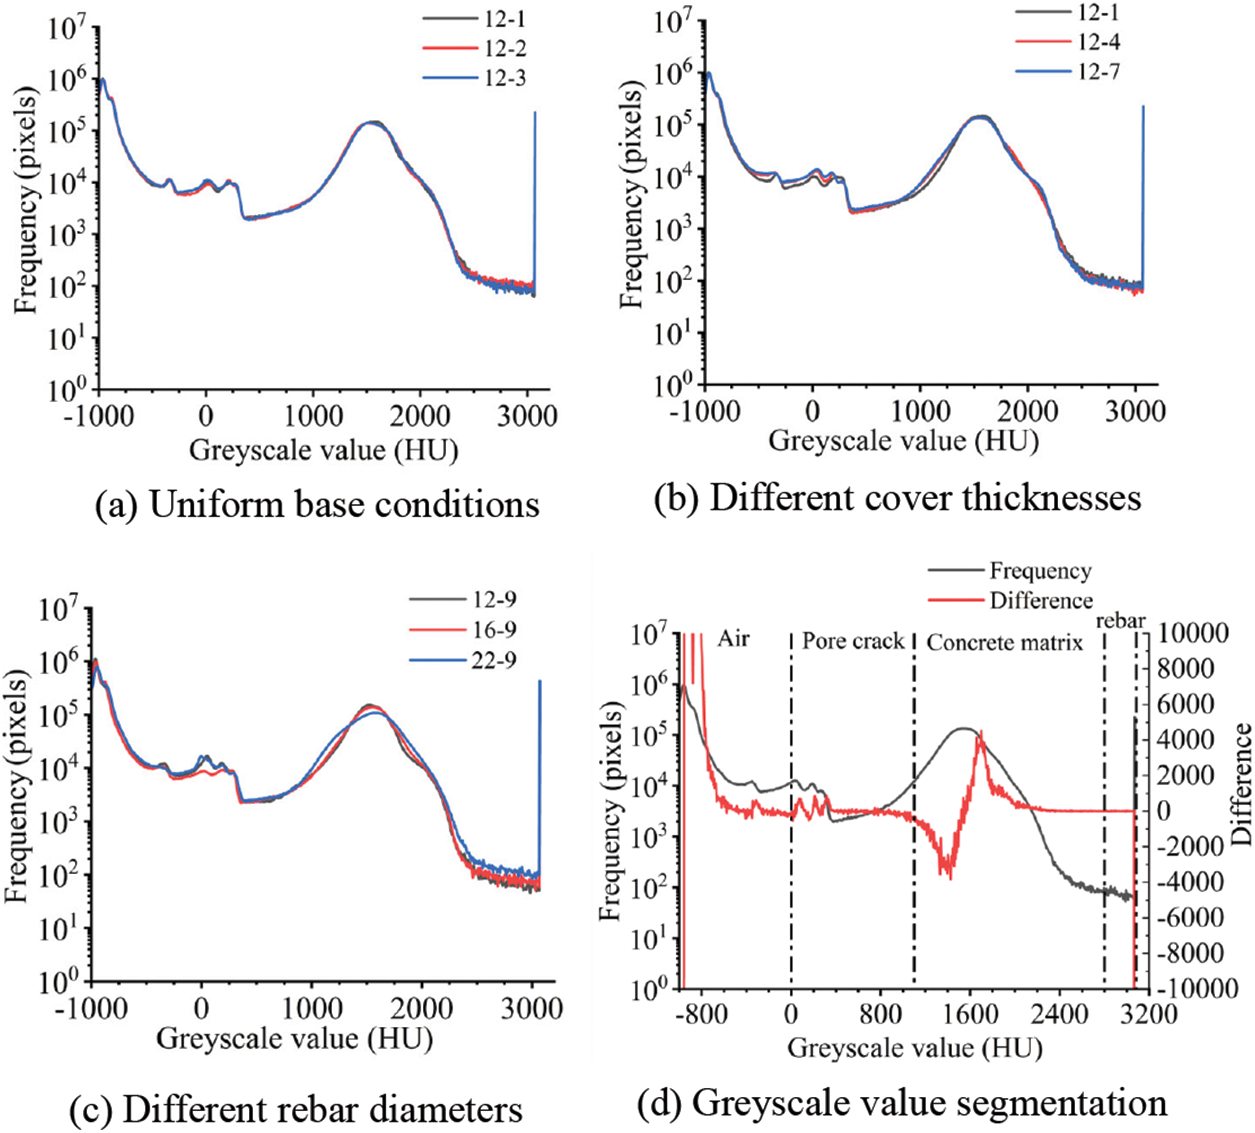
Figure 5: Greyscale value change
By analyzing the critical nodes and identifying significant changes in greyscale values in the vicinity of these nodes [39], along with the differences in greyscale value transitions, we can determine the greyscale value ranges corresponding to air, pore cracks, concrete matrix, and rebar (Fig. 5d). Once these ranges are defined, selecting appropriate thresholds can segment different material regions, as illustrated in Fig. 6. Although multiple thresholds within these greyscale value ranges can segment the corresponding regions, the resulting measurements from different thresholds show inconsistencies. Therefore, further refinement of threshold selection is essential to determine the optimal threshold, thereby ensuring accurate segmentation.
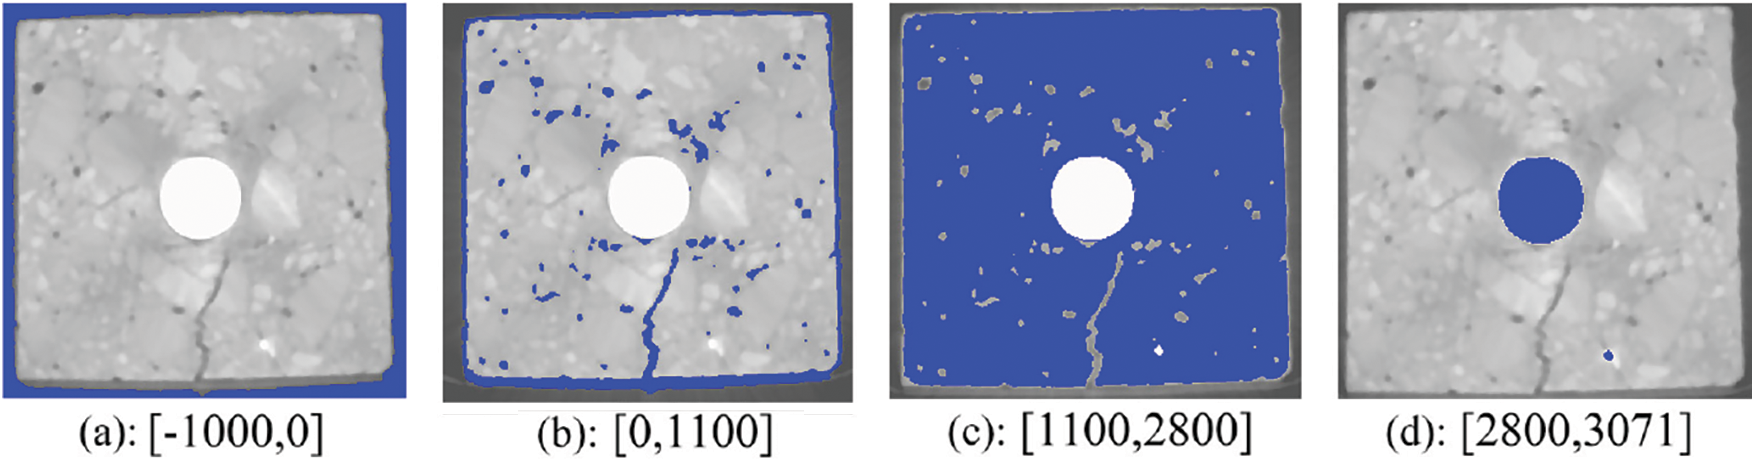
Figure 6: Thresholds selected in different greyscale value intervals
4 Crack Measurement of Concrete Specimens
4.1 Threshold Measurement Spacing Determination
Measuring crack width using 3D visualization software requires precise identification of the corresponding crack area through threshold segmentation. This involves adjusting the threshold interval size in the “Interactive Thresholding” command, ensuring that CT image parts with greyscale values within the selected threshold are highlighted in blue. In the CT image, the greyscale value correlates directly with brightness; higher greyscale values indicate brighter areas, while lower values suggest darker regions. For example, rebar appears bright, while holes and cracks are represented by darker shades. By selecting different threshold intervals, one can effectively isolate and segment the rebar, cracks, and voids.
During the experiment, it was observed that the threshold intervals needed for precise crack width measurement varied among different concrete specimens. This indicated that a fixed threshold interval was insufficient for accurately measuring the crack widths of all concrete specimens. The adjustable range of threshold intervals for cracks varied across different concrete specimens, and changes in thresholds within these intervals affected the measured crack widths. The threshold interval within which a crack can be selected is designated as the reasonable observation threshold interval for cracks. To further investigate the relationship between crack measurement and threshold value, this experiment measures the crack widths of three groups of concrete specimens across varying threshold values, with a threshold interval adjustment of 50 units.
4.2 Selection of the Upper Threshold of the Reasonable Threshold Observation Interval
The greyscale value range corresponding to the crack pore image is narrow. When selecting the threshold interval, the lower threshold is typically set to the minimum greyscale value, and only the upper threshold is varied for crack width measurement. For example, in a concrete specimen with a 16 mm rebar diameter, the cracked part is isolated as shown in Fig. 7. The image is processed according to the established procedure, and the upper threshold limit is varied by increments of 50 units while keeping the lower threshold at the minimum greyscale value. This adjustment is applied to the same CT image’s threshold value.
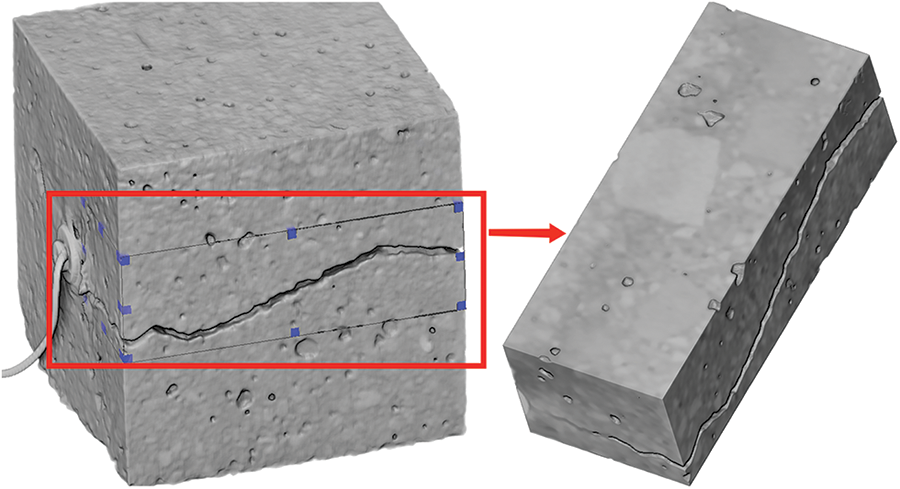
Figure 7: Intercepted part
A reasonable observation of the concrete specimen’s cracks is achieved when the upper threshold ranges from 300 to 850. If the upper threshold is less than 300, some cracks may be overlooked (Fig. 8). Conversely, a value greater than 850 may result in over-selection of cracks (Fig. 9). Therefore, for this concrete specimen, the upper threshold limit for crack measurement lies between 300 and 850. When applying this method to three sets of concrete specimens, the data for the upper threshold range for reasonable observation are presented in Figs. 10 and 11.
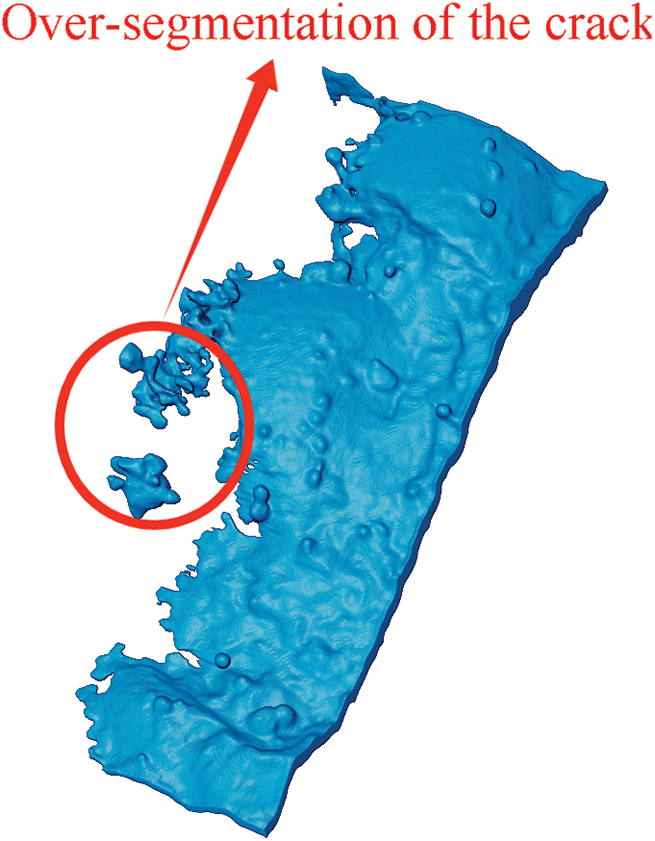
Figure 8: Threshold taken as 250
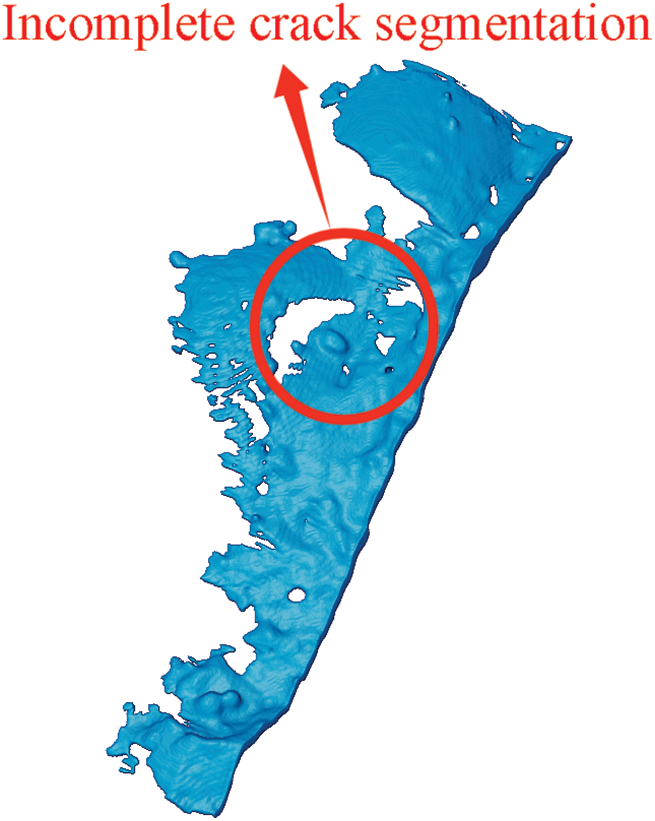
Figure 9: Threshold taken as 900
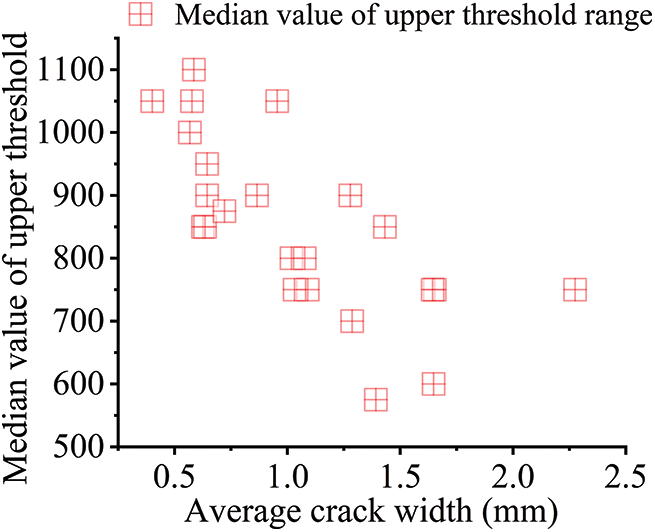
Figure 10: Median value of the upper threshold range
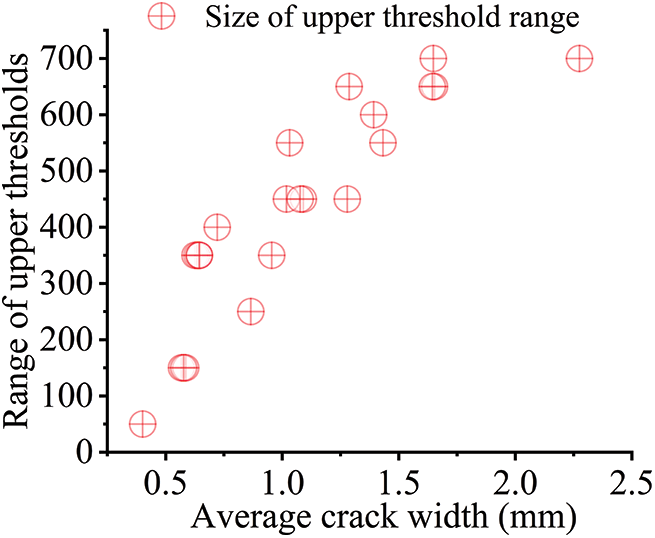
Figure 11: Size of upper threshold range
Figs. 10 and 11 clearly show a pattern: as crack width increases, the median value of the upper range of the reasonable observation threshold for cracks decreases, while the overall range of variation for this threshold widens. Notably, when the average crack width reaches 1.5 mm, the range of variation stabilizes at approximately 600 to 700, indicating a suggesting a saturation point beyond which further changes in crack width do not significantly impact the observation threshold.
4.3 Measurement Results of Different Thresholds for a Single Crack
To investigate the relationship between crack measurements and threshold values, we observed the upper threshold of the threshold over a broad range of variations in three specimen groups with varying rebar diameters. The measurement location was set at a distance of 1 cm from the specimen boundary. The upper threshold limit was adjusted in increments of 50, and the crack width was repeatedly measured at the same location, with a measurement precision of 0.001 mm. The actual crack widths were determined using the ZBL crack width gauge, with the measurement locations identical to those used for the software measurements, both with a precision of 0.001 mm. The findings are presented in Fig. 12 below.
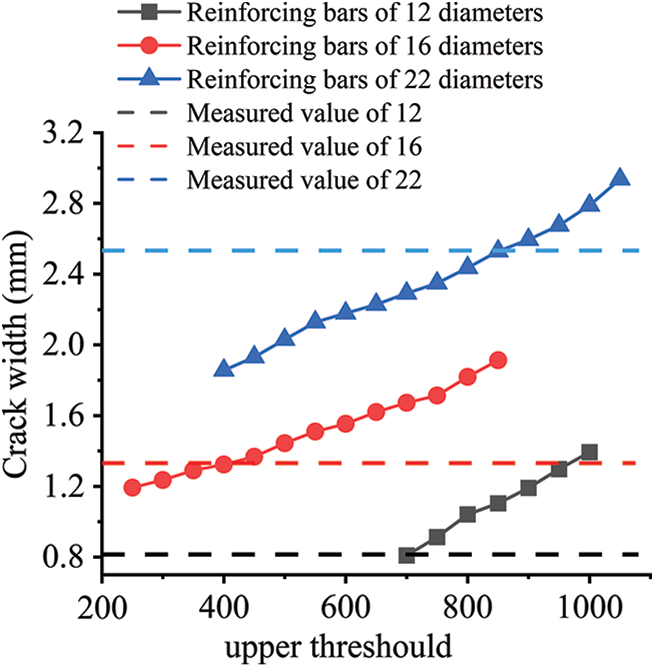
Figure 12: Crack widths obtained with different upper thresholds
Fig. 12 demonstrates that the measured crack widths increased as the upper threshold limit rose for all three groups of concrete specimens. Specifically, for the three groups of concrete specimens, the measured crack widths were very close to the actual crack widths when upper threshold values of 700, 400, and 850 were applied, respectively. These thresholds are identified as the optimal thresholds for the respective concrete specimens. To validate these optimal thresholds and assess their applicability in measuring crack widths elsewhere in the concrete specimens, the upper threshold identified in Fig. 12 were applied to corresponding cracks in the three concrete specimens. Using a concrete specimen with a rebar diameter of 16 mm as a case study, the 400 upper threshold was employed to assess crack widths at distances of 5 cm and 9 cm from the specimen’s boundary. Figs. 13 and 14 present the comparative results of the actual and software-based crack measurements.
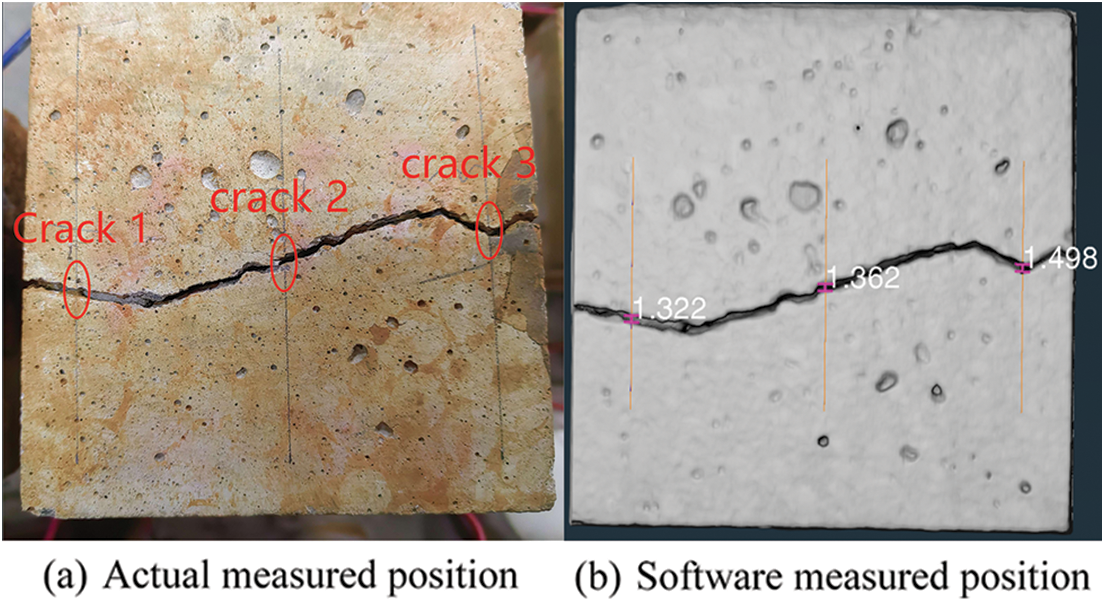
Figure 13: Software measured crack width
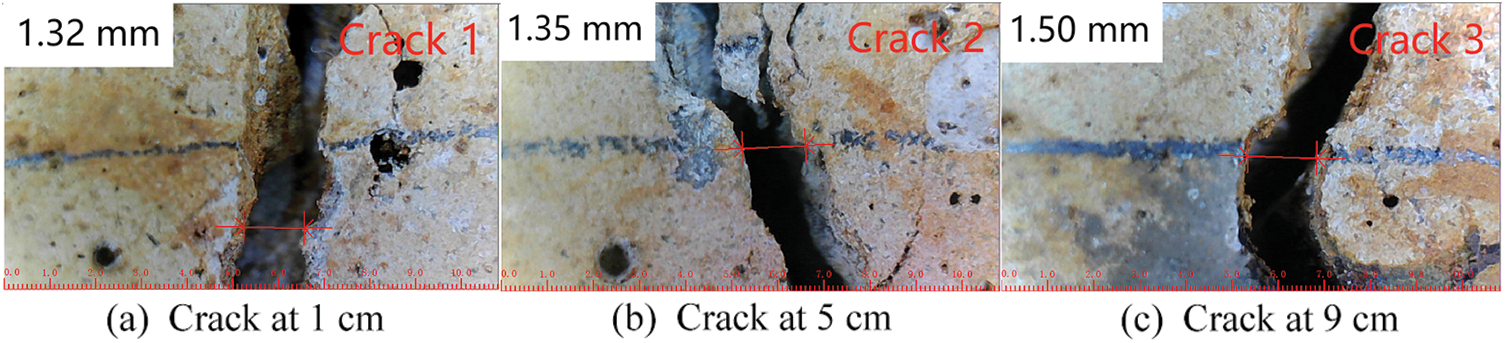
Figure 14: Actual measured crack width
The results for the other two specimens, measured using the aforementioned method, are presented in Table 2 below.
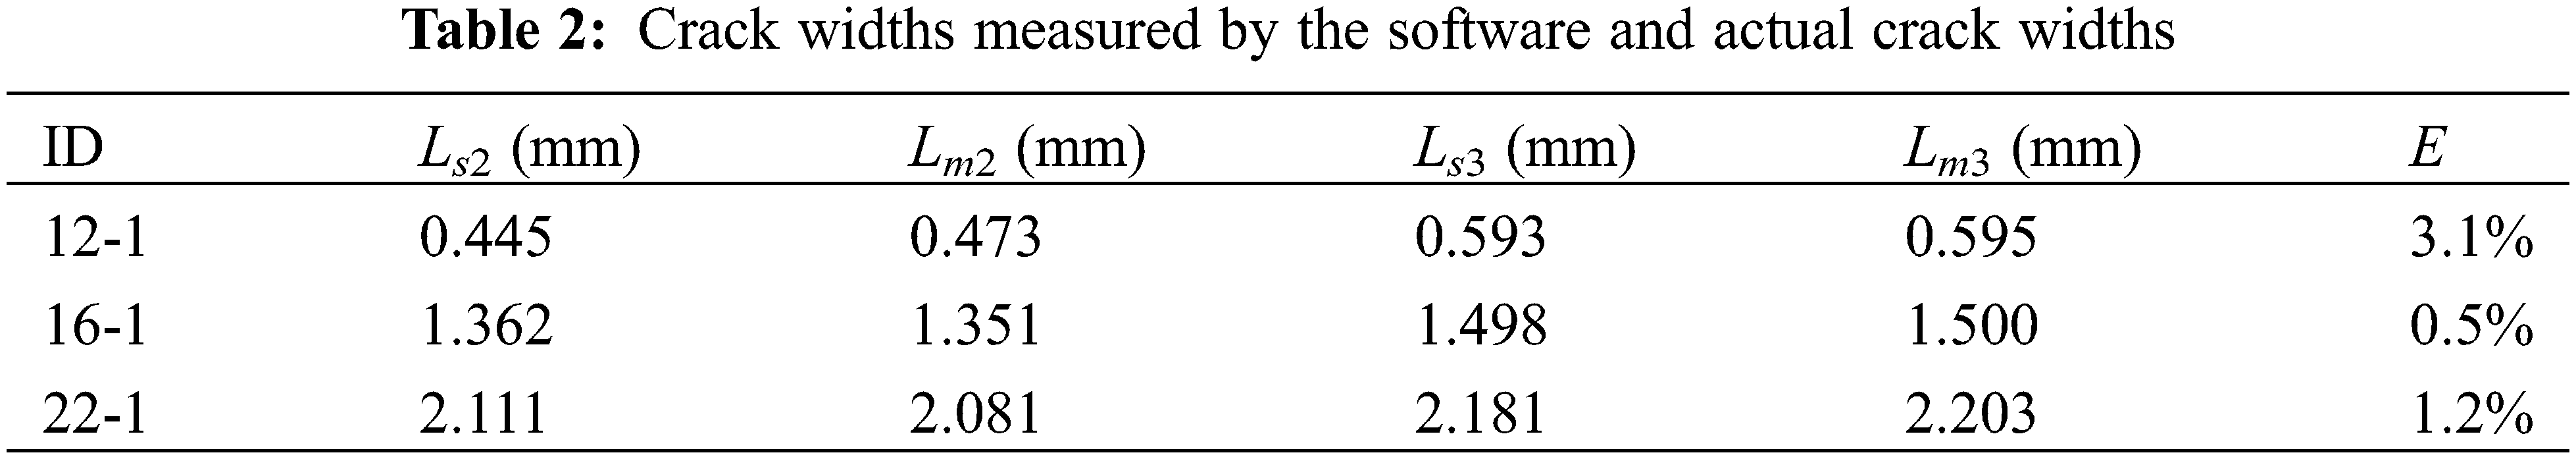
In the table:
where E represents the magnitude of the error, Lm represents the measured value from actual measurement, and Ls represents the measured value obtained from software.
Table 2 shows that when using the optimal threshold values identified for a single crack in Fig. 12, the discrepancies between the software-measured crack sizes and the actual crack widths remain below 5%. The close agreement between the test results and measured outcomes confirms the feasibility of using a single specimen to determine all crack widths by applying an optimal threshold value.
4.4 Derivation of the Optimal Threshold Formula for Cracks
An experiment was conducted to determine the factors influencing the optimal threshold size for crack detection in concrete specimens. This involved manually selecting thresholds to measure cracks and determining the optimal threshold for each concrete specimen. Analysis revealed that the relationship between average crack width and optimal threshold was not straightforward. Instead, other factors, such as the reinforcement bar diameter and the thickness of the concrete protective layer, were considered. These factors were incorporated into a model, and multiple fittings were performed to obtain the results presented in Fig. 15.
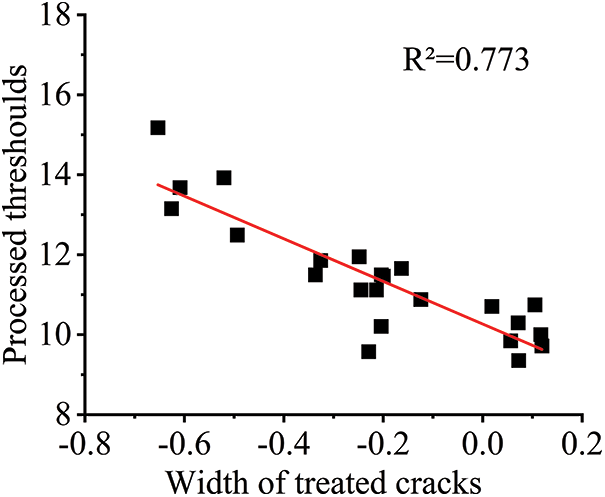
Figure 15: Crack width and optimum threshold after treatment
The following equation (Eq. (3)) was derived after introducing the regression equation:
The subsequent collation yielded the following relationship between the optimal threshold and the average crack width, protective layer thickness, and reinforcement diameter:
where Y—Optimal threshold value
L—Average crack width
c—Protective layer thickness
d—Diameter of reinforcement
Analysis of Fig. 15 reveals that the optimal threshold size depends on the average crack width, protective layer thickness, and reinforcement bar diameter. Accounting for human operation error, Eq. (4) can be used to predict the optimal threshold.
5 Volume Measurement of Concrete Reinforcement
5.1 Selection of the Lower Threshold Limit
The high greyscale values associated with rebar in CT imagery require careful consideration of threshold intervals when using software to measure volume. The upper threshold of this interval is typically fixed at the maximum value, whereas the lower threshold is adjusted to ensure an accurate assessment of the rebar volume.
After numerous experiments, it was observed that increasing the resolution of the rebar image leads to a decrease in the brightness of the rebar’s boundary. For example, with a 22 mm diameter rebar, setting an inappropriate lower threshold limit poses a significant issue. A high value, as shown in Fig. 16, results in incomplete selection of the rebar, while a low value, as shown in Fig. 17, allows for complete selection but leads to an overestimation of the rebar volume compared to the actual size. To address this, the “Erosion” [40] command was employed. After threshold segmentation, the “Erosion” command is used to adjust the rebar volume. The outermost part of the rebar is then subtracted and remeasured, as demonstrated in Fig. 18. This approach effectively addresses challenges with threshold value selection and brightness reduction, ensuring accurate measurement of the rebar volume.
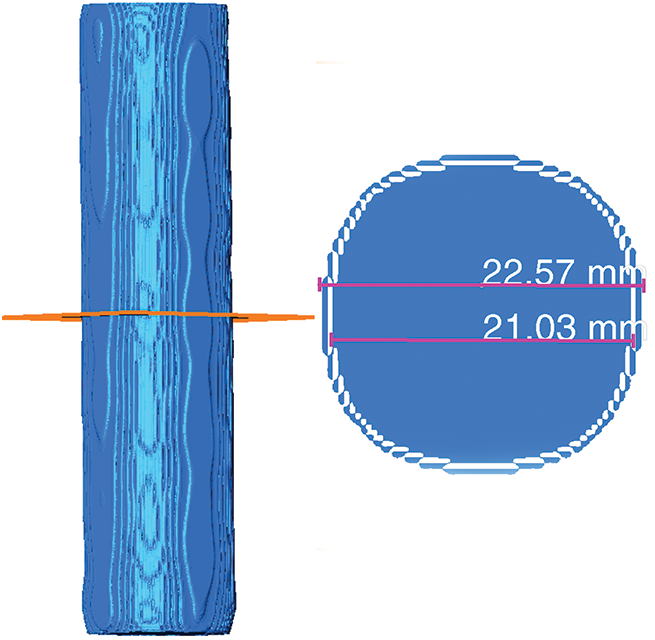
Figure 16: Larger threshold
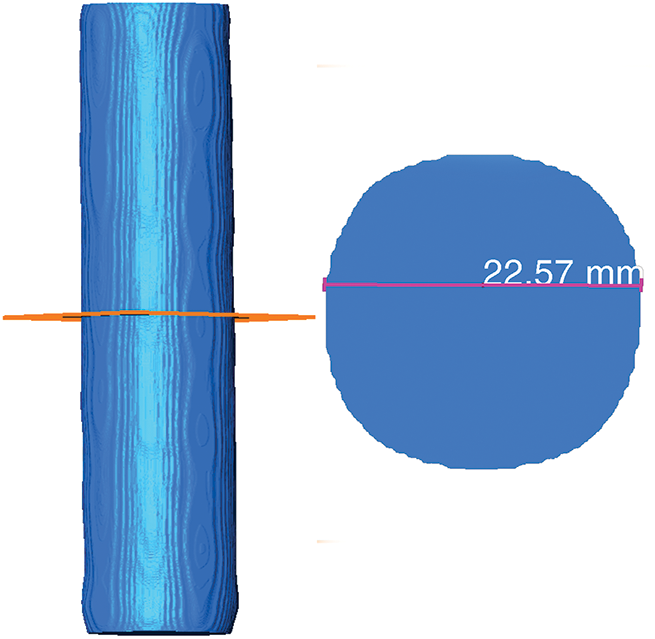
Figure 17: Smaller threshold
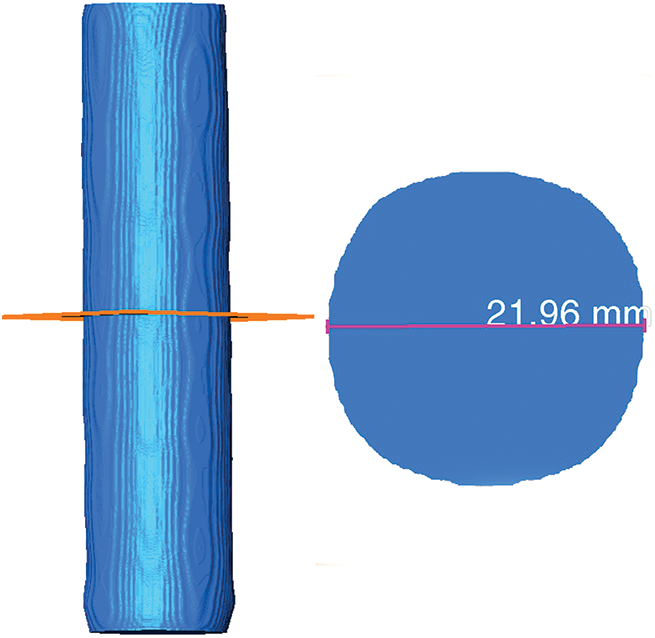
Figure 18: “Erosion” processed
To determine the optimal lower threshold and processing factor for the “Erosion” command, various lower thresholds were tested to measure the rebar volumes for three different diameters. The comparison with the actual rebar volumes yielded the results presented in Fig. 19.
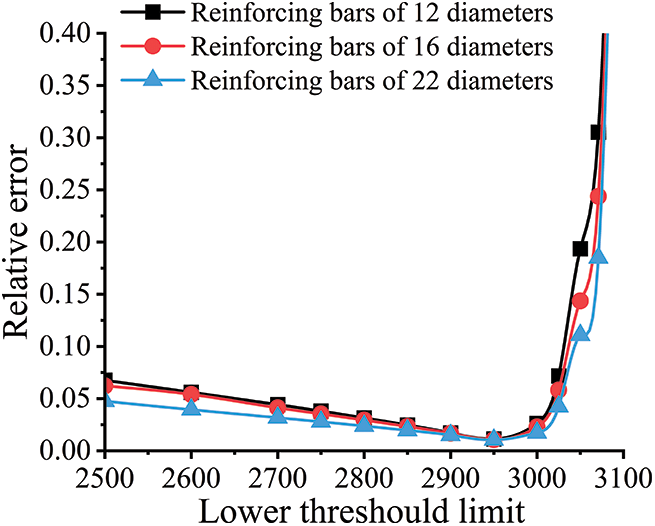
Figure 19: Error magnitude in rebar volume measurement at different thresholds
Fig. 19 illustrates that when using suitable “Erosion” command coefficients, the error in rebar volume measurement decreases as the lower threshold value increases, up to a value of 2900. Beyond an upper threshold of 3000, the error sharply increases, with the minimum error observed at a lower threshold of 2950. Additionally, for different rebar diameters, larger diameters result in a less significant impact of the threshold value on rebar volume calculation error.
5.2 Selection of “Erosion” Directive Factors
Using a lower threshold value with a minimum error of 2950, different “Erosion” command coefficients were applied to process the aforementioned three rebar specimens, yielding the data depicted in Figs. 20 and 21. The findings reveal a direct correlation between the command processing coefficients and the calculated volume of rebar, with increasing coefficients leading to a decrease in volume. Additionally, the impact of the “Erosion” command coefficient on volume calculation error diminishes as the rebar diameter increases. Notably, when the ‘Erosion’ command coefficient is set to 6, the volume calculation error for all three bars is minimized.
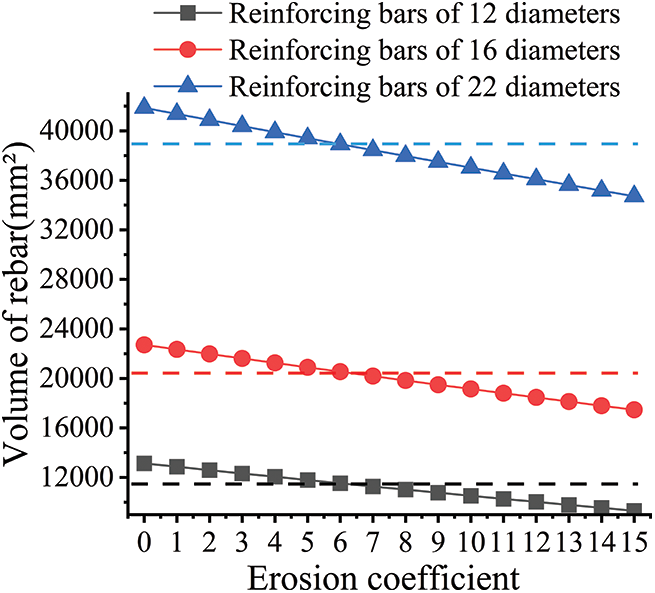
Figure 20: Effect of “Erosion” on volume
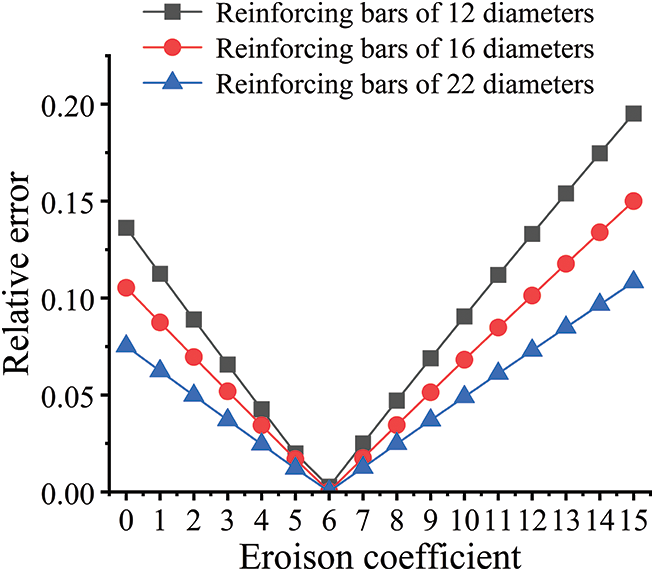
Figure 21: Effect of “Erosion” on error in volume
5.3 Optimal Lower Threshold and “Erosion” Command Coefficient
Since the aforementioned “Erosion” command coefficient is solely derived from a lower threshold limit of 2950, which presents certain limitations, it is essential to consider both the lower threshold limit and the “Erosion” command coefficient simultaneously. By selecting a lower threshold value close to 2950 and an “Erosion” command coefficient close to 6, the results shown in Fig. 22 indicate that, even when both the lower threshold value and the “Erosion” command coefficient are adjusted simultaneously, the relative error in the calculated rebar volume is minimized when the lower threshold is set to 2950 and the “Erosion” command coefficient is set to 6.
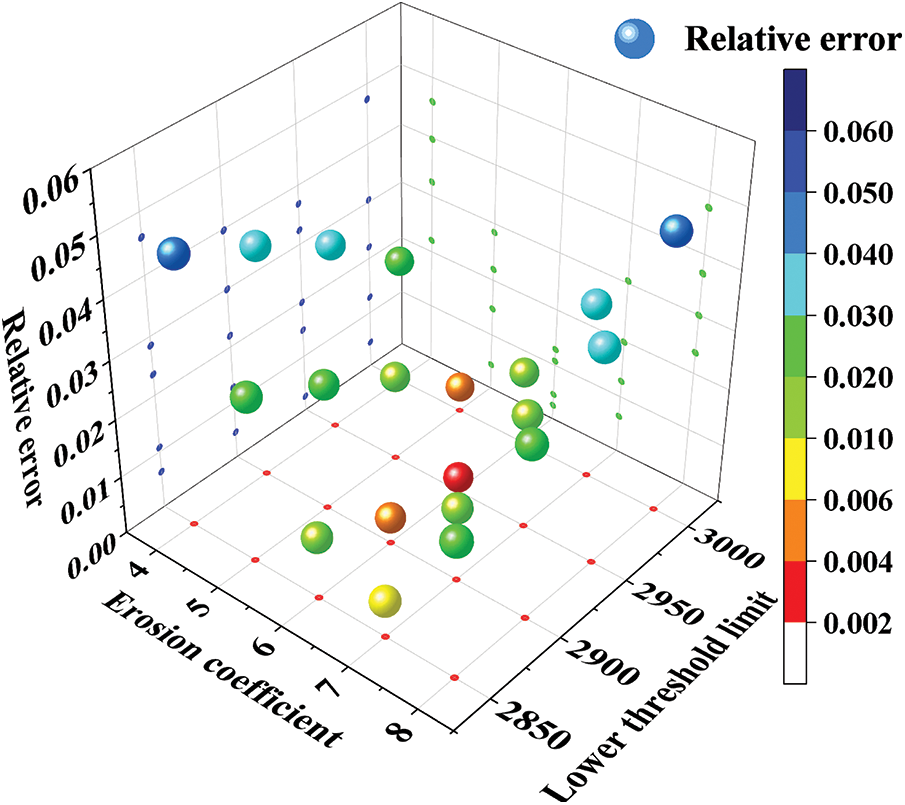
Figure 22: Reinforcing rebar volume error size
5.4 Analysis of Measurement Results
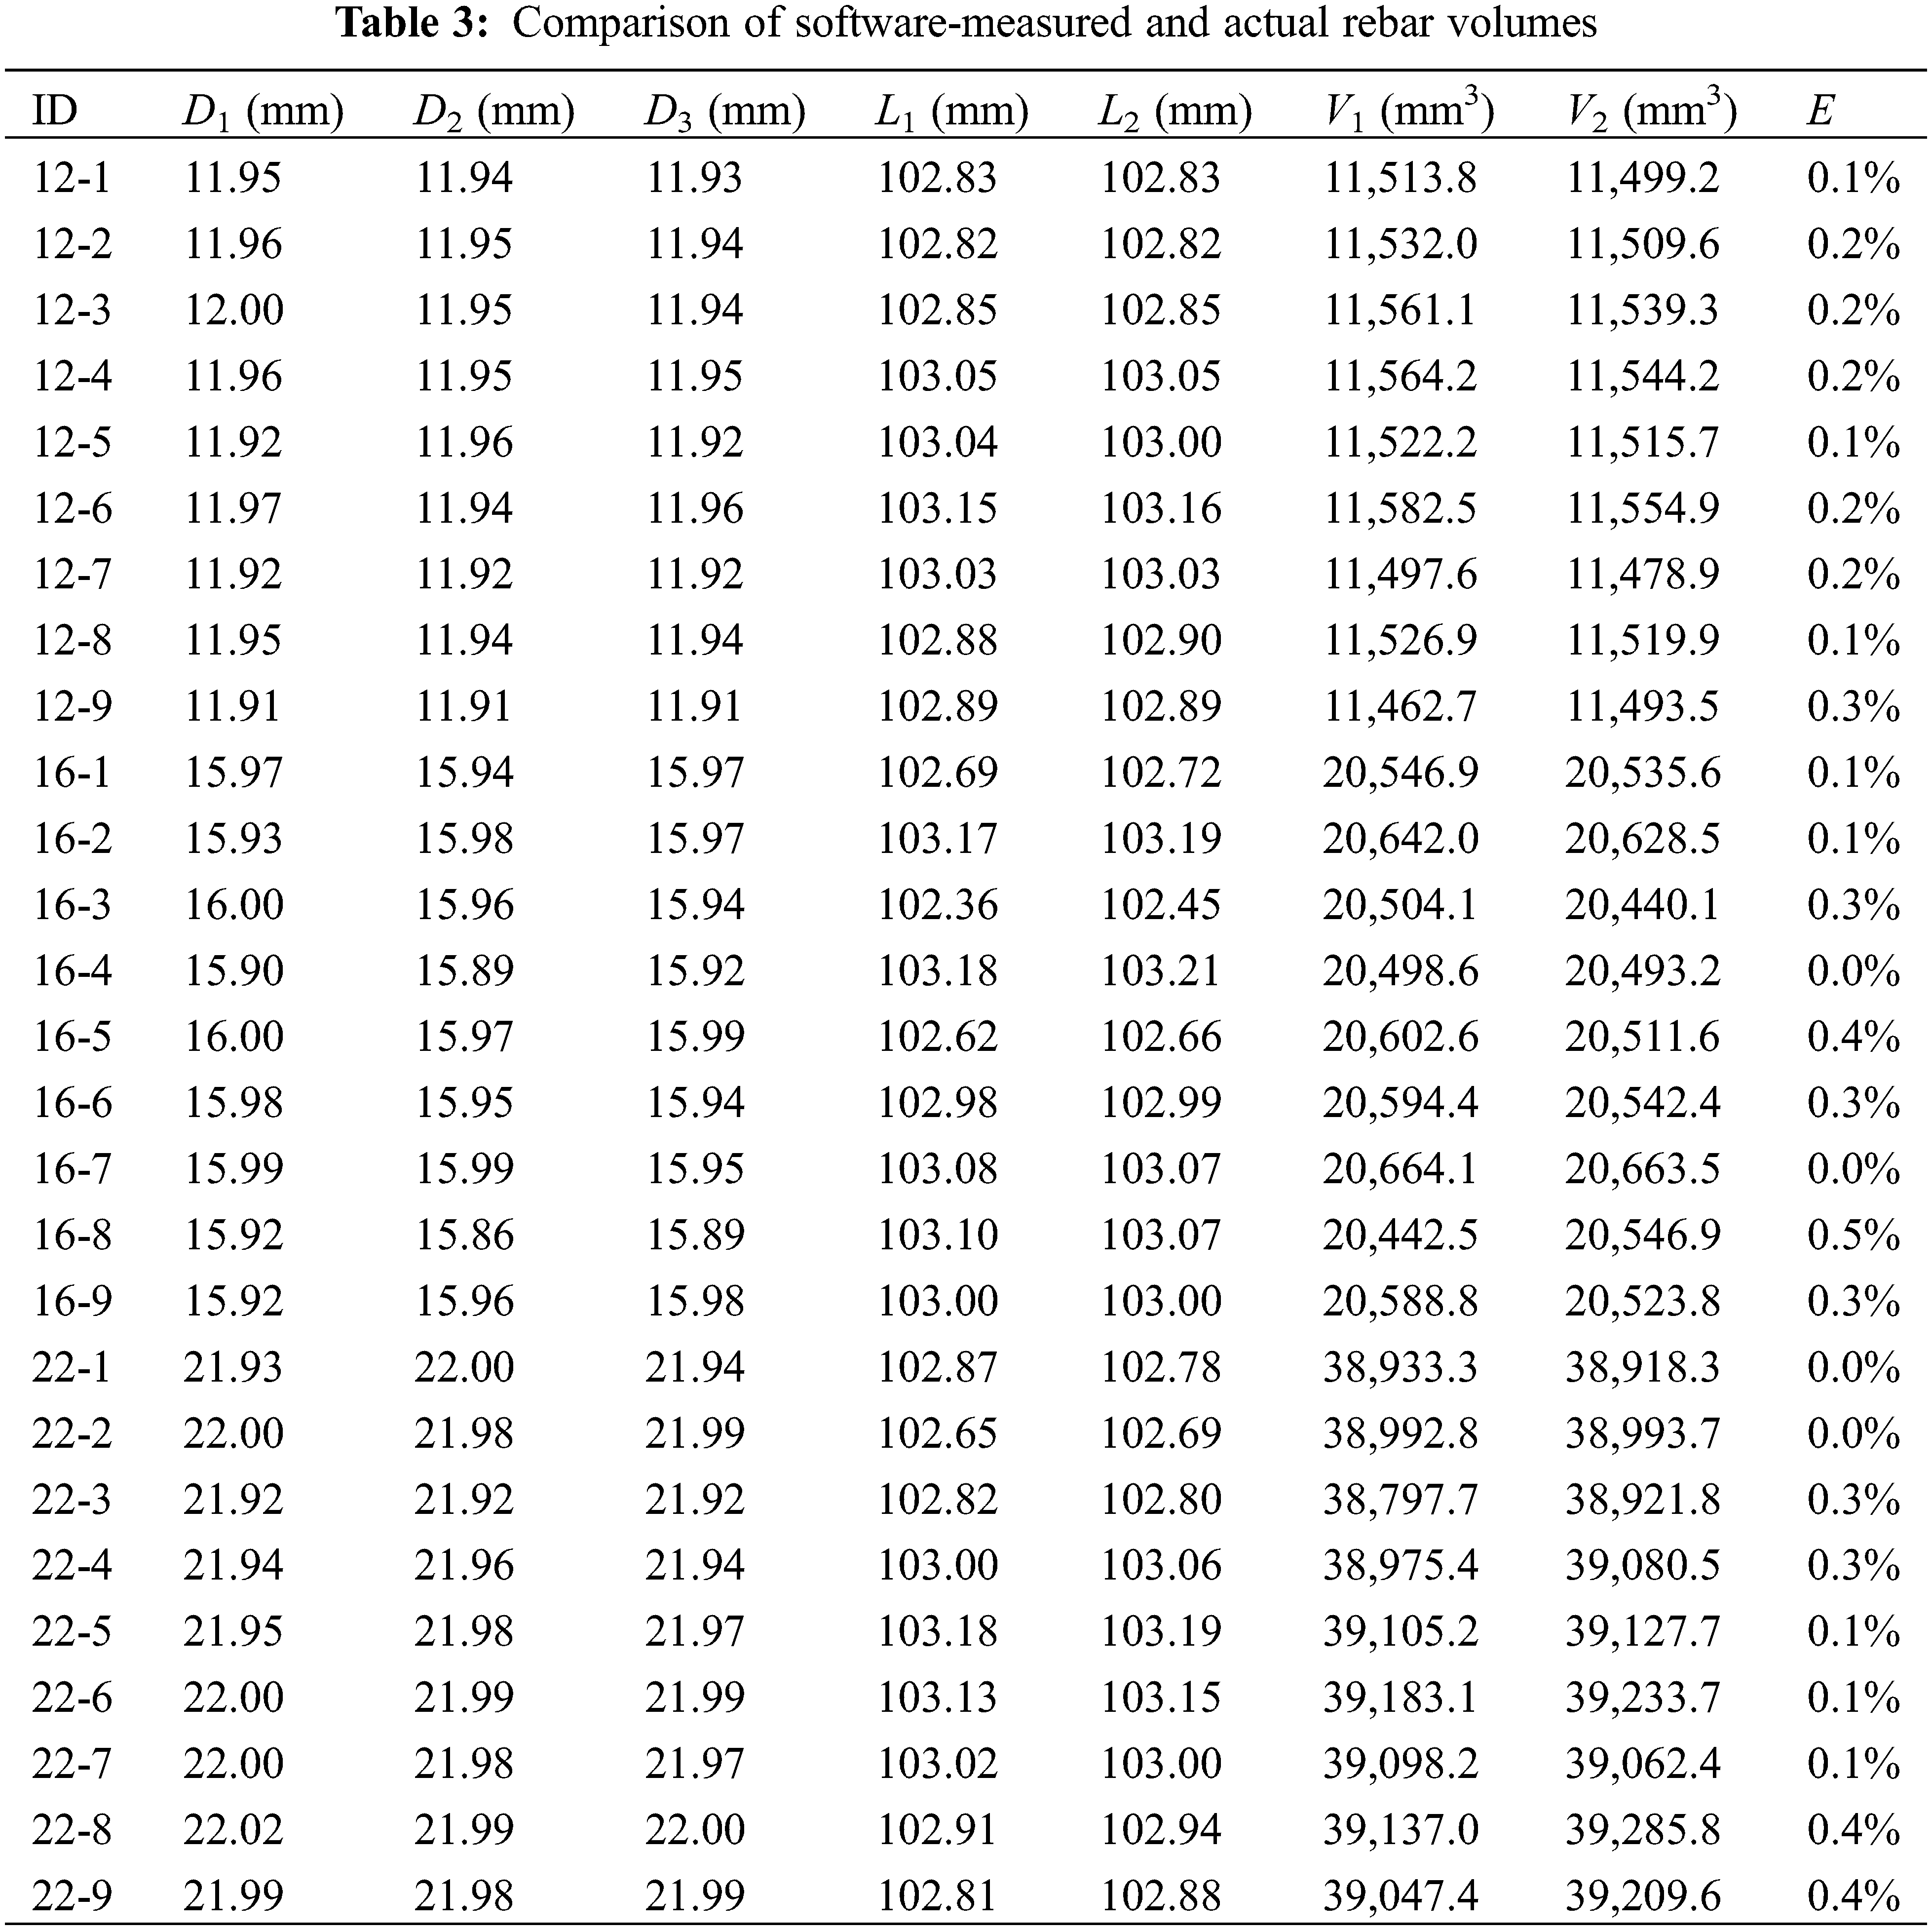
To further validate the feasibility of the proposed measurement method, a lower threshold limit of 2950 and an “Erosion” command coefficient of 6 were applied to measure the rebar volumes in all three groups of concrete specimens. The measured volumes were then compared with the actual volumes, with the rebar diameters and lengths determined using a vernier calliper with a precision of 0.01 mm. The results are shown in Table 3. As observed from Table 3, the volume errors obtained using the proposed method are all within 1%, indicating that the errors are relatively small. This demonstrates that using a lower threshold limit of 2950 and an “Erosion” command coefficient of 6 yields accurate rebar volume calculations, thereby validating the feasibility and accuracy of the experimental method presented in this paper.
In the table:
D1, D2, D3—Measured rebar diameter
L1, L2—Measured rebar length
V1—Measured volume
V2—Volume measured by software
This study identified the parameters affecting the accuracy of CT scanning in measuring crack width and rebar volume in reinforced concrete. By optimizing these processing parameters, the accuracy of detecting internal rebar volume and crack width in concrete has been significantly improved. The main conclusions of this study are summarized as follows:
(1) Impact of processing parameters on CT accuracy: The accuracy of the CT scanning is significantly influenced by the processing parameters. The selection of these parameters directly determines the accuracy of the final measurement results. Therefore, optimizing these parameters is crucial for improving the reliability of CT scanning results.
(2) Crack width measurement: The measurement of crack width is predominantly affected by the threshold value. Factors such as the thickness of the concrete cover and the rebar diameter influence the optimal threshold for cracks. We derived a fitting formula to determine the optimal threshold for different specimens in this study. When this threshold is used as the upper threshold, the measurement error of crack width remains below 5%.
(3) Rebar volume measurement: The accuracy of rebar volume measurement is mainly impacted by the threshold value and the “Erosion” coefficient. When the lower threshold is set to 2950 and the “Erosion” coefficient is set to 6, the experimental results are in good agreement with the actual measurements, with an error within 1%.
In summary, this study proposes an effective optimization method for CT scanning of reinforced concrete, significantly improving the accuracy and reliability of CT measurements of crack width and rebar volume. These optimized methods provide theoretical support for the SHM of critical infrastructure, such as bridges and tunnels. Additionally, the proposed CT scanning parameter optimization approach offers important guidance for parameter selection in other NDT methods, particularly in reducing manual intervention and improving measurement accuracy.
Future research will continue to explore the effects of other parameters, such as scanning speed and resolution, on CT scanning results, to enhance measurement accuracy. Furthermore, it is necessary to investigate how to maintain high-quality detection under varying concrete structures and practical engineering conditions, to meet increasingly complex detection demands.
Acknowledgement: None.
Funding Statement: The authors received no specific funding for this study.
Author Contributions: Conceptualization and design, writing—review & editing, supervision: Yueshun Chen; experimental execution, data analysis, writing—original draft: Yupeng Zhou; resources, data collection, writing—review: Cao Yin. All authors reviewed the results and approved the final version of the manuscript.
Availability of Data and Materials: The authors confirm that the data supporting the findings of this study are available within the article.
Ethics Approval: Not applicable.
Conflicts of Interest: The authors declare no conflicts of interest to report regarding the present study.
References
1. Zhang Q, Lun PY, Li X. A simplified approach for prediction of concrete resistivity: experimental study and mathematic model. Mater Struct. 2021 Aug;54(4):155. doi:10.1617/s11527-021-01688-9. [Google Scholar] [CrossRef]
2. Kartorono S, Setio HD, Surahman A, Zulkifli E. Determination of reflected temperature in active thermography measurements for corrosion quantification of reinforced concrete elements. Struct Durab Health Monit. 2023 Jun;17(3):195–208. doi:10.32604/sdhm.2022.023259. [Google Scholar] [CrossRef]
3. Feng Q, Ren Z, Wang D. Detection of frost-resistance property of large-size concrete based on impact-echo method. Struct Durab Health Monit. 2023 Mar;17(1):71–88. doi:10.32604/sdhm.2023.024912. [Google Scholar] [CrossRef]
4. Tesic K, Baricevic A, Serdar M. Non-destructive corrosion inspection of reinforced concrete using ground-penetrating radar: a review. Materials. 2021 Feb;14(4):975. doi:10.3390/ma14040975. [Google Scholar] [PubMed] [CrossRef]
5. Tang Z, Zhuo H, Li B, Ma X, Zhao S, Tong K. Quantitative detection of corrosion state of concrete internal reinforcement based on metal magnetic memory. Struct Durab Health Monit. 2023 Sep;17(5):407–31. doi:10.32604/sdhm.2023.026033. [Google Scholar] [CrossRef]
6. Wang HP, Chen C, Ni YQ, Jayawickrema M, Epaarachchi J. Computer-aided feature recognition of CFRP plates based on real-time strain fields reflected from FBG measured signals. Compos Part B: Eng. 2023 Aug;263:110866. doi:10.1016/j.compositesb.2023.110866. [Google Scholar] [CrossRef]
7. Taheri-Shakib J, Al-Mayah A. Effect of corrosion pit distribution of rebar on pore, and crack characteristics in concrete. Cem Concr Compos. 2024 Apr;148(1):105476. doi:10.1016/j.cemconcomp.2024.105476. [Google Scholar] [CrossRef]
8. Taheri-Shakib J, Al-Mayah A. Applications of X-ray computed tomography to characterize corrosion-induced cracking evolution in reinforced concrete: a review. J Build Eng. 2024 Aug;90(5535):109420. doi:10.1016/j.jobe.2024.109420. [Google Scholar] [CrossRef]
9. Yang ZQ, Li HJ, Wen JX, Huang FL, Wang Z, Yi ZL, et al. The microstructure evolution of ballastless track high-strength concrete exposed to compressive and flexural fatigue loads. Int J Fatigue. 2023 Jan;166(123):107247. doi:10.1016/j.ijfatigue.2022.107247. [Google Scholar] [CrossRef]
10. Zhang KP, Wang CL, Zhao Y, Bi J. Experimental study on cracking behavior of concrete containing hole defects. J Build Eng. 2023 Apr;65:105806. doi:10.1016/j.jobe.2022.105806. [Google Scholar] [CrossRef]
11. Li N, Zhao YR, Xing YM, He XY, Li HX. Meso-damage analysis of concrete based on X-ray CT in-situ compression and using deep learning method. Case Stud Const Mater. 2023 Jul;18(11):e02118. doi:10.1016/j.cscm.2023.e02118. [Google Scholar] [CrossRef]
12. Li PD, Wu YF. Damage evolution and full-field 3D strain distribution in passively confined concrete. Cem Concr Compos. 2023 Apr;138:104979. doi:10.1016/j.cemconcomp.2023.104979. [Google Scholar] [CrossRef]
13. Guangyu L, Jichang H. Based on the CT image rebuilding the micromechanics hierarchical model of concrete. Adv Civ Eng. 2022 Oct;2022(1):2445901. doi:10.1155/2022/2445901. [Google Scholar] [CrossRef]
14. Ren QF, Pacheco J, de Brito J. New generation and separation method for the computational modelling of the mesostructure of concrete. Eng Fract Mech. 2023 May;284(7):109212. doi:10.1016/j.engfracmech.2023.109212. [Google Scholar] [CrossRef]
15. Naderi S, Zhang MZ. Meso-scale modelling of static and dynamic tensile fracture of concrete accounting for real-shape aggregates. Cem Concr Compos. 2021 Feb;116(1):103889. doi:10.1016/j.cemconcomp.2020.103889. [Google Scholar] [CrossRef]
16. Thomas C, de Brito J, Cimentada A, Sainz-Aja JA. Macro-and micro-properties of multi-recycled aggregate concrete. J Clean Prod. 2020 Feb;245(9):118843. doi:10.1016/j.jclepro.2019.118843. [Google Scholar] [CrossRef]
17. Qiu QW, Zhu JH, Dai JG. In-situ X-ray microcomputed tomography monitoring of steel corrosion in engineered cementitious composite (ECC). Constr Build Mater. 2020 Nov;262(5535):120844. doi:10.1016/j.conbuildmat.2020.120844. [Google Scholar] [CrossRef]
18. Dong BQ, Fang GH, Liu YQ, Dong P, Zhang JC, Xing F, et al. Monitoring reinforcement corrosion and corrosion-induced cracking by X-ray microcomputed tomography method. Cem Concr Res. 2017 Oct;100(11):311–21. doi:10.1016/j.cemconres.2017.07.009. [Google Scholar] [CrossRef]
19. Dong BQ, Ding WJ, Qin SF, Fang GH, Liu YQ, Dong P, et al. 3D visualized tracing of rebar corrosion-inhibiting features in concrete with a novel chemical self-healing system. Constr Build Mater. 2018 Apr;168:11–20. doi:10.1016/j.conbuildmat.2018.02.094. [Google Scholar] [CrossRef]
20. Mohammed TU, Hamada H, Hasnat A, AI Mamun MA. Corrosion of steel bars in concrete with the variation of microstructure of steel-concrete interface. J Adv Concr Technol. 2015 Apr;13(4):230–40. doi:10.3151/jact.13.230. [Google Scholar] [CrossRef]
21. Wang ZK, Zhao XL, Xian GJ, Wu G, Raman RKS, Al-Saadi S, et al. Long-term durability of basalt-and glass-fibre reinforced polymer (BFRP/GFRP) bars in seawater and sea sand concrete environment. Constr Build Mater. 2017 May;139(3):467–89. doi:10.1016/j.conbuildmat.2017.02.038. [Google Scholar] [CrossRef]
22. Skarzynski L, Kibort K, Malachowska A. 3D X-ray micro-CT analysis of rebar corrosion in reinforced concrete subjected to a chloride-induced environment. Molecules. 2022 Jan;27(1):192. doi:10.3390/molecules27010192. [Google Scholar] [PubMed] [CrossRef]
23. Xi X, Yang ST. Investigating the spatial development of corrosion of corner-located steel bar in concrete by X-ray computed tomography. Constr Build Mater. 2019 Oct;221(9):177–89. doi:10.1016/j.conbuildmat.2019.06.023. [Google Scholar] [CrossRef]
24. Li JH, Xue CZ. Investigation on the spatial development of corrosion of corner-located steel bars in concrete based on X-ray CT technology. J Shandong Agric Univ (Nat Sci). 2020 Mar;51(5):946–50 (In Chinese). [Google Scholar]
25. Tian W, Han N, Zhang PK. Experimental study on freeze-thaw damage of concrete pore structure based on CT technology. J Central South Univ (Sci Technol). 2017 Nov;48(11):3069–75 (In Chinese). [Google Scholar]
26. Qian X, Xu QJ. Study on the distribution law of initial defects in concrete based on CT images. J Hydraul Eng. 2016 Apr;47(7):959–66 (In Chinese). doi:10.13243/j.cnki.slxb.20150935. [Google Scholar] [CrossRef]
27. Cao DK, Shang JJ, Chen SB. Application of comprehensive CT non-destructive detection technology for seepage prevention wall of Qianping Reservoir dam foundation. China Water Res. 2020 Sep;18:61–2 (In Chinese). [Google Scholar]
28. Tian Y, Jiang HY, Fan XZ, Zhang GY, Jin NG, Zeng Q, et al. Corrosion damages of reinforced concrete characterized by X-ray CT and DVC techniques. Constr Build Mater. 2023 Dec;409:134218. doi:10.1016/j.conbuildmat.2023.134218. [Google Scholar] [CrossRef]
29. Ren QF, Pacheco J, de Brito J. 3D mesoscale modelling of recycled aggregate concrete. Constr Build Mater. 2024 Jan;411:134430. doi:10.1016/j.conbuildmat.2023.134430. [Google Scholar] [CrossRef]
30. Homel MA, Iyer J, Semnani SJ, Herbold EB. Mesoscale model and X-ray computed micro-tomographic imaging of damage progression in ultra-high-performance concrete. Cem Concr Res. 2022 Jul;157(2):106799. doi:10.1016/j.cemconres.2022.106799. [Google Scholar] [CrossRef]
31. Zhao L, Li C, Dang F, Chen D. Analysis and research on X-ray concrete CT image processing methods. J Wuhan Univ Technol. 2011 Mar;33(3):98–102 (In Chinese). [Google Scholar]
32. Hao HJ, Jiang JY, Mei SQ, Zhu L. Research on crack identification inside concrete based on X-ray CT. Concrete. 2010 Oct;10(10):44–7 (In Chinese). [Google Scholar]
33. Yu F, Li KL, Zhang H, Zhang R, Gao Z, Huang YB. Pore structure identification method for pervious concrete based on improved UNet and fusion algorithm. KSCE J Civ Eng. 2023 Nov;27(11):4834–48. doi:10.1007/s12205-023-2316-x. [Google Scholar] [CrossRef]
34. Ning ZY, Liu YH, Wang WB, Dong J, Meng X, Wang Q. Crack propagation and non-uniform deformation analysis in hydraulic asphalt concrete: insights from X-ray CT scanning and digital volume correlation. Constr Build Mater. 2024 Jan;411:134704. doi:10.1016/j.conbuildmat.2023.134704. [Google Scholar] [CrossRef]
35. GE Healthcare. Optima CT540. Available from: https://www.gehealthcare.com/zh-cn/products/computed-tomography/optima-ct540. [Accessed 2024]. [Google Scholar]
36. Thermo Fisher Scientific. Amira-Avizo software. Available from: https://www.fei.com/software/amira-avizo. [Accessed 2024]. [Google Scholar]
37. Yan XK, Ding S. Adaptive image interpolation algorithm and the collaborative design of acceleration engine. Electron Inf Sci. 2023 Apr;45(9):3284–94 (In Chinese). [Google Scholar]
38. Yang XQ. Iterative back-projection image super-resolution algorithm based on lanczos interpolation (M.S. Thesis). Shandong University: Jinan, China; 2018 Apr (In Chinese). [Google Scholar]
39. Carrara P, Kruse R, Bentz DP, Lunardelli M, Leusmann T, Varady PA, et al. Improved mesoscale segmentation of concrete from 3D X-ray images using contrast enhancers. Cem Concr Compos. 2018 Oct;93(5):30–42. doi:10.1016/j.cemconcomp.2018.06.014. [Google Scholar] [PubMed] [CrossRef]
40. Thermo Scientific. Amira-Avizo 3D software user guide (version 2023.1.1). Thermo Fisher Scientific; 2023. Available from: https://assets.thermofisher.com/TFS-Assets/MSD/Product-Guides/user-guide-avizo-software.pdf. [Accessed 2024]. [Google Scholar]
Cite This Article
 Copyright © 2025 The Author(s). Published by Tech Science Press.
This work is licensed under a Creative Commons Attribution 4.0 International License , which permits unrestricted use, distribution, and reproduction in any medium, provided the original work is properly cited.
 Downloads
 Citation Tools