
 Submit a Paper
 Propose a Special lssue
 Open Access
ARTICLE
Deep Learning-Based Health Assessment Method for Benzene-to-Ethylene Ratio Control Systems under Incomplete Data
1 School of Electrical Engineering and Information Engineering, Lanzhou University of Technology, Lanzhou, 730050, China
2 Mechanical and Electrical Instrument Operation and Maintenance Center, PetroChina Lanzhou Petrochemical Company, Lanzhou, 730060, China
* Corresponding Author: Huichao Cao. Email:
(This article belongs to the Special Issue: Advanced Detection Technologies and Interpretable Machine Learning Methods in Energy Infrastructure)
Structural Durability & Health Monitoring 2025, 19(5), 1305-1325. https://doi.org/10.32604/sdhm.2025.066002
Received 27 March 2025; Accepted 17 June 2025; Issue published 05 September 2025
 View Full Text
 Download PDF
Abstract
In the production processes of modern industry, accurate assessment of the system’s health state and traceability non-optimal factors are key to ensuring “safe, stable, long-term, full load and optimal” operation of the production process. The benzene-to-ethylene ratio control system is a complex system based on an MPC-PID double-layer architecture. Taking into consideration the interaction between levels, coupling between loops and conditions of incomplete operation data, this paper proposes a health assessment method for the dual-layer control system by comprehensively utilizing deep learning technology. Firstly, according to the results of the pre-assessment of the system layers and loops by multivariate statistical methods, seven characteristic parameters that have a significant impact on the health state of the system are identified. Next, aiming at the problem of incomplete assessment data set due to the uneven distribution of actual system operating health state, the original unbalanced dataset is augmented using a Wasserstein generative adversarial network with gradient penalty term, and a complete dataset is obtained to characterise all the health states of the system. On this basis, a new deep learning-based health assessment framework for the benzene-to-ethylene ratio control system is constructed based on traditional multivariate statistical assessment. This framework can overcome the shortcomings of the linear weighted fusion related to the coupling and nonlinearity of the subsystem health state at different layers, and reduce the dependence of the prior knowledge. Furthermore, by introducing a dynamic attention mechanism (AM) into the convolutional neural network (CNN), the assessment model integrating both assessment and traceability is constructed, which can achieve the health assessment and trace the non-optimal factors of the complex control systems with the double-layer architecture. Finally, the effectiveness and superiority of the proposed method have been verified by the benzene-ethylene ratio control system of the alkylation process unit in a styrene plant.Keywords
In the process industries, especially in the petrochemical industry and other fields, “safe, stable, long term, full load and optimization” operation is the aim of each enterprise. Due to the continuous increases in the complexity of such systems, the health assessment and management of the system has become a new research hotspot in the field of systems engineering [1,2]. System health, as a comprehensive performance assessment index that includes the concepts of system reliability and safety, especially its combination with deep learning, is also currently being gradually recognized and applied by the industry [3].
Styrene is an important basic organic chemical raw material, which is widely used in the production and preparation of rubber, synthetic plastics, pesticides and other products. The alkylation process unit is the core unit of styrene production, in which the healthy operation of the benzene-to-ethylene ratio control system is the key to ensuring product quality and improving comprehensive economic benefits. The system adopts a two-layer architecture with upper-lever model predictive control (MPC) and lower-lever PID loop control. However, the actual production process is accompanied by the influence of disturbing factors, raw material properties, process operating conditions, and operating conditions that are always changing [4]. The system can easily deviate from the initial optimal operating state, resulting in lower productivity [5], which can cause economic losses and make it difficult for the company to realise the expected production. Therefore, the issues of how to timely and accurately assess the health state of the benzene-to-ethylene ratio control system with a double-layer architecture, and trace the causes of non-optimal operation, are not only imperative but also of far-reaching significance for the intelligent regulation of the system, the improvement of product quality and safe operation [6].
Research on the performance assessment of control systems has a long history. Harris first proposed the minimum variance control benchmark in 1989, which laid the foundation for the performance assessment of control systems with single-input and single-output systems [7]. This was followed by the emergence of research into performance assessment using the statistical tools of variance, covariance, linear quadratic Gaussian methods, and entropy [6,8]. With a focus on complex structural control systems, the literature [9] carried out a performance assessment of linear programming-dynamic matrix control systems with hierarchical coupling, however, the research only focused on the advanced control layer of the system. In reference [10], a comprehensive system performance assessment method based on a multi-dimensional joint index was proposed for the benzene-to-ethylene ratio control system with an MPC-PID dual-layer architecture, taking into account the production process constraints and control mechanism requirements of the system loops. Although the method is more interpretable and easy to implement. The performance assessment results within layers are integrated using preset weights and linear fusion, which ignores the influence of complex nonlinear properties on the health state of the system, such as the coupling correlation between internal layers and loops within the system.
With the rapid development of artificial intelligence technology, machine learning has been widely applied in the performance assessment of complex industrial process control systems. Classic methods such as principal component analysis [11], canonical variate analysis [12], slow feature analysis [13], partial least squares [14], least squares support vector machines [15], gaussian process regression [16], random forest and AdaBoost [17], as well as other improved algorithms, have effectively addressed the problem of accurately assessing the health state of the system, that was previously difficult due to the unclear intrinsic mechanisms of complex industrial processes [18]. Due to the wide application of distributed control systems (DCS) and various intelligent instrumentation, etc., in industrial processes, a large amount of process data in the industrial production process can be collected and stored [19], data-driven methods have received widespread attention [20]. Deep learning is a popular tool for working with large datasets and high-dimensional samples, which is capable of automatically learning highly abstract features from raw signals through hierarchical and mathematical structures [21] and has been shown to be more effective than shallow learning for feature representation [22]. The reference [23] used a deep belief network (DBN) to effectively extract features from boiler sensor data for deep peaking performance assessment of circulating fluidized bed boilers. However, the reasons for the decline in peaking performance were not discussed in this study. Reference [24] proposed a new layer-attention-based stacked performance-related denoising autoencoder (LA-SPDAE), which employs adaptive weights based on the layer-attention mechanism for the fusion of performance-related features of each layer, which can better utilize the extracted deep features. The study in [25] presented a long short-term memory (LSTM) model based on slow features and comprehensive economic index constraints with the aim of assessing the operational performance of a heavy media coal beneficiation process. The contribution graph was reconstructed based on the LSTM-AE model to identify the main factors that caused the operation of the system to be non-optimal. In [26], using the AM to integrate the assessment results of all kinds of information in the magnesia smelting process, an operating performance assessment method for the process was constructed based on adaptive weighted fusion of multi-source heterogeneous information, which obtained good assessment accuracy.
Inspired by the above research results, for the benzene-to-ethylene ratio control system with dual-layer architecture, how to extract the deep features of the system health state based on deep learning, and reveal the complex correlation and coupling characteristics between hierarchical subsystems and loop units, and how to improve the interpretability of deep learning model with the support of attention mechanism and solve the problem of traceability of non-optimal factors in system health state, which are the primary motivations of this paper.
In addition, the quality and quantity of the assessment data are the key factors to determine whether a health assessment model for the control system can achieve accurate results. However, in the actual operation process, the optimal and good health states are far more than the unhealthy states, resulting in unbalanced data for each state. Such sample sets inevitably lead to difficulties for deep networks to make accurate and reliable assessments of system health. There is an effective way to generate a complete data set for accurate assessment by using data augmentation technology to expand unbalanced samples. Generative Adversarial Network (GAN) has shown its advantages as a generative model in the field of image generation and data enhancement [27,28]. The network maintains the consistency of the generated data with the real data distribution through the adversarial objective function of the discriminator and thus suffers from gradient vanishing and instability during model training [29]. In reference [30], to overcome the problem of difficult access to internal damage data of concrete components, an attention-based generative adversarial network (AGAN) is proposed to generate data and used to train deep models. Reference [31] proposes a Wasserstein distance-based conditional gradient penalty GAN to augment an imbalance fault dataset on rolling bearings. This approach solved the problems of pattern collapse and stability in a classical GAN model. In order to improve the modelling accuracy of soft sensors in chemical industry processes, researchers [32] have used the Wasserstein Generative Adversarial Network with a gradient penalty (WGAN-GP) term to generate new samples, which are used to fill the sparse regions of the modelling data. The study [33], while using GAN networks to generate data to assess the state of industrial processes, did not take into account the fact that the state of the data categories was not balanced and was labelled using only GAN-generated data. Therefore, if a complete dataset of each state equilibrium is obtained based on the data generation method can undoubtedly improve the accuracy of complex system health assessment.
In view of the issues described above, this paper proposes a new system health assessment method for a complex benzene-to-ethylene ratio control system with an MPC-PID dual-layer architecture. In this method, the output value of the benzene-to-ethylene ratio is taken as the assessment index for the overall operational health state of the system, Deep learning techniques, such as WGAN-GP, CNN and attention mechanism, are used. The main contributions of this work are as follows:
1) For a dataset of the benzene-to-ethylene ratio control system with an unbalanced state distribution, the WGAN-GP network is applied to learn the data distribution law of different health states of the system and to generate new samples. This approach can obtain a complete assessment dataset that can characterize the full health state attributes of the system, thereby providing reliable data support for the accurate establishment of health assessment models.
2) The feature parameters for system health assessment are identified based on the pre-assessment results of the system layer, which are derived using the control mechanism and multivariate statistical method. CNN is used to explore the nonlinear characteristics of the health state of the subsystem and the loop within the benzene-to-ethylene ratio control system. A new health assessment framework for the benzene-to-ethylene ratio control system is constructed based on traditional multivariate statistical pre-assessment results. The approach can avoid the limitations of linear weighted fusion and reduce the dependence on prior knowledge.
3) An attention mechanism-based convolutional neural network (ACNN) health assessment model, which integrates both assessment and traceability functions, is established for the benzene-to-ethylene ratio control system. In the model, the AM is embedded with CNN to enhance the interpretability of the deep learning assessment model. The health state of the system is assessed accurately, at the same time, the attention mechanism adaptively assigns weights to each feature variable to trace the non-optimal factors that cause the decline of the health level of the benzene-to-ethylene ratio control system.
The remainder of this paper is organized as follows: Section 2 presents the system health assessment scheme. Section 3 provides the acquisition of complete data for health assessment of the benzene-to-ethylene ratio control system based on WGAN-GP. Section 4 introduces the health assessment of the benzene-to-ethylene ratio control system with a dual-layer architecture based on ACNN. Section 5 presents the simulation experiments and results analysis. Finally, conclusions are drawn in Section 6.
2 Systematic Assessment Program Determination
2.1 Overview of the Process and Control System for Alkylation Process Unit in Styrene Plant
A process flow diagram for the alkylation reaction in the alkylation process unit is shown in Fig. 1. The ethylene feedstock is introduced through the buffer tank V101, and divided into four branches, which are added to the two alkyl reactors R101, and R102. The first and third branches are injected into the middle of R101 and R102, respectively. The second branch and the feedstock benzene after the removal of trace alkaline nitride heated by the white clay processor, the reaction circulating fluid through the mixer M101 fully. After mixing, it enters the bottom of R101 and undergoes an alkylation reaction on the catalyst bed. The reactants at the outlet of R101 are cooled by the discharge cooler E103, and the contents are fully mixed with the fourth branch through the mixer M102 and enter at the bottom of R102 to undergo the alkylation reaction.
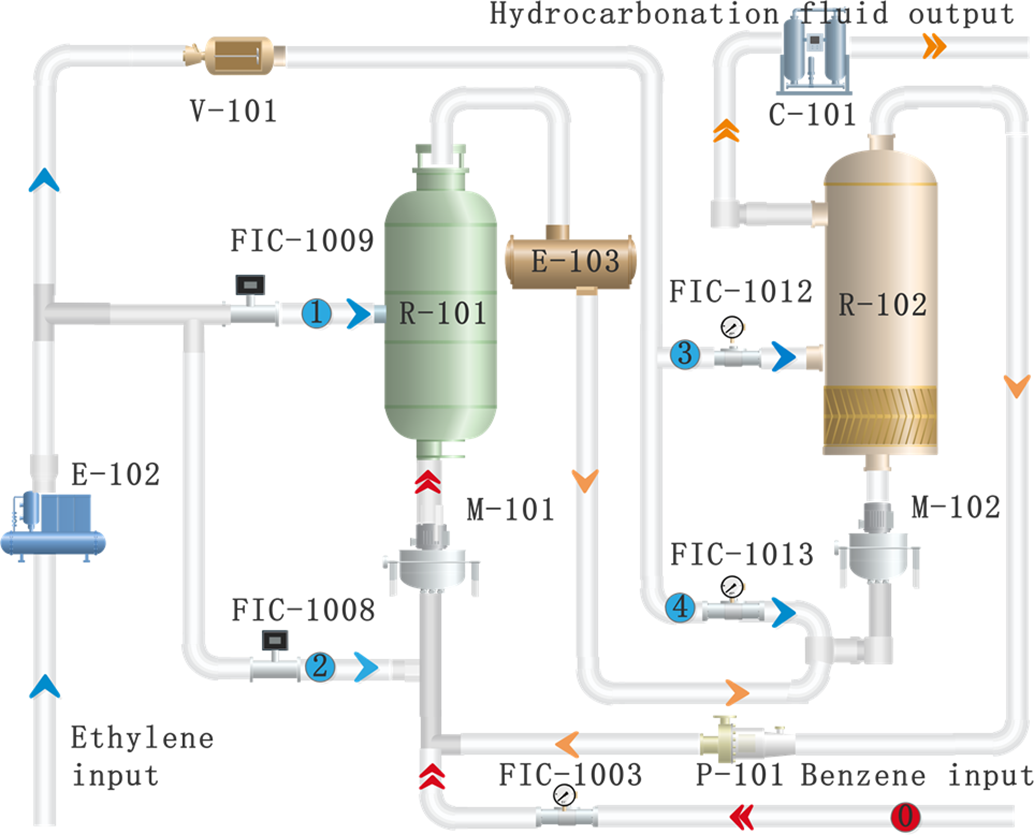
Figure 1: Process flow diagram of the alkylation reaction in the alkylation process unit
Benzene and ethylene under the action of the catalyst, the use of recycling liquid-phase molecular sieve method, and the alkylation reaction to prepare Hydrocarbonized liquids (ethylbenzene content 35%–45%), in order to extend the life of the catalyst in the production and to avoid the generation of by-products. The production process uses a combination of multi-point ethylene feed, excess benzene and part of the reaction product recycling method, and control over the benzene and ethylene material ratio is required to be in the range of (10:11). Along with the transformation of the petrochemical industry via the use of digital intelligence, the traditional DCS-based basic loop control above the introduction of advanced control for dynamic coordination constraints control, to enhance the economic efficiency of the enterprise, the current benzene-to-ethylene ratio control system using the upper MPC and the bottom of the loop PID synergistic regulation, in which the bottom of the use of one benzene main loop and four ethylene sub-loop PID closed-loop ratio control, so that the benzene ratio to achieve the desired control The control system adopts the upper MPC and the bottom loop PID synergistic control.
2.2 Health Assessment Program for a Benzene-to-Ethylene Ratio Control System with Double-Layer Architecture
A new deep-learning health assessment scheme for a complex nonlinear benzene-to-ethylene ratio control system with MPC-PID double-layer architecture is combined with the aforementioned process and control requirement analysis, as shown in Fig. 2.
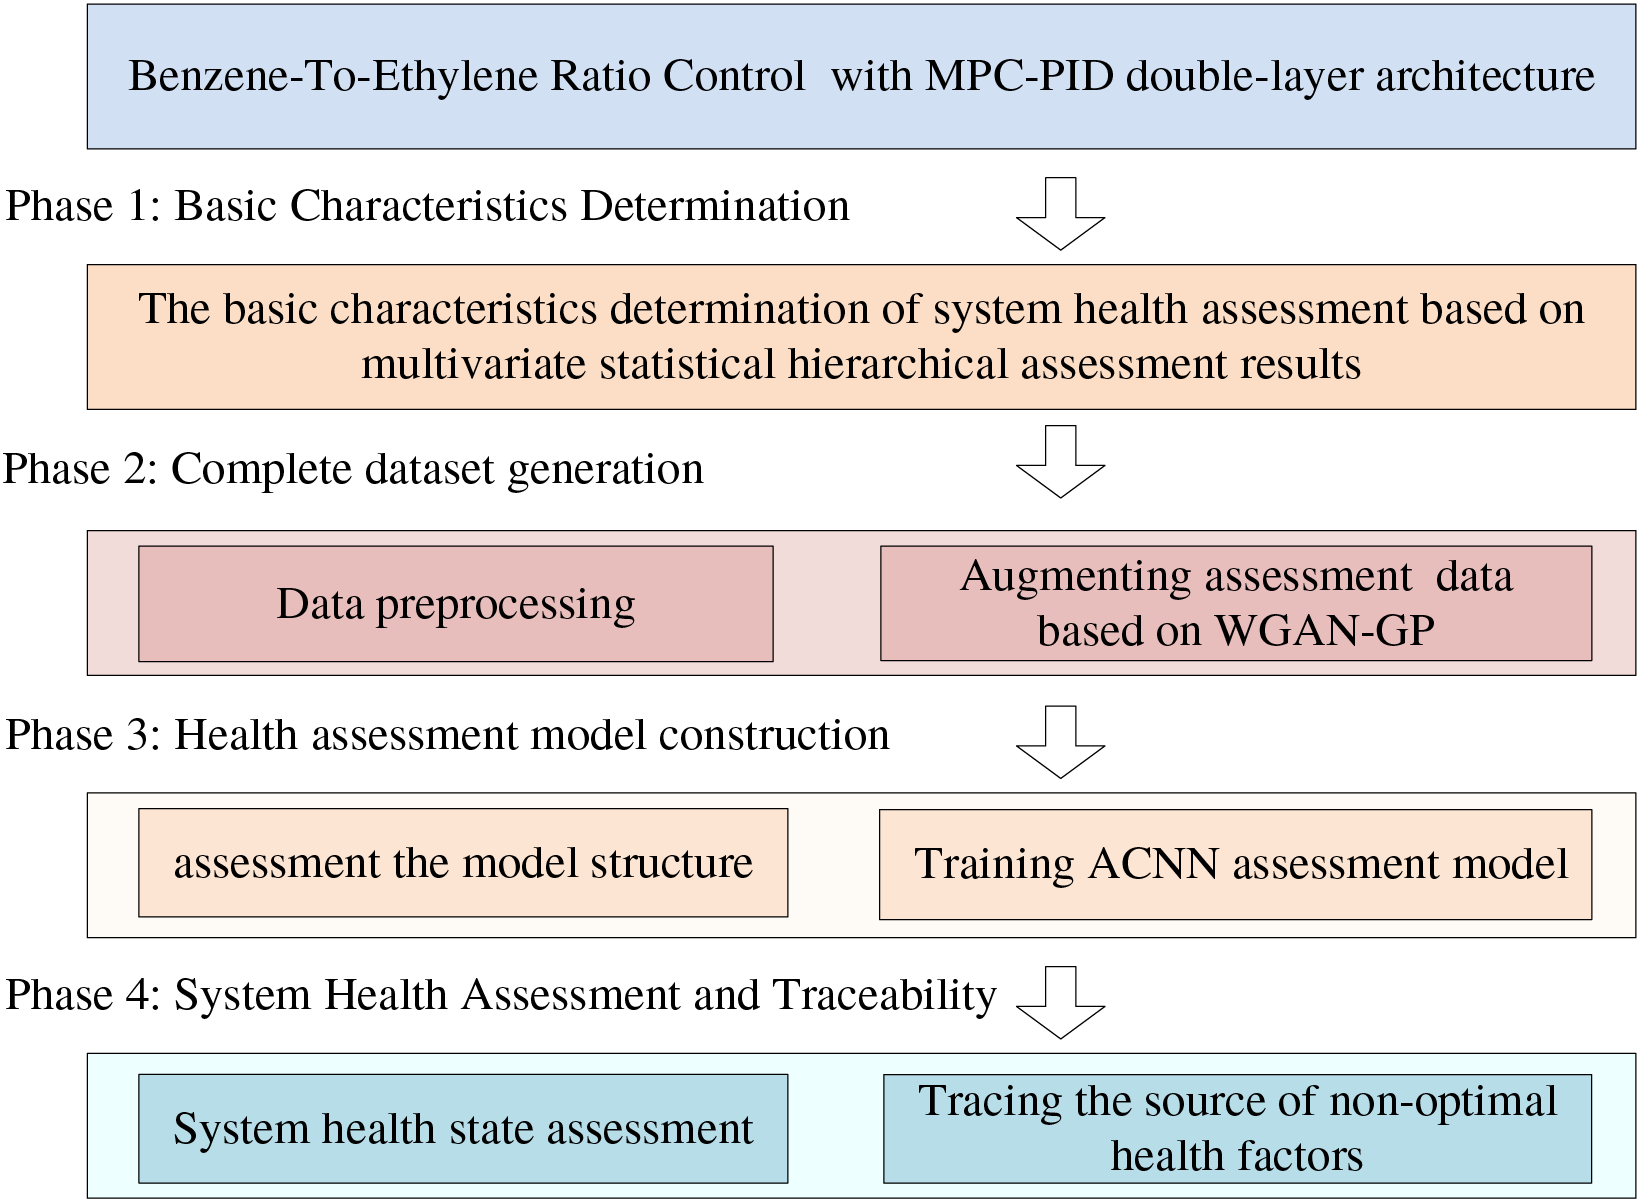
Figure 2: Health assessment scheme for a benzene-to-ethylene ratio control system with a double-layer architecture
Phase 1: Assessment basis feature determination. Based on the team’s previous research, the improved GME proposed by combining the sliding window method and Least absolute deviation is used as an assessment benchmark [10] to assess the performance of each loop controller in rea-time. Secondly, considering the specificity of the ratio system, the benzene ratio control system follower performance index is proposed to assess the synergistic control effect between the loops. In this way, seven characterization variables were identified, including the performance indexes for the MPC, the benzene loops, the four ethylene loops, and the follower performance index representing the coupling attributes of the loops.
Phase 2: The complete dataset generation. After obtaining and pre-processing the original assessment dataset data, the WGAN-GP model was trained based on the health state samples of the original data. New samples were generated to augment the assessment data, and these generated samples were combined with the original training set to form a complete assessment dataset that can characterize the overall health state of the system. This process augments the assessment data and provides complete data preparation for the training of the health assessment model.
Phase 3: The health assessment model construction. In the offline phase, by introducing AM into the CNN, and based on the generated complete data set, supervised training is conducted using the Benzene-to-Ethylene ratio output as the system health assessment index, and the ACNN system health assessment network model integrating the assessment-traceability function is built. The model utilizes a deep learning algorithm to extract information such as strong coupling and high nonlinear among subsystems across hierarchical levels and units within the same levels, which can represent the overall health states of the system.
Phase 4: The system health state assessment and traceability. The system health assessment was carried out using the divided test set. In the online phase, the supervised pre-trained ACNN model is fed with test set data for system health assessment and outputs predicted benzene-to-ethylene ratio and the results were compared with the normalized actual benzene-to-ethylene ratio to verify the accuracy and reliability of the assessment model. Then, according to the AM in the assessment model, it can dynamically focus on the important feature information of the system’s health state. Based on the weight coefficients obtained for the model, the contribution diagram of the assessed feature variables to the system health assessment indexes was plotted, and the key characteristic factors that caused the change in the system health level were traced and analyzed.
3 Complete Data Acquisition for Health Assessment of the Benzene-to-Ethylene Ratio Control System with Double-Layer Architecture Based on WGAN-GP
Features that can reflect the real state of the system and complete and reliable assessment data form the basis for a scientific and reasonable assessment of the system’s health state. In the following, the sample data in the presence of feature quantities of unbalanced states are enhanced to obtain an expanded and complete assessment dataset, to accurately reflect the real operating state of the system.
A diagram showing the structure of a GAN is shown in Fig. 3 and consists of two parts, the generator and the discriminator. The generator creates data by iteratively learning a deterministic transformation from random signals to real data, whereas the discriminator aims to distinguish whether the input consists of real or generated data. During the training process, the two models undergo multiple rounds of game confrontation, continuous adjustment and optimization, and finally reach Nash equilibrium, generating reasonable pseudo-data with the distribution characteristics of real samples.
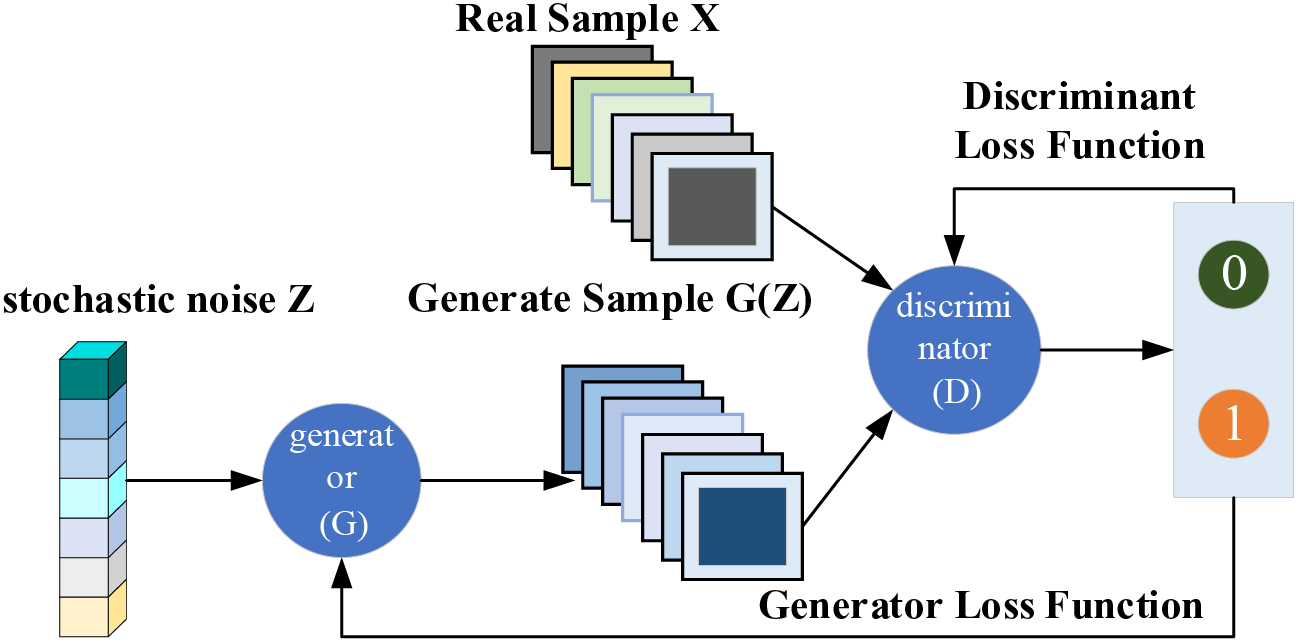
Figure 3: Schematic diagram of GAN network structure
This paper proposes a GAN-based system health assessment data generation model, in which an unbalanced dataset reflecting the original state of the benzene-to-ethylene ratio control system is taken as real samples, and a new dataset with a similar distribution is generated. In this way, a complete assessment dataset is created to solve the problem in which the number of samples representing unhealthy training states is small. This occurs due to the data imbalance in system health assessment and means that it is difficult to adequately train the deep learning assessment model. The problem is solved by generating a new dataset with a similar distribution.
The loss function for the GAN model is:
where
During the training of the GAN, the generator and discriminator are optimized separately. When the discriminator reaches the optimum, the function optimization problem in Eq. (1) can be converted into the problem of minimizing the JS dispersion between the real data distribution
However, when there is no or very little overlap between the distributions of the real and generated data, the JS scatter is constant. In this case, the gradient disappears, the parameters are not updated for a long period, and the network fails to converge, resulting in unstable model training and pattern collapse, which seriously affects the quality of the augmented data. For the real and generated data used in the assessment, when there is no overlap between the two distributions (or when the overlap can be ignored), the Wasserstein distance is used instead of the JS dispersion, as this can reflect the degree of distribution proximity and change smoothly. The cost function of the generated model is improved, thereby making training of the GAN more robust and solving problems such as the inability of the GAN to control the generation of the sample pattern, the difficulty of training, and slow convergence. The cost function for the WGAN based on the Wasserstein distance is:
where
In order to satisfy the Lipschitz continuity constraints, WGAN adopts a weight truncation method to prevent the parameters in the discriminator from exceeding a certain range. This forces the discriminator to concentrate on the edge of the cropping threshold, meaning that the discriminator is overfitted, with limited discriminative ability, resulting in gradient explosion and difficulty in reaching convergence. To solve these problems, a gradient penalty term is introduced to the WGAN cost function. This directly constrains the gradient parameter of the discriminator output based on the input of the discriminator and realizes the Lipschitz constraints to make up for the shortcomings of the WGAN. The loss function for the discriminator of the WGAN-GP model is as follows:
where
In this way, the WGAN-GP model provides more accurate gradient information for the training of the discriminator, controls the feature output of the generator more accurately, effectively avoids pattern collapse, stabilizes the generative model confrontation process, and improves the network convergence speed. This approach also allows the generator and the discriminator to stabilize in the Nash equilibrium state and ensures that the generative data conforms to the probability distribution law of the real data. The method presented here can provide reliable data support for the construction of subsequent health assessment models.
3.2 Algorithmic Steps for System Health Assessment Data Augmentation Based on WGAN-GP
The WGAN-GP network can be used to generate experimental samples with a similar probability distribution to that of the original data. When combined with the original data, the generated samples form a complete dataset for the subsequent training of the ACNN health assessment model. The steps of the WGAN-GP-based data augmentation algorithm for the health assessment of the benzene-to-ethylene ratio control system are shown below.
Step 1: Data preparation and model initialization. The network is defined; appropriate initialization parameters are set; the network structure of the generator and discriminator is initialized; and the real dataset of seven feature quantities of the benzene-to-ethylene ratio control system is prepared.
Step 2: Setting the loss function and optimizer. Using Eq. (4), the WGAN-GP loss function is set based on the Wasserstein distance and gradient penalty term. The optimizer is selected, and an appropriate learning rate is chosen.
Step 3: Training the model. The real dataset is loaded, and random noise Z is fed into the generator G to generate new samples. The discriminator is used to calculate the loss of the real samples and the generated samples, and the discriminator’s weights are updated using gradient descent to train the discriminator. The discriminator is fixed, and interpolated samples are generated by generating a gradient penalty term modifying the discriminator’s loss function and updating its weights to train the generator.
Step 4: Training termination judgement and model parameter curing. The steps described above are cyclically iterated to check the changes in the loss function and gradient paradigm to ensure that the training process is stable. When the values of the loss functions for both the loss function discriminator and the generator have reached a minimum, training stops, and the model is saved.
Step 5: Obtaining the complete dataset. The generated samples are combined with the original samples to form a complete dataset for system health assessment.
4 ACNN-Based Health Assessment of the Benzene-to-Ethylene Ratio Control System with Double-Layer Architecture
Having obtained the system assessment feature quantity and complete assessment dataset, the following deep learning algorithm is used to construct the health state assessment model for the benzene-to-ethylene ratio control system, to mine the coupling and nonlinearities and other characteristics between the system MPC and the PID hierarchical control as well as between the PID loops, to assess the system health state, and to quantify the complex nonlinear relationship between the decline in the system’s health level and the influencing factors.
4.1 Principles of ACNN-Based System Health Assessment
As a typical deep learning algorithm, a CNN can be used to process and learn the local trend features of time series data. This type of model generally includes an input layer, a convolutional layer, a pooling layer, a Fully connected layer (FC), and an output layer. Among them, CNN is widely used by virtue of local connectivity and weight sharing to effectively transform local features into global ones [34,35]. The pooling layer performs dimensionality reduction sampling by calculating the maximum or average value within a sliding window, thus compressing the data and parameters while enhancing the robustness of the features. The FC is responsible for connecting all the neural units together and outputting the results via the implicit layer. The CNN algorithm can be used to effectively extract and analyze the nonlinear features of the benzene-ethylene ratio control system. However, this algorithm adopts local connection and weight sharing, and although this reduces the number of parameters in the network and reduces the complexity of the model, it is a “black box” model that does not enable a good understanding of the input feature extraction, and has limited interpretability.
The AM can be used to screening for important features by calculating the correlation scores between the hidden layer vectors of the input sequences and the outputs, and assigning sufficient attentional weights to the key feature information based on the influence of the input features on the scores of the outputs and the structure is shown in Fig. 4. This process employs non-uniform weighting of the contributions of the input feature vectors to optimize the process of learning objectives. In this paper, we introduce an AM into the CNN to construct a system health assessment model, which improves the extraction capability of key information while strengthening the correlation analysis and solving the problem of complex coupling among benzene-ethylene ratio circuits. The model is also able to quantitatively measure the contribution of each feature factor to the decline in the system health level through the AM, which enhances the interpretability of the assessment model.
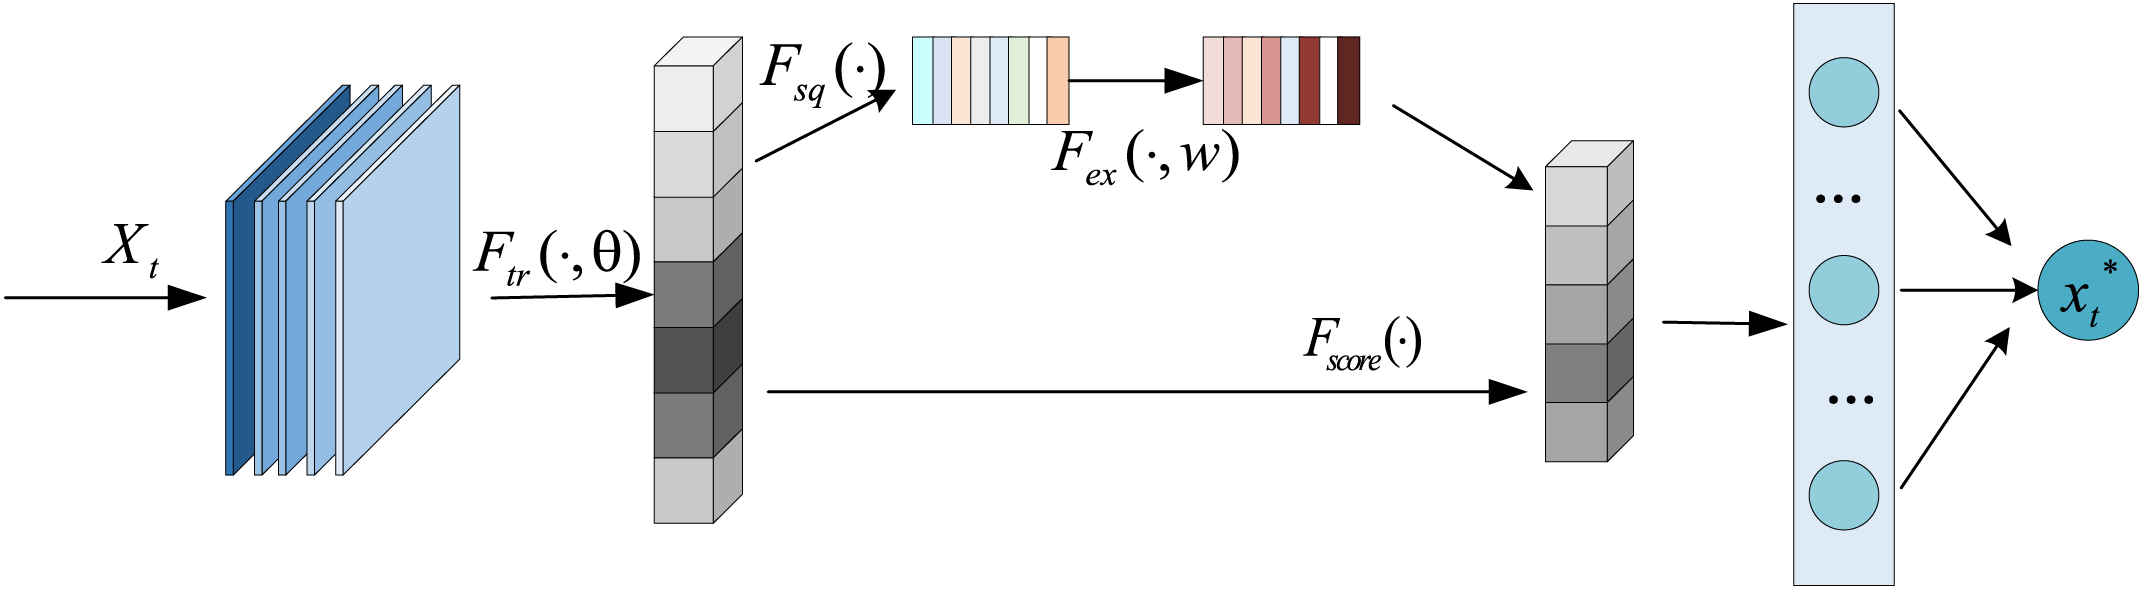
Figure 4: Structure of the attention mechanism unit
The structure of the ACNN module for the proposed health assessment model is shown in Fig. 5.
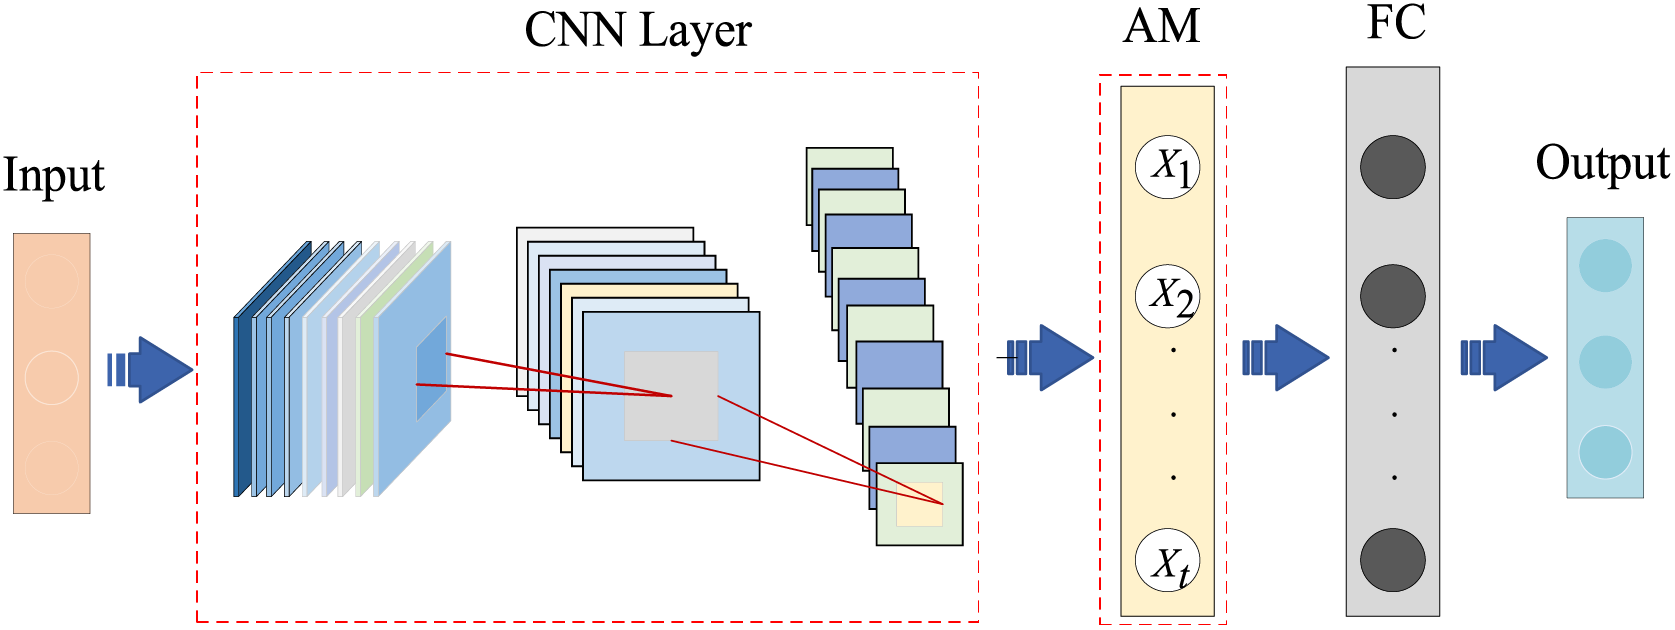
Figure 5: Structure of the proposed ACNN health assessment model
The feature information on the assessment data is first extracted with a CNN. The input layer takes the complete dataset enhanced by the WGAN-GP network. The data are divided into d parts containing n samples, each data point has m feature vectors contained in the health state of the system, resulting in a matrix of the size
where
The pooling layer in the CNN is sampled using a 2 × 2 filter and a sliding window with a step size of one, to reduce the data feature size and reduce the network parameters. The output features of the pooling layer are shown in Eq. (6):
Then, by passing through the FC implicit layer output, the intermediate state of the base data is obtained by calculating the output of the implicit layer. The additive AM layer calculates the similarity between the eigenvector
where
where
Finally,
4.2 Steps in the ACNN-Based System Health Assessment Algorithm
Step 1: ACNN assessment model.
The assessed dataset is preprocessed and divided into the training set, validation set and test set. The CNN and attention modules are defined, and the parameters of the neural network module are set, such as the size of the CNN convolution kernel, the sliding step, the activation function, and the query of the attention module. The model weights and bias values are initialized, and the training set is loaded for cyclic training of the ACNN model. The model performance is assessed and the model is tuned using the validation set, after which it is saved.
Step 2: System health assessment.
The test set is fed to the trained ACNN assessment model to obtain the predicted value of the benzene-ethylene ratio output for system health assessment.
Step 3: Non-optimal factor traceability.
Using the attention weights that are adaptively assigned to the seven feature quantities in the AM module of the ACNN assessment model, the contribution of each feature quantity to the output benzene-to-ethylene ratio is plotted, and the factors affecting the health state of the system are analyzed.
5 Simulation Experiments and Analysis of Results
5.1 Data Preparation and Assessment Indicators for the Assessment Model
The data in this paper are drawn from a simulation platform developed by the group, which was constructed based on the processing mechanism of a benzene-to-ethylene ratio control system in a petrochemical enterprise in the context of a production line of a styrene alkylation process unit. Historical operation data from the real system were used to demonstrate that the simulation platform could accurately simulate the production process and to provide references for decision-making on the actual production process.
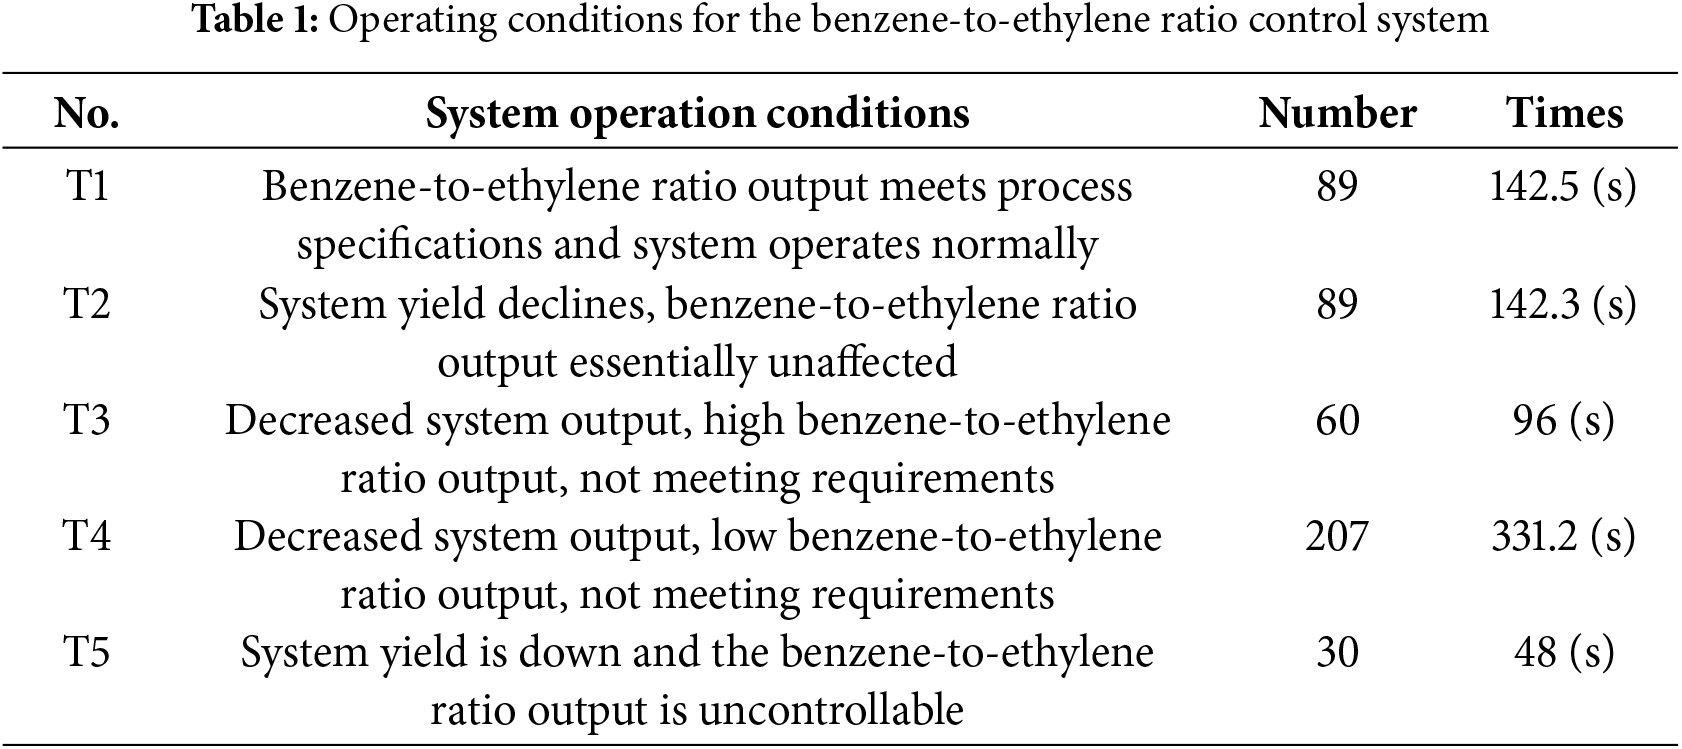
Based on the results of the system-level assessment, seven feature factors that are closely related to the benzene-to-ethylene ratio (i.e., the performance assessment indexes of the benzene circuit, the four ethylene circuits, the MPC, and the follower indexes characterizing the synergistic coupling attributes of the circuits) were selected to assess the health condition of the system. Five operational states of the actual system were considered, as shown in Table 1. From the sampling frequency of 0.625 Hz, 475 sets of data were obtained for five operating conditions, and each set of data contained seven characteristic parameters; these were collected as the training set of the WGAN-GP network to reduce the impact of data variability on the accuracy of the system health assessment.
In order to effectively verify the accuracy of the health assessment method of the benzene-ethylene ratio control system under study, combined with the system process and control requirements, as well as the expert experience knowledge, the system benzene-to-ethylene ratio output was selected as the key indicator for the health assessment. Fig. 6a shows the actual output values for the benzene-to-ethylene ratio, which are mostly close to 10.5. Due to the limitations on the conditions of the field production process, the benzene-to-ethylene ratios are mostly on the high side. In order to effectively compare these values with the prediction results from the assessment model and to ensure consistency between data types, the min-max interval mapping normalization method was adopted, and the actual values for the benzene-to-ethylene ratio were mapped onto the interval as a reference benchmark for the health assessment of the benzene-to-ethylene ratio control system. A histogram of the data after interval mapping normalization is shown in Fig. 6b.
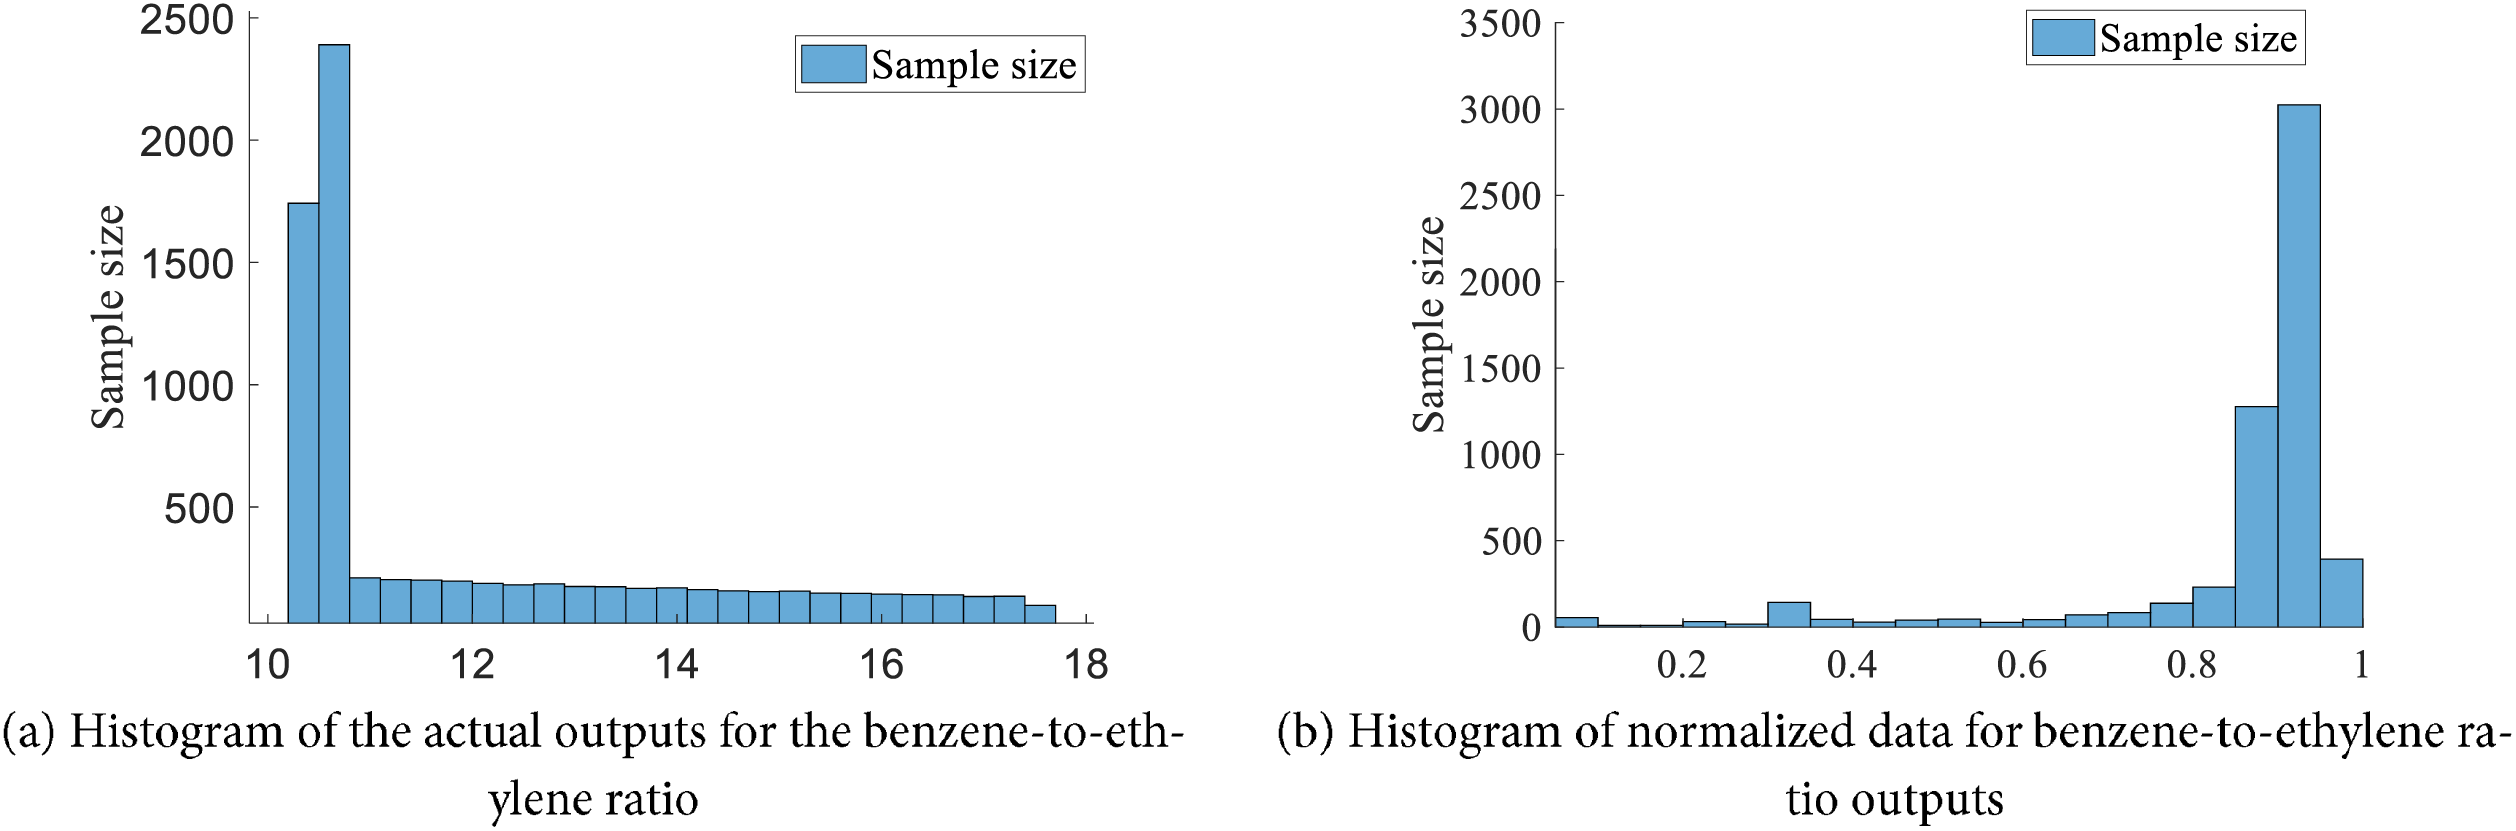
Figure 6: Interval mapping normalization for the output benzene-to-ethylene ratio
The KL, JS scatter value and Wasserstein distance value were used as the data augmentation effect test index to measure the difference between the distributions of the generated new data and the original data. The formula used to calculate this is shown in Eqs. (10)–(12):
where p and q are the probability distributions of the real and generated data, respectively, and
The root mean square error (RMSE), mean absolute error (MAE), and the coefficient of determination (R-squared, R2) are used as the assessment indexes for the health assessment model. The expressions used to calculate RMSE, MAE, and
where
5.2 Validation of the Effectiveness of WGAN-GP Data Augmentation Methods
5.2.1 Model Structure and Parameter Setting
With a focus on the chemical production characteristics of the benzene-to-ethylene ratio control system, the data generation network structure and its model parameters were designed based on a WGAN-GP. The generator had an inverse convolution network structure consisting of one FC and three inverse convolution layers, where the FC sampled from random noise, and the convolution layers learned the distribution of the actual feature quantity data from the benzene-to-ethylene ratio process assessment. The numbers of filters were 36, 72 and one, respectively. The discriminator had a convolutional structure consisting of three convolutional layers and one FC: the convolutional layers were used to extract the dynamic feature information of the feature volume data curve for the benzene-ethylene ratio control process assessment, and the FC was used to output the discriminative probability. The numbers of filters were 36, 72 and 144, respectively.
The activation function of the fully connected layer is Sigmoid, for the generator, the Sigmoid activation function enables the discriminator to take the output fake data as input; for the discriminator, the Sigmoid activation function converts the judgment results of the input data into probability values. The convolution kernel size of both the inverse convolutional layer and the convolutional layer is 3 × 3, the step size is 1, and the activation function is ReLU. The combination of the three captures the local features more finely, learns the feature mapping of the data, distributes the features, controls the changes in the generated data, and improves the fidelity of the generated samples. The gradient penalty coefficient
5.2.2 Generated Data Similarity Validation
The 475 × 7 data matrix for the benzene circuit of the benzene-to-ethylene ratio control system, the four ethylene circuits, the assessment indexes of the MPC, and the seven feature quantities of the follower performance indexes were input into the WGAN-GP network model described above. By adjusting the appropriate parameters, the loss function plots of the generator and discriminator were obtained as shown in Fig. 7. The corresponding scatter plots of the real data and the generated data visualization data are shown in Fig. 8.
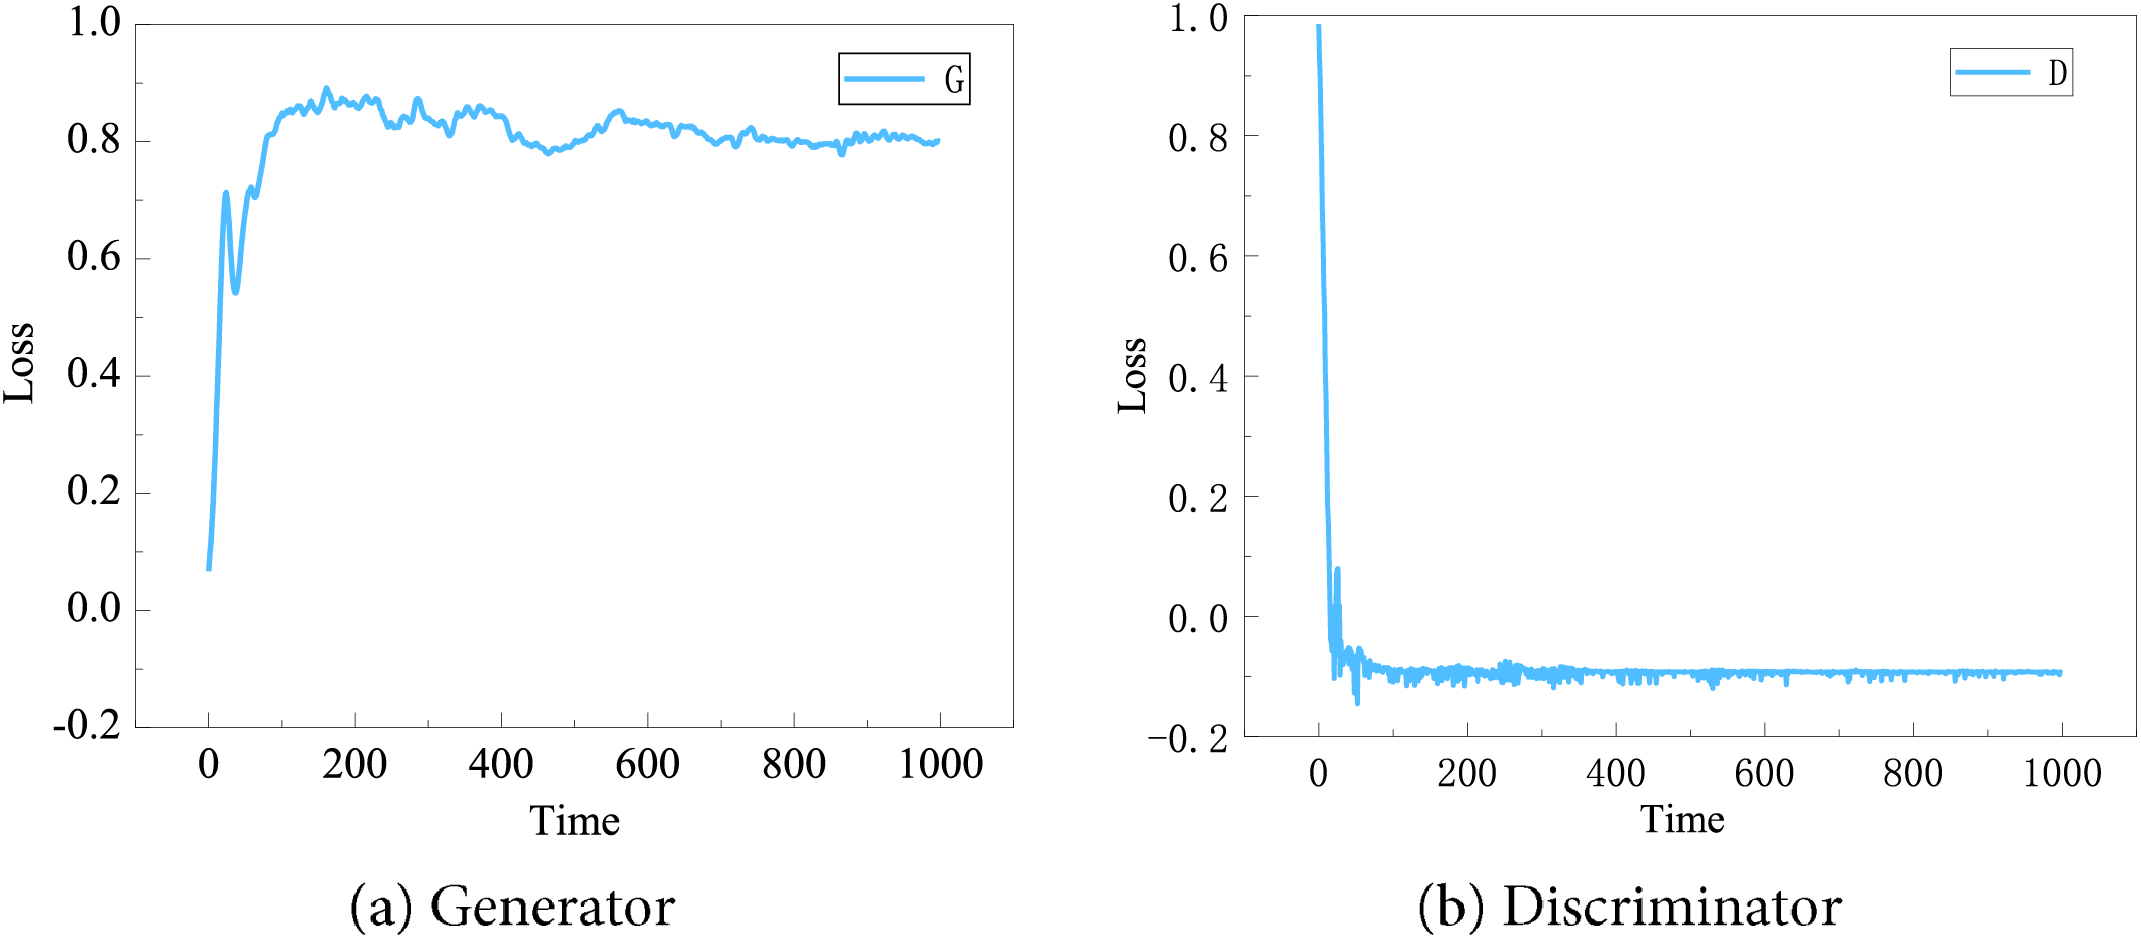
Figure 7: Plots of loss functions for the generator and discriminator
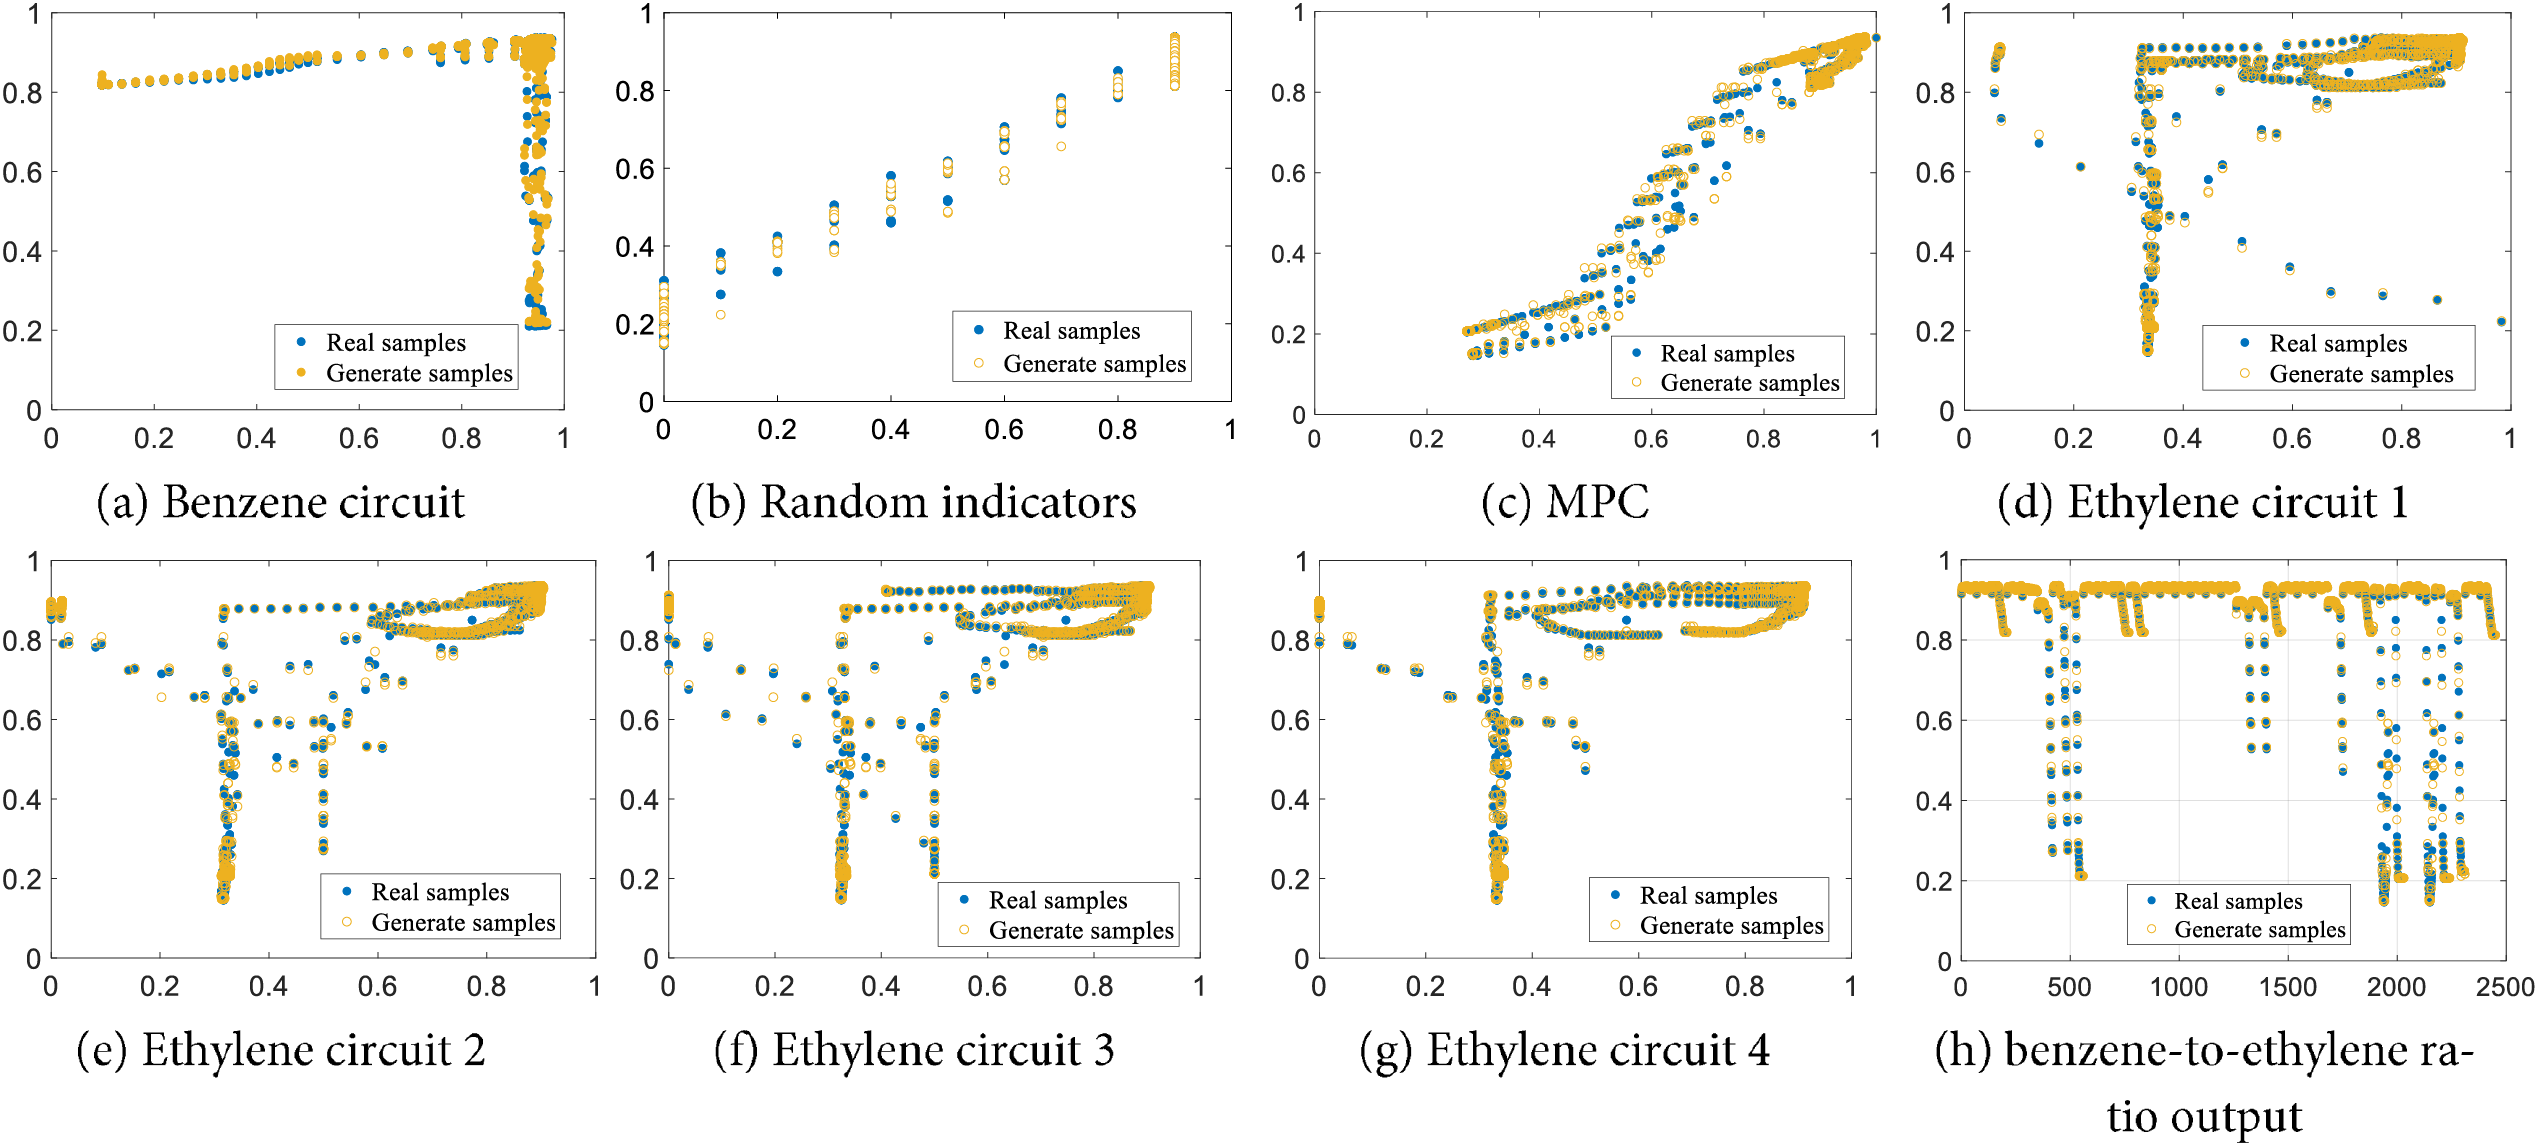
Figure 8: Scatterplots of real and generated samples for comparison
Fig. 7 shows the variation of generator and discriminator losses during the training of the WGAN-GP-based adversarial generative network. From Fig. 7a, it can be seen that the generator gradually converges after the 200th round, however, due to the adversarial training, it does not reach the Nash equilibrium until close to the 1000th round, which can stably generate data that approximates the training data distribution; In Fig. 7b, the discriminator loss, on the other hand, quickly converges to a range, but due to the adversarial training, it does not converge stably until close to the 1000th.
Fig. 8 shows data scatter plots, where the horizontal coordinate represents the independent variable (i.e., the data on the seven selected health assessment feature measures), and the vertical coordinate represents the dependent variable (i.e., the actual benzene-to-ethylene ratio output value after normalization of the corresponding interval mapping). It can be seen from the figure that the distributions of the generated samples and the real samples are similar. The Wasserstein distance is used to replace the JS scatter in the GAN, and a gradient penalty term is introduced to make the distributions of the generated samples match the real samples. Furthermore, taking the benzene loop in Fig. 8a as an example, it can be seen that as the performance of the benzene loop improves, the output of the benzene-to-ethylene ratio that reacts to the health state of the system increases and tends towards one. Taking the scatter plot of MPC data in Fig. 8c as an example, it can be seen that when both the eigenvalue of the MPC data and the benzene-to-ethylene ratio output value are less than 0.2, no data distribution is presented; this indicates that the MPC is no longer able to macroscopically regulate and control the control system, and there is a state of uncontrollability, which is by the actual process. The proposed data augmentation method based on the WGAN-GP model can therefore provide a reasonable system health assessment for the subsequent assessment data basis.
As can be seen from Table 2, compared to models such as GAN, AGAN and WGAN, the WGAN-GP data enhancement model used in this paper not only has smaller KL and JS scattering values but also has the smallest Wasserstein distance. This means that it can generate high-quality samples that are more similar to the distribution of the real data, and which can be used to assess the data augmentation expansion. The proposed approach can therefore reduce the impact of the imbalance of the data state categories on the accuracy of the system’s health assessment.
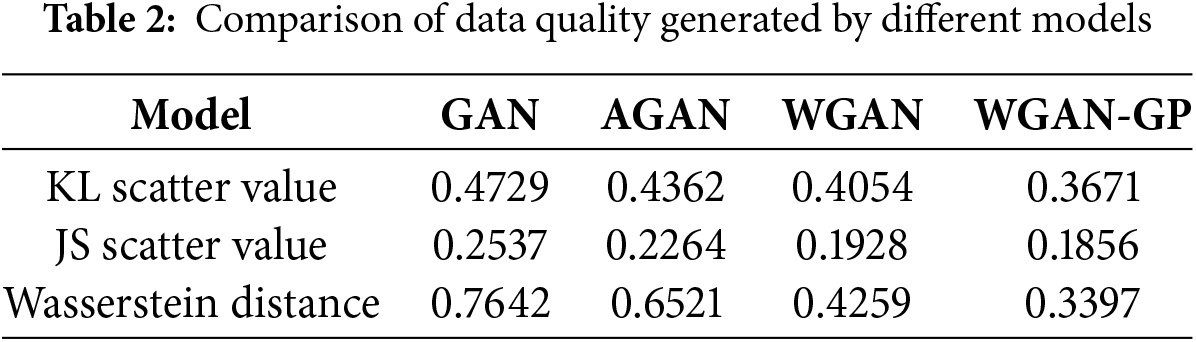
Table 2 shows a comparison of the KL scatter values for different data enhancement models.
5.3 Validity of Health Assessment Method
5.3.1 Validation of Assessment Method
The samples generated using the WGAN-GP network and the original samples were combined to form a complete system health assessment dataset, which was divided into training, validation and test sets using a ratio of 8:1:1. According to the process characteristics of the benzene-to-ethylene ratio system, for the system assessment model ACNN, a one-dimensional convolutional layer was used with a convolutional kernel size of 3 × 3, a sliding step of one, a LeakyReLU activation function, and a max pooling layer. The network parameters were optimized using the Adam optimizer, and the learning rate was set to an initial value of 0.001, the number of training batch sizes was set to 32 and the training epochs was set to 1000, and the dropout rate of the attention layer was set to 0.3. The output of the attention layer was used as the input to the FC, and the sigmoid function was chosen as the activation function for the FC.
In order to further verify the effectiveness of the proposed data augmentation method, based on the seven feature quantities of the benzene-to-ethylene ratio control system, the complete dataset (after augmentation of the assessment data) and the original assessment data (before augmentation) were fed to the ACNN system health assessment model. A graph of the predicted versus actual values of the system health assessment indexes in the two cases is shown in Fig. 9, and a comparison of the values of the corresponding assessment indexes for the two datasets is given in Table 3.
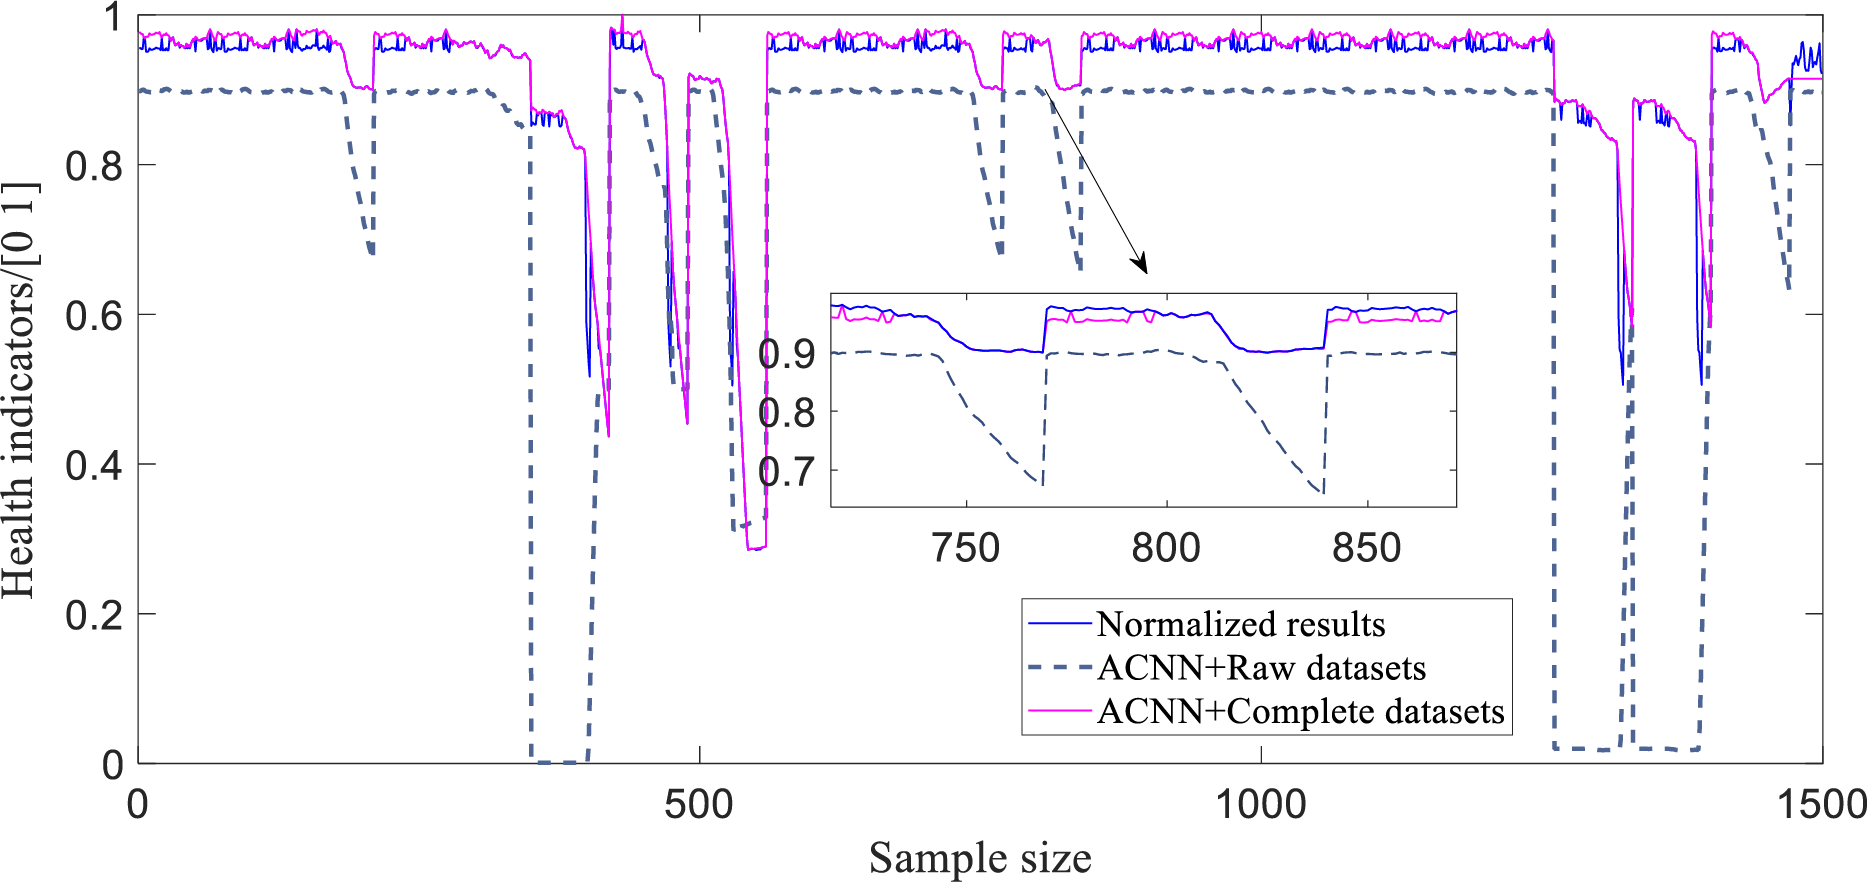
Figure 9: Results of system health assessments with different datasets
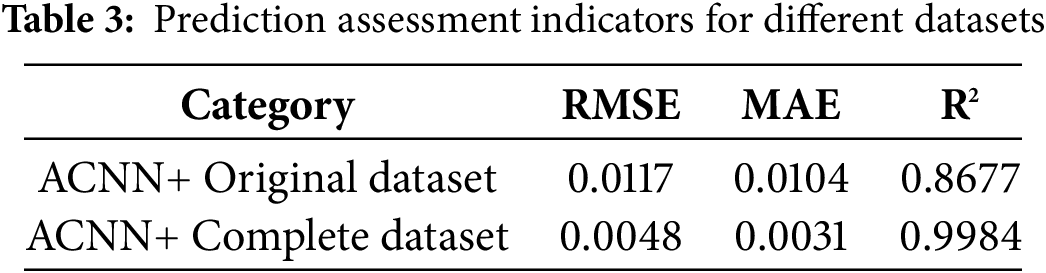
From Fig. 9, it can be intuitively seen that compared with the original assessment dataset, the results of the system health assessment based on the enhanced complete dataset are closer to the real health condition of the system. A quantitative comparison of the data on the assessment indexes in Table 3 further verifies that the WGAN-GP data augmentation method makes the assessment results more accurate, as it improves the imbalance of the distribution of the assessment data, and hence improves the accuracy of the assessment of the system’s health condition.
To verify the validity and superiority of the assessment method proposed in this paper, the complete dataset after data augmentation was fed into four alternative models, namely the ACNN, CNN, DBN, and deep confidence network with AM (ADBN), to carry out comparative experiments on the health assessment of the control system with a double-layer architecture. A comparison of the results of this assessment under the four different models is shown in Fig. 10, and the corresponding values of the assessment indexes are given in Table 4.
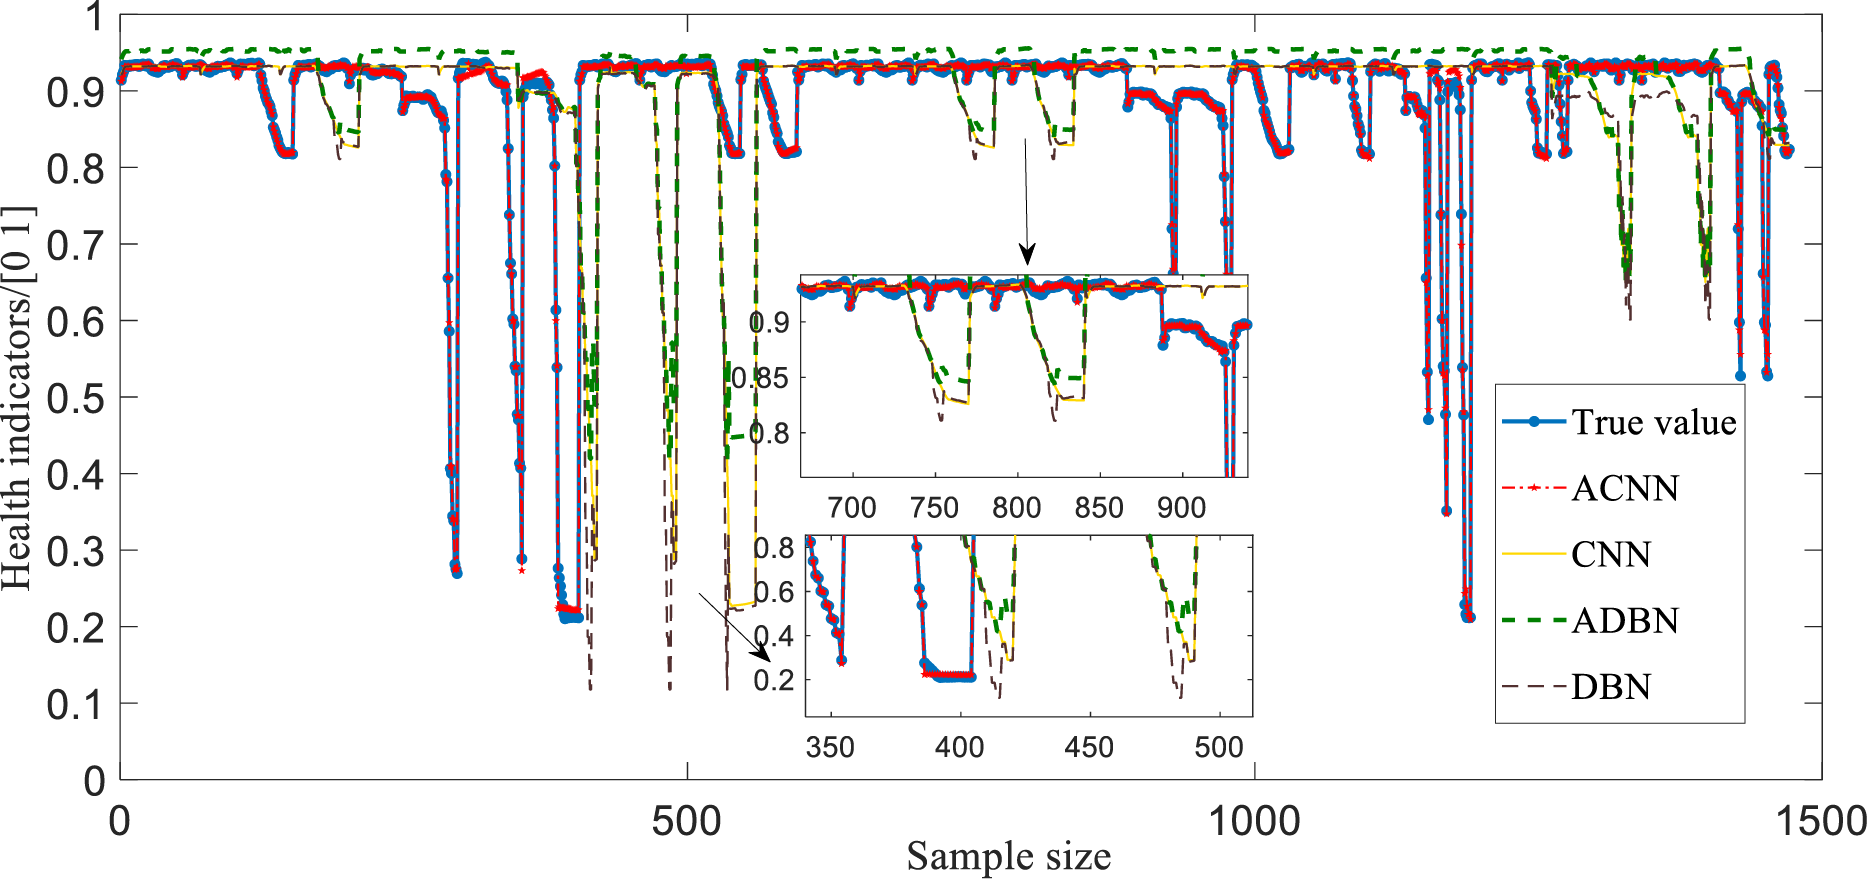
Figure 10: Prediction curves for system health assessment under different models
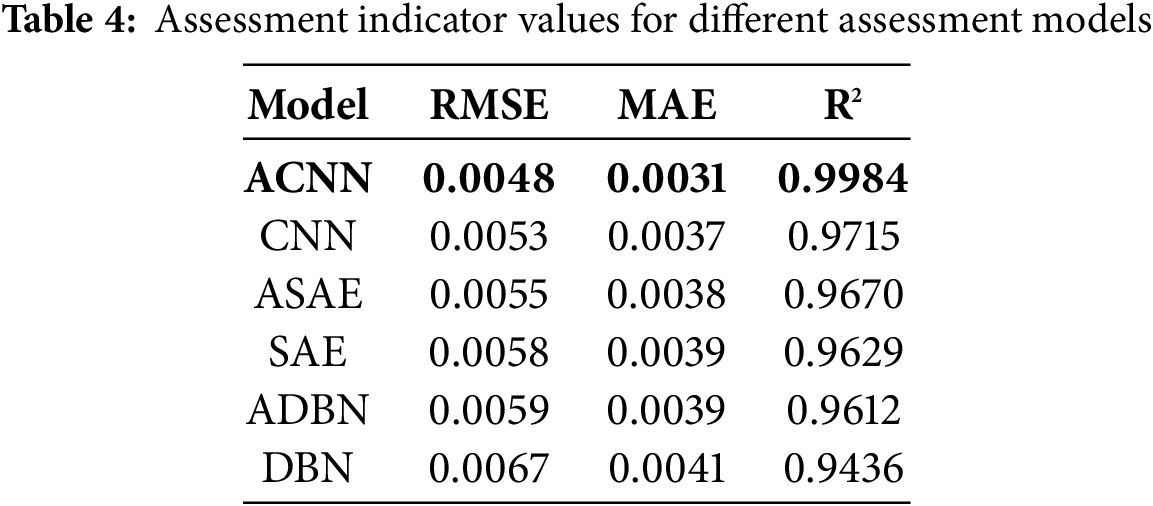
As can be seen from the prediction curves for the four models in Fig. 10, CNN and DBN are the same as deep learning networks. However, the local perception mechanism under the CNN convolution is more suitable for mining the association and coupling characteristics between the layers of the system and the units within the layers, and the assessment results are better than those of the DBN. The introduction of an AM forces the assessment model to pay more attention during training to the features that have a significant impact on the system health state; this can improve the assessment performance of CNN and DBN, and improve the assessment results of ADBN, but there is still a certain degree of mis- assessment. The health state of the control system obtained using the ACNN model proposed in this paper has the highest degree of overlap with the real health level of the system and represents a more reliable assessment result. More detailed comparisons of assessment metrics and other model comparison methods are presented in Table 4.
Furthermore, from the assessment index values for the six assessment models in Table 4, it can be seen that the R2 value for the ACNN-based assessment index in this paper is higher than for the other three models, meaning that it has a higher assessment accuracy. The smaller values of RMSE and MAE for the proposed model indicate a lower error than for the other models. Overall, the effective combination of a CNN and AM makes up for its inability to better capture and retain the important feature information in the sequence, effectively improves the accuracy of the system health assessment, and verifies the effectiveness and superiority of the health assessment method for the ratio control system based on the proposed ACNN model.
5.3.2 Traceability Analysis for a Non-Optimal Health State of the System
For the benzene-to-ethylene ratio control system with non-optimal benzene-ratio health conditions, effective traceability of the factors that cause the decline of system health is the key to ensuring the safe operation of the system. According to the ACNN assessment model, the weight assigned to each feature variable in the attention module is adaptively assigned to measure the role of each feature information in describing different health states of the system. Fig. 11 shows the contribution plot of each feature variable to the health state of the system for the benzene-to-ethylene ratio control system under the common operating conditions shown in Table 1.
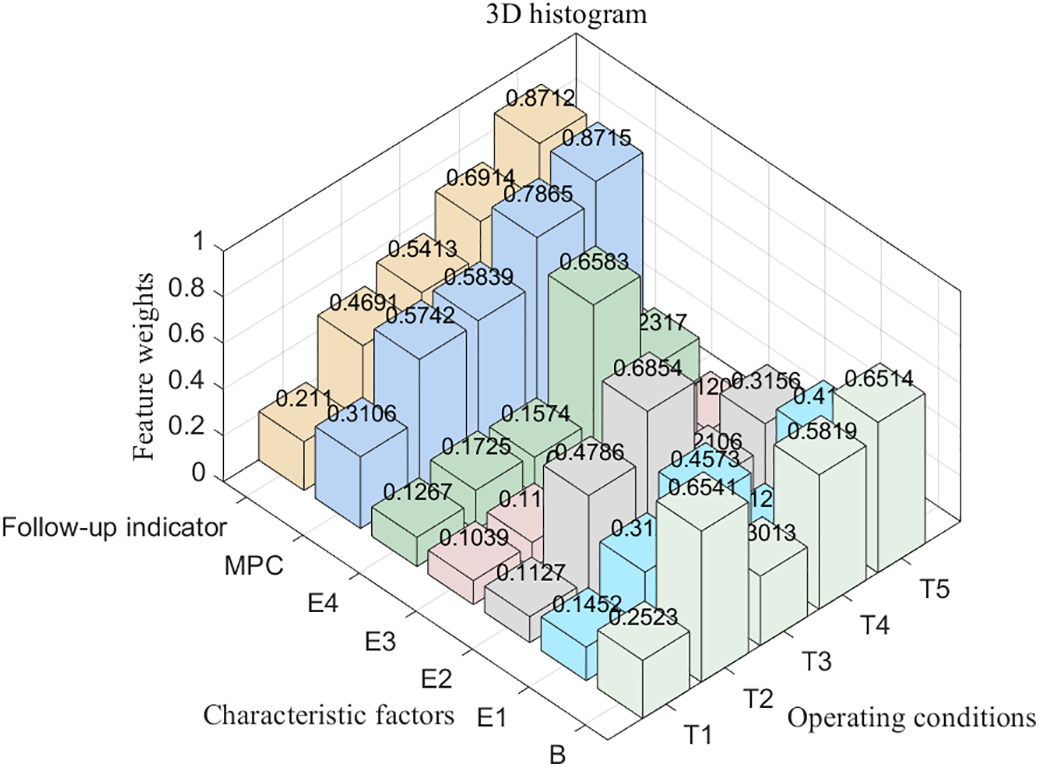
Figure 11: Contribution of each variable to the health state of the system
In the 3D histogram in Fig. 11, the x-axis shows the seven types of characteristic factors characterizing the influence on the system health state, the y-axis shows the five common operating conditions of the system, and the z-axis shows the weight value for each characteristic factor under the different working conditions, these weight values are explicitly labelled above the contribution margin. Taking operating condition T2 as an example, it can be seen from the figure that in order to explore the main factors that lead to the change in the health level of the system from T1 to this condition, observing the contribution of each feature in Fig. 11, the benzene circuit performance has the highest contribution to the health status of the system at 0.6541, and the MPC performance has the second highest contribution at 0.5742. According to the system control mechanism, the benzene material is the main material of the ratio control system. When the benzene circuit performance decreases, it will directly affect the capacity of the bottom ratio control system, consistent with the highest benzene circuit performance contribution at T2 operating conditions in Fig. 11, and subsequently influencing the regulation performance of the upper MPC, which is consistent with the operating condition T2. In addition, as the change of the operating condition from T1 to T5, it can be observed in the figure that the contribution rate of both the following index which represents the system coupling performance, and the MPC performance index gradually increases. The increase in the proportion of the two indexes affects the system capacity and makes the output of the benzene-to-ethylene ratio uncontrollable in severe cases, which is also consistent with the actual system control mechanism.
In summary, based on the characteristics of the attention mechanism focusing on the critical information in the input data, it is introduced into the assessment model, thus effectively realizing the traceability of the inducing factors of the non-optimal health state of the system, and explaining the decision-making process of the assessment model and enhancing the transparency of the model.
In this paper, a system deep learning health assessment method under incomplete data sets is proposed for a class of benzene-to-ethylene ratio control system with an MPC-PID double-layer architecture in the chemical production process. Focusing on the influence of the unbalanced health state distribution of the assessment data on the health assessment accuracy for the benzene-to-ethylene ratio control system, the WGAN-GP data augmentation method was used to obtain a complete data set that could characterize the whole health state attributes of the system. A deep learning health assessment framework for the benzene-to-ethylene ratio control system is constructed based on the traditional hierarchical assessment results. And then an ACNN system health assessment model that integrates assessment and traceability is established. The experimental results show that the ACNN assessment model, based on complete data sets and effective feature quantities, can not only assess the health state of the system more accurately but also quantify and trace the factors causing the decline of the health level of the system using attention module, enhancing the interpretability of the assessment model. It can provide reliable technical guidance for the long-cycle health assessment and maintenance of such a two-layer architecture control system. Owing to space constraints, this paper does not delve into unsupervised-based health assessment. Yet, the unsupervised paradigm, which dispenses with labelled data, holds great practical importance for deep-learning-based health assessment. We intend to explore it in our next study.
Acknowledgement: The authors sincerely thank Jianfeng Yang at PetroChina Lanzhou Petrochemical Company for his help in the health state assessment experiment of the benzene-to-ethylene ratio control system. The authors appreciate Lanzhou University of Technology for providing a stimulating and collaborative environment for this research. Specially thank the members of our research group for the professional technical support.
Funding Statement: This work was supported by the National Science Foundation of China (62263020), the Key Project of Natural Science Foundation of Gansu Province (25JRRA061), the Key R&D Program of Gansu Province (23YFGA0061), the Scientific Research Initiation Fund of Lanzhou University of Technology (061602).
Author Contributions: The authors confirm contribution to the paper as follows: Conceptualization, methodology, software, validation, writing—original draft preparation and visualization: Huichao Cao, Honghe Du; writing—review and editing, supervision, project administration and funding acquisition: Dongnian Jiang, Wei Li, Lei Du; data curation: Jianfeng Yang. All authors reviewed the results and approved the final version of the manuscript.
Availability of Data and Materials: Due to the nature of this research, participants of this study did not agree for their data to be shared publicly, so supporting data is not available.
Ethics Approval: Not applicable.
Conflicts of Interest: The authors declare no conflicts of interest to report regarding the present study.
References
1. Liu Q, Zhou J, Lang Z, Qin S. Perspectives on data-driven operation monitoring and self-optimization of industrial processes. Acta Automatica. 2018;44(11):1944–56. doi:10.16383/j.aas.2018.c180207. [Google Scholar] [CrossRef]
2. Quan Q, Gen C, Zhiyao Z, Xunhua D, Chang W, Kaiyuan C. Speculative views on health assessment of complex systems. J Jilin Univ (Eng Technol Ed). 2023;53(3):601–28. doi:10.13229/j.cnki.jdxbgxb.20221370. [Google Scholar] [CrossRef]
3. Cha Y, Ali R, Lewis J, Büyüköztürk O. Deep learning-based structural health monitoring. Autom Constr. 2024;161(3):105328. doi:10.1016/j.autcon.2024.105328. [Google Scholar] [CrossRef]
4. Zhao C. Perspectives on nonstationary process monitoring in the era of industrial artificial intelligence. J Process Control. 2022;116(10):255–72. doi:10.1016/j.jprocont.2022.06.011. [Google Scholar] [CrossRef]
5. Bu K, Liu Y, Wang F. Process operation performance assessment based on semi-supervised fine-grained generative adversarial network for efmf. IEEE Trans Instrumen Measure. 2023;72:1–9. doi:10.1109/TIM.2023.3239908. [Google Scholar] [CrossRef]
6. Ding S, Li L. Control performance monitoring and degradation recovery in automatic control systems: a review, some new results, and future perspectives. Control Eng Pract. 2021;111(10):104790. doi:10.1016/j.conengprac.2021.104790. [Google Scholar] [CrossRef]
7. Harris T. Assessment of control loop performance. Can Jo Chem Eng. 1989;67(5):856–61. doi:10.1002/cjce.5450670519. [Google Scholar] [CrossRef]
8. Paweł D. Performance assessment of predictive control—a survey. Algorithms. 2020;13(4):97. doi:10.3390/a13040097. [Google Scholar] [CrossRef]
9. Chen X, Li L, Yang S. A performance assessment methodology with coupling between layers for LP-DMC systems. Int J Robust Nonlinear Control. 2024;34(3):1584–609. doi:10.1002/rnc.7046. [Google Scholar] [CrossRef]
10. Wang S. Research and implementation of performance assessment method of two-layer architecture controller of styrene hydrocarbonization unit. Lanzhou: Lanzhou University of Technology; 2023 [cited 2025 Jun 16]. (In Chinese). Available from: https://d.wanfangdata.com.cn/thesis/D03249342. [Google Scholar]
11. Zhang YB, Zhang K, Peng KX, Yang PC. An operating performance assessment method for tolling processes via integrating hierarchical and block information. Control and Decision. 2024;39(8):2694–702. doi:10.13195/j.kzyjc.2023.0089. [Google Scholar] [CrossRef]
12. Zou X, Zhao C. Concurrent assessment of process operating performance with joint static and dynamic analysis. IEEE Trans Indus Inform. 2019;16(4):2776–86. doi:10.1109/TII.2019.2934757. [Google Scholar] [CrossRef]
13. Chu F, Hao L, Shang C, Liu Y, Wang F. Assessment of process operating performance with supervised probabilistic slow feature analysis. J Process Control. 2023;124:152–65. doi:10.1016/j.jprocont.2023.02.015. [Google Scholar] [CrossRef]
14. Li L, Yuan X, Wang Y, Sun B, Wu D. A two-layer fuzzy synthetic strategy for operational performance assessment of an industrial hydrocracking process. Control Eng Pract. 2019;93(9):104187. doi:10.1016/j.conengprac.2019.104187. [Google Scholar] [CrossRef]
15. Fan H, Wu M, Cao W, Lai X, Chen L, Lu C, et al. An operating performance assessment strategy with multiple modes based on least squares support vector machines for drilling process. Comput Indus Eng. 2021;159(11):107492. doi:10.1016/j.cie.2021.107492. [Google Scholar] [CrossRef]
16. Wang H, Wang X, Wang Z. Performance assessment method of dynamic process based on SFA-GPR. J Process Control. 2022;111(1):27–34. doi:10.1016/j.jprocont.2022.01.001. [Google Scholar] [CrossRef]
17. Grelewicz P, Khuat T, Czeczot J, Nowak P, Klopot T, Gabrys B. Application of machine learning to performance assessment for a class of PID-based control systems. IEEE Trans Syst Man Cybern Syst. 2023;53(7):4226–38. doi:10.1109/TSMC.2023.3244714. [Google Scholar] [CrossRef]
18. Chu F, Hao L, Wang F. Review and prospect of operation performance assessment methods for complex industrial processes. Control and Decision. 2023:705–18. doi:10.13195/j.kzyjc.2023.0359. [Google Scholar] [CrossRef]
19. Qiao F, Liu J, Ma Y. Industrial big-data-driven and CPS-based adaptive production scheduling for smart manufacturing. Int J Prod Res. 2021;59(23):7139–59. doi:10.1080/00207543.2020.1836417. [Google Scholar] [CrossRef]
20. Yin S, Ding S, Xie X, Luo H. A review on basic data-driven approaches for industrial process monitoring. IEEE Trans Indus Electron. 2014;61(11):6418–28. doi:10.1109/TIE.2014.2301773. [Google Scholar] [CrossRef]
21. Kim H, Park C, Suh C, Chae M, Yoon H, Youn B. MPARN: multi-scale path attention residual network for fault diagnosis of rotating machines. J Comput Des Eng. 2023;10(2):860–72. doi:10.1093/jcde/qwad031. [Google Scholar] [CrossRef]
22. Yuan X, Huang L, Ye L, Wang Y, Wang K, Yang C, et al. Quality prediction modeling for industrial processes using multiscale attention-based convolutional neural network. IEEE Trans Cybern. 2024;54(5):2696–2707. doi:10.1109/TCYB.2024.3365068. [Google Scholar] [PubMed] [CrossRef]
23. Feng H, Wang R, Song J, Gao M, Liu J, Long D. A performance evaluation framework for deep peak shaving of the CFB boiler unit based on the DBN-LSSVM algorithm. Energy. 2022;238(1):121659. doi:10.1016/j.energy.2021.121659. [Google Scholar] [CrossRef]
24. Liu Y, Ma Z, Wang F. Deep learning for operating performance assessment of industrial processes with layer attention-based stacked performance-relevant denoising auto-encoders. ACS Omega. 2023;8(16):14583–96. doi:10.1021/acsomega.3c00414. [Google Scholar] [PubMed] [CrossRef]
25. Chu F, Liao S, Hao L, Wang P, Liu Y, Wang F. Operating performance assessment method for industrial process with slowness principle-based LSTM network. Eng Appl Artif Intell. 2023;123(7):106208. doi:10.1016/j.engappai.2023.106208. [Google Scholar] [CrossRef]
26. Bu K, Liu Y, Wang F. Operating performance assessment based on multi-source heterogeneous information with deep learning for smelting process of electro-fused magnesium furnace. ISA Trans. 2022;128(3):357–71. doi:10.1016/j.isatra.2021.10.024. [Google Scholar] [PubMed] [CrossRef]
27. Liu J, Xie H, Luo X. Research progress on application of generative adversarial networks in various fields. Acta Automatica Sinica. 2020;46(12):2500–36. doi:10.16383/j.aas.c180831. [Google Scholar] [CrossRef]
28. Hu C, Cheng F, Zhao Y, Guo S, Ma L. State of charge estimation for lithium-ion batteries based on data augmentation with generative adversarial network. J Energy Storage. 2024;80:110004. doi:10.1016/j.est.2023.110004. [Google Scholar] [CrossRef]
29. Creswell A, White T, Dumoulin V, Arulkumaran K, Sengupta B, Bharath A. Generative adversarial networks: an overview. IEEE Sig Process Magaz. 2018;35(1):53–65. doi:10.1109/MSP.2017.2765202. [Google Scholar] [CrossRef]
30. Ali R, Cha Y. Attention-based generative adversarial network with internal damage segmentation using thermography. Autom Constr. 2022;141(5):104412. doi:10.1016/j.autcon.2022.104412. [Google Scholar] [CrossRef]
31. Guo J, Wang M, Sun L, Xu D. New method of fault diagnosis for rolling bearing imbalance data set based on generative adversarial network. Comput Integr Manufac Syst. 2022;28(9):2825. doi:10.13196/j.cims.2022.09.015. [Google Scholar] [CrossRef]
32. Zhu Q, Xu T, Xu Y, He Y. Improved virtual sample generation method using enhanced conditional generative adversarial networks with cycle structures for soft sensors with limited data. Indus Eng Chem Res. 2021;61(1):530–40. doi:10.1021/acs.iecr.1c03197. [Google Scholar] [CrossRef]
33. Bu K, Liu Y, Wang F. Process operation performance assessment based on multisource heterogeneous information with semisupervised transfer generative adversarial network for electrofused magnesium furnace. IEEE Trans Indus Inform. 2022;19(5):6785–93. doi:10.1109/TII.2022.3202979. [Google Scholar] [CrossRef]
34. Xu Y, Hong W, Noori M, Altabey W, Silik A, Farhan N. Big model strategy for bridge structural health monitoring based on data-driven, adaptive method and convolutional neural network (CNN) group. Struct Durab Health Monitor. 2024;18(6):763–83. doi:10.32604/sdhm.2024.053763. [Google Scholar] [CrossRef]
35. Yuan X, Wang Y, Wang C, Ye L, Wang K, Wang Y, et al. Variable correlation analysis-based convolutional neural network for far topological feature extraction and industrial predictive modeling. IEEE Trans Instrum Meas. 2024;73:3001110. doi:10.1109/TIM.2024.3373085. [Google Scholar] [CrossRef]
Cite This Article
 Copyright © 2025 The Author(s). Published by Tech Science Press.
This work is licensed under a Creative Commons Attribution 4.0 International License , which permits unrestricted use, distribution, and reproduction in any medium, provided the original work is properly cited.
 Downloads
 Citation Tools