
 Submit a Paper
 Propose a Special lssue
 Open Access
ARTICLE
Design of a Wireless Measurement Instrument for Tunnel Anchor Rod Length
1 School of Information Science and Engineering, Lanzhou University, Lanzhou, 730030, China
2 Department of Science and Technology Innovation Management, Gansu ZhiTong Technology Enginnering Detection Consulting Co., Ltd., Lanzhou, 730050, China
* Corresponding Authors: Wu Sun. Email: ; Pengfei Cao. Email:
(This article belongs to the Special Issue: Non-contact Sensing in Infrastructure Health Monitoring)
Structural Durability & Health Monitoring 2025, 19(5), 1127-1143. https://doi.org/10.32604/sdhm.2025.067069
Received 24 April 2025; Accepted 20 June 2025; Issue published 05 September 2025
 View Full Text
 Download PDF
Abstract
Accurate measurement of anchor rod length is crucial for ensuring structural safety in tunnel engineering, yet conventional destructive techniques face limitations in efficiency and adaptability to complex underground environments. This study presents a novel wireless instrument based on the standing wave principle to enable remote, non-destructive length assessment. The system employs a master-slave architecture, where a handheld transmitter unit initiates measurements through robust 433 MHz wireless communication, optimized for signal penetration in obstructed spaces. The embedded measurement unit, integrated with anchor rods during installation, utilizes frequency-scanning technology to excite structural resonances. By analyzing standing wave characteristics, anchor length is derived from a calibrated frequency-length relationship. Power management adopts a standby-activation strategy to minimize energy consumption while maintaining operational readiness. Experimental validation confirms the system effectively measures anchor lengths with high precision and maintains reliable signal transmission through thick concrete barriers, demonstrating suitability for tunnel deployment. The non-destructive approach eliminates structural damage risks associated with traditional pull-out tests, while wireless operation enhances inspection efficiency in confined spaces. This work establishes a paradigm for embedded structural health monitoring in tunneling, offering significant improvements over existing methods in safety, cost-effectiveness, and scalability. The technology holds promise for broad applications in mining, underground infrastructure, and geotechnical engineering.Keywords
Tunnel engineering, as a critical component of modern transportation infrastructure, involves significant complexity and risk, making the design and construction of support systems a core issue in ensuring structural safety [1–4]. With the acceleration of urbanization and the rapid growth of transportation demand, the scale and number of tunnel projects have steadily increased. Their applications have extended from highway and railway tunnels to urban subways, underground utility corridors, and hydraulic engineering projects [5]. In this context, the effectiveness and importance of Structural Health Monitoring (SHM) systems have become increasingly prominent, particularly in identifying modal parameters of structures and the resulting damage assessment. As pointed out in [6], the accurate identification of modal parameters is vital for evaluating the physical state and dynamic characteristics of structures, which is particularly relevant to the performance assessment of anchor systems in tunnel engineering. In these projects, the stability control of the surrounding rock directly affects the construction progress and service life, and as a mature and effective support method, anchor rods play an irreplaceable role in tunnel construction and maintenance [7–9].
However, the actual performance of anchor rod support depends not only on design parameters but also on construction quality, geological conditions, and the performance of the support system [10]. Particularly in complex geological conditions, such as weak surrounding rock, fault zones, or high-stress areas, the anchoring performance of anchor rods may exhibit significant variability. Issues such as construction errors, insufficient anchor rod length, and substandard material quality often result in the anchoring force failing to meet design requirements, thereby increasing the risk of rock instability [11]. Furthermore, during long-term service, anchor rods may suffer from corrosion, stress relaxation, or other forms of performance degradation, further exacerbating safety hazards in tunnel engineering [12,13].
Traditional methods for measuring anchor rod lengths typically rely on manual inspection or destructive testing, such as pull-out tests and sample testing. Although these methods can provide some reference data, they have several limitations: first, low efficiency, making them unsuitable for the rapid inspection required in large-scale tunnel projects; second, their destructive nature, causing irreversible damage to the integrity of the anchor rod structure [14]. On 5 June 2021, during the construction of the vertical shaft in Didong Shenghe Coal Mine of Heilongjiang Longmei Jixi Mining Industry Co., Ltd., repeated drilling in the No. 94 cross-bed gas drainage borehole of the 28th coal seam in the third section of the fifth mining area caused collapse of the surrounding coal mass and expansion of the borehole diameter. The failure of the coal mass safety barrier eventually triggered a coal and gas outburst accident, with 793.8 t of coal outburst and approximately 10,200 cubic meters of gas emission, resulting in 8 miners being trapped; and third, their susceptibility to challenges in complex tunnel environments, such as restricted space and signal interference, which hinder accurate measurement [15].
To address the limitations of traditional anchor rod length measurement methods, this study proposes a wireless measurement system for tunnel anchor rod lengths based on the standing wave method. The system integrates the measurement device with the anchor rod for embedded installation. After construction is completed, precise and non-destructive length measurements can be achieved through wireless signal transmission. The standing wave method adopted in this system is rooted in the theory of wave propagation, which has been previously applied to structural health monitoring by utilizing the reflection characteristics of elastic waves at material interfaces [16,17]. This method typically involves exciting the structure with periodic signals and analyzing the amplitude-frequency response to identify resonance points directly related to the structural geometry. For anchor rods, the method is based on the characteristic that the length of the rod determines the wavelength of the standing wave, thus enabling non-destructive length estimation through frequency-domain analysis [18]. It also utilizes the 433 MHz frequency band, which offers strong signal penetration and is well-suited for complex tunnel environments, ensuring efficient and reliable data transmission [19–22].
This paper elaborates on the system’s design principles, implementation process, and experimental validation, demonstrating its efficiency and reliability in measuring anchor rod lengths in tunnel environments. The findings indicate that this system provides an innovative, high-efficiency wireless measurement solution for anchor rod detection, offering significant contributions to enhancing the quality and safety of tunnel anchoring projects.
2 Overview of the Hardware System
The wireless measurement device for anchor rod length consists of two major components: the handheld unit and the measurement unit. The measurement unit, embedded with the anchor rod in the tunnel, activates upon receiving a measurement command from the handheld unit via the 433 MHz wireless module. The STM32 microcontroller within the measurement unit powers the frequency scanning module to generate PWM (Pulse Width Modulation) signals for exciting the anchor rod, while simultaneously sampling the envelope voltage of the excitation signal in real-time. By identifying the frequency corresponding to the minimum envelope voltage, the system calculates the anchor rod length, which is then modulated onto a 433 MHz carrier wave and transmitted back to the handheld unit for display. The handheld unit orchestrates the workflow by sending control commands and receiving results, with the entire system operating under a master-slave architecture that transitions to low-power standby mode after data transmission to conserve energy. The overall system architecture is illustrated in the block diagram shown in Fig. 1 below.
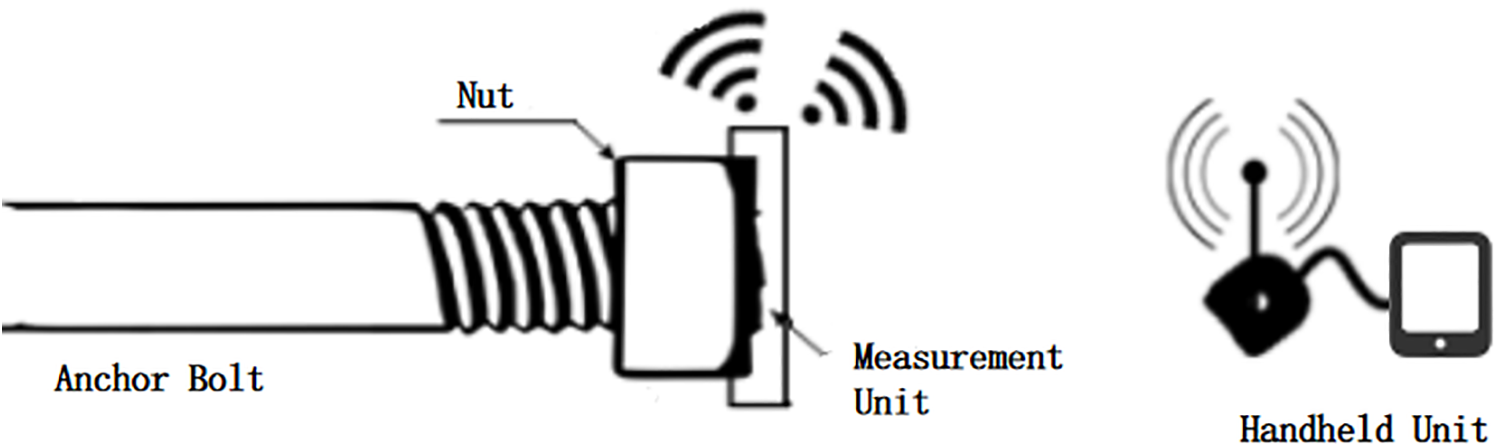
Figure 1: Block diagram of the overall system architecture
To verify the practical feasibility of the system, the following key technical specifications are provided: The measurement range covers anchor rod lengths from 1 to 10 m. The 433 MHz wireless communication achieves a transmission distance of 25 m in obstacle-free environments, maintaining communication capabilities of 8.5 and 2 m after penetrating 30 and 60 cm concrete, respectively. The power consumption design adopts a “standby-activation” mode, where the standby power consumption of the measurement unit is ≤5 mA, the current during each measurement cycle is less than 60 mA, and the measurement duration lasts for 5 min, and the low-power mode can last 30 days with a 2000 mAh lithium battery. The device’s physical parameters include a measurement unit diameter of 45 mm and weight of 50 g, and adaptability to tunnel environments with temperatures ranging from −20°C to 60°C and humidity ≤90%. The hardware cost and compact design support large-scale engineering applications.
2.2 Hardware Architecture of the Device
The measurement system adopts a dual-chip architecture, with the STM32F103 microcontroller (Shenzhen, China) (hereafter referred to as STM32) as the main controller. Upon receiving a measurement command from the handheld unit, the STM32 supplies power to the frequency scanning module by setting a specific GPIO pin to a high state. The frequency scanning module then generates PWM signals at different frequencies to excite the anchor rod. Meanwhile, the STM32’s ADC module continuously samples the detected envelope voltage in real-time. By analyzing the changes in the envelope voltage, the frequency corresponding to the minimum envelope voltage is identified. Experimental results show that there is a one-to-one correspondence between the anchor rod length and the frequency. We measured the frequencies of anchor rods with different lengths and fitted a relationship, allowing the calculation of the anchor rod length based on the frequency [23].
The STM32F103 microcontroller was selected as the main controller for its optimal balance of performance and cost. Featuring a Cortex-M3 core operating at 72 MHz, it provides sufficient computational capability to process real-time envelope voltage sampling (12-bit ADC with 14 MHz sampling rate) and frequency-domain analysis for standing wave calculations. Compared to alternative models (e.g., Arduino Due), the STM32F103 offers lower power consumption (standby current <1 mA) and integrated peripherals, which are critical for implementing the ‘standby-activation’ power management strategy. Its industrial-grade temperature tolerance (−40°C to 85°C) also ensures reliability in tunnel environments with fluctuating temperatures.
The calculated result is converted into specific length information and stored in STM32’s internal memory. Once the measurement process is complete, the power supply to the frequency sweep module is disabled, and the system transitions to standby mode, awaiting further commands from the handheld controller. Upon receiving a command to transmit the length information, STM32 modulates the anchor rod length data onto a 433 MHz carrier wave and transmits it to the handheld device. The structural diagram of the measurement system is shown in Fig. 2.
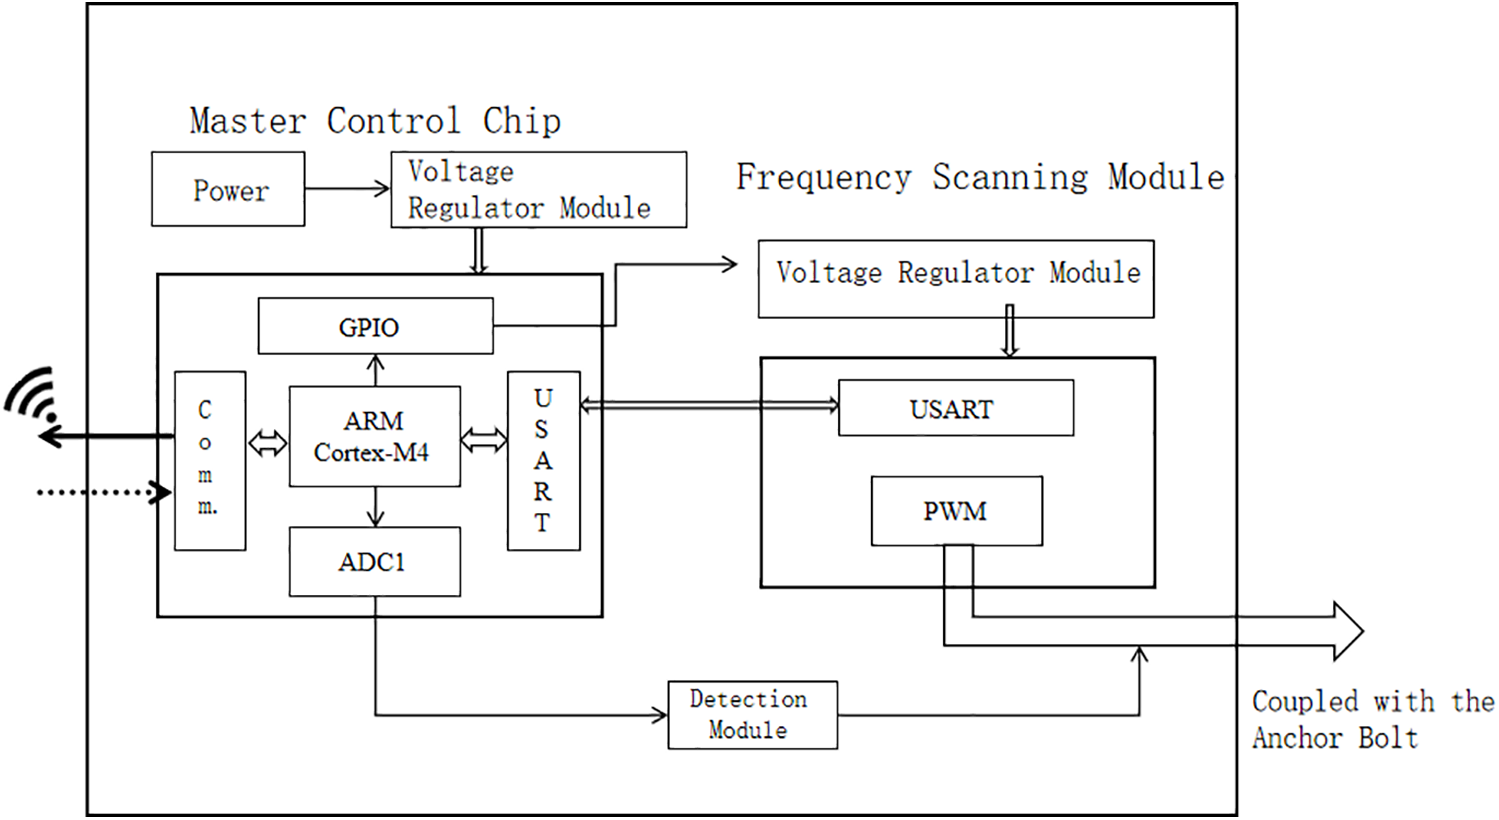
Figure 2: Measurement unit system architecture
To meet the design requirements, the core hardware circuits were developed with a focus on cost-effectiveness and performance. The main control chip features low cost, low power consumption, and stable performance, which effectively reduces system costs and extends the device’s battery life. The frequency sweep module employs a chip with a main frequency of 120 MHz and is configured to scan within a frequency range of 6 to 25 MHz, generating high-frequency PWM waves. This setup meets the requirements for measuring anchor rods with lengths ranging from 1 to 10 m. A 3.7 V voltage regulator chip is used to provide stable power supply to the various circuit components.
The communication module is designed using a 433 MHz wireless communication module, which is characterized by low power consumption and high penetration capability, making it suitable for applications in complex tunnel environments [24,25]. In simulated tunnel conditions (e.g., through 30 cm-thick concrete), the signal demonstrates an effective transmission distance of approximately 8 m. When equipped with a signal repeater, the system is expected to extend coverage to meet typical tunnel communication requirements. The module’s transmitter has a power output of 32 dBm, and the receiver features a sensitivity of −102 dBm, ensuring reliable performance. As shown in Fig. 3, the attenuation of different frequencies in concrete increases significantly with the rise of frequency. When the obstacle size remains the same, higher-frequency signal exhibit more severe attenuation compared to the 433 MHz low-frequency carrier. This phenomenon confirms that low-frequency waves possess stronger penetration capability in complex tunnel environments with dense obstacles. Therefore, the adoption of a 433 MHz low-frequency carrier in our design effectively mitigates signal degradation, ensuring reliable wireless transmission and measurement accuracy in tunnel construction scenarios.
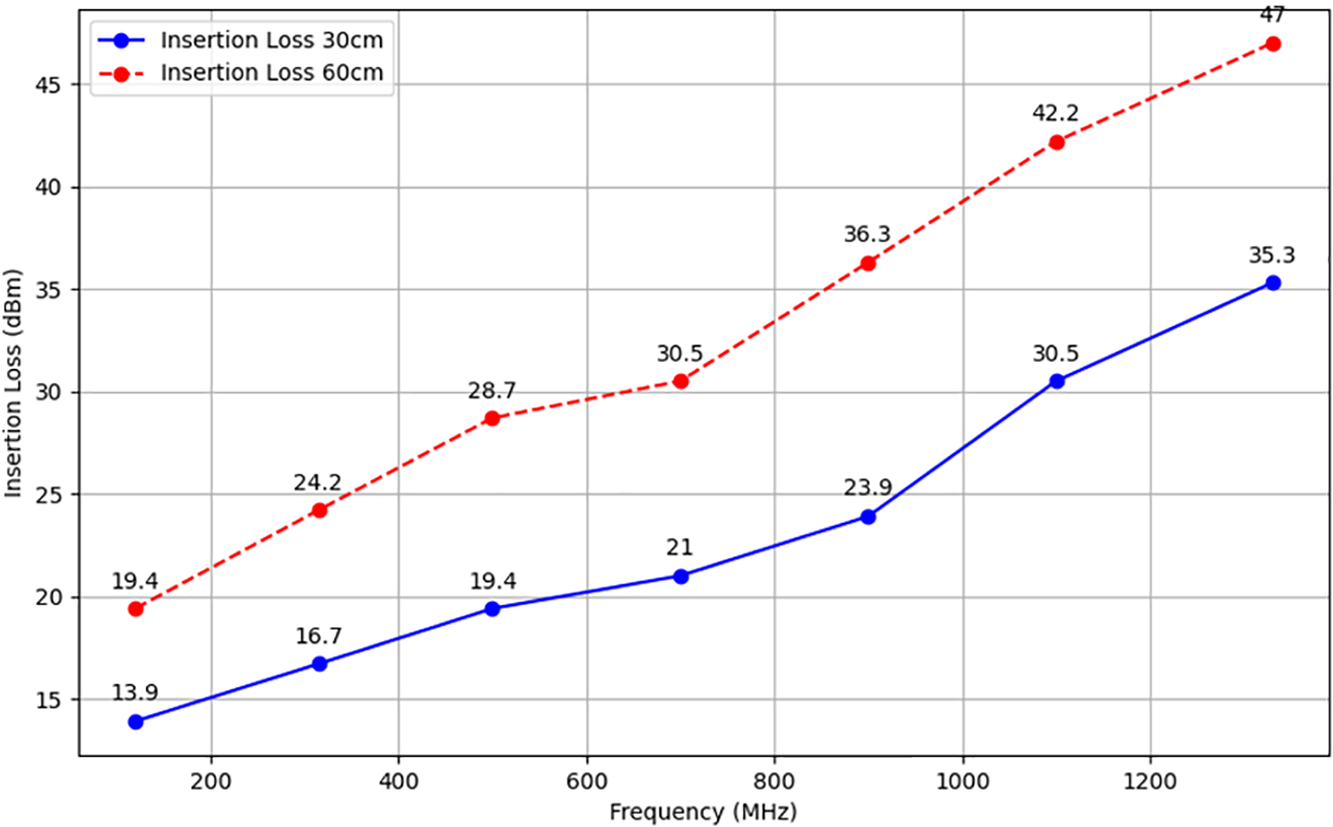
Figure 3: Damping effect of concrete wall thickness on frequency
The slave control unit’s microcontroller, with its high clock speed of 120 MHz, is capable of generating high-frequency PWM signals to meet the requirements of the external detection module for high-frequency signal excitation. Additionally, the slave control unit communicates with the master control chip via USART (Universal Synchronous/Asynchronous Receiver Transmitter), synchronizing the measured frequency data with the master chip for subsequent calculations. The circuit is illustrated in Fig. 4.
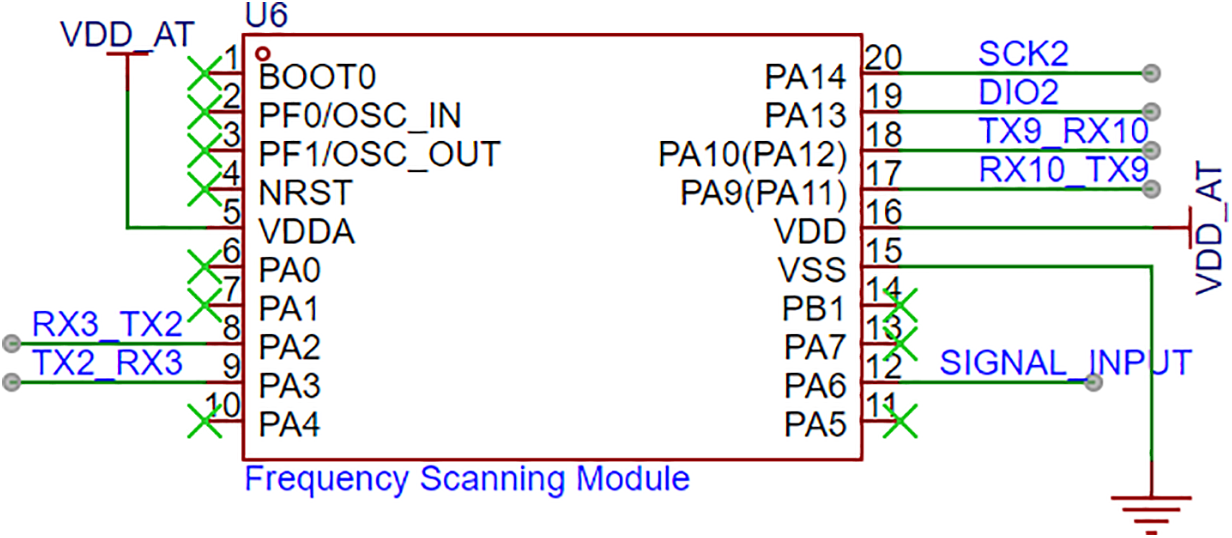
Figure 4: Circuit of the slave control unit
The envelope voltage of the excitation signal after transmission through the anchor rod structure was extracted in this study. A high-frequency detection module was designed to achieve envelope detection of the signal. Specifically, the input signal is a high-frequency oscillatory signal whose amplitude is influenced by the standing wave characteristics of the anchor rod. The function of the detection module is to convert the high-frequency signal transmitted through the anchor rod into a direct current (DC) voltage, thereby extracting the envelope information of the signal. The circuit is shown in Fig. 5.
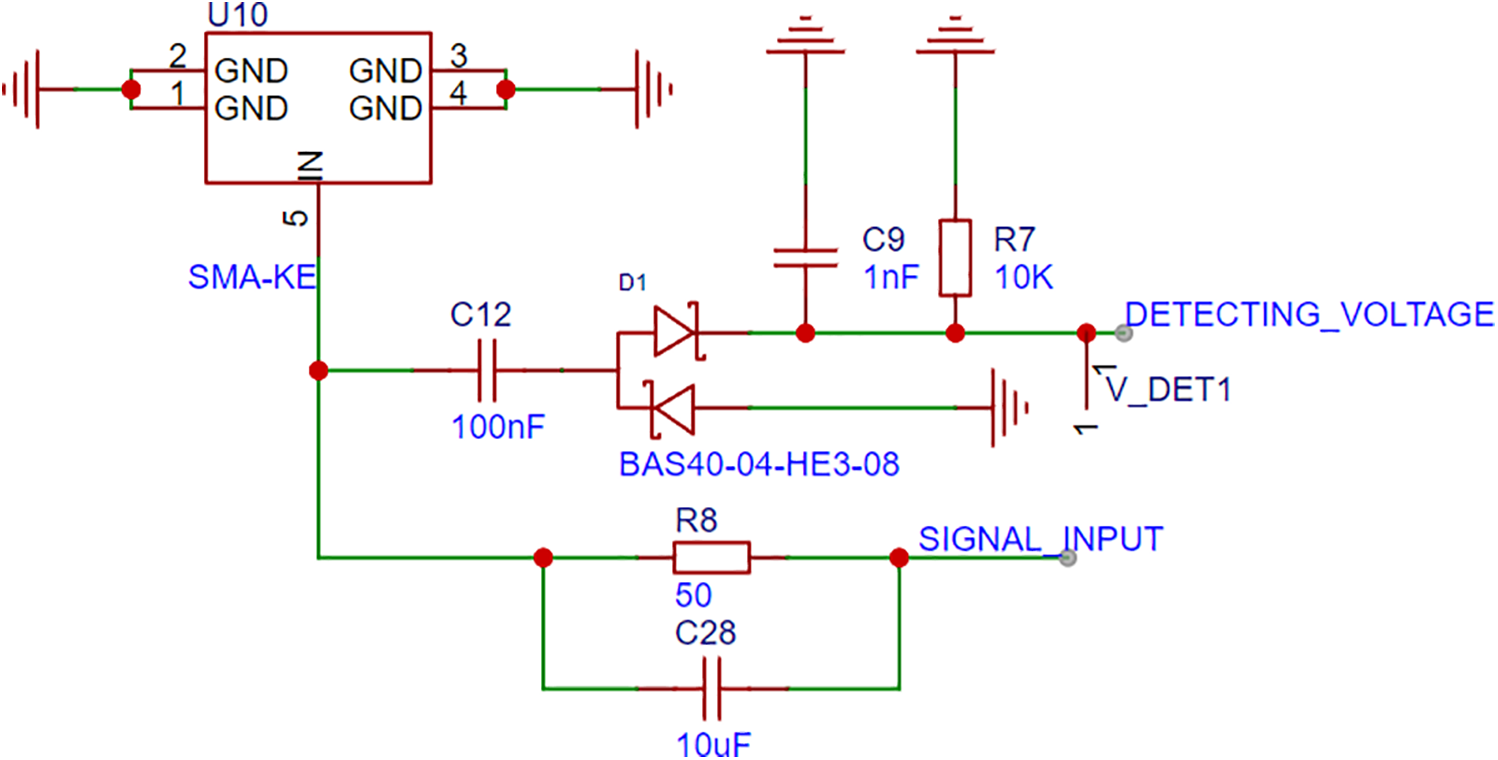
Figure 5: Voltage detection module
This high-frequency signal envelope detection module implements high-frequency signal rectification and envelope extraction based on the Schottky diode (D1: BAS40-04-HE3-08). The signal is input via SIGNAL_INPUT, with radio-frequency impedance matching accomplished by a 50 Ω resistor (R8). A 10 μF electrolytic capacitor (C28) filters out low-frequency noise (cutoff frequency ≈ 318 Hz). The rectification stage utilizes the low forward voltage drop (0.3 V) of D1 for half-wave rectification, followed by an RC low-pass filter composed of a 1 nF capacitor (C9) and a 10 kΩ resistor (R7) (cutoff frequency ≈ 16 kHz) to remove high-frequency carriers and extract the signal envelope. The output terminal (DETECTING_VOLTAGE) generates a DC voltage linearly proportional to the input signal amplitude.
3 Software Design for the Measurement Instrument
To meet the low-power design requirements of the measurement instrument, we not only selected low-power hardware components but also optimized the software workflow. The software employs a phased activation strategy using instruction triggering and standby monitoring. High-energy consumption units, such as the microcontroller and communication module, are activated only when measurement is required. This approach ensures that the overall design minimizes power consumption while maintaining performance. The design workflow is illustrated in Fig. 6.
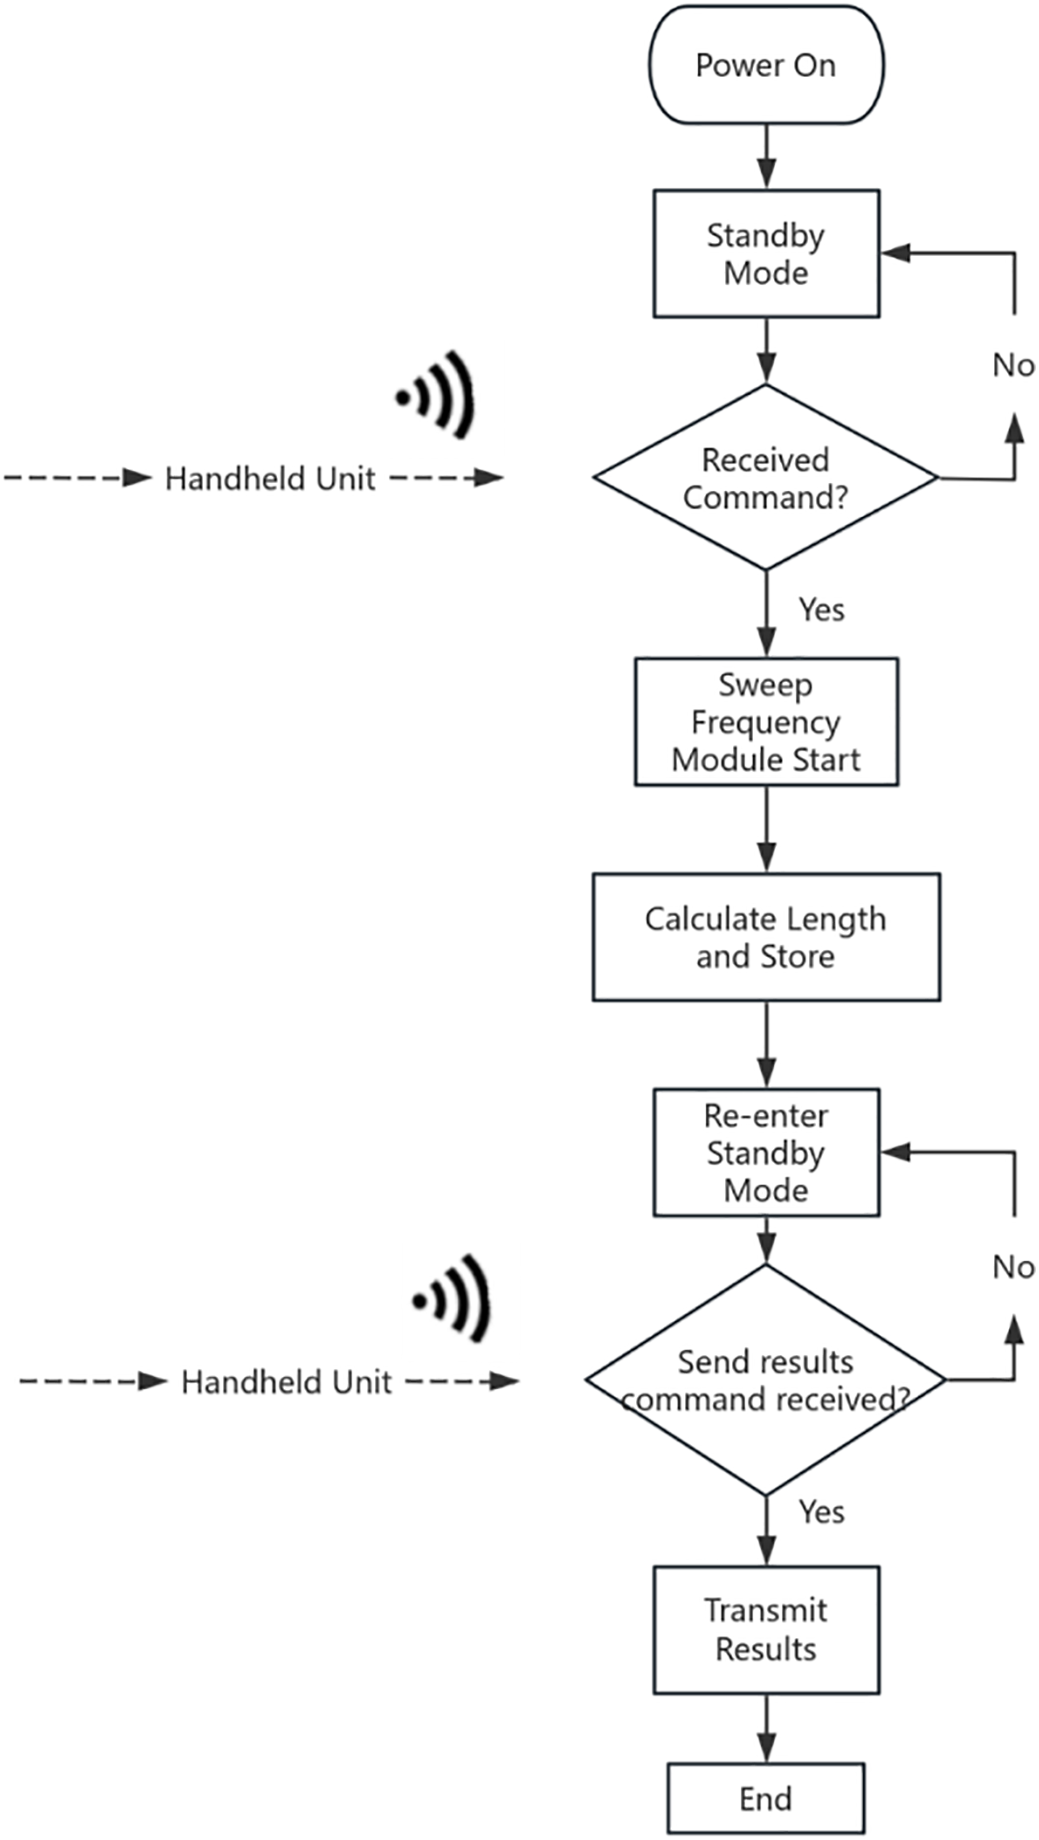
Figure 6: Software architecture of the anchor rod length measurement instrument
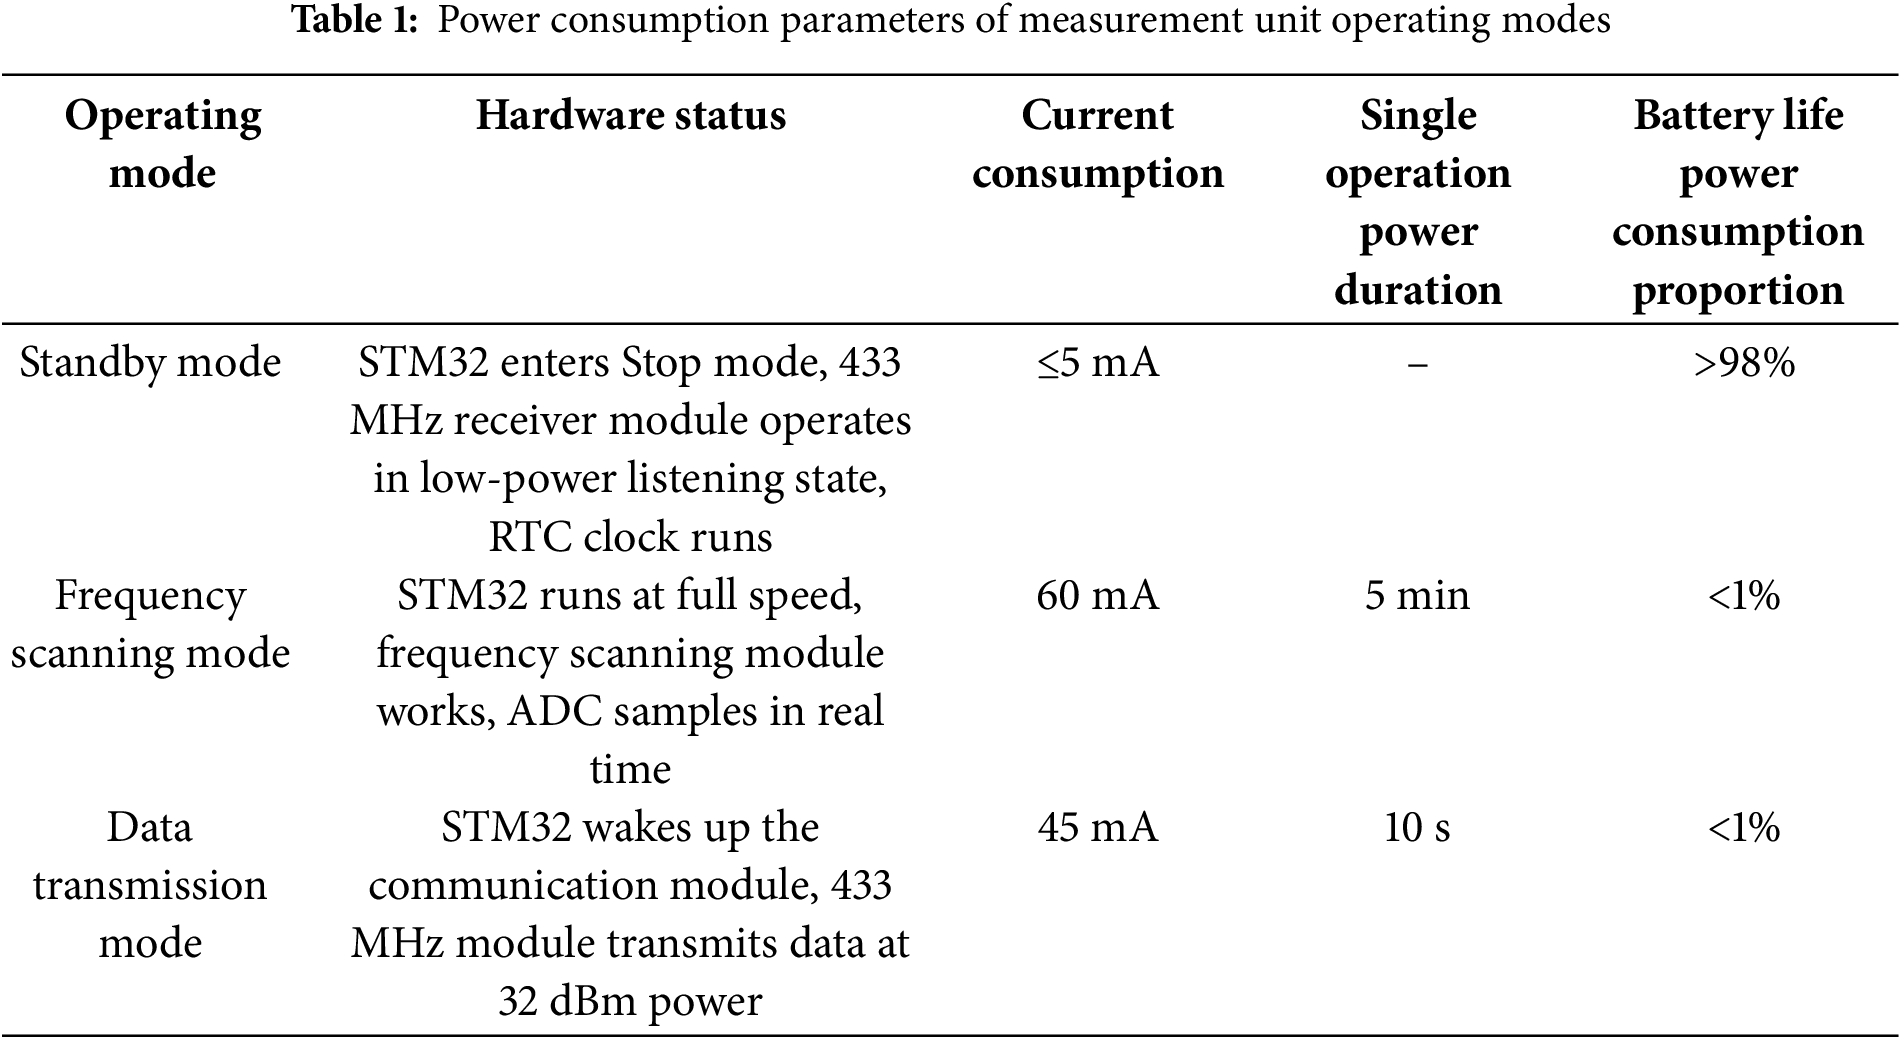
To quantitatively demonstrate the power reduction effect of the software optimization, we conducted detailed power consumption measurements under different operational modes. The results, summarized in Table 1 below, clearly show the significant power savings achieved through the phased activation strategy and standby monitoring mechanism.
The 433 MHz module commonly utilizes the EV1527 communication protocol, in which each data frame is composed of 24 data bits. To enhance the reliability of data transmission and satisfy the demands of practical engineering applications, this system expands the data frame to 32 bits. The structure of the frame is segmented into four distinct sections: Device ID, Command, Data, and Checksum. The specific composition and arrangement of these sections are detailed in Table 2.
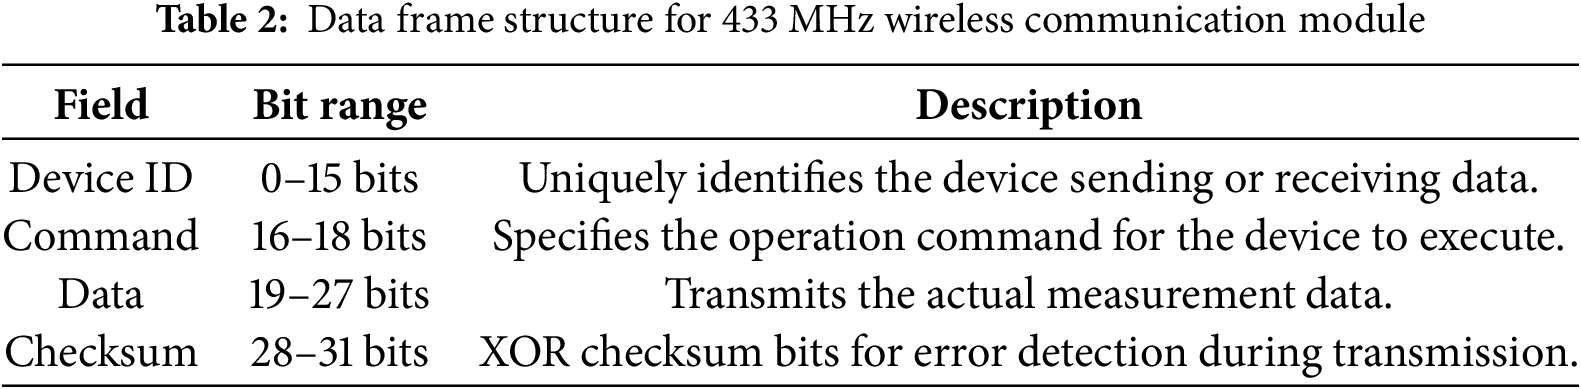
The wireless communication module completes data packaging and transmission using the aforementioned data frame structure. During transmission, the transmitter encapsulates the measurement results into data frames following the protocol format and sends them via a 433 MHz wireless signal. Upon receiving a data frame, the receiver first verifies data integrity using the checksum, then parses the Device ID and Data fields to ensure accurate acquisition of the anchor rod length information.
To address the complexity of tunnel environments and signal interference, the system employs a multi-layer error detection and retransmission mechanism. Data retransmission is triggered under the following conditions: First, when the receiver verifies the data frame via Exclusive OR (XOR) checksum and detects a check failure (i.e., the Checksum field of the received frame disagrees with the actual value), it returns an error flag to the transmitter to initiate retransmission. Second, when the receiver detects that the signal strength falls below −101 dBm (the system’s receiving sensitivity threshold), it actively sends a retransmission request. Third, the transmitter starts a 10-s timeout timer upon sending the data frame. If no acknowledgment (ACK) is received from the receiver within this period, the communication link is deemed abnormal, triggering retransmission. The process is illustrated in Fig. 7.
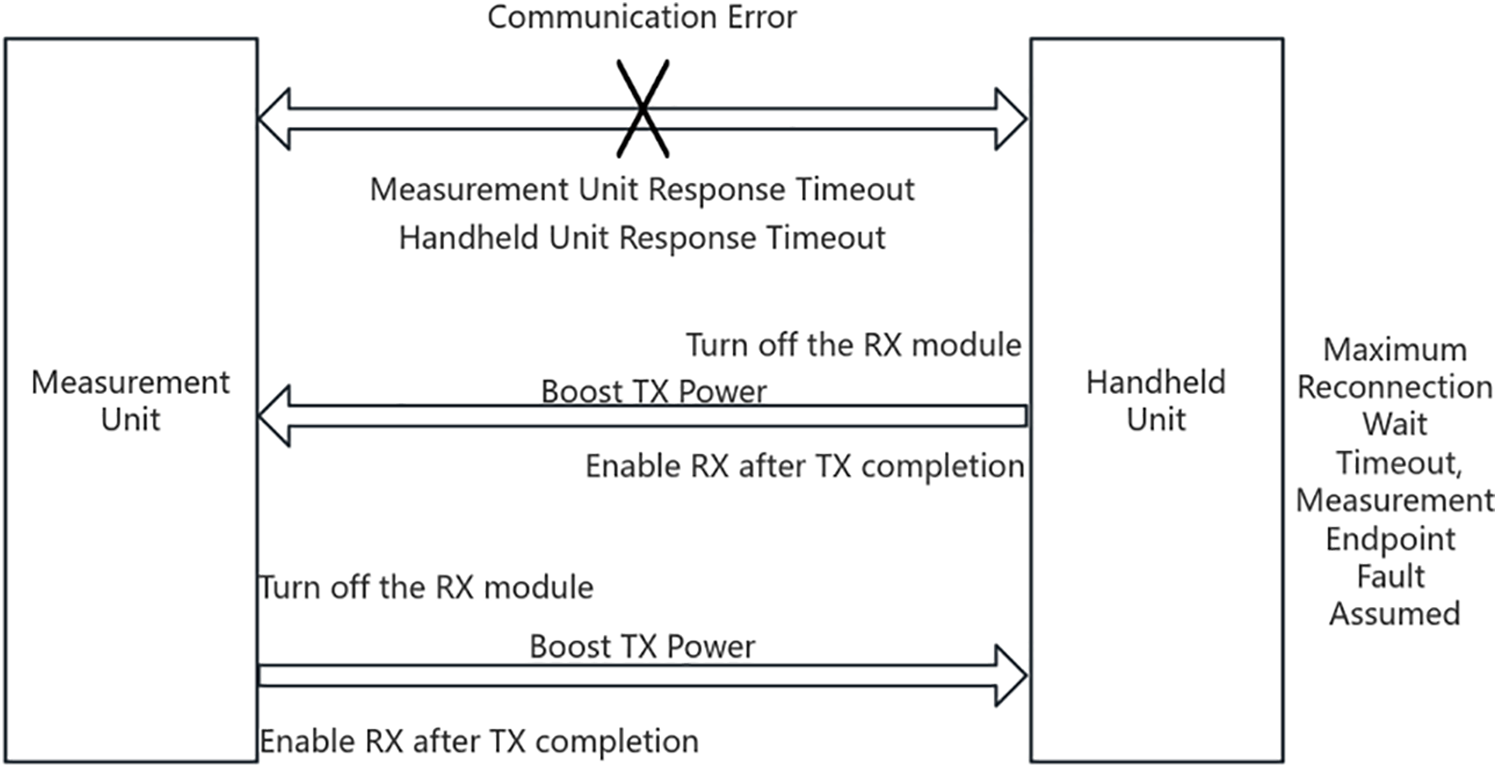
Figure 7: Communication fault detection and handling
4.1 Anchor Rod Length Measurement Experiment
As stated in References [26–28], there exists a corresponding relationship between the standing wave response frequency of the measured object and the object length. In this study, the standing wave method was adopted to measure anchor rods of different lengths, and the corresponding response frequency data were obtained. Through rigorous regression analysis of the experimental dataset, a quantitative model describing the inverse proportionality between length and frequency was established, expressed as:
where L represents anchor rod length in meters, and F denotes standing wave response frequency in MHz. Through statistical verification, the Pearson correlation coefficient reaches r = 0.985 (p < 0.01), confirming the robust inverse relationship predicted by wave mechanics theory. The coefficient of determination (R2 = 0.970) further validates that the model accounts for 97.0% of the length-frequency covariation within the measured parameter space.
The experimental results demonstrate that the system successfully achieves accurate measurement of anchor rod length, validating the feasibility and precision of the standing wave-based method. As shown in Fig. 8, the voltage-frequency curves for 3-m and 2-m anchor rods are presented, highlighting their respective minimum voltage points. The data points represent the average of 5 repeated measurements, with deviations within ±5% of the mean. The minimum voltage is observed at 13.20 MHz when measuring a 3-m rod, and at 15.70 MHz when measuring a 2-m rod. These results illustrate how the system excites the anchor rod using PWM waves of varying frequencies and reliably detects the minimum point frequency of the envelope voltage to calculate the rod length. The figure indicates that the system maintains measurement accuracy across different length ranges, with errors controlled within the expected range, and further suggests a notable correlation between frequency and anchor rod length, supporting the method’s reliability.
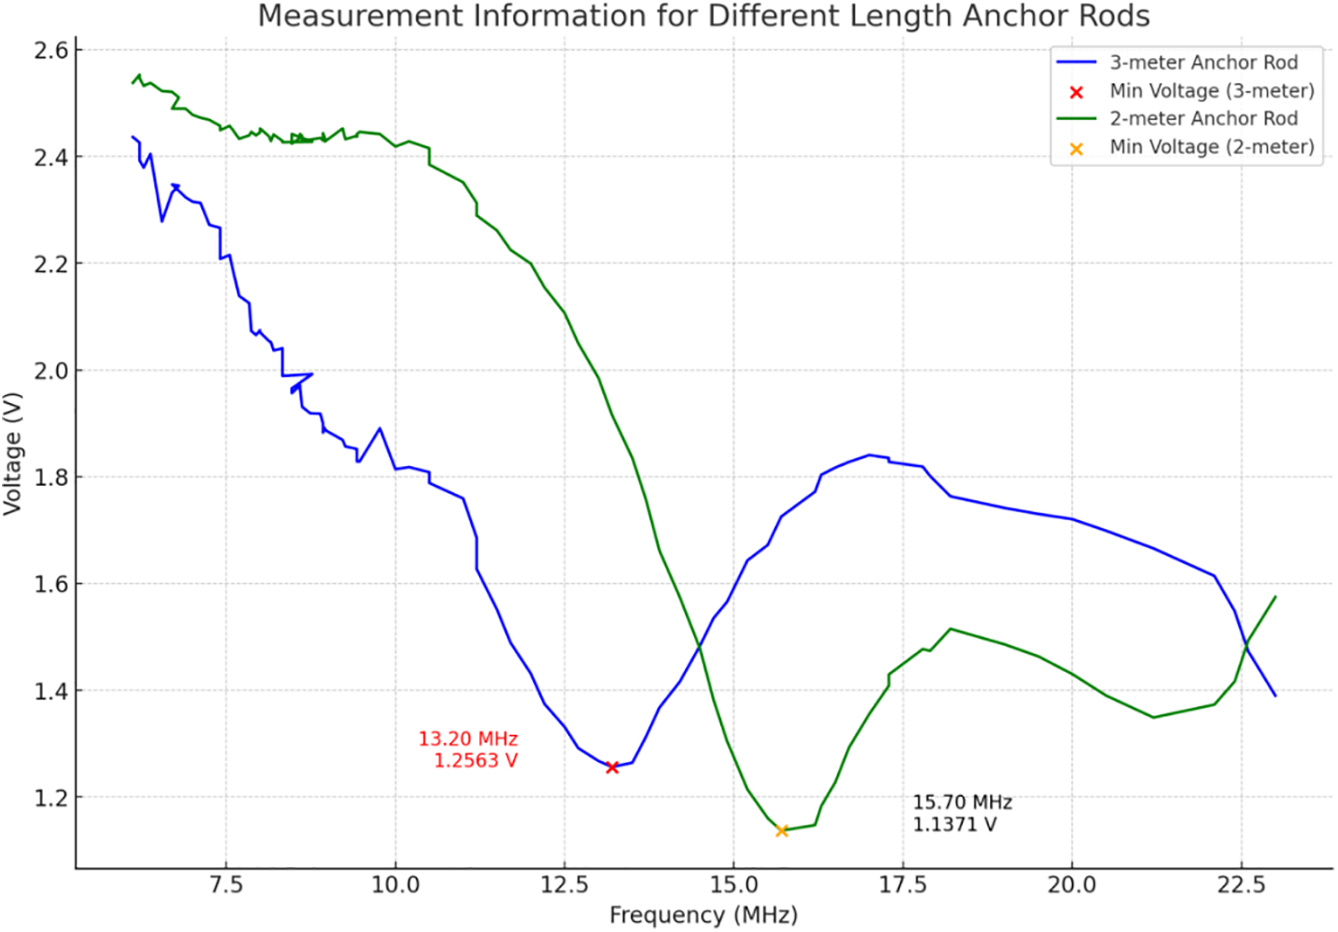
Figure 8: Voltage-frequency curves for anchor rods of different lengths
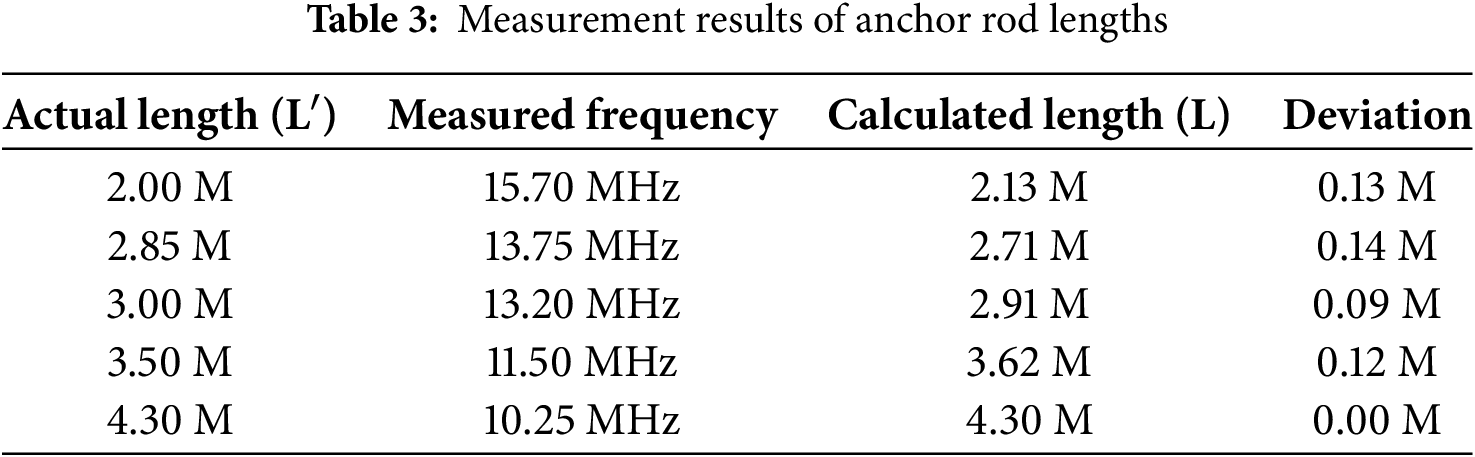
Table 3 systematically quantifies the measurement accuracy of the standing wave method for anchor rods with diverse lengths, presenting a comparative analysis between actual dimensions and values derived from the mathematically fitted model. The tabulated data shows that absolute deviations between physical measurements and theoretical predictions remain consistently below 0.14 m across the entire tested range. These minimal deviations collectively validate the mathematical model’s practical reliability for on-site length estimation in engineering applications.
4.2 Signal Penetration Capability Experiment and Results
To ensure reliable data transmission in complex tunnel environments, we evaluated the signal penetration capability of the system. The experiment involved analyzing signal attenuation across obstacles of varying dimensions and determining the corresponding maximum measurable distances. As illustrated in Fig. 9, the measurement device was positioned at the rear and encased in a metal enclosure lined with electromagnetic shielding foil to prevent signal leakage in unintended directions.
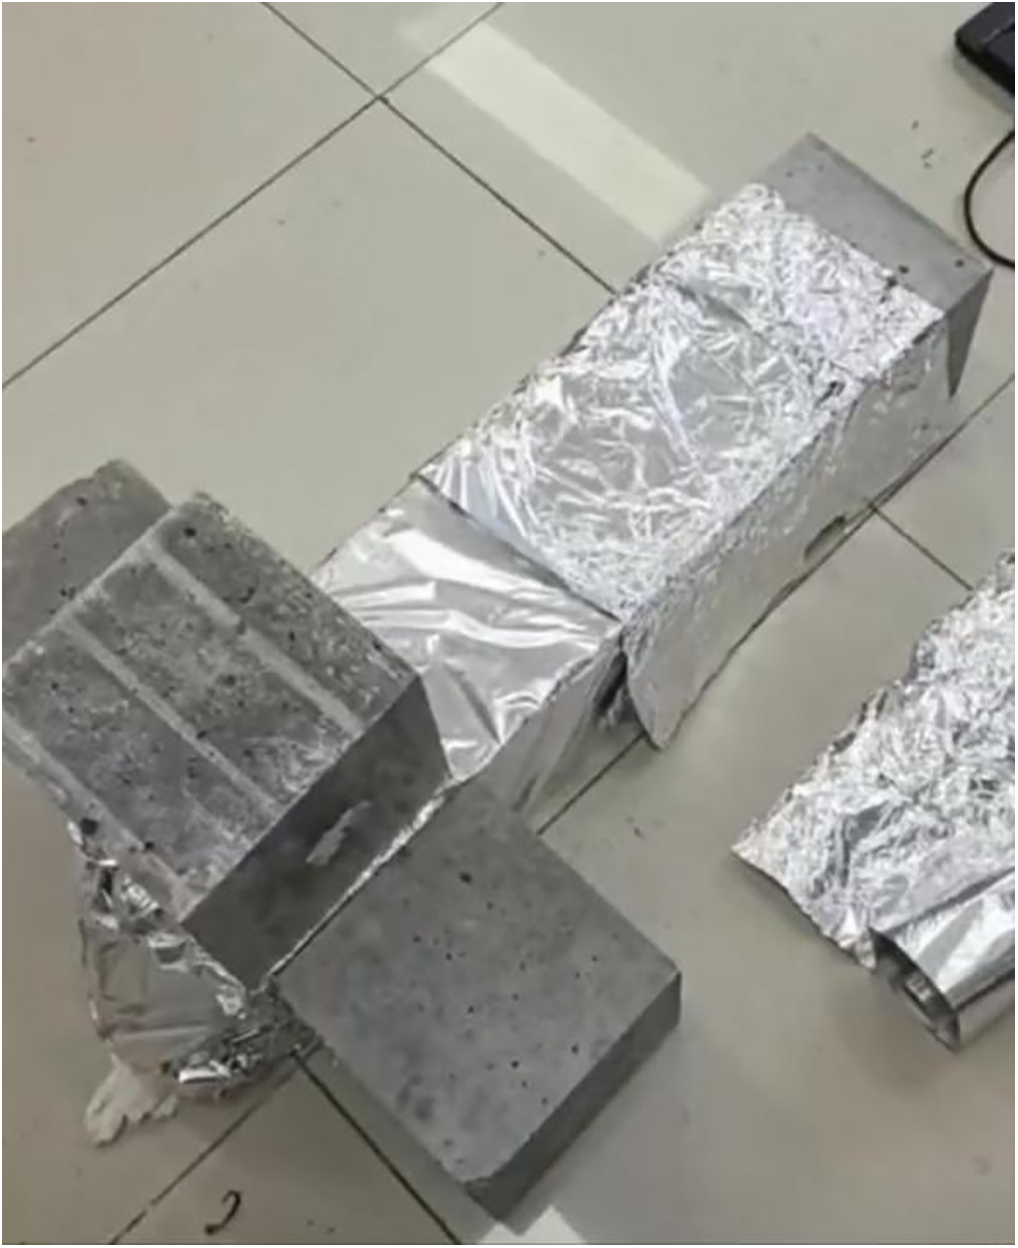
Figure 9: Signal strength measurement environment
In the signal penetration capability experiment, the test was conducted in a semi-closed space. The site was surrounded by 24-cm-thick common brick walls, with concrete structures for both the top and ground, and free from strong electromagnetic interference sources. The obstacles were concrete precast blocks stacked into vertical barriers with thicknesses of 30 and 60 cm, where the water content of the concrete blocks was controlled at 8% ± 1%. The measurement unit was placed in a shielding box, with electromagnetic shielding copper foil laid on the inner wall of the box and only an opening for signal transmission reserved. The signal source was a 433 MHz wireless module (transmitting power 32 dBm) equipped with a whip antenna, fixed at a height from the ground; the receiving end used a spectrum analyzer, with its antenna horizontally aligned with that of the transmitting end. During the experiment, temperature and humidity as well as air pressure were monitored in real time. When collecting data, measurement points were arranged in the horizontal direction, and 10 sets of data were collected at each point for averaging.
Firstly, we investigated the influence of different concrete thicknesses on the strength of wireless signals at a frequency of 433 MHz. Figs. 10–12 illustrate the planar distribution of signal strength under three different conditions: propagation in an obstacle-free environment and after passing through concrete walls with thicknesses of 30 and 60 cm. The measurement height in all three scenarios is consistent with the height of the signal source. During the experiment, we systematically recorded the impact of incrementally stacking concrete walls in units of 15 cm (up to a total thickness of 60 cm) on the signal distribution pattern. Fig. 10 presents the distribution characteristics of signal strength in an obstacle-free environment. As the distance from the signal source increases, the signal strength shows a gradual attenuation trend, which is in line with the prediction of the free space propagation model. In the area close to the signal source, the signal strength remains at a high level, while as the spatial distance extends, the signal strength decreases in a gradient manner. Fig. 11 shows the distribution of signal strength after electromagnetic waves penetrate a 30-cm-thick concrete wall. Due to the absorption and scattering effects of the concrete material on electromagnetic waves, the signal strength experiences a significant attenuation during the penetration process. When passing through a 30-cm concrete block, compared with the unobstructed situation, the signal immediately attenuates by 20 dBm. Fig. 12 depicts the distribution of signal strength after the signal penetrates a 60-cm-thick concrete wall. The influence of the obstacle on the signal becomes even more pronounced. When passing through a 60-cm concrete block, compared with the unobstructed situation, the signal immediately attenuates by 26 dBm. This attenuation effect is particularly prominent in the area far from the signal source. The experimental results indicate that the presence of the concrete medium leads to a significant shrinkage in the coverage area of the strong signal region. Especially when penetrating high-density building materials, the attenuation amplitude of the signal strength in the far-field region is even more severe.
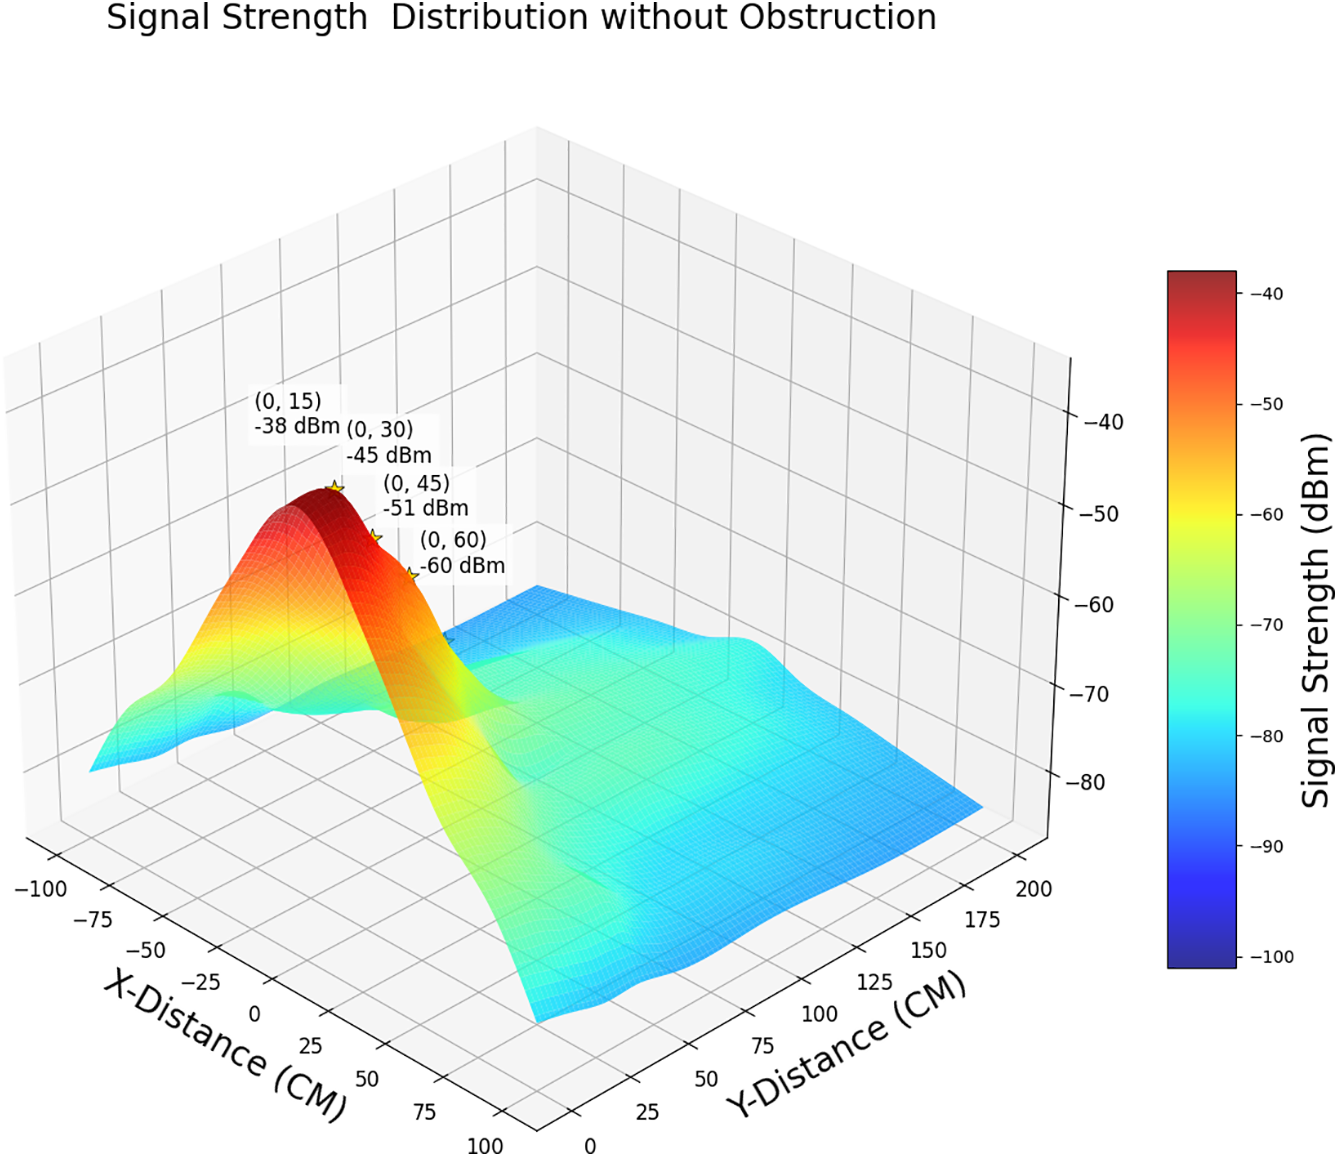
Figure 10: Signal strength distribution in an unobstructed environment (same height as the signal source)
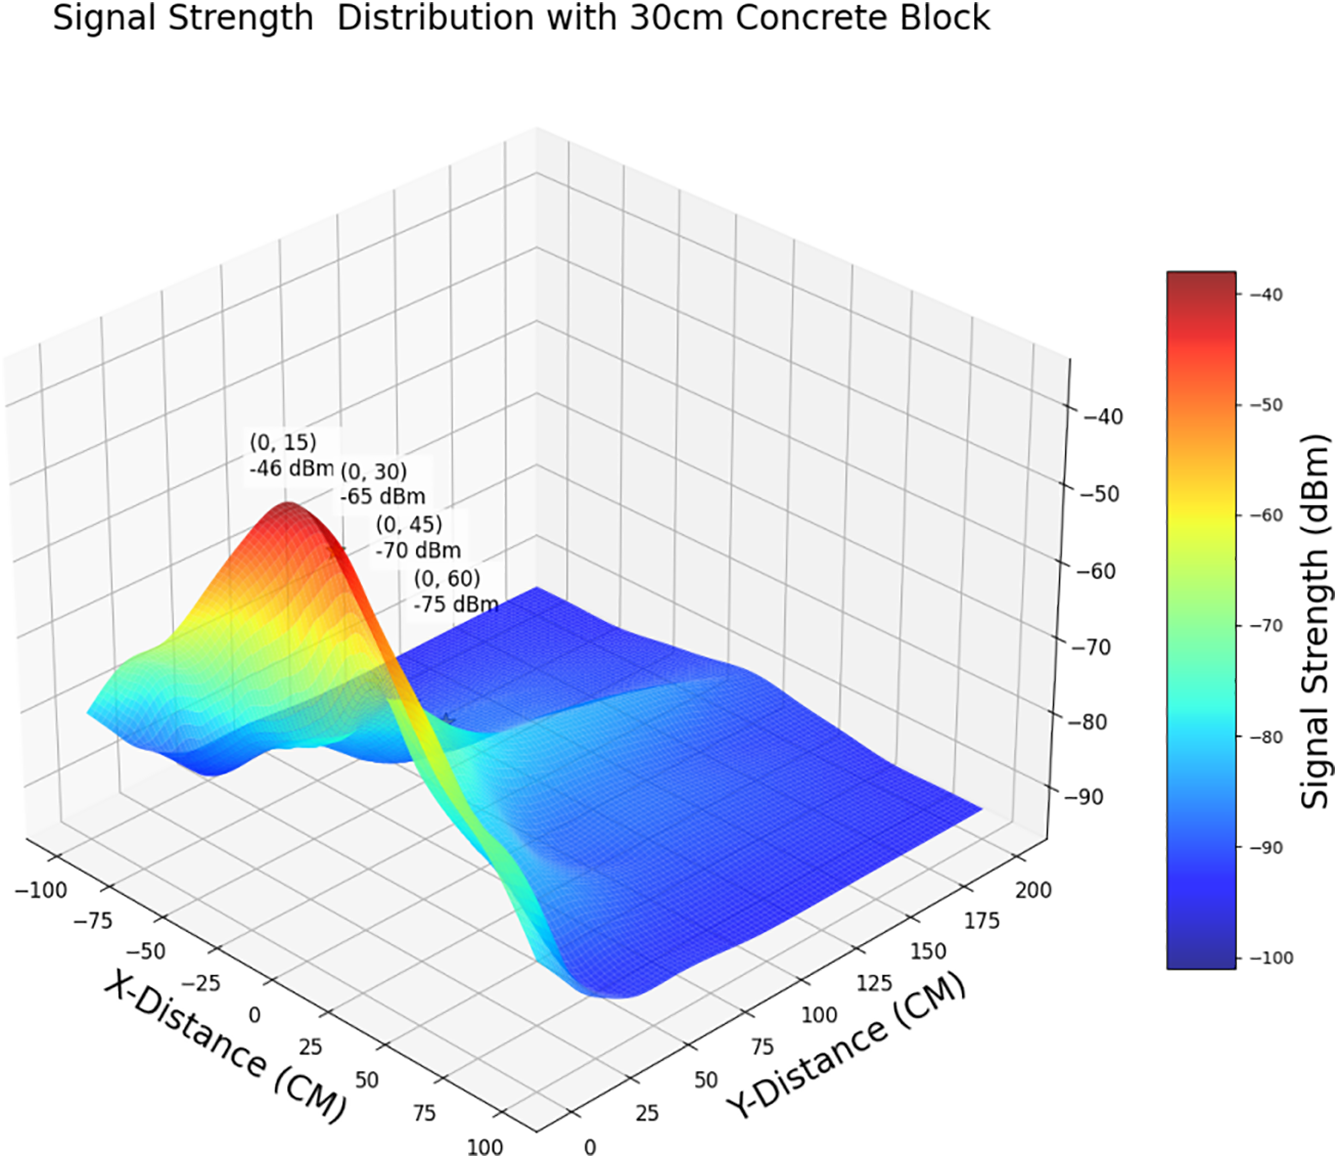
Figure 11: Signal strength distribution through a 30 cm concrete block (same height as the signal source)

Figure 12: Signal strength distribution through a 60 cm concrete block (same height as the signal source)
Subsequently, we tested the maximum transmission distance of the signal when it passed through concrete with different thicknesses. As illustrated in Fig. 13, the experimental study quantitatively demonstrates an inverse correlation between obstacle thickness and effective wireless signal propagation distance. Under unobstructed conditions, the radio frequency signal maintains a stable communication range extending to approximately 8.5 m. The introduction of a 30-cm concrete barrier induces notable signal attenuation, reducing the effective coverage distance to 8.5 m through intensified multipath fading and diffraction loss. More critically, the 60-cm concrete structure exhibits severe propagation path degradation, constraining the operational distance to merely 2 m due to dominant penetration loss mechanisms. These stratified results systematically confirm that electromagnetic wave attenuation in concrete environments follows thickness-dependent attenuation coefficients, providing empirical evidence for wireless network planning in obstructed spaces.
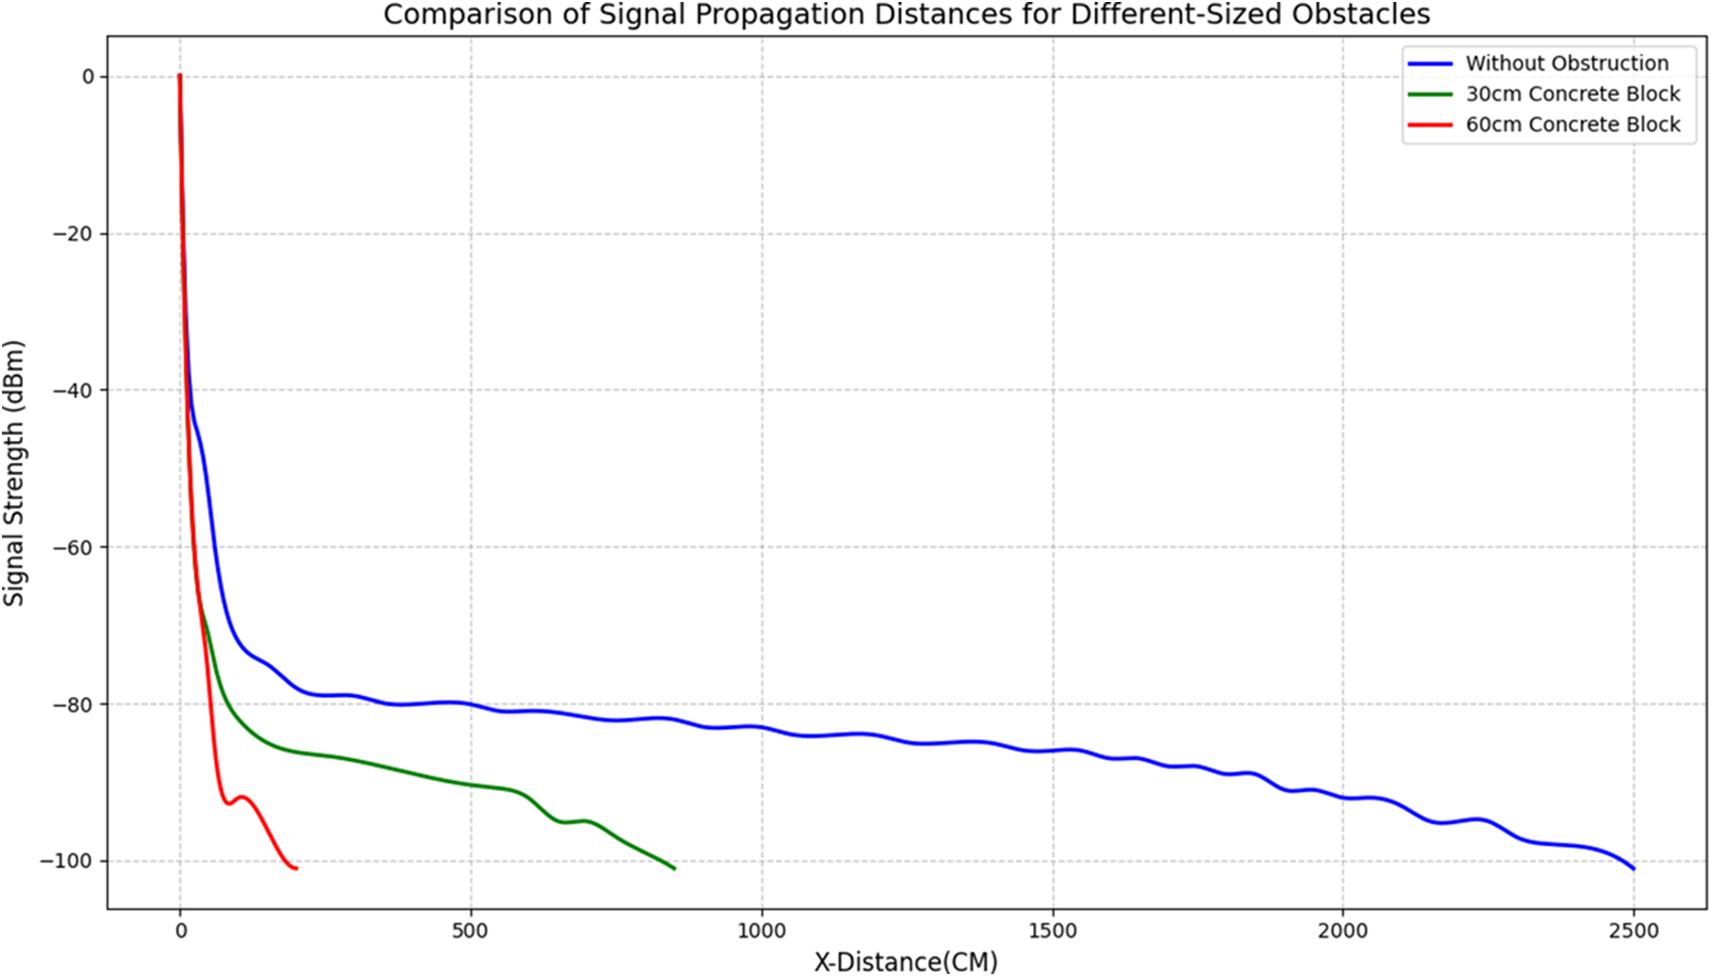
Figure 13: Comparison of signal propagation distances under obstacles of different sizes
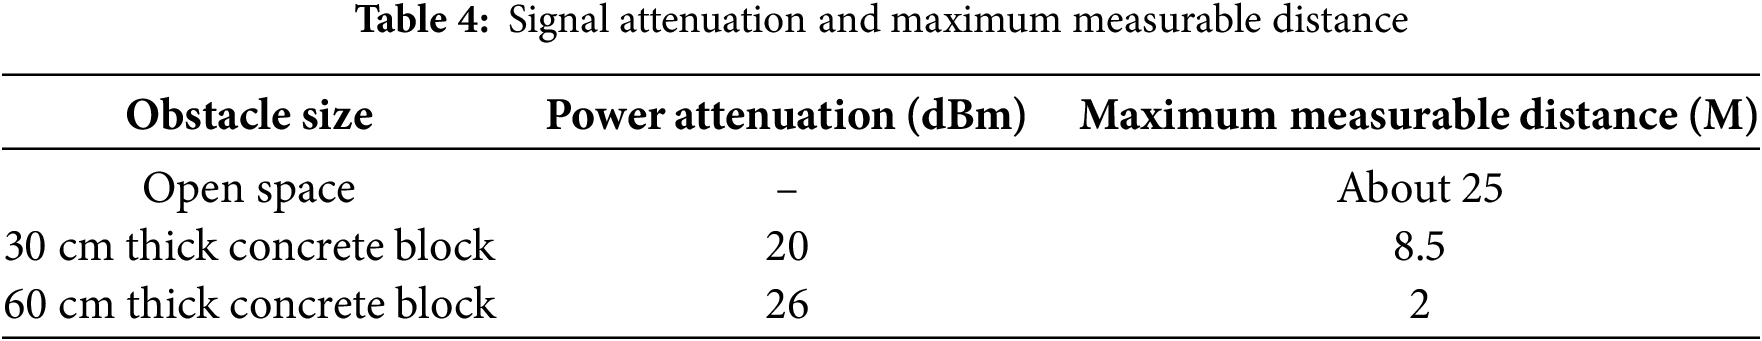
Based on the above-mentioned research contents, we systematically sorted out and analyzed the signal attenuation and maximum measurable distance data under various environmental conditions, and finally summarized them to form Table 4. This table covers a variety of scenarios, including open spaces and concrete barriers with different thicknesses. It is noteworthy that, since the signal reception sensitivity of the testing instrument is set at −101 dBm, all the maximum measurable distances presented in the table are determined according to the position points corresponding to the attenuation of the signal strength to this threshold value. Through Table 4, readers can intuitively and comprehensively understand the influence of different environmental factors on the signal transmission characteristics, which provides crucial data support for relevant applications.
The results indicate that although signal attenuation increases with obstacle thickness, the 433 MHz frequency band enables effective data transmission due to its low-frequency, high-penetration characteristics. The system demonstrates strong robustness in handling signal attenuation, making it suitable for applications in complex environments.
This paper designs and implements a wireless measurement system for anchor rod length based on the standing wave method. The system achieves high-precision measurement of anchor rod length through PWM excitation at varying frequencies and envelope voltage detection. The hardware design integrates an efficient detection module and voltage stabilization module to ensure signal transmission stability and measurement accuracy; the software design focuses on power consumption optimization, adopting standby modes and phased activation strategies to effectively extend the device’s battery life. The measurement unit, embedded with the anchor rod during tunnel installation, starts real-time measurement immediately and stores the results, and only sends the results when a request is made, which avoids the accuracy degradation caused by component aging and other problems.
Experimental results demonstrate that the system provides reliable measurements under various length conditions while maintaining low energy consumption, making it suitable for portable on-site applications. It is noteworthy that this study is currently limited to experiments in static environments and has not comprehensively addressed the potential impacts, common in tunnel construction, of dynamic factors such as vibrations, temperature fluctuations, or mechanical shocks on measurement processes and signal transmission stability. Future work will focus on optimizing the algorithm and hardware structure to enhance anti-interference capabilities, and plans to carry out dynamic condition tests in real tunnel environments to meet the requirements of more complex engineering applications.
From a practical application perspective, we believe the wireless anchor rod length measurement system demonstrates potential for contributing to existing tunnel management frameworks. It can be integrated into tunnel structural health monitoring networks to enable continuous monitoring of anchor rod conditions, thereby offering an alternative to traditional manual spot-checking approaches. Furthermore, during the initial support stage of tunnel construction, the system may serve as a supplementary quality control tool, supporting batch measurements, report generation, and integration with Building Information Modeling (BIM) systems to enhance traceability. These aspects are anticipated to provide new perspectives for improving tunnel safety monitoring and facilitating the digital transformation of tunnel engineering management.
Acknowledgement: The completion of this study benefits from the support and collaboration of multiple parties, to whom we extend our sincere gratitude. First and foremost, we thank the School of Information Science and Engineering, Lanzhou University, and Gansu ZhiTong Technology Engineering Detection Consulting Co., Ltd. for providing experimental platforms and technical resources. Lanzhou University has offered crucial support in hardware development, algorithm validation, and laboratory testing, while Gansu ZhiTong Technology has provided professional guidance in simulated environment construction and engineering application feasibility analysis, laying a solid foundation for system design and experimental verification. Additionally, we appreciate the staff involved in laboratory testing for their assistance in constructing anchor rod models, collecting signals, and debugging the system under simulated conditions, which provided reliable experimental data for this research. Finally, we are grateful to our families for their understanding and support throughout the study, enabling us to focus on our scientific work. The achievements of this research embody the wisdom of multiple contributors, and we express our heartfelt thanks to all.
Funding Statement: This work was supported in part by the Natural Science Foundation of Gansu Province (Nos. 20JR10RA614, 22YF7GA182, 22JR11RA042, 22JR5RA1006, 24CXGA024), the National Natural Science Foundation of China under Grant 61804071.
Author Contributions: Mengqiang Yu, Xingcheng Wang and Chen Quan conceived the study concept, designed the hardware architecture, conducted system validation experiments, and Mengqiang Yu undertook the initial draft writing. Mingxin Sun and Xiaodong He developed the frequency-scanning algorithm and software framework, performed data analysis, and validated the model. Yujun Yang and Wu Sun provided engineering guidance on tunnel application scenarios and assisted in constructing simulated environments. As corresponding authors, Pengfei Cao and Wu Sun supervised the research direction, coordinated resources, and participated in manuscript writing and revision. All authors contributed to manuscript preparation. All authors reviewed the results and approved the final version of the manuscript.
Availability of Data and Materials: The experimental data supporting the findings of this study are available from the corresponding authors upon reasonable request. The hardware components (e.g., STM32 microcontroller, 433 MHz wireless modules) and software frameworks used in this research are either commercially available or custom-developed, with detailed specifications provided in the manuscript. Customized measurement units and simulation models can be obtained from the authors for academic purposes, subject to appropriate licensing agreements. The study does not involve proprietary or restricted materials, and all methods are reproducible as described in the document.
Ethics Approval: This study involves the design and validation of a wireless measurement system for tunnel anchor rods, which does not involve human subjects, animal experiments, or the use of sensitive materials. Thus, formal ethics approval was not required. All experiments were conducted in compliance with standard engineering practices and safety protocols.
Conflicts of Interest: The authors declare no conflicts of interest. All authors have no financial or non-financial interests that might be perceived to influence the results or conclusions presented in this study. The research was conducted independently, and the funding sources (national natural science foundation and provincial scientific projects) had no role in study design, data collection, analysis, manuscript writing, or publication decision.
References
1. Kang X, Xie X, Zeng K. A new self-sensing fiber optic anchor to monitor bolt axial force and identify loose zones in the surrounding rock of open TBM tunnels. Sensors. 2024;24(20):6709. doi:10.3390/s24206709. [Google Scholar] [PubMed] [CrossRef]
2. Sun X, Chen F, Miao C, Song P, Li G, Zhao C, et al. Physical modeling of deformation failure mechanism of surrounding rocks for the deep-buried tunnel in soft rock strata during the excavation. Tunn Undergr Space Technol. 2018;74(4):247–61. doi:10.1016/j.tust.2018.01.022. [Google Scholar] [CrossRef]
3. Jiang Y, Li N, Jiang HH, Zhou ML, Zhang JL. Determination of the length of the rock bolts for tunnels with consideration of the nonlinear rheological behavior of squeezing rock. Appl Sci. 2022;12(17):8560. doi:10.3390/app12178560. [Google Scholar] [CrossRef]
4. Lei M, Liu J, Lin Y, Shi C, Liu C. Deformation characteristics and influence factors of a shallow tunnel excavated in soft clay with high plasticity. Adv Civ Eng. 2019;2019(1):7483628. doi:10.1155/2019/7483628. [Google Scholar] [CrossRef]
5. Chen X. Research on combined construction technology for cross-subway tunnels in underground spaces. Engineering. 2018;4(1):103–11. doi:10.1016/j.eng.2017.08.001. [Google Scholar] [CrossRef]
6. Zhang C, Lai SX, Wang HP. Structural modal parameter recognition and related damage identification methods under environmental excitations: a review. Struct Durab Health Monit. 2025;19(1):25. doi:10.32604/sdhm.2024.053662. [Google Scholar] [CrossRef]
7. Li P, Chen Y, Huang J, Wang X, Liu J, Wu J. Design principles of prestressed anchors for tunnels considering bearing arch effect. Comput Geotech. 2023;156(3):105307. doi:10.1016/j.compgeo.2023.105307. [Google Scholar] [CrossRef]
8. Liu W, Chen J, Chen L, Luo Y, Shi Z, Wu Y. Nonlinear deformation behaviors and a new approach for the classification and prediction of large deformation in tunnel construction stage: a case study. Eur J Environ Civ Eng. 2022;26(5):2008–36. doi:10.1080/19648189.2020.1744482. [Google Scholar] [CrossRef]
9. Chen J, Liu W, Chen L, Luo Y, Li Y, Gao H, et al. Failure mechanisms and modes of tunnels in monoclinic and soft-hard interbedded rocks: a case study. KSCE J Civ Eng. 2020;24(4):1357–73. doi:10.1007/s12205-020-1324-3. [Google Scholar] [CrossRef]
10. Wang F, Bai X, Wu Z, Yan N, Hou D, Liu J. Field pullout test and anchorage length calculation for external anchorage of GFRP anti-floating anchors. Structures. 2024;70(6):107636. doi:10.1016/j.istruc.2024.107636. [Google Scholar] [CrossRef]
11. Zhou Y, Lai H, Liu Y, Hong Q, Li Z. Analysis and treatments of primary support failure in large-span tunnel under a soft-hard interbedded surrounding rock mass. Eng Fail Anal. 2024;156(5):107755. doi:10.1016/j.engfailanal.2023.107755. [Google Scholar] [CrossRef]
12. Wang M, Zhu S, Li S, Li D, Jiang F, Zhang X, et al. Mechanism and prediction of anchor rod strength degradation with deep mine high-stress corrosion environment. J China Coal Soc. 2024;49(10):4295–310. doi:10.13225/j.cnki.jccs.2024.0347. [Google Scholar] [CrossRef]
13. Liu D, Chen A. Performance evolution of prestressing anchor bars in corrosive environments experimental study. Sci Rep. 2023;13(1):9004. doi:10.1038/s41598-023-35577-8. [Google Scholar] [PubMed] [CrossRef]
14. Wu Y, Hao Y, Tao J, Teng Y, Dong X. Non-destructive testing on anchorage quality of hollow grouted rock bolt for application in tunneling, lessons learned from their uses in coal mines. Tunn Undergr Space Technol. 2019;93:103094. doi:10.1016/j.tust.2019.103094. [Google Scholar] [CrossRef]
15. Li C, Jin H, Wu W, Yang M, Wang Q, Pei Y. Path loss and auxiliary communication analysis of VANET in tunnel environments. Symmetry. 2023;15(6):1230. doi:10.3390/sym15061230. [Google Scholar] [CrossRef]
16. Achmadin WN, Kharismawati I, Trianggono MM. A measurement of various length of the stack on a standing wave thermoacoustic refrigerator. J Phys Conf Ser. 2021;1869(1):012165. doi:10.1088/1742-6596/1869/1/012165. [Google Scholar] [CrossRef]
17. Zhao Y, Jian Z, Zhao F, Yun Y, Li X, Chen L. A length measurement method for reeling cable based on standing wave reflectometry. In: Proceedings of the International Symposium on Automation, Mechanical and Design Engineering; 2022 Dec 16–18; Beijing, China. Cham: Springer Nature Switzerland; 2022. p. 407–16. doi:10.1007/978-3-031-40070-4_33. [Google Scholar] [CrossRef]
18. Lei M, Li W, Luo M, Song G. An automatic extraction algorithm for measurement of installed rock bolt length based on stress wave reflection. Measurement. 2018;122(5–6):563–72. doi:10.1016/j.measurement.2017.07.032. [Google Scholar] [CrossRef]
19. Moiroux-Arvis L, Cariou C, Chanet JP. Evaluation of LoRa technology in 433-MHz and 868-MHz for underground to aboveground data transmission. Comput Electron Agric. 2022;194(3):106770. doi:10.1016/j.compag.2022.106770. [Google Scholar] [CrossRef]
20. Bobkov I, Rolich A, Denisova M, Voskov L. Study of LoRa performance at 433 MHz and 868 MHz bands inside a multistory building. In: Proceedings of the 2020 Moscow Workshop on Electronic and Networking Technologies (MWENT); 2020 Mar 11–13; Moscow, Russia. p. 1–6. doi:10.1109/MWENT47943.2020.9067427. [Google Scholar] [CrossRef]
21. Eremin V, Borisov A. A research of the propagation of LoRa signals at 433 and 868 MHz in difficult urban conditions. IOP Conf Ser Mater Sci Eng. 2018;363(1):012014–6. doi:10.1109/MWENT47943.2020.9067427. [Google Scholar] [CrossRef]
22. Johansson K, Eklund C. A comparison of energy usage between LoRa 433 MHz and LoRa 868 MHz [Internet]. 2021 [cited 2025 Jan 1]. Available from: https://urn.kb.se/resolve?urn=urn:nbn:se:hj:diva-54161. [Google Scholar]
23. Xu Z, Fang M, Zhou H, Cui C, Fang M. Non-destructive measurement method of anchor rod length based on electrical standing waves. Ind Min Autom. 2013;39(9):112–5. (In Chinese). [cited 2025 Jan 1]. Available from: https://link.cnki.net/urlid/32.1627.TP.20130827.1809.029. [Google Scholar]
24. Tuset-Peiró P, Anglès-Vazquez A, López-Vicario J, Vilajosana-Guillén X. On the suitability of the 433 MHz band for M2M low-power wireless communications: propagation aspects. Trans Emerg Telecommun Technol. 2014;25(12):1154–68. doi:10.1002/ett.2672. [Google Scholar] [CrossRef]
25. Köble S, Heller S, Woias P. A narrow-band and ultra-low-power 433 MHz wake-up receiver. J Phys Conf Ser. 2019;1407(1):012093. doi:10.1088/1742-6596/1407/1/012093. [Google Scholar] [CrossRef]
26. Ivanović A, Neilson RD. Non-destructive testing of rock bolts for estimating total bolt length. Int J Rock Mech Min Sci. 2013;64(1):36–43. doi:10.1016/j.ijrmms.2013.08.017. [Google Scholar] [CrossRef]
27. Yoon HK, Lee JS, Yu JD. Correlation of granite rock properties with longitudinal wave velocity in rock bolt. Int J Rock Mech Min Sci. 2022;159(4):105200. doi:10.1016/j.ijrmms.2022.105200. [Google Scholar] [CrossRef]
28. Lee JS, Yu JD. Integrity evaluation of rock bolt installed in rock slope using sound waves. J Korean Tunn Undergr Space Assoc. 2024;26(5):385–401. doi:10.9711/KTAJ.2024.26.5.385. [Google Scholar] [CrossRef]
Cite This Article
 Copyright © 2025 The Author(s). Published by Tech Science Press.
This work is licensed under a Creative Commons Attribution 4.0 International License , which permits unrestricted use, distribution, and reproduction in any medium, provided the original work is properly cited.
 Downloads
 Citation Tools