
 Submit a Paper
 Propose a Special lssue
 Open Access
ARTICLE

Dynamic Response Research of Dangerous Rockfall Impact Protection Structures
1 School of Civil Engineering and Geomatics, Shandong University of Technology, Zibo, 255000, China
2 School of Hydraulic and Civil Engineering, Ludong University, Yantai, 264025, China
3 International College, Krirk University, Bangkok, 10220, Thailand
4 School of Civil Engineering, Inner Mongolia University of Science and Technology, Baotou, 014010, China
* Corresponding Author: Tian Su. Email:
(This article belongs to the Special Issue: Durability Assessment of Engineering Structures and Advanced Construction Technologies)
Structural Durability & Health Monitoring 2025, 19(6), 1563-1588. https://doi.org/10.32604/sdhm.2025.073009
Received 09 September 2025; Accepted 10 October 2025; Issue published 17 November 2025
 View Full Text
 Download PDF
Abstract
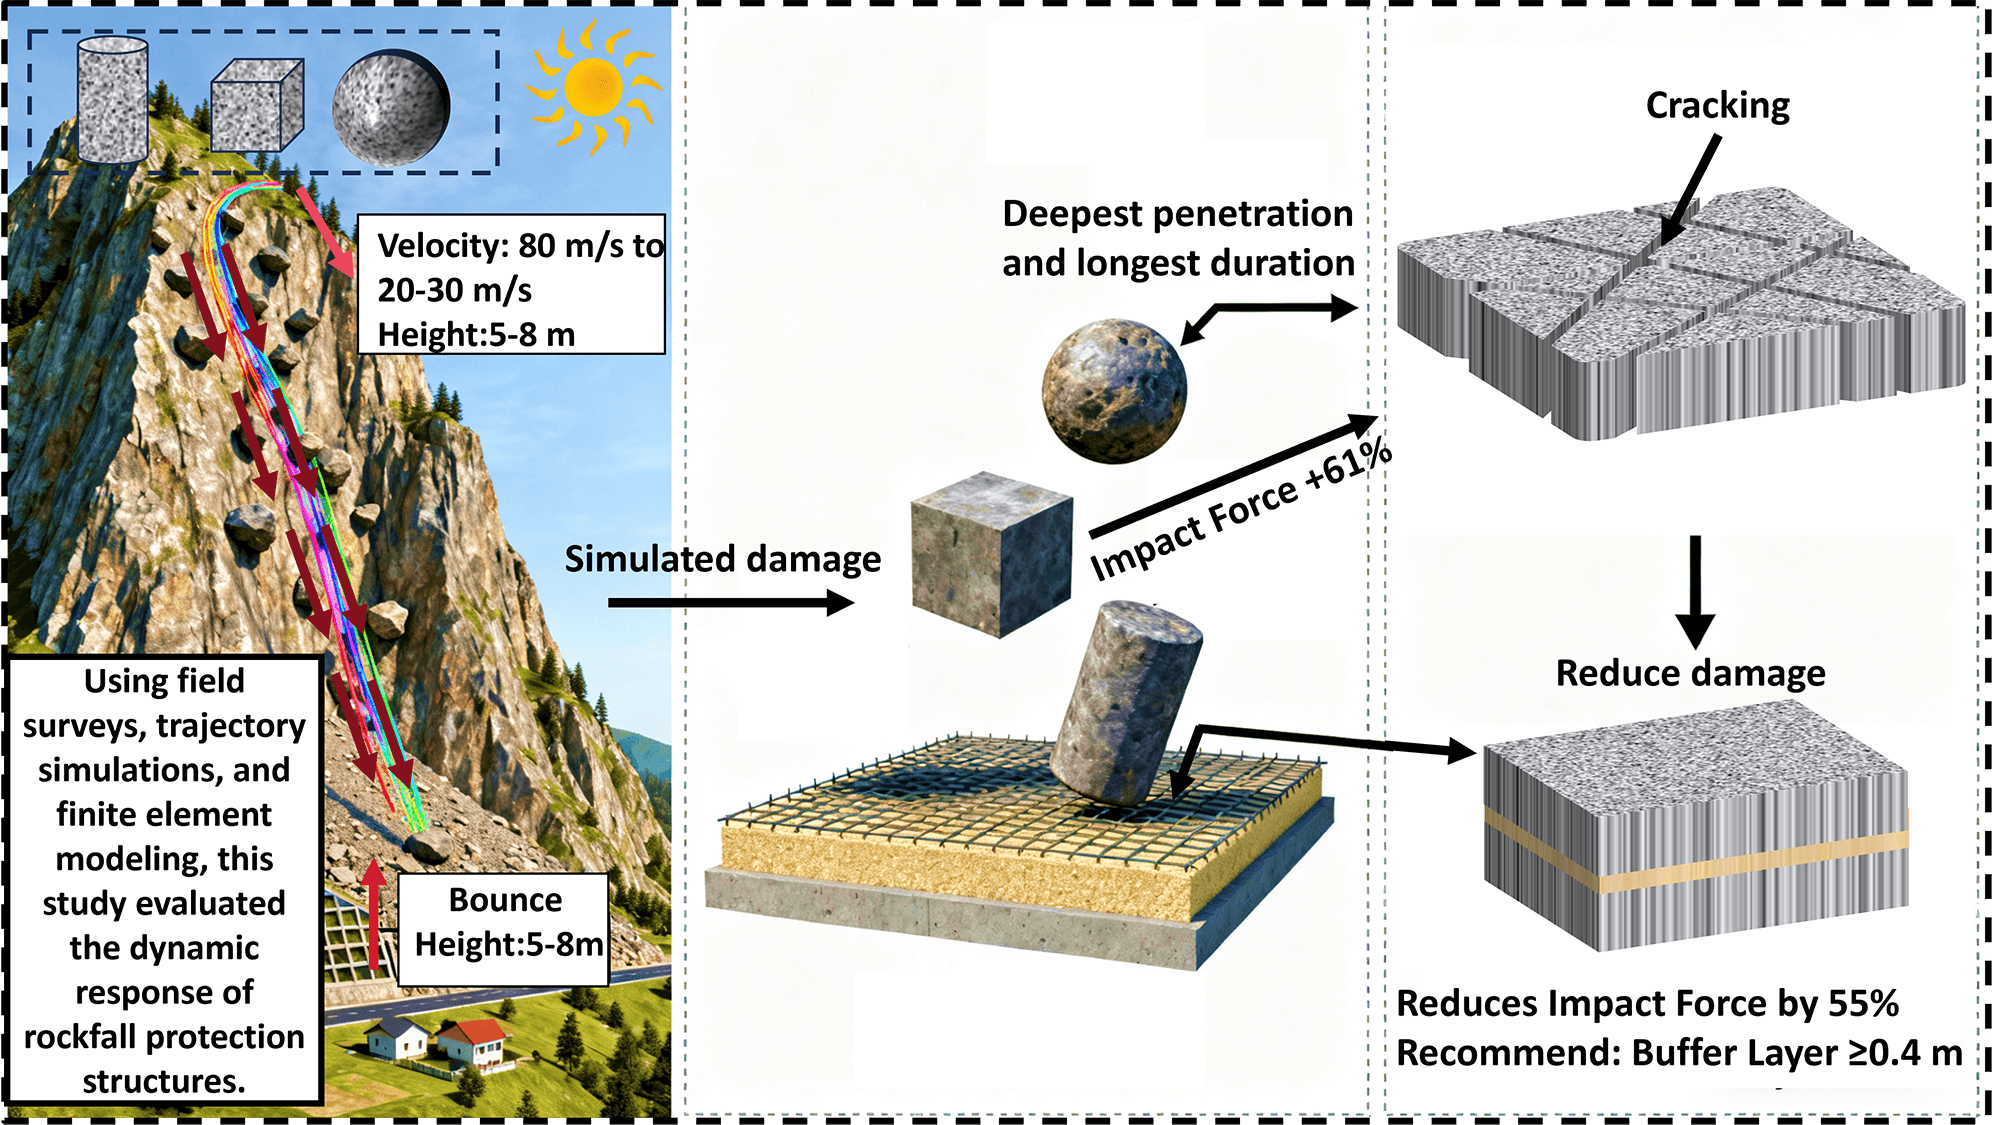
Rock collapse is a significant geological disaster that poses a serious threat to life and property in mountainous regions worldwide. Investigating the response of protective structures to rockfall impacts can provide valuable references for the design and placement of such structures. In this study, RocPro3D and ABAQUS were employed to comprehensively analyze rockfall movement trajectories and the structural response upon impact. The results indicate that when the impact velocity of rockfall at the protective structure reaches 20–30 m/sec, the corresponding bounce height ranges from 5 to 8 m, and most rockfall accumulates at the slope toe. The interface form of the structure significantly influences various impact response indicators, including impact force, penetration depth, contact area, concrete strain, and displacement of the slab’s lower surface. Furthermore, slabs equipped with a buffer layer experience substantially less damage compared to those without one.Graphic Abstract
Keywords
Rockfalls represent a typical form of geological disaster, commonly occurring on slopes in mountainous regions and constituting a major geological hazard both in China and worldwide. They are generally characterized by high energy, suddenness, and randomness [1,2]. The steep alpine canyon slopes in southwestern China and the southeastern margin of the Qinghai–Tibet Plateau, with their rugged terrain and deep valleys, are not only tectonically active but also highly susceptible to hazardous rock avalanches [3,4]. From the perspective of natural geological processes, the failure of unstable rock masses is catastrophic [5,6]; in terms of human safety, it is often fatal and destructive [7,8]. According to statistics [9], a total of 3668 geological disasters occurred in China in 2023, among which rockfalls accounted for 2176 cases. Therefore, simulating rockfall processes and numerically modeling the impact on protective structures are of significant practical value for geological disaster risk assessment and mitigation, helping to minimize potential losses.
Advances in computer technology have greatly advanced the study of rockfall dynamics through numerical simulation. By integrating kinematic principles with contact dynamics theory, modern numerical models can simulate the full dynamic process of rock masses—from initial detachment, through motion, to final deposition [10]. Accurate prediction of rockfall trajectories is essential for delineating hazard zones and optimizing the placement of protective structures [11]. In this context, RocPro3D serves as a representative probabilistic simulation tool [12–14]. It enables three-dimensional visualization of rockfall trajectory distributions and supports quantitative analysis of key parameters such as bounce height and kinetic energy. The software also supports both deterministic and probabilistic computation modes, allowing for effective evaluation of the influence of terrain roughness and geotechnical properties on rockfall behavior. Nasery et al. [13] used this software to reveal nonlinear variations in rockfall motion parameters within high-seismic zones, noting that velocity, kinetic energy, and bounce height peak in the mid-slope region before decreasing monotonically. Although Sarro et al. [15] successfully constructed a 3D geological model, the accuracy of their trajectory simulations was limited by the absence of key parameters such as joint orientation. To address this gap, the present study supplements essential parameters through field investigations and geological surveys, thereby overcoming the limitations in Sarro’s research [15]. Additionally, computational methods for simulating collision processes have been optimized.
Rockfall protection is crucial for reducing disaster-related losses. Research on protective measures, both in China and internationally, has primarily focused on flexible mesh systems [16,17] and rigid barriers such as rockfall walls [18,19]. Protection strategies can be categorized into active measures—such as slope stabilization, unstable rock removal, shotcrete with wire meshing, bolt anchoring, and controlled blasting—and passive measures, including rockfall barriers, catch ditches, and rock sheds, which are designed to intercept falling rocks [20–22]. To mitigate the impact of rockfalls on rigid structures such as walls or scaffolds, energy-dissipating components or buffer layers are often installed on the impact-facing side to form a shock-absorbing system and prevent brittle structural failure [23,24]. In engineering practice, porous and granular materials are frequently used as buffer layers to protect reinforced concrete slabs. These materials include sand, soil, gravel, earth–rock mixtures, shredded tires, and foam [25]. Kawahara and Muro [26] investigated the influence of dry density and thickness of a sand cushion on impact energy dissipation, finding that impact pressure increases with dry density, while the transmission rate of impact pressure decreases rapidly with increasing cushion thickness. Meree et al. [27] reported that interparticle friction within a gravel cushion dissipates 70%–80% of the rockfall’s kinetic energy. Umili et al. [28] demonstrated that waste tires can absorb over 80% of impact energy, significantly enhancing the protective capacity of rigid rock-blocking structures. Furthermore, Breugnot et al. [29] combined the finite difference method and discrete element method to simulate the response of a reinforced earth–rock wall under high-energy rockfall impact, revealing that rock shape and impact angle considerably influence impact force. Lu et al. [30] analyzed the dynamic response of a reinforced retaining wall through physical tests and numerical simulations, showing that both geosynthetics and buffer layers contribute to impact energy absorption. To select appropriate protection measures and ensure their effectiveness, factors such as rockfall shape and kinematic state must also be considered.
Rockfall size, shape, impact angle, slope hardness, and other factors significantly influence both the impact force and the dynamic response of protective structures [31]. Cui et al. [32] used orthogonal experimental design to analyze the effects of rock shape, mass, slope material, and gradient on rockfall velocity. Their results indicated that slope material has the greatest influence, followed by slope gradient and rock shape, while rock mass has the least effect. Smaller rocks tend to bounce higher [31] and travel farther [33], while irregularly shaped rocks generally possess greater kinetic energy and rebound potential. Compared to cubic or wedge-shaped blocks, spherical rocks exhibit smaller lateral deviation and longer jump distances; jump distance increases with mass, whereas lateral deviation decreases [34,35]. Ellipsoidal rocks tend to generate higher peak impact forces than spherical ones. At a contact angle of 90°, the peak impact force decreases with increasing sphericity, whereas at 0° or 45°, it increases with sphericity [36,37]. Slope gradient and surface conditions exert a stronger influence on rockfall motion than rock shape or mass. Increased surface roughness reduces velocity but increases bounce height [38]. In summary, rockfall motion is a complex process involving sliding, bouncing, impact, and rotation, influenced by both slope characteristics and environmental factors. Although existing studies have extensively analyzed various influencing factors, research on the effect of rockfall interface morphology on dynamic characteristics remains relatively limited.
Further progress in computer technology has continued to drive numerical simulation-based research on rockfall dynamics [39–41]. Contemporary models simulate the entire process—from initial failure and movement to arrest—by coupling kinematics with contact dynamics [42,43]. Accurate trajectory prediction remains essential for hazard zoning and the planning of protective infrastructure. As a probabilistic simulation tool, RocPro3D allows 3D visualization of rockfall paths and quantitative assessment of key parameters such as rebound height and kinetic energy.
Protection against rockfalls is a central strategy for mitigating related losses [44]. Research on protective measures has largely focused on two types: flexible mesh systems and rigid barriers. Protective approaches are categorized as active (e.g., slope reinforcement or rock removal) or passive (e.g., rockfall barriers or sheds), with the latter aiming to intercept falling rocks. To reduce impact loads on rigid structures, energy dissipation components or buffer layers are commonly used. Composed of materials such as gravel, crushed stone, or recycled tires, these layers absorb impact energy and lessen force transmission, thereby reducing structural damage.
Although previous studies have examined factors such as rock shape [35] and cushion materials [26–28], the combined influence of rockfall interface morphology and buffer layer properties on dynamic structural response remains inadequately understood. In particular, there is no quantitative model linking rockfall interface morphology (e.g., sphericity index) with buffer layer behavior under impact, which limits the design optimization of protective structures. Therefore, this study takes hazardous rock masses in Houshan Mountain, located in a county of Sichuan Province, as its research focus. Field surveys were conducted to determine the geological conditions and failure characteristics of the unstable rock bodies. RocPro3D was used to simulate rockfall trajectories, and ABAQUS was employed to comprehensively analyze rock–structure interactions. The study aims to integrate RocPro3D trajectory analysis with ABAQUS-based investigation of interface morphology effects, thereby providing a design framework for buffer layer optimization.
Kongyu Township is situated in the northeastern part of Kangding County, Sichuan Province. The eastern section of Kangding, commonly referred to as Zhedong, forms a transitional zone from the Qinghai–Tibet Plateau to the Sichuan Basin, characterized by high mountains and extreme alpine gorges. This geomorphology results from the rapid uplift of the Qinghai–Tibet Plateau and intensive erosion by the Dadu River, endowing the Zhedong area with pronounced topographical features such as steep slopes and deep valleys. The hazardous rock zone in the rear mountain of the Cunda River Basin lies on the right bank of the Dadu River, within a landscape of undulating mountains, deeply incised valleys, and steep terrain with substantial local relief, distributed at elevations between 1710 and 2730 m. The elevation difference across the hazardous rock zone reaches approximately 1000 m. The zone trends southeastward with an overall slope inclination of about 50°. The gradient within the hazardous rock belt ranges from 50° to 80°, while the colluvial deposit slope below generally varies between 15° and 25°.
Kangding County experiences a plateau temperate humid climate typical of western Sichuan mountainous regions. Winters are long, cold, and dry with low temperatures and scant precipitation; summers are short and cool, featuring frequent but generally light rainfall, ample sunshine, strong diurnal temperature variation, high winds, and significant evaporation. Due to the considerable vertical relief within the region, a distinct altitudinal climate zonation is evident, exhibiting typical plateau climatic traits such as dryness, abundant sunshine, large day–night temperature contrasts, the virtual absence of a summer season, extended periods of snow and ice, and marked variations with elevation—mountainous areas are cold, while valley bottoms are relatively mild.
The study area falls within the sub-humid climatic zone of the Qinghai-Tibet Plateau, displaying characteristic plateau conditions: arid climate, plentiful sunshine, large diurnal temperature ranges, no distinct summer, long snow and ice seasons, and clear vertical climatic differentiation—cold at high elevations and moderate in valleys. Topographically, Kangding County is divided into eastern and western sectors. The eastern area is drained by the Dadu River and its tributaries, such as the Jintang River and the Wasi River (Kangding River). These rivers originate in high mountains and are sustained by rainfall and snowmelt, with the high-flow period occurring from June to September.
Geologically, the study area mainly exposes the Ordian Baota Formation (O2-3b), Silurian Maoxian Group (Sm), Devonian Weiguan Group (Dw), Pleistocene glacial-fluvial deposits (Q4fgl), Quaternary colluvial deposits (Q4col), Quaternary alluvial deposits (Q4al), and artificial deposits (Q4ml). The region has a complex geological structure with well-developed active faults, situated at the junction of the Xianshuihe, Longmenshan, and Anninghe seismic belts. These three seismic zones converge near Kangding in a Y-shaped configuration, resulting in particularly intense and frequent seismic activity. The basic seismic intensity for the area is IX. According to the 2001 “China Peak Ground Acceleration Map,” the peak ground acceleration in Kangding generally exceeds 0.15 g, corresponding to a basic seismic intensity of VII or higher. Along the Xianshuihe fault zone, the acceleration exceeds 0.30 g (intensity IX), and in the Lucheng town area, it surpasses 0.40 g, indicating a basic seismic intensity greater than IX. The seismic zoning is illustrated in Figs. 1 and 2, with Zone 1 being the primary focus of this study.
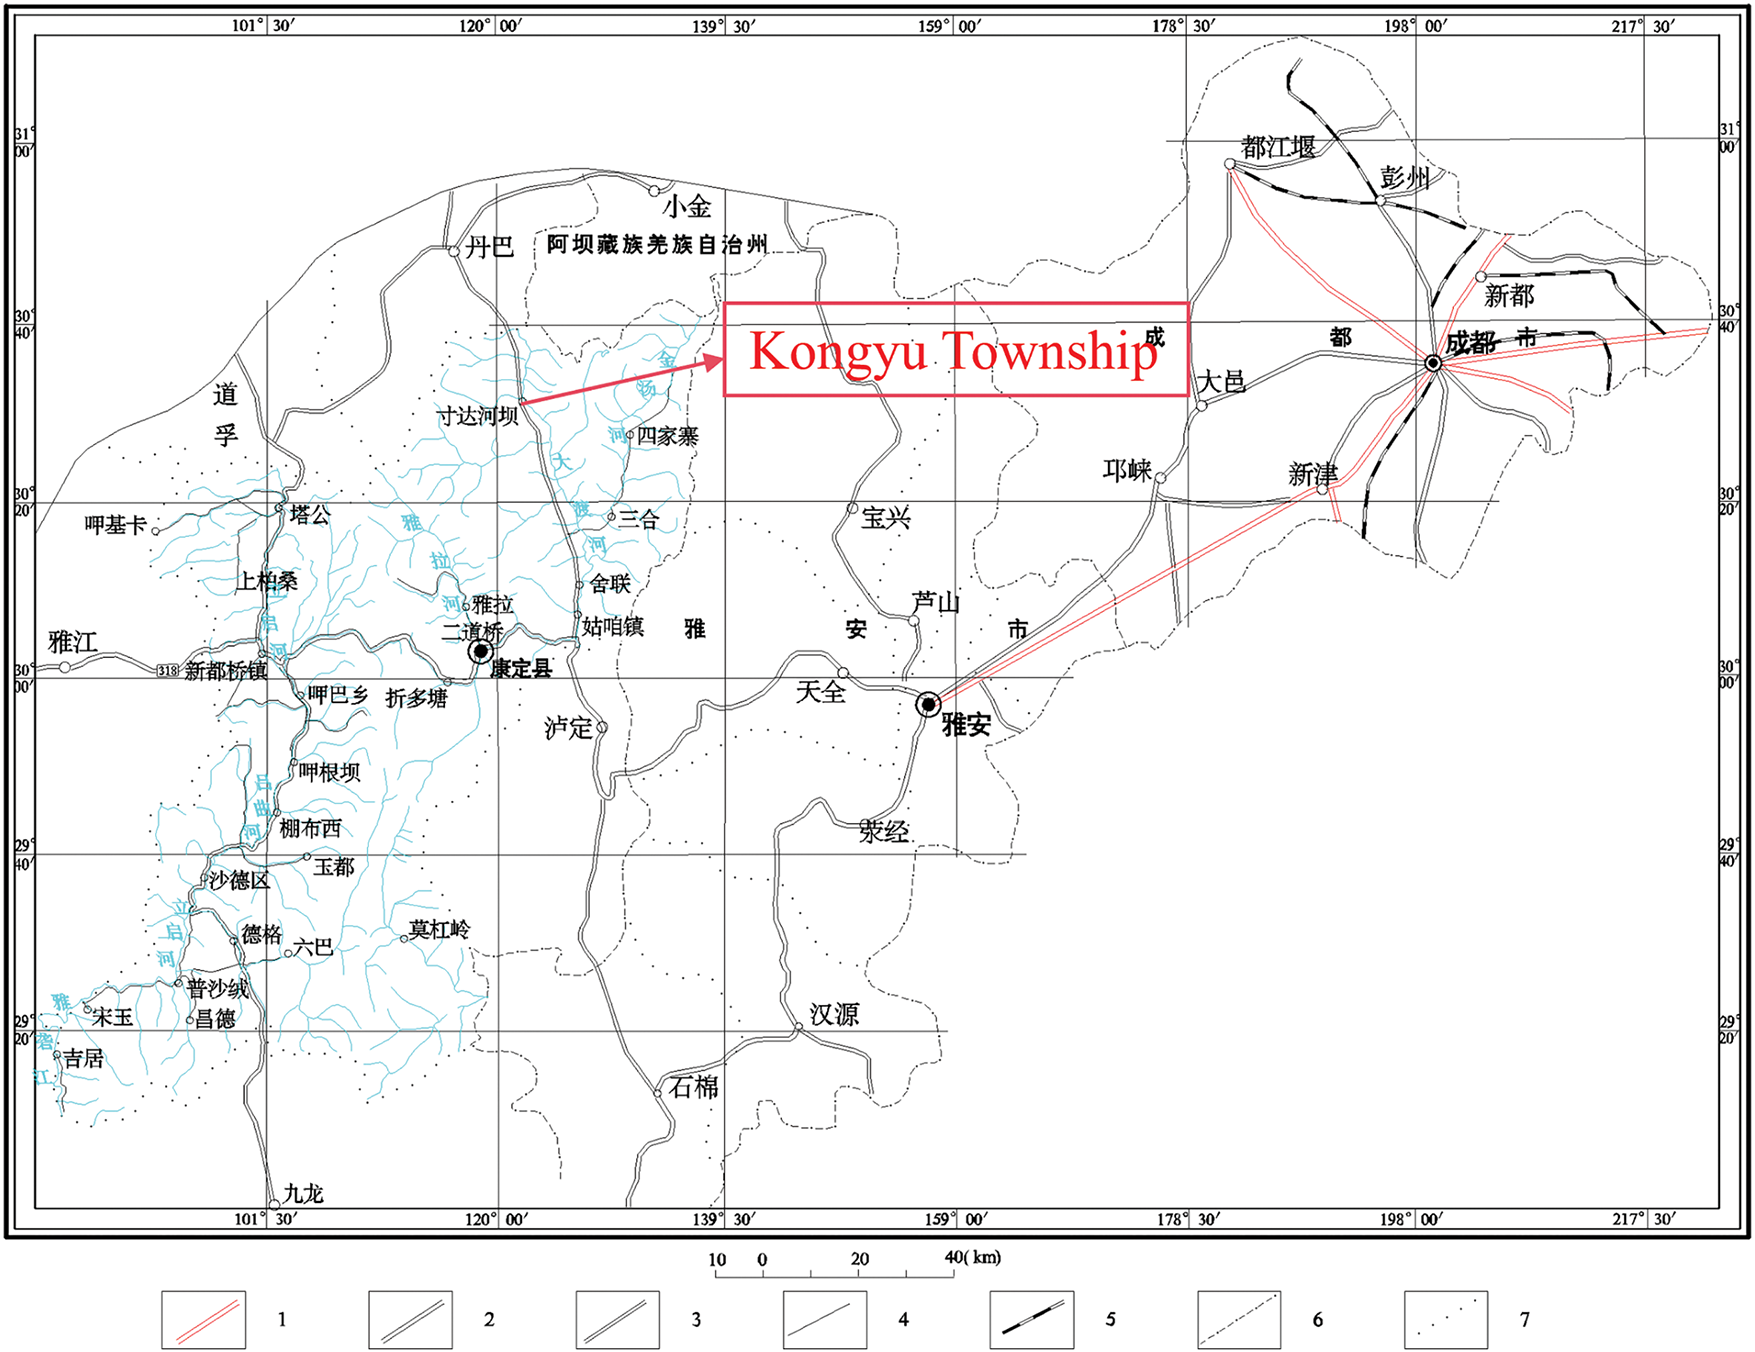
Figure 1: Location map of the study area
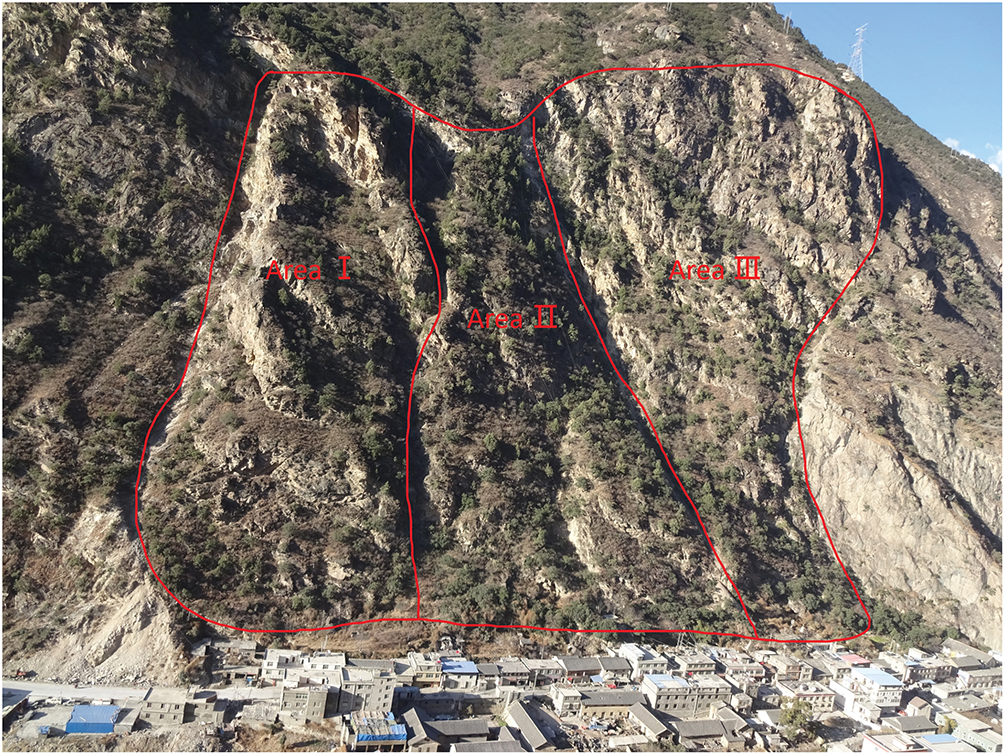
Figure 2: Danger zone diagram
In the No. I risky rock area, roads and residential buildings are located at the slope front (Fig. 3), with a secondary watershed at the top. The hazardous rocks occur on slopes of 98° and 65–89°, distributed between 1877 and 2276 m in elevation. The slope measures 400 m in length and 245 m in width, with a vertical difference of 182–395 m from the slope toe. A total of 10 hazardous rock subzones have been identified. The unstable rock blocks have diameters of 1–3 m, and the thickness of colluvial deposits at the front edge of the unstable rock zone ranges from 5 to 20 m. The slope of these colluvial deposits is approximately 40°, with sporadic bedrock outcrops and a surface composition dominated by stone blocks and soil.
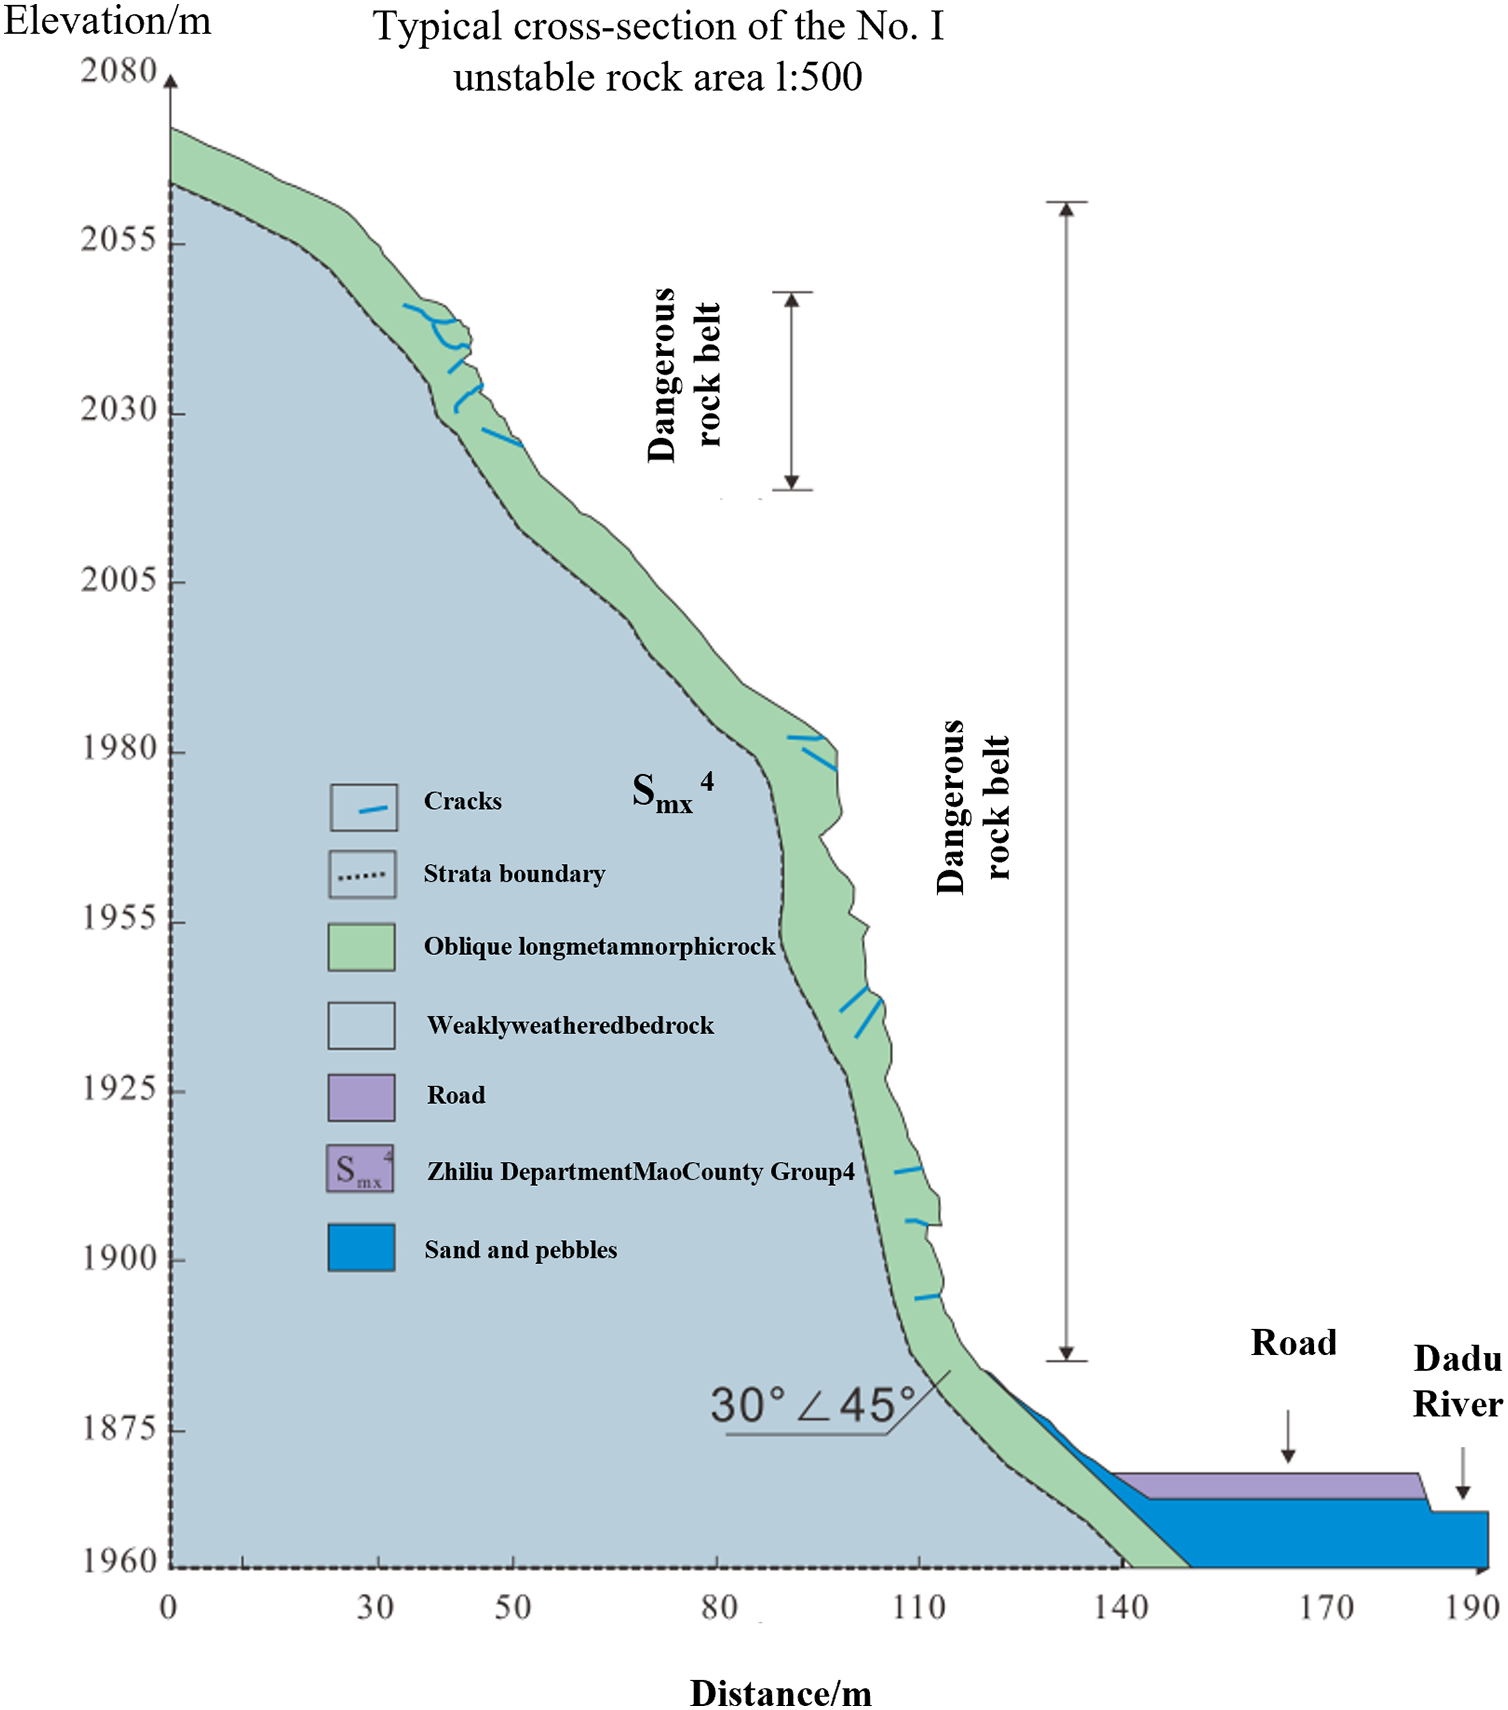
Figure 3: Typical cross-section of the No. I unstable rock area
2.2 RocPro3D Computational Model
The topographic data for this study were primarily derived from digital topographic maps at a scale of 1:1000, supplemented and validated by field surveys and GPS measurements. The specific modeling procedure was as follows [44]:
Topographic Data Acquisition: Contour line vector data (in DWG format) for the study area were obtained from the surveying and mapping department. These data were generated based on total station and Real-Time Kinematic (RTK) measurements, ensuring high accuracy. Terrain Surface Generation: The contour lines were cleaned and densified in CAD software. Subsequently, Surfer software was used to interpolate the contour data into a regular grid (GRID format) with a grid spacing of 5 m, thereby constructing a continuous terrain surface. 3D Model Import: The generated GRID file was imported into RocPro3D software. Combined with the distribution range of the unstable rock masses determined by field investigation, the 3D characteristic map of the unstable rock slope for the study area was finally generated (Fig. 4).
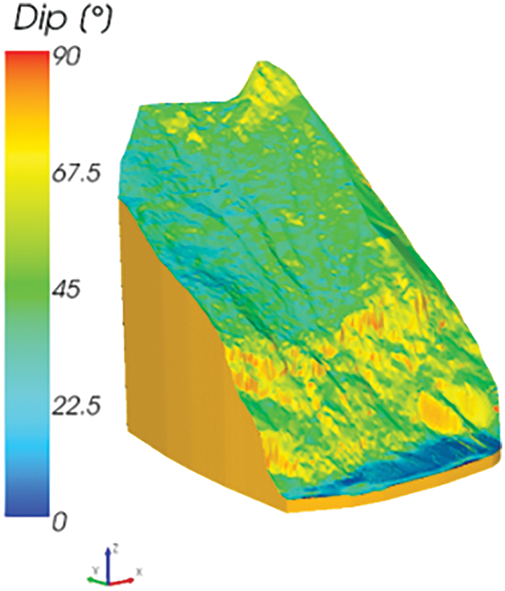
Figure 4: 3D unstable rock slope characteristic map of the No. I dangerous rock area
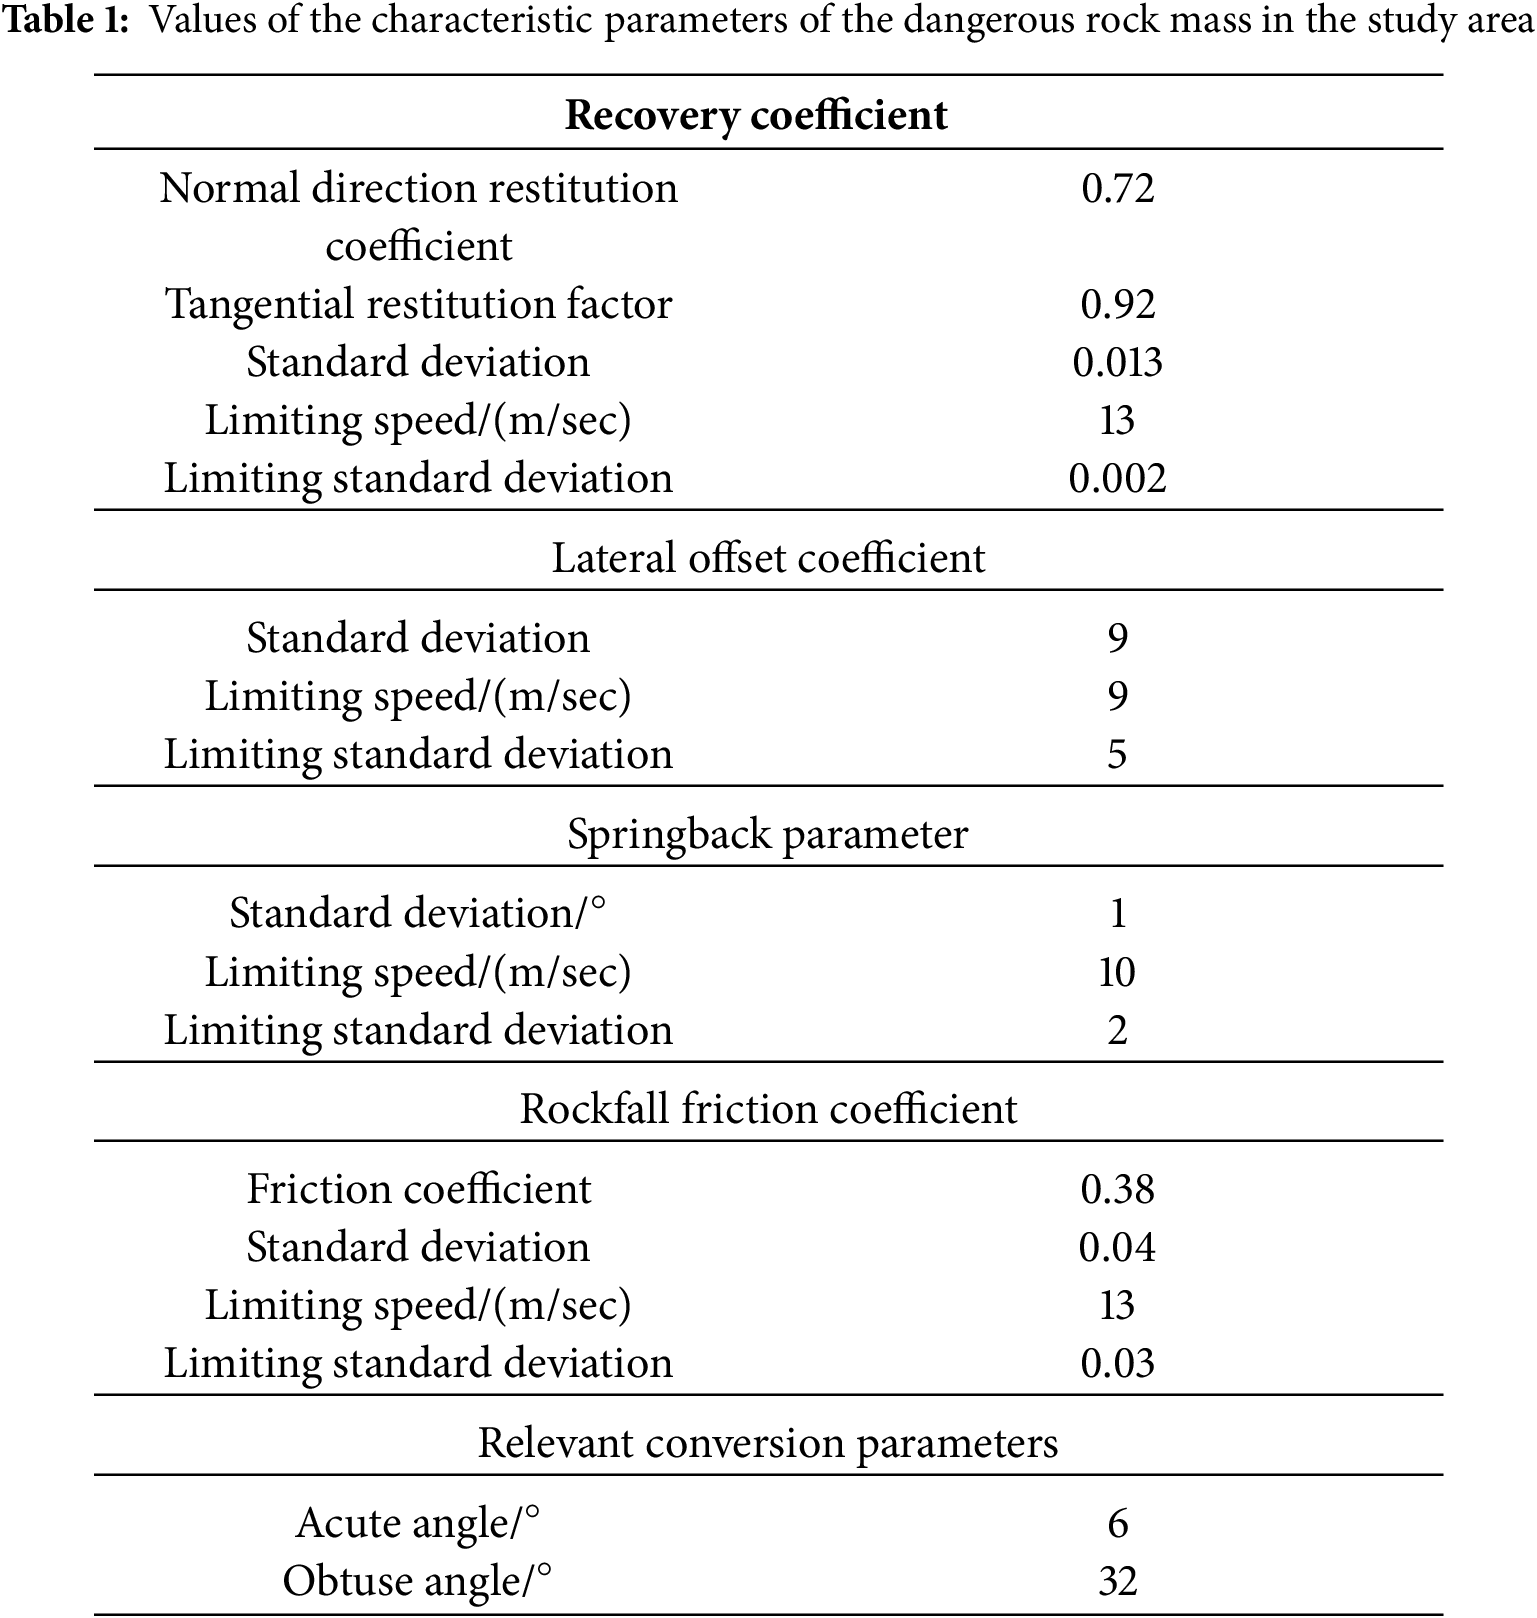
The determination of rockfall shape parameters in this study was based primarily on field surveys. The values for the restitution coefficients, which govern the collision and bouncing behavior of falling rocks on the slope, were assigned according to the properties of the surficial rock and soil materials. As the study area is predominantly underlain by plagioelongated granulite, all rock masses were simplified and modeled as intact rock units for computational tractability. Empirical values were initially used to estimate the friction coefficient, with the final parameters adopted for simulation listed in Table 1 (reprinted with permission from Ref. [45]. Copyright 2020, X.F. Mei).
The numerical simulations were performed using ABAQUS software. The protective structure in the computational model consists of two main components: a reinforced concrete slab and a buffer layer. The buffer layer, which is the part in direct contact with the falling rock, is typically composed of porous media with favorable energy-absorption characteristics. The concrete slab acts as a rigid support, bearing both the structure’s self-weight and the impact loads.
The numerical model comprises three parts: a impactor representing the rockfall, a gravel-soil buffer layer for energy dissipation, and a reinforced concrete slab. The thicknesses of the reinforced concrete slab and the buffer layer are 25 cm and 0.4 m, respectively. The model was discretized using 8-node linear brick, reduced integration elements (C3D8R). To balance computational accuracy and efficiency, a uniform mesh with an element size of 1 mm × 1 mm × 1 mm was applied to the critical regions. Regarding boundary conditions, the supports of the model were assigned fully fixed constraints to simulate actual clamped conditions under impact loading. The impact was simulated by defining a rigid impactor with a mass of 4240 kg, assigned an initial velocity of 25 m/s to replicate a high-energy impact scenario. The configuration of the computational model is shown in Fig. 5.
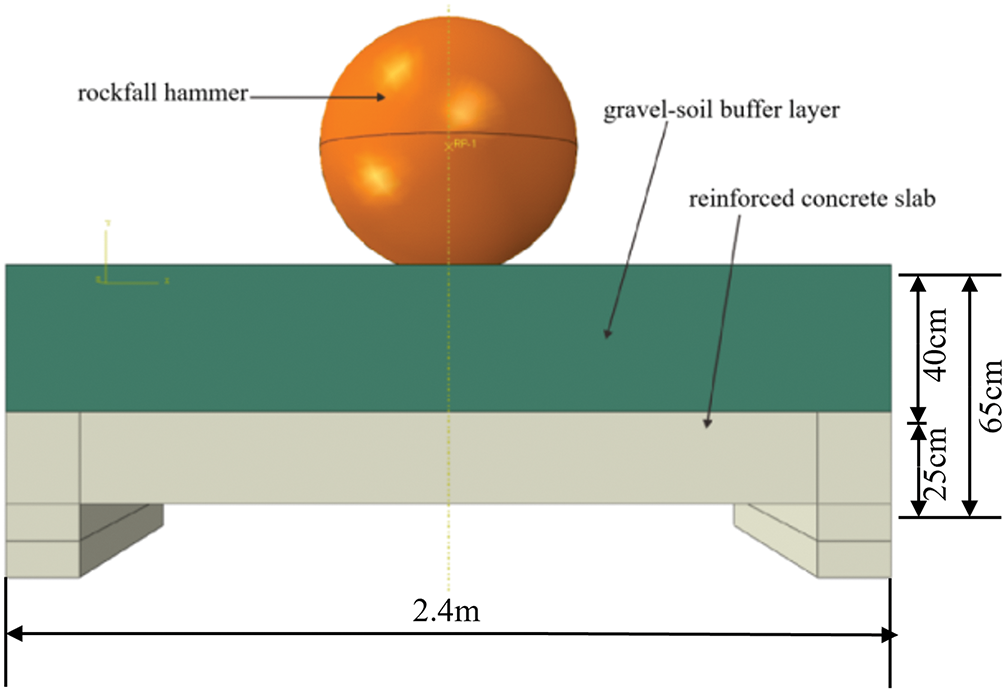
Figure 5: Numerical calculation model
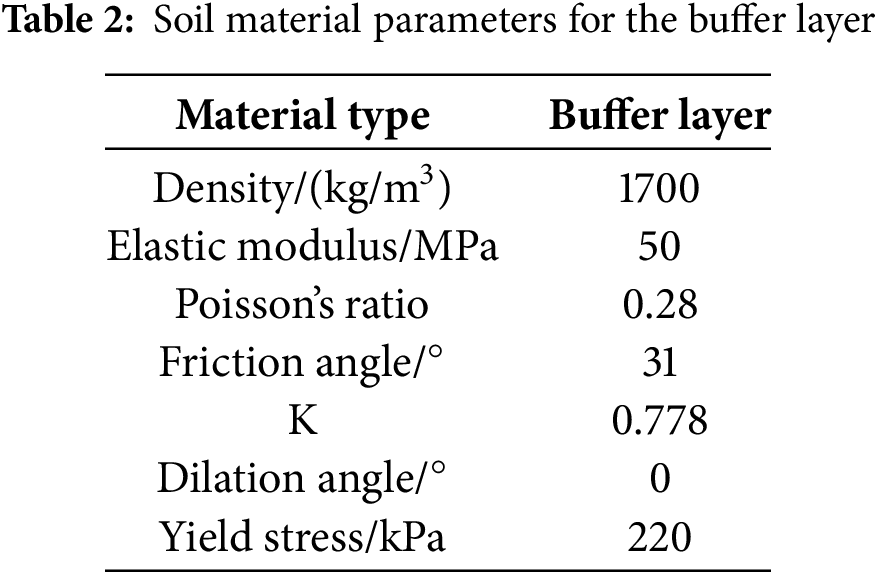
Building upon previous research [38,46,47], this study selected typical gravelly soil as the buffer layer material. The yield and failure behavior of the soil were modeled using the modified Drucker-Prager plasticity criterion, with detailed material parameters provided in Table 2.
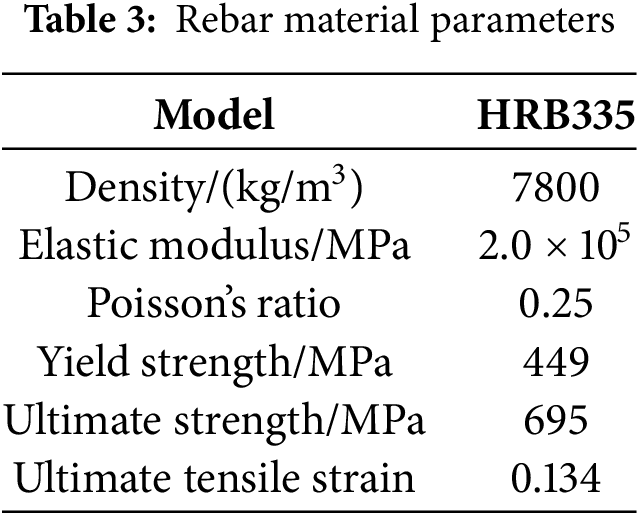
The constitutive model for the steel rebar accounts for its strain-rate dependence, reflecting how mechanical properties change under dynamic loading. Generally, as the strain rate increases, the ratio of material strength to yield stress decreases. To fully incorporate this rate-dependent behavior, a tri-linear kinematic hardening model was adopted for the rebar. The relationship between the yield strength, ultimate strength of the steel, and the strain rate is given by Eqs. (1) and (2):
where
Research [48] indicates that the maximum impact velocity of rockfalls in natural settings generally does not exceed 25 m/s, classifying this as a typical low-velocity impact problem. For the HRB335 rebar used in this simulation, corresponding to a strain rate of
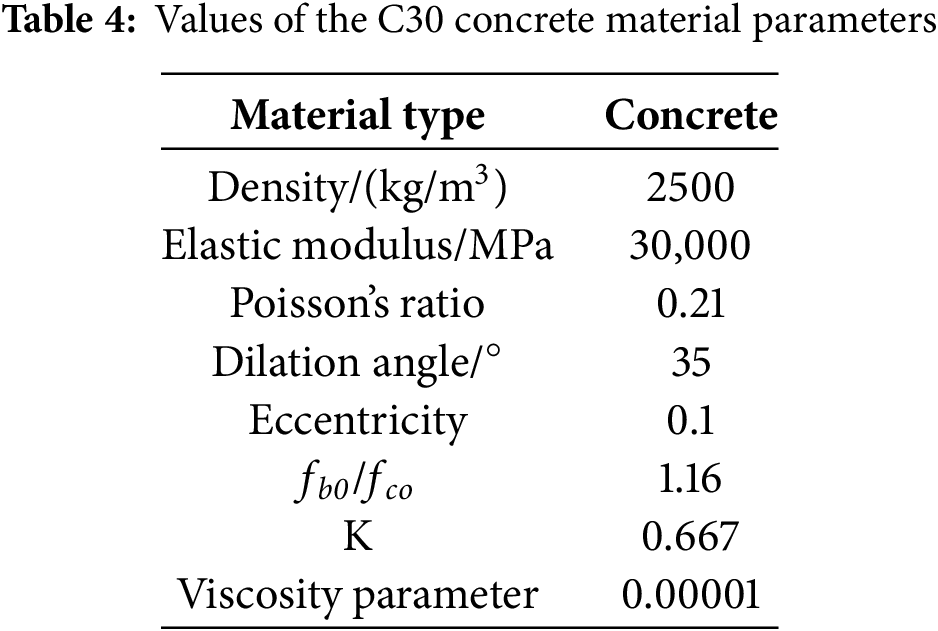
For computational efficiency, the numerical model employed the Concrete Damaged Plasticity (CDP) model, a dynamic damage model that considers the rate dependence of concrete. The parameters for the C30 concrete material used in this study are summarized in Table 4 (adapted with permission from Ref. [49]. Copyright 2010, AQSIQ).
3.1 Finite Element Analysis Results
A three-dimensional trajectory simulation was conducted based on the determined slope and rockfall characteristic parameters. For the No. I risky rock area, the simulation assumed 200 falling rocks, each with a diameter of 1.5 m and a uniform density of 2400 kg/m3. The calculated distribution of rockfall velocity and bounce height along a typical section of this area is presented in Fig. 6.
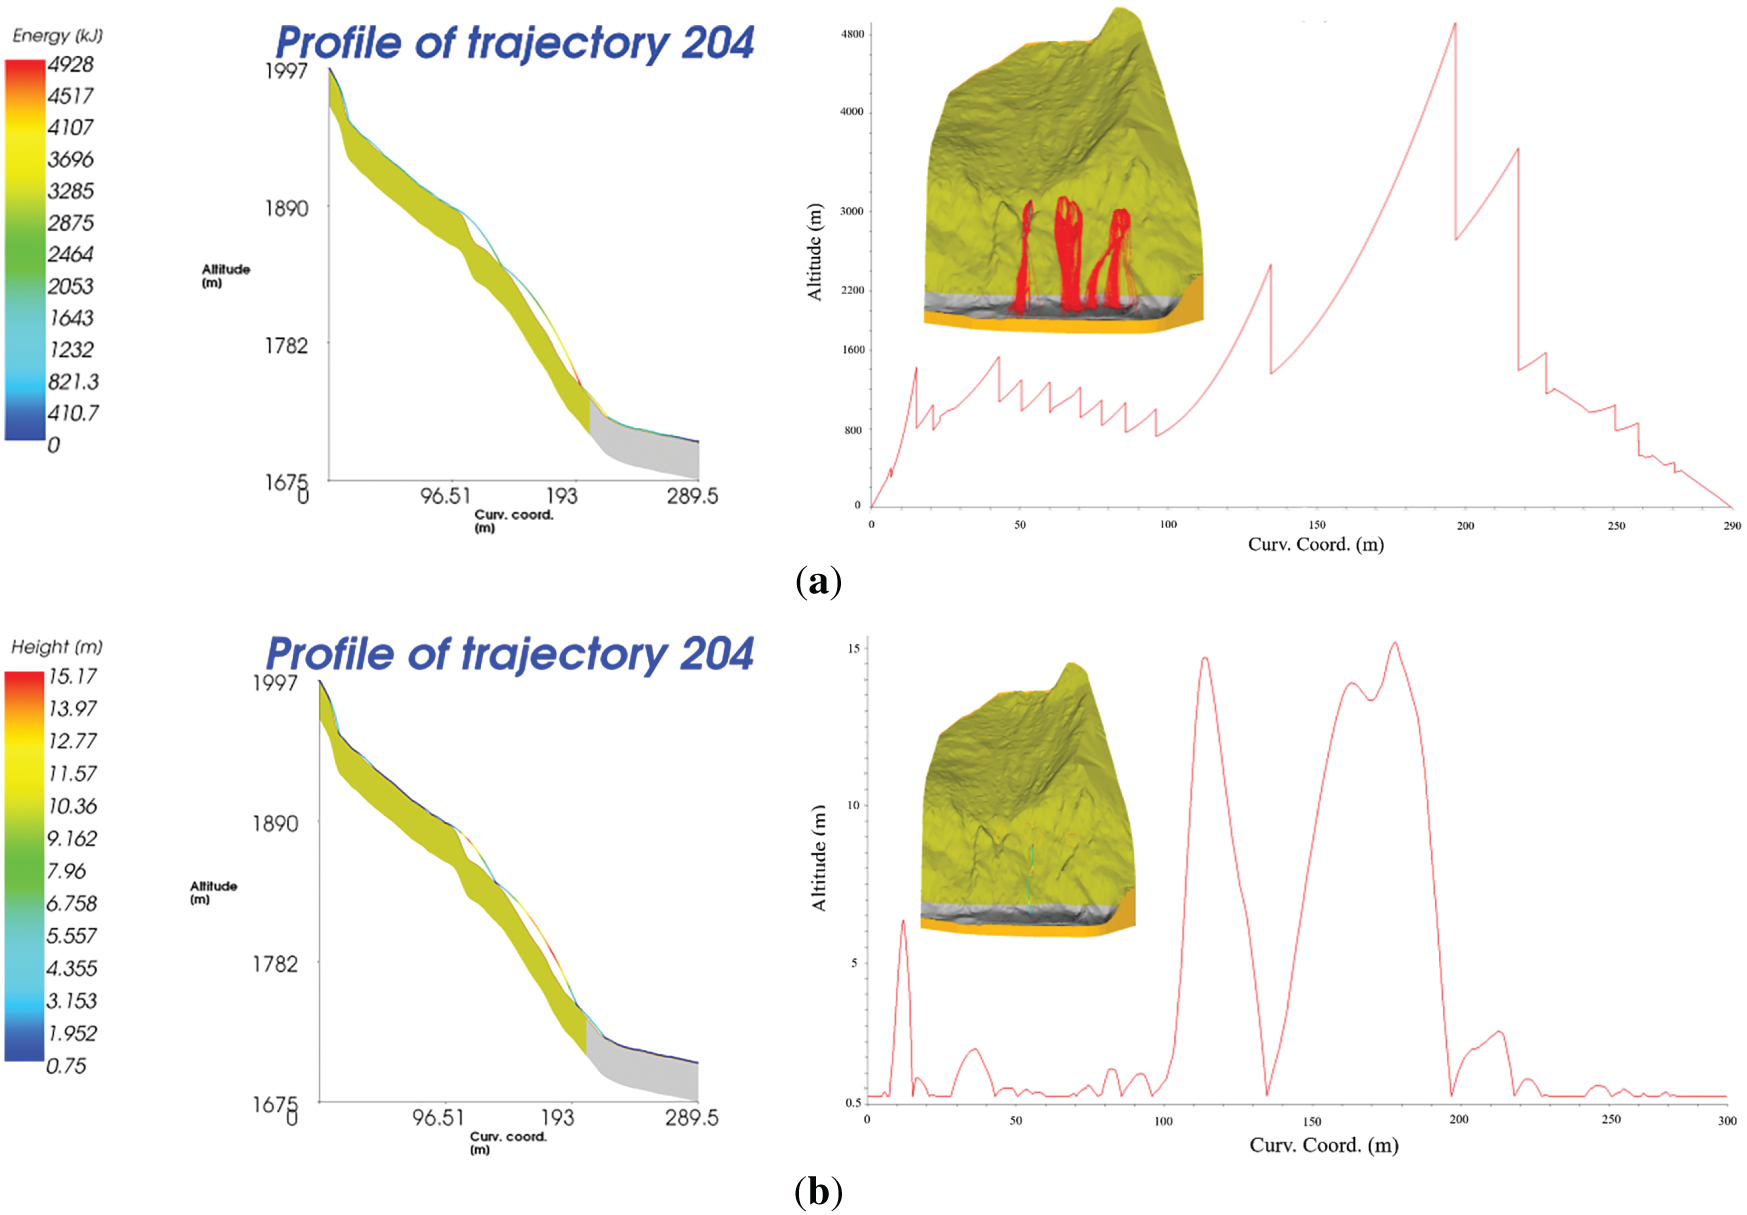
Figure 6: Distributions of the rockfall velocity and bounce height in a typical section of the No. I risky rock area: (a) Energy distribution of a typical profile; (b) Bounce height distribution of a typical cross-section
Energy dissipation during rockfall movement is the primary cause of the continuous reduction in kinetic energy. Major dissipation mechanisms include: (1) collision between the rockfall and slope surface; (2) frictional resistance during movement along the slope; (3) energy loss during bouncing; and (4) air resistance. Throughout the motion process, the maximum recorded kinetic energy of the rockfall reached 11.2 kJ, with a peak velocity of 86.9 m/s observed along its path. These extreme values typically occur in the mid-slope region, where the gradient is steepest and the restitution coefficient is highest. As the rockfall descends further, energy is progressively dissipated through repeated impacts and friction, particularly when traversing the colluvial deposit zone near the slope toe, which exhibits a lower restitution coefficient. Consequently, by the time the rockfall reaches the location of the proposed protective structure—situated at the slope toe where most deposits accumulate—its velocity attenuates to between 20 and 30 m/s.
The maximum bounce height is also observed near the slope toe; however, it is generally reduced compared to upper-slope values due to cumulative energy loss from repeated collisions and slope friction. Analysis of final deposition patterns indicates that rocks with higher initial energy tend to travel farther. In this case, unstable rocks with sufficient initial energy can reach areas relatively distant from the slope toe—where residential zones are located—posing a serious threat in the absence of protective measures.
In summary, comprehensive analysis of the simulation results indicates that the maximum rockfall velocity at the proposed protective structure ranges between 20 and 30 m/s, with bounce heights of 5 to 8 m. Influenced by local topography, most rockfalls accumulate at the slope toe, primarily due to the low restitution coefficient of the soil structure layer in this zone. Nevertheless, some rockfalls continue to bounce forward. Without adequate protection, this poses a danger to the entire area susceptible to unstable rock impacts, underscoring the necessity of implementing protective measures.
The morphology of a rockfall not only influences its trajectory but also governs its bounce height and travel distance, thereby significantly affecting its dynamic response upon impact [50,51]. Different rockfall shapes result in varying contact configurations upon collision with the ground or protective structures—such as surface-to-point, point-to-surface, or edge-to-surface contacts—which inevitably lead to differences in impact response. Furthermore, rockfall is a rapid process involving long-distance movement and poses a high risk of damage to buildings and infrastructure. The inclusion of a buffer layer can enhance energy absorption during impact and mitigate direct force transmission to underlying structures [52,53].
3.2.1 Effects of the Rockfall Interface Morphology on the Kinetic Parameters
Assuming a rockfall impact velocity of 8 m/s and a buffer layer thickness of 0.4 m, numerical models were developed to investigate how three distinct rockfall-buffer layer contact mechanisms affect dynamic response parameters, as illustrated in Fig. 7. The structural components were discretized using 8-node linear brick, reduced integration elements (C3D8R). A uniform mesh with an element size of 1 mm × 1 mm × 1 mm was applied to critical regions to balance computational accuracy with efficiency.
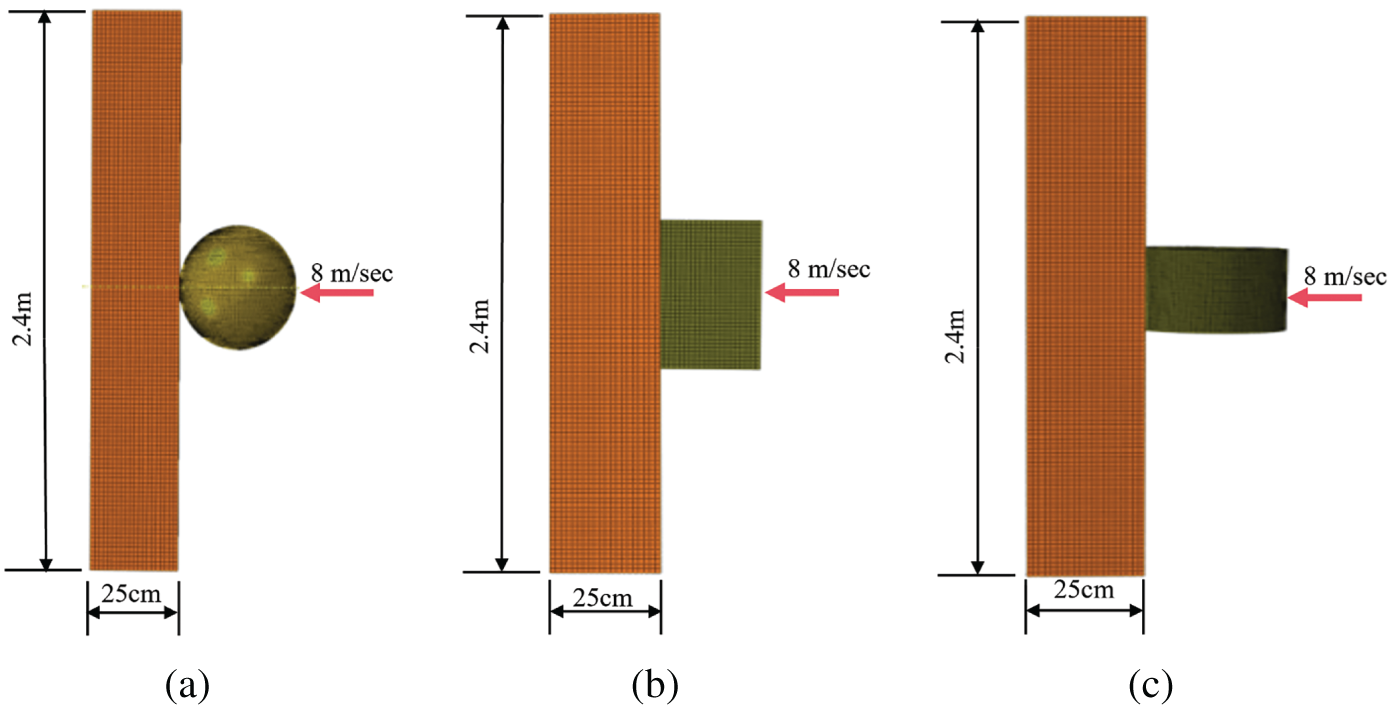
Figure 7: Model of the contact mode of rockfall: (a) Spherical; (b) Cubic; (c) Columnar
The influence of different contact configurations on impact force is shown in Fig. 8. The results indicate that among rocks of identical mass and impact velocity, cubic rocks produce the highest impact force, while spherical rocks yield the lowest. Among the three contact scenarios analyzed, the maximum impact forces were 451 kN for the cubic rock, 350 kN for the columnar rock, and 280 kN for the spherical rock. The impact force generated by the arcuate contact mode (spherical rock) was significantly lower than that of the planar contact mode (cubic rock).
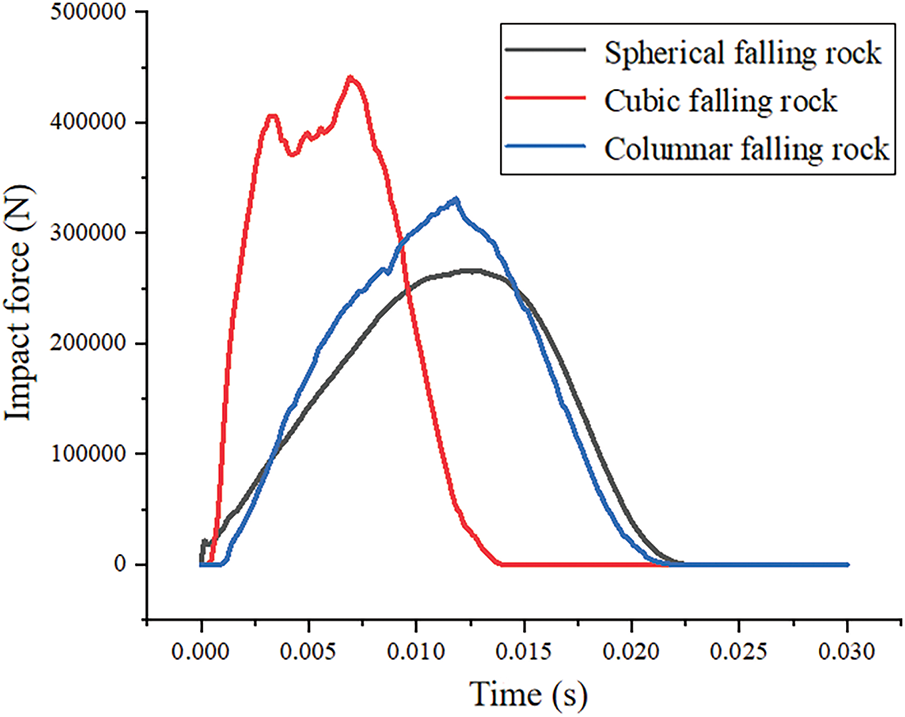
Figure 8: Effect of the rockfall contact method on the impact force
The peak impact force of cubic rocks (451 kN) exceeded that of spherical rocks (280 kN) by 61%, which aligns with the findings of Yan et al. [36] that angular blocks generate 40%–70% higher impact forces than rounded rocks due to localized stress concentration. This 61% increase implies that conventional design standards based on spherical rock models may underestimate impact risks in slopes dominated by angular rock debris, such as those in tectonic fracture zones. This supports the argument by Caviezel et al. [35] for incorporating a morphology-dependent safety factor in protective design.
In addition, the impact duration was shortest for cubic rocks, longer for columnar rocks, and longest for spherical rocks. A shorter impact duration generally corresponds to a higher peak impact force due to the impulsive nature of the interaction. Therefore, it is scientifically unsound to calculate rockfall impact forces in practical engineering without considering rock shape and contact interface morphology.
The influence of interface morphology between the rockfall and buffer layer on impact penetration depth is shown in Fig. 9. The results demonstrate that both the mass and velocity of the rockfall significantly affect the penetration depth. Among the three contact configurations, spherical rockfalls produced the greatest penetration depth (7.5 cm), followed by columnar rockfalls (2.5 cm), with cubic rockfalls yielding the smallest depth (0.1 cm). Deeper penetration correlates with lower peak impact forces, consistent with energy dissipation through greater material deformation.
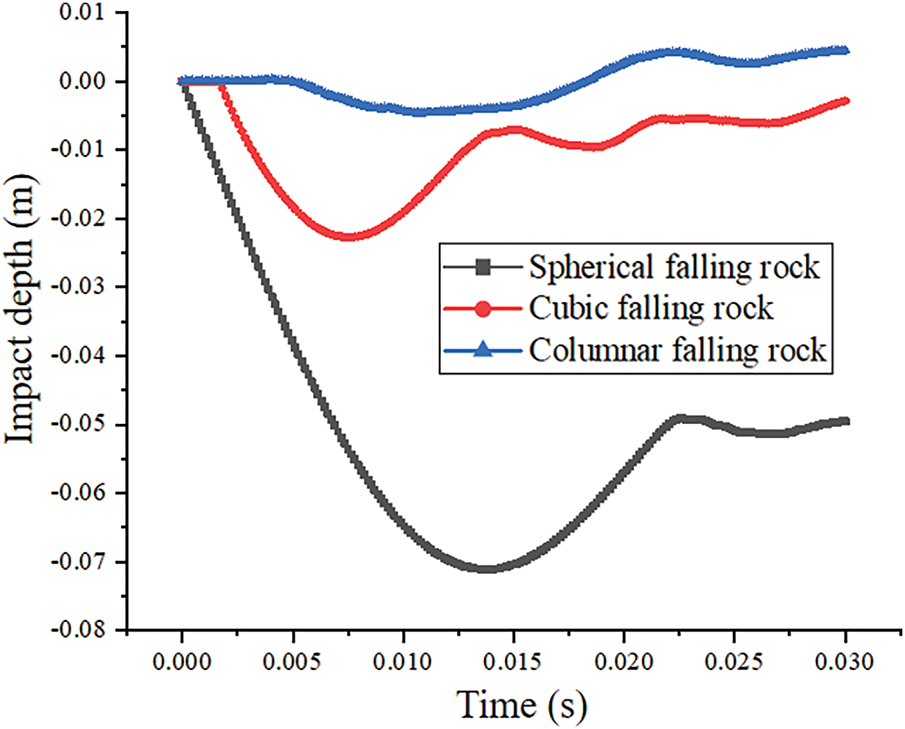
Figure 9: Effect of the rockfall contact method on the impact depth
The tri-phasic depth evolution follows the Drucker-Prager yield criteria: Phase I (elastic compaction, ε < 5%) corresponds to yield surface expansion; Phase II (plastic rebound) manifests as cap surface contraction; and Phase III represents critical state flow [38]. This mechanistic understanding supports the engineering recommendation to select buffer materials with enhanced plastic deformation capacity.
Furthermore, spherical rock impacts exhibited the most significant recovery of elastic deformation, while cubic and columnar rocks showed considerably less elastic recovery. This behavior further confirms that rockfall morphology substantially influences both the dynamic response and energy dissipation mechanisms during impact.
The influence of different contact configurations on the impact contact area is shown in Fig. 10. Results indicate that for rockfalls of identical mass and impact velocity, the contact morphology significantly affects the contact area. Cubic rockfalls exhibit the largest contact area, followed by columnar rockfalls, while spherical rockfalls produce the smallest area. Among the three configurations, the maximum contact areas were 0.27, 0.13, and 0.12 m2, respectively. A larger contact area correlates with a higher peak impact force, as the load is distributed over a broader interface during the collision.
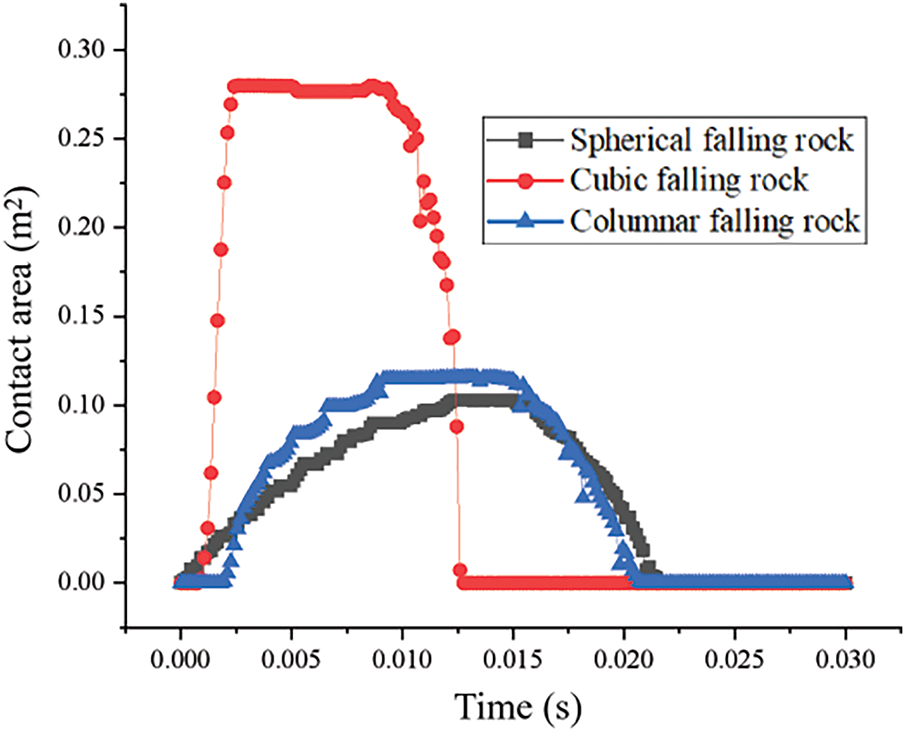
Figure 10: Effect of the rockfall contact method on the contact area
The influence of different contact configurations on concrete strain response is presented in Fig. 11. Results demonstrate that for rockfalls of identical mass and impact velocity, the contact morphology significantly affects the mid-point strain of the concrete slab. Cubic rockfalls induce the largest concrete strain, followed by columnar rockfalls, with spherical rockfalls producing the smallest strain values. Under the three contact modes, the maximum concrete strain values reached 0.0002ε, 0.0005ε, and 0.00045ε, respectively. A clear correlation is observed where higher impact forces correspond to greater maximum concrete strains.
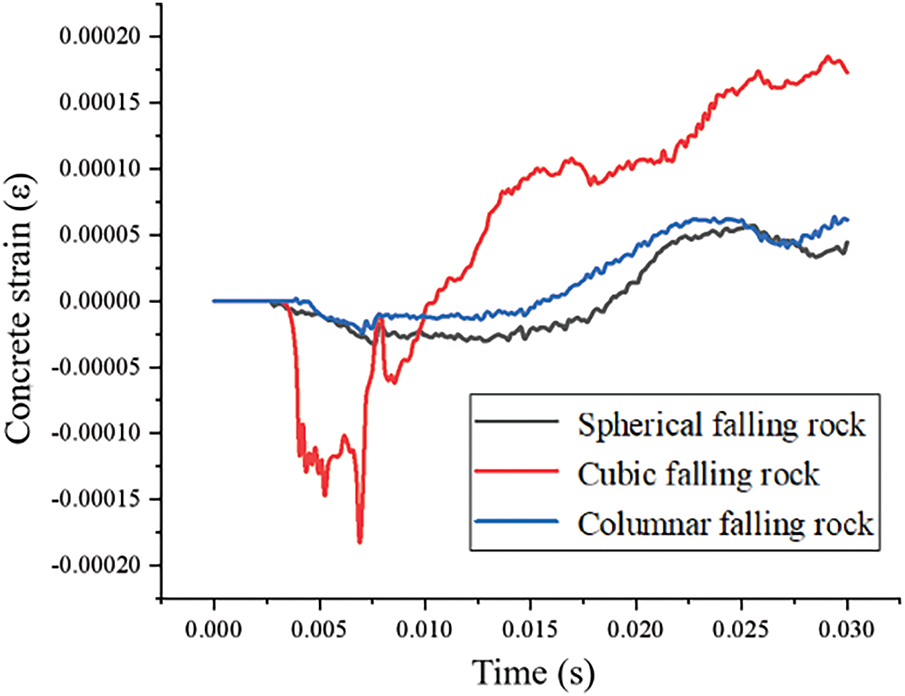
Figure 11: Effect of the contact mode of rockfall on the concrete strain
Fig. 12 illustrates the effects of different contact configurations on the displacement at the center point of the concrete slab’s lower surface. The results indicate that rockfall contact morphology substantially influences the slab’s deflection behavior. Cubic rockfalls cause the largest displacements, followed by columnar rockfalls, while spherical rockfalls result in the smallest displacements. The maximum recorded displacements under the three contact modes were 3.5, 1, and 0.5 mm, respectively. This displacement pattern consistently correlates with impact force magnitude—greater impact forces produce larger structural displacements.
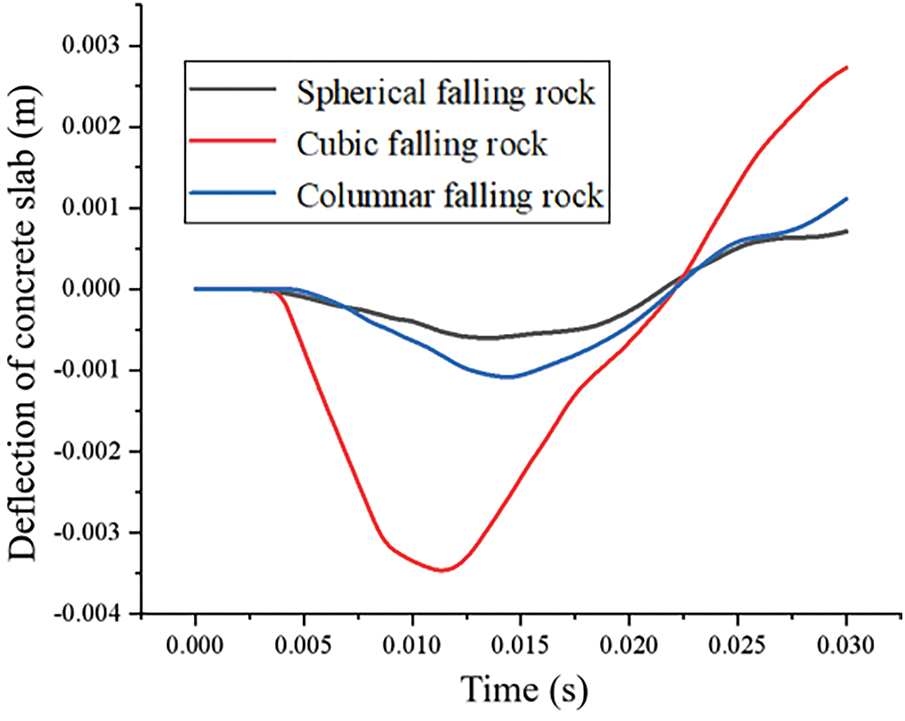
Figure 12: Effect of the rockfall contact method on the deflection of a concrete slab
Fig. 13 illustrates the influence of rockfall contact configuration on the von Mises stress distribution and the resulting crater morphology within the buffer layer. The results indicate that, for rockfalls of identical mass and impact velocity, the three distinct rock shapes produce markedly different stress patterns on the buffer layer surface. The morphology of the impact crater consistently corresponds to the geometry of the impacting rock: spherical rockfalls generate hemispherical craters, cubic rockfalls produce square impressions, and columnar rockfalls create rectangular craters with rounded edges.
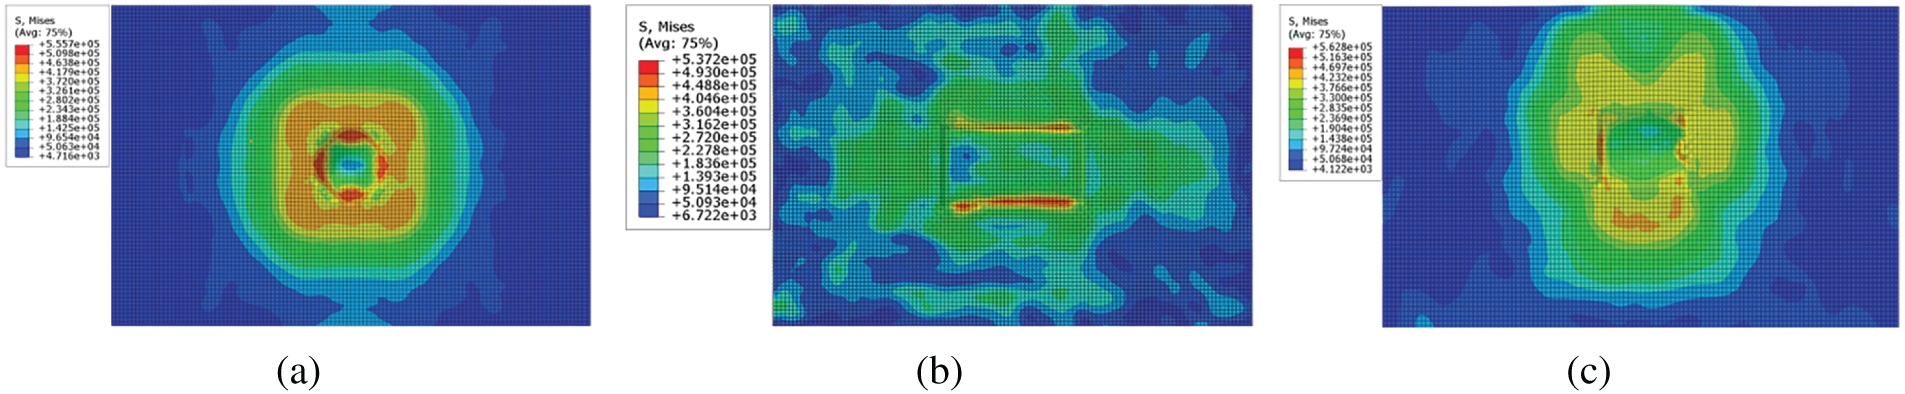
Figure 13: Effect of the rockfall contact method on the von Mises stress in the buffer layer: (a) Spherical fallen rock; (b) Cubic fallen rock; (c) Columnar fallen rock
Across all contact configurations, the maximum von Mises stress consistently occurred at the center of the rockfall-buffer layer interface. The recorded peak stresses were 0.56 MPa for spherical rockfalls, 0.54 MPa for cubic rockfalls, and 0.56 MPa for columnar rockfalls. In summary, while the spatial distribution of stresses varies with rock shape, the magnitude of the maximum von Mises stress remains fundamentally consistent across different rockfall morphologies under identical impact energy conditions.
3.2.2 Effect of the Presence of the Buffer Layer on the Dynamic Response of the Structure
This section employs numerical analysis to examine the dynamic response of a reinforced concrete slab both with and without a buffer layer. The simulations maintained a consistent impact velocity of 5 m/s. In the unprotected configuration, the rockfall directly strikes the rigid concrete slab, whereas in the protected configuration, a 0.1-m thick gravel-soil buffer layer is interposed between the rockfall and the reinforced concrete structure.
The base mesh was constructed using 1 mm × 1 mm × 1 mm hexahedral elements, all discretized as C3D8R elements (8-node linear brick, reduced integration). A fully fixed boundary condition was applied to the bottom surface of the concrete slab. Dynamic response was induced by imposing a velocity load on the rockfall element.
For contact interactions, the tangential behavior at both the soil-rockfall and rockfall-concrete interfaces was modeled using a penalty friction formulation, with assigned friction coefficients of 0.42 and 0.30, respectively. The normal behavior for all contact pairs was defined as “hard contact” to simulate impenetrable surface conditions. The numerical model configuration is presented in Fig. 14.
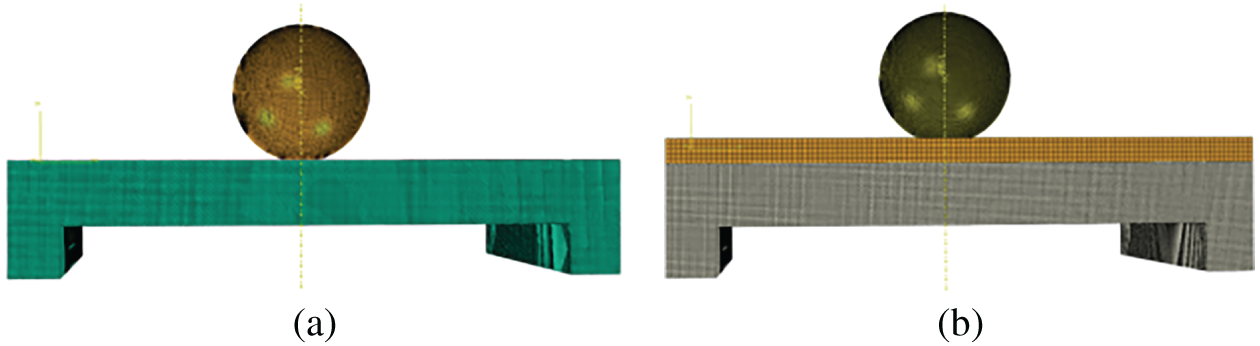
Figure 14: Numerical calculation model with or without a buffer layer: (a) No buffer layer; (b) 0.1 m buffer layer
Fig. 15 illustrates the influence of the buffer layer system on energy dissipation during impact. The results demonstrate that when a rockfall directly strikes an unbuffered reinforced concrete slab, most of the kinetic energy transforms into deformation energy, leading to structural failure. In contrast, when a buffer layer is present, over 85% of the rockfall’s kinetic energy is absorbed by the buffer material. This finding aligns with previous research by Meree et al. [27] and Umili et al. [28]. The presence of the buffer layer effectively preserves the structural integrity and normal function of the concrete slab.
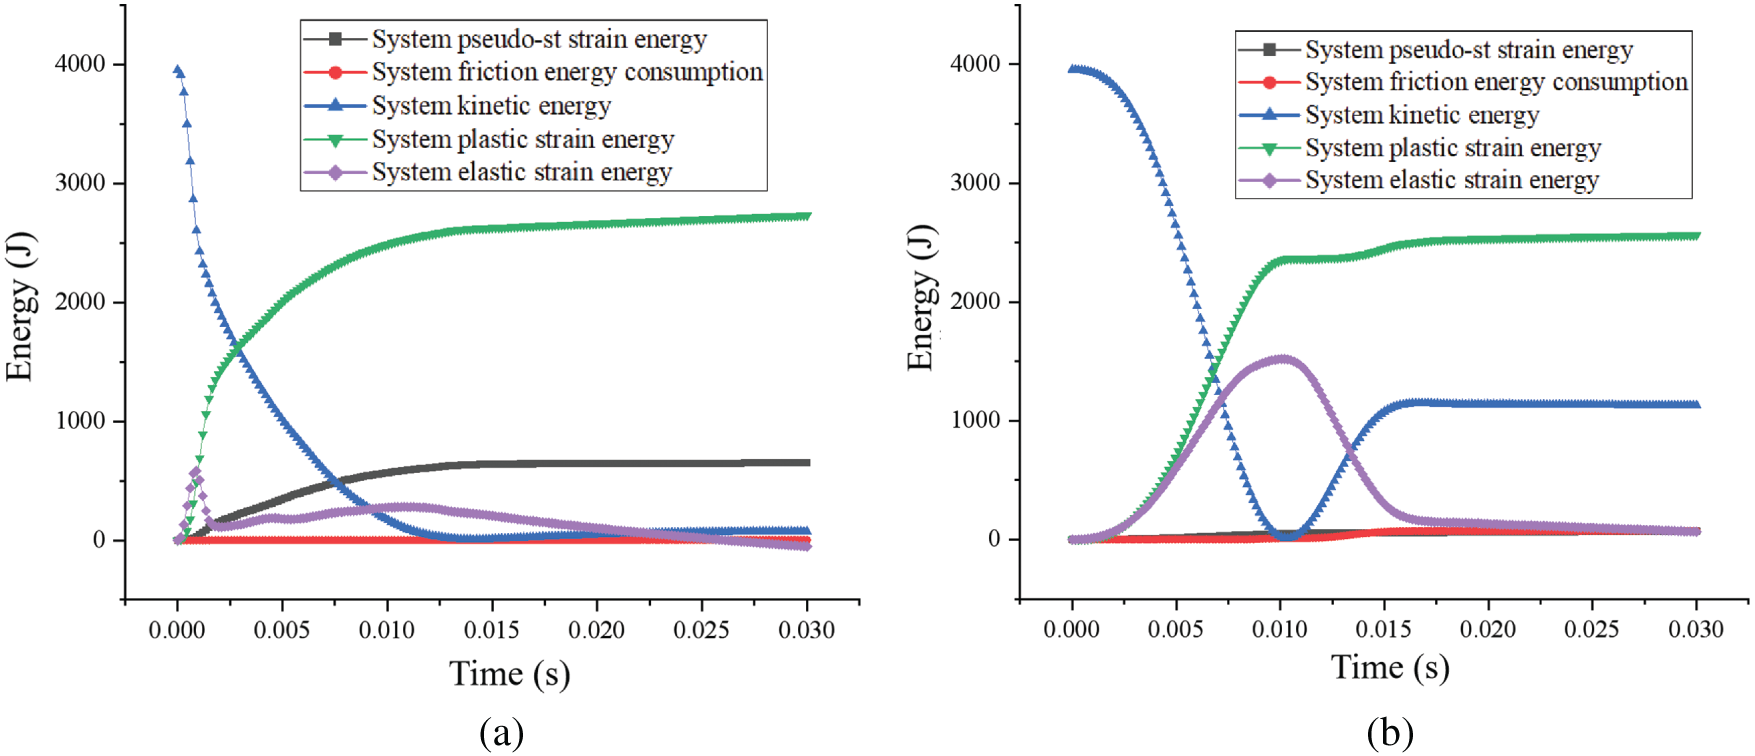
Figure 15: Energy change of the system with and without the buffer layer: (a) No buffer layer; (b) 0.1 m buffer layer
Fig. 16 illustrates the effect of buffer layer presence on impact force. The results demonstrate a marked difference in impact forces between structures with and without buffer layers. The maximum impact force reached 640 kN for the structure without a buffer layer, compared to only 290 kN for the structure with a 0.1 m buffer layer—representing a 55% reduction in peak impact force.
Figure 16: Effect of the presence of the buffer layer on the impact force
This 55% attenuation in impact force with a 0.1 m buffer layer corroborates Meree et al. [27] findings on granular energy dissipation, while extending their conclusions to gravel-soil mixtures. The performance of the 0.1 m gravel-soil layer surpasses the 30%–40% reduction reported by Kawahara and Muro [26] for sand cushions, demonstrating the superior energy dissipation characteristics of graded granular mixtures.
Additionally, significant differences were observed in impact duration. The impact event without a buffer layer was extremely brief at 0.0018 s, while the presence of a buffer layer extended the duration to 0.028 s. This prolonged interaction time contributes significantly to the reduction in peak impact force through more gradual energy transfer.
Fig. 17 illustrates the influence of the buffer layer on concrete strains measured at identical locations. Comparative analysis reveals that the concrete strain in the unprotected structure (without buffer layer) is markedly higher than that in the protected configuration (with buffer layer). Specifically, the maximum measured strain reaches 0.00008 in the absence of a buffer layer, compared to only 0.00002 when the buffer layer is present. These results demonstrate the buffer layer’s substantial energy absorption capacity, which effectively mitigates structural distress and prevents brittle failure modes in the concrete slab. This protective mechanism aligns with the energy dissipation patterns observed in previous impact force analyses, further validating the buffer layer’s critical role in impact protection systems.
Figure 17: Effect of the presence of the buffer layer on the concrete strains
Fig. 18 demonstrates the influence of the buffer layer on the displacement at the center point of the reinforced concrete slab’s lower surface. Comparative measurements reveal substantially greater deformation in the unprotected configuration (without buffer layer) than in the protected configuration (with buffer layer). Specifically, the maximum mid-span displacement reaches 0.27 m without the buffer layer, compared to only 0.002 m when the buffer layer is present—a reduction of two orders of magnitude.
Figure 18: Effect of the presence of a buffer layer on the deflection of a concrete slab
Furthermore, the structural response differs fundamentally between the two cases. The unprotected slab undergoes significant irreversible plastic deformation upon impact, while the protected configuration exhibits nearly complete elastic recovery, maintaining its structural integrity throughout the impact event. This elastic behavior demonstrates that the buffer layer enables the concrete slab to remain in a flexible working state, effectively distributing impact loads and preventing permanent damage.
These displacement characteristics align with and substantiate the strain and impact force patterns observed in previous analyses, collectively validating the crucial protective function of the buffer layer in rockfall impact scenarios.
The compressive and tensile damage patterns of reinforced concrete slabs with and without buffer layer protection are shown in Figs. 19 and 20, respectively. The results indicate that compressive damage is significantly less prevalent than tensile damage. The unprotected slab (without buffer layer) exhibits compressive damage at the mid-span region, with cracks propagating laterally upward from this area. In contrast, the slab protected with a 0.1 m buffer layer shows no signs of compressive damage.
Figure 19: Effect of the presence or absence of a buffer layer on the compression damage of concrete: (a) No buffer layer; (b) 0.1 m buffer layer
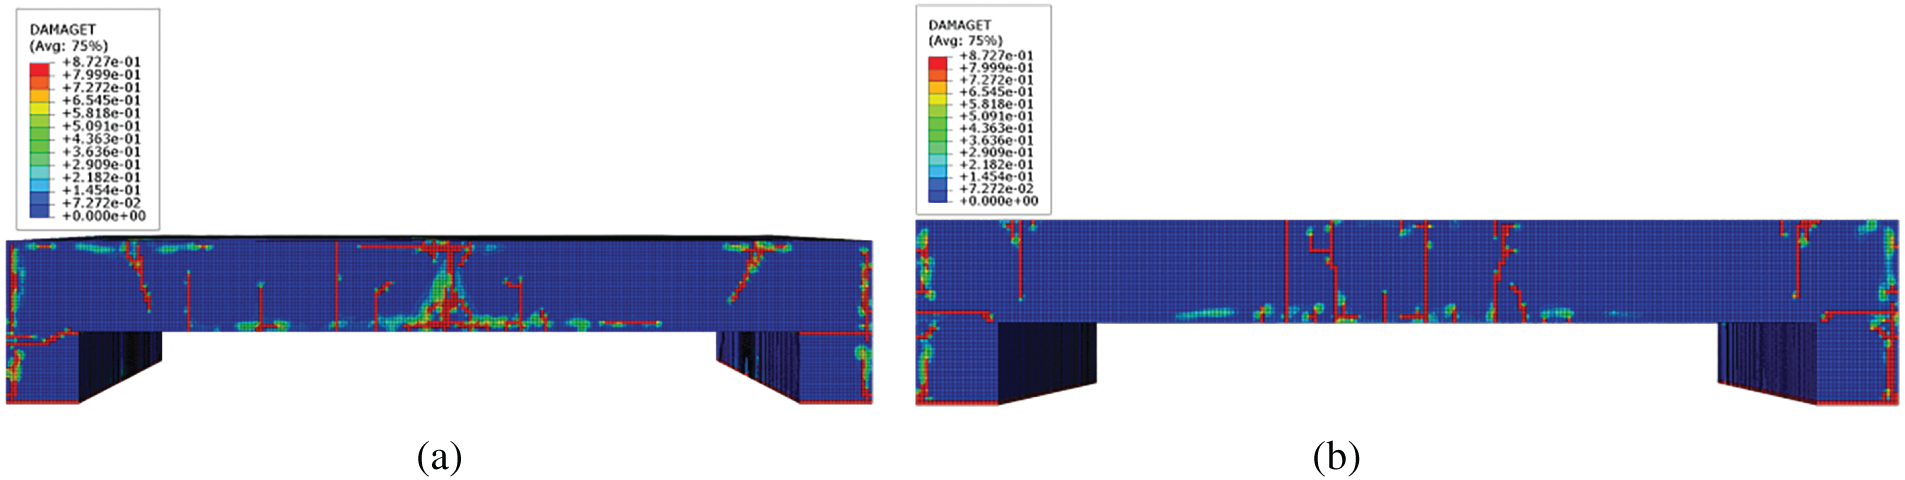
Figure 20: Effect of the presence of a buffer layer on the tensile damage of concrete: (a) No buffer layer; (b) 0.1 m buffer layer
The tensile damage in the unprotected slab is substantially more severe than in the protected configuration. Several transverse cracks develop along the side of the unprotected slab, while the protected slab displays only localized tensile cracking. Overall, the damage level in buffer-layer-protected reinforced concrete slabs is markedly lower than in unprotected slabs.
These findings demonstrate that incorporating a buffer layer in practical engineering applications is scientifically justified and practically effective for mitigating structural damage under impact loading conditions. The dramatic reduction in both compressive and tensile damage confirms the buffer layer’s crucial role in preserving structural integrity by distributing impact forces and reducing stress concentrations.
The compressive and tensile damage patterns on the back side of the reinforced concrete slabs, with and without buffer layer protection, are presented in Figs. 21 and 22, respectively. The results demonstrate that compressive damage remains consistently less severe than tensile damage across both configurations. The unprotected slab (without buffer layer) exhibits a relatively extensive area of compressive damage on its back side, characterized by radially propagating cracks. In contrast, the slab protected with a buffer layer shows no significant compressive damage.
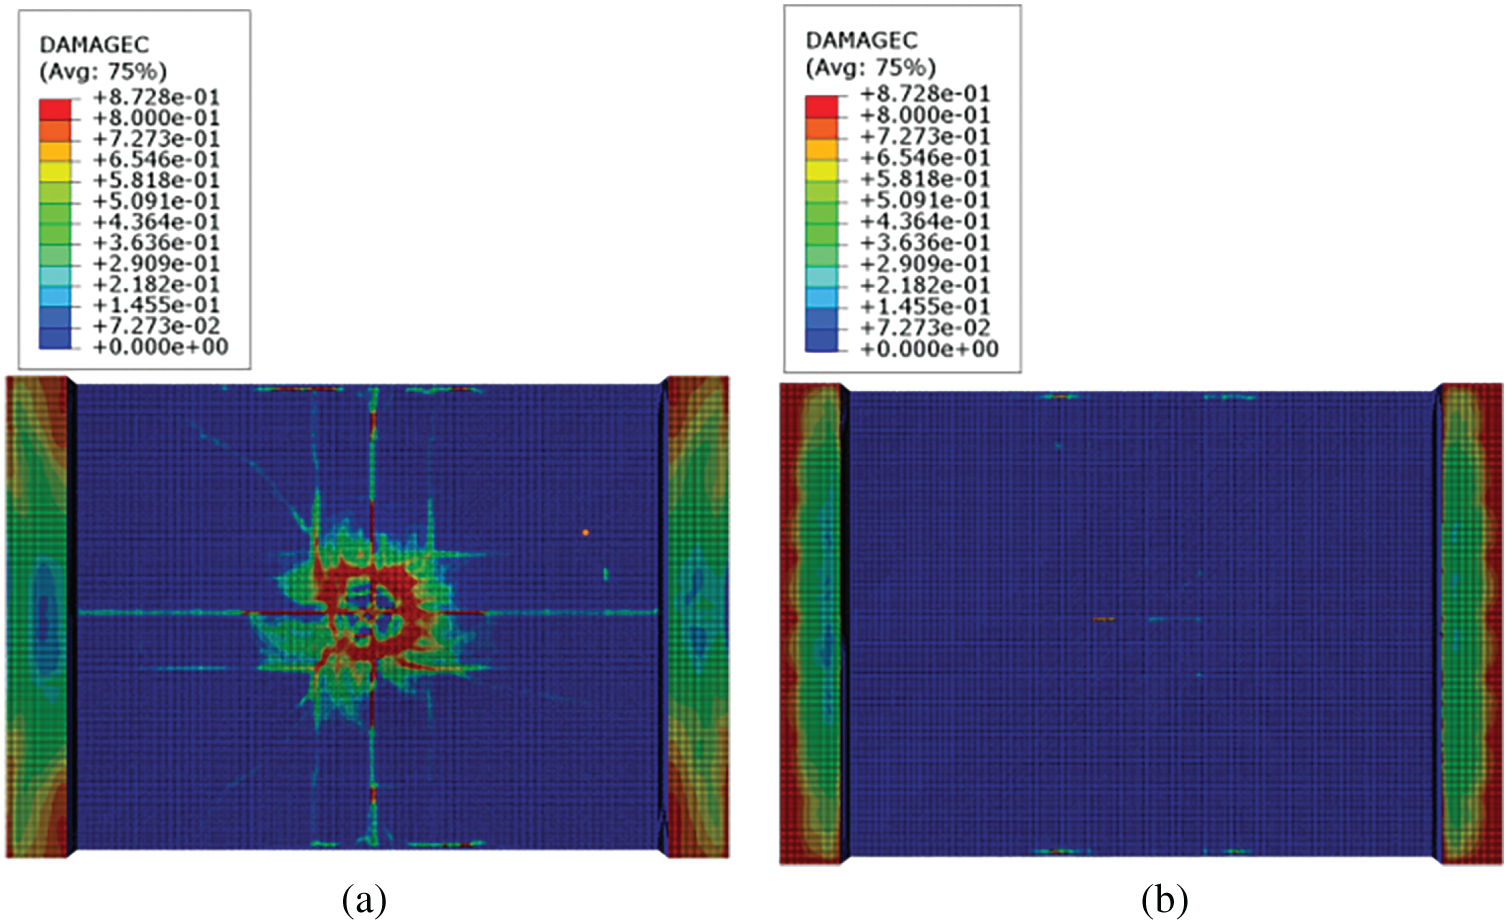
Figure 21: Effect of the presence or absence of the buffer layer on the compression damage of the back side of the concrete slab: (a) No buffer layer; (b) 0.1 m buffer layer
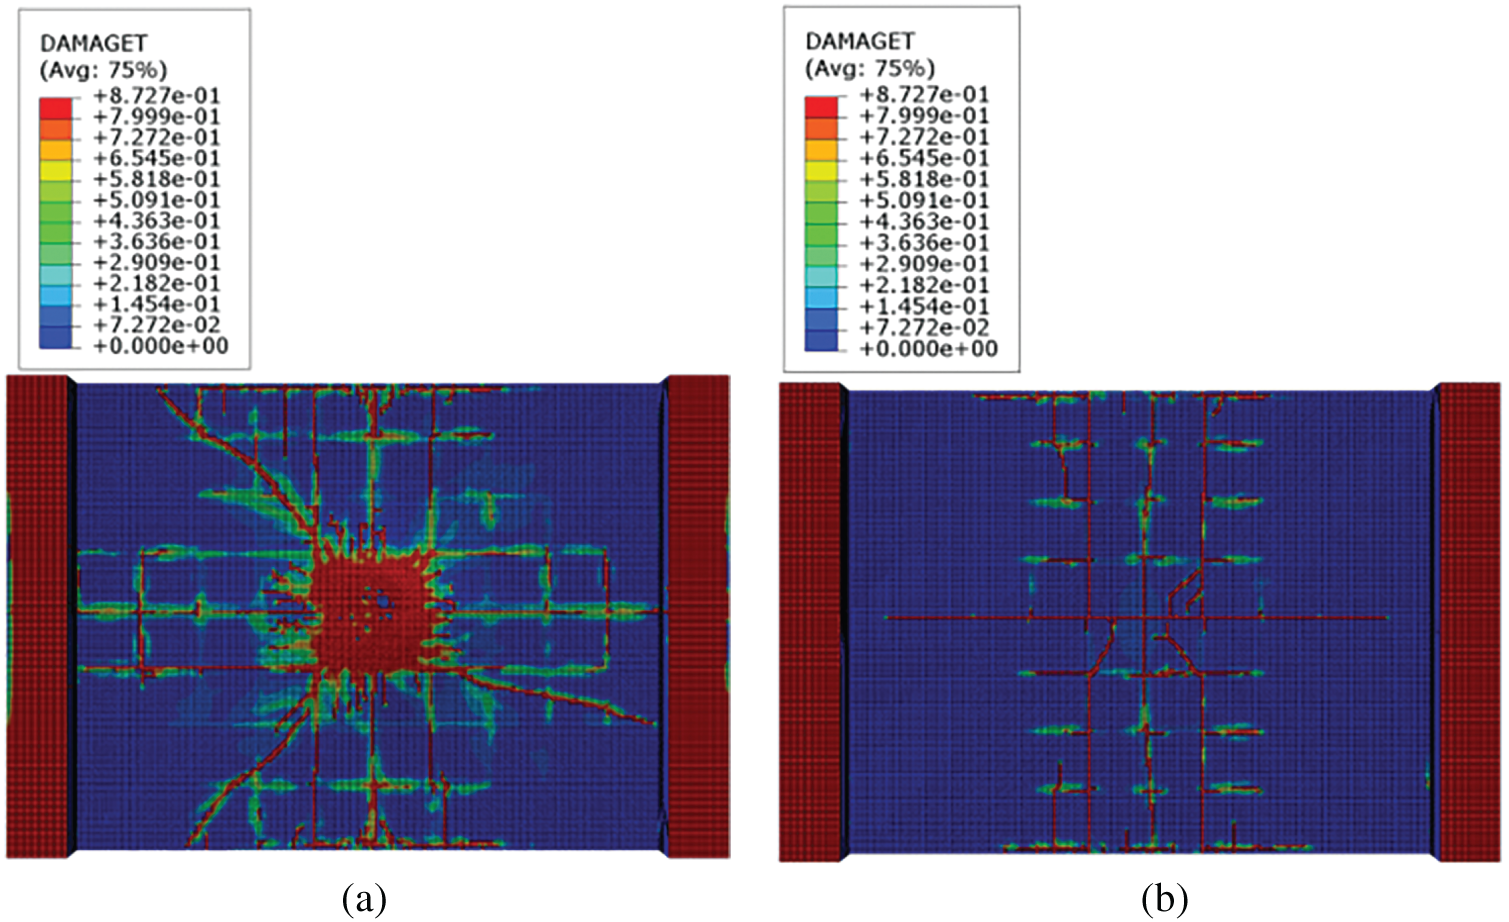
Figure 22: Effect of the presence or absence of the buffer layer on tensile damage to the dorsal side of the concrete slab: (a) No buffer layer; (b) 0.1 m buffer layer
The difference in tensile damage is even more pronounced. The unprotected slab displays large-area tensile damage across its back surface, while the protected configuration avoids such extensive failure, presenting only minimal cracking with few horizontal and vertical fissures. These observations collectively confirm that the structural damage in buffer-layer-protected reinforced concrete slabs is substantially less severe than in unprotected slabs. The buffer layer effectively mitigates both compressive and tensile damage mechanisms, thereby preserving structural integrity under impact conditions.
This study achieves a multi-scale coupled simulation of the entire rockfall process and its interaction with protective structures by integrating RocPro3D 3D trajectory modeling and ABAQUS finite element analysis, bridging a critical gap in the joint quantitative analysis of trajectory prediction and structural dynamic response. Unlike previous studies that often focused on isolated factors, such as rock shape or cushion material [46,50], this work systematically reveals, for the first time, the synergistic effect between rockfall interface morphology (e.g., spherical, cubic, columnar) and cushion layer performance. It establishes quantitative relationships between morphological parameters and dynamic response indicators (e.g., impact force, penetration depth, contact area), providing a theoretical basis for the optimized design of protective structures.
Regarding impact loading, in contrast to the common design assumption based on idealized spherical rockfalls [54], this study demonstrates that irregular shapes (e.g., cubes) significantly amplify the peak impact force. This finding challenges the applicability of simplified rock morphologies in traditional design, suggesting that current standards may underestimate the actual risk in complex terrains dominated by angular debris.
In terms of cushioning efficiency, by comparing the dynamic responses of systems with and without a cushion layer [55,56], this research clarifies the core role of the cushion layer in energy absorption and stress dispersion. Its performance advantage is manifested not only in the reduction of impact force but also in the effective mitigation of damage to concrete structures. This complements prior studies focusing solely on the material’s energy dissipation characteristics and underscores the necessity of integrated structure-material design. Furthermore, the proposed correlation between cushion layer thickness and rockfall kinetic energy offers a novel perspective for classifying protection levels in medium-risk slopes, moving beyond empirical or single-scenario based recommendations.
In summary, by coupling site-specific data with multi-scale simulations, this study transcends the limitations of traditional single-factor analyses and advances rockfall protection towards a more quantitative and precise decision-making framework, shifting away from empirically driven design practices.
Moreover, The findings of this study on reinforced concrete protective structures are consistent with previous research on steel protective structures regarding the influence of impactor morphology on structural response [57]. Both studies indicate that the geometric shape of the impactor (e.g., cubic, spherical, etc.) significantly affects impact force, energy transfer, and structural damage patterns. Despite the differences in protective structure materials (reinforced concrete vs. steel), the influence of impactor morphology on localized stress concentration, energy absorption, and failure mechanisms follows similar trends. In particular, both emphasize that non-spherical, sharp-shaped falling rocks are more likely to cause localized damage. This suggests that, regardless of the material of the protective structure, the morphology of falling rocks is a critical factor that cannot be overlooked in design. The conclusions of the two studies complement each other, jointly underscoring the importance of morphological parameters in protective engineering.
This study investigates the dynamic response of protective structures under rockfall impact using the Lake Mountain No. 1 hazardous rock area in a county of Sichuan Province as a typical case. Through field surveys supplemented by RocPro3D trajectory simulation and ABAQUS finite element analysis, the dynamic behavior of the protective structures was examined. During modeling, rockfall size was uniformly set at 1.5 m, with shapes simplified into three typical geometries: sphere, cube, and cylinder. While this simplification facilitates numerical analysis, it inevitably reduces the natural variability of rockfall size and shape observed in real scenarios. Furthermore, the conclusions are derived from specific geological environments and slope geometries. Therefore, caution is warranted when directly extrapolating results to other areas with differing rock properties, slope conditions (e.g., gradient, height, microtopography), rockfall size distributions, or geological settings (e.g., lithology, joint development).
Nevertheless, the methodological framework and core principles established in this study retain significant value and broad applicability: First, the integrated approach combining RocPro3D probabilistic trajectory analysis with ABAQUS detailed impact simulation is applicable for rockfall hazard assessment and protective structure design under various slope conditions; Second, investigations into how rockfall shape (e.g., spherical, cubic, cylindrical) influences dynamic response parameters (e.g., impact force, penetration depth, contact area, and concrete strain) highlight the fundamental role of contact geometry as a physical mechanism. For instance, results clearly demonstrate that angular blocks (cubic) generate higher impact forces than spherical ones, while spheres cause deeper penetration. This trend aligns with existing literature, indicating that block morphology effects are universal rather than site-specific. Furthermore, the study found that buffer layers significantly reduce impact force (in this case, a 0.1-m gravel layer reduced peak impact force by up to 55%) and alter structural damage patterns, operating through universal energy dissipation mechanisms such as friction and plastic deformation of granular materials. However, it is important to note that the optimal buffer layer thickness and material parameters must be calibrated based on the specific site’s rockfall energy levels and structural requirements.
Therefore, the primary contribution of this study lies in elucidating the intrinsic relationships and relative importance of various influencing factors—particularly the often oversimplified rockfall morphology—on the behavior of protective structures, while also providing an expandable analytical framework for future research. For engineering practice applications, it is recommended to use the qualitative trends and parameter influences revealed in this paper as a reference basis, while ensuring precise calibration and validation through detailed field data (including geological surveys, rockfall size distribution, and topographic features). Subsequent research will focus on incorporating more slope types, rock mass conditions, and more realistic rockfall shapes and size distributions to enhance the universality and practical applicability of the conclusions.
This study investigated the dynamic response of rockfall impact protection structures through integrated field surveys, RocPro3D trajectory simulations, and ABAQUS finite element modeling. The main conclusions are summarized below:
1. The rockfalls impacting the protective structures exhibit maximum velocities of 20–30 m/sec and bounce heights of 5–8 m. Accumulation occurs predominantly at the slope toe due to the low restitution coefficients of the soil structures, necessitating targeted protective measures.
2. Rock morphology significantly influences dynamic response. Cubic rock blocks generated peak impact forces 61% higher than spherical ones, with cylindrical blocks yielding intermediate values. Conversely, spherical blocks resulted in the greatest penetration depth and longest impact duration. Therefore, the common assumption of spherical rockfalls is inadequate for slope protection design in areas dominated by angular debris.
3. The evolution of impact depth consistently followed a three-phase elastoplastic pattern: initial growth, rebound, and stabilization. This behavior is well-captured by the Drucker-Prager constitutive model for granular media, validating the employed numerical framework for simulating geomaterial deformation.
4. The use of a 0.1-m gravel-soil buffer layer on reinforced concrete slabs reduced peak impact forces by 55% and effectively prevented structural damage compared to unprotected slabs.
5. The presence of a buffer layer fundamentally alters the structural response from a brittle, high-force impact to a more ductile and manageable energy dissipation process, as evidenced by the drastic reduction in concrete damage and permanent deformation.
Practical Engineering Recommendations:
Based on the parametric study within the scope of this simulation, the following design guidance is proposed:
(1) For critical protection areas (where even minimal damage is unacceptable), the use of a buffer layer is essential. A minimum thickness of 0.4 m of gravel-soil mixture is recommended to effectively dissipate energy and protect the concrete structure.
(2) The shape of the dominant rockfall on a slope must be considered. Assuming a spherical shape for design may lead to non-conservative estimates of the impact force (underestimating by up to 61% for cubic rocks). Site surveys should include rockfall morphology assessment.
Future Research Directions:
To validate and extend these numerical findings, future work should focus on:
(1) Experimental validation through full-scale or reduced-scale impact tests to corroborate the simulated force-time histories and damage patterns.
(2) Field monitoring of installed protection structures to gather long-term performance data under actual rockfall events.
(3) Investigation of a wider range of buffer layer materials (e.g., polymer foams, recycled tire chips) and their cost-effectiveness.
This study establishes a coupled simulation framework that links rockfall trajectory, interface morphology, and structural response, providing a valuable tool for the optimized design of rockfall protection structures.
Acknowledgement: Let us first express our utmost gratitude to Prof. Su Tian and Prof. Mei Xuefeng for their foundational support and guidance in the composition and refinement of this work. Your financial backing and insightful critiques were instrumental throughout this endeavor. Joined by all co-authors, we extend our heartfelt thanks for their collaborative spirit and valuable contributions.
Funding Statement: This work was supported by the China Postdoctoral Science Foundation (2022M723687); the Doctoral Science and Technology Startup Foundation of Shandong University of Technology (420048); National College Student Innovation and Entrepreneurship Tainning Program (202410433053); National College Student Innovation and Entrepreneurship Tainning Program (202410433004); Provincial College Student Innovation and Entrepreneurship Tainning Program (S202410433084); the Natural Science Foundation of Shandong Province, China (ZR2025MS802).
Author Contributions: Huaiqin Liu: Conceptualization, Methodology, Writing—Original Draft. Meng Li: Investigation, Data Curation, Validation. Jianwen Shao, Weishen Zhang, Qifan Yang and Yutong Li: Formal Analysis. Tian Su and Xuefeng Mei: writing—review and editing. All authors reviewed the results and approved the final version of the manuscript.
Availability of Data and Materials: The data and materials in the current study are available from the corresponding author on a reasonable request.
Ethics Approval: Not applicable.
Conflicts of Interest: The authors declare no conflicts of interest to report regarding the present study.
References
1. Mei XF, Hu XW, Luo G, Du YJ, Ma HS, Wu JL, et al. A study on the coefficient of restitution and peak impact of rockfall based on the elastic-plastic theory. J Vib Shock. 2019;38(8):14–20. (In Chinese). doi:10.13465/j.cnki.jvs.2019.08.003. [Google Scholar] [CrossRef]
2. Chen XY, Liu HQ, Yang JH, Ai QK, Zhong B, Cai GJ. Analysis of stability and kinematics of the dangerous rock mass in Zhangjiagou, Baoxing, Sichuan Province. Chin J Geol Hazard Control. 2024;35(2):81–9. (In Chinese). doi:10.16031/j.cnki.issn.1003-8035.202209043. [Google Scholar] [CrossRef]
3. Yin YH, Han X, Deng HY, Pan Y, Wu SH. Framework of risk reduction measurements for earthquake-landslide-debris flow disaster chain in Southwest China. J Catastrophol. 2021;36(2):77–84. doi:10.3969/jissn.1000-811X.2021.02.015. [Google Scholar] [CrossRef]
4. Luo G, Cheng QG, Shen WG, Ling SX, Zhang XY, Zhou P, et al. Research status and development trend of the high-altitude extremely-energetic rockfalls. Earth Sci. 2022;47(3):913–34. (In Chinese). doi:10.3799/dqkx.2021.133. [Google Scholar] [CrossRef]
5. Chigira M. September 2005 rain-induced catastrophic rockslides on slopes affected by deep-seated gravitational deformations, Kyushu, southern Japan. Eng Geol. 2009;108(1–2):1–15. doi:10.1016/j.enggeo.2009.03.005. [Google Scholar] [CrossRef]
6. Wu P, Zhang Q, Li S, Wang D, Zhang X, Li W, et al. A numerical strain-softening solution of a circular opening in nonlinear yield rock masses. Tunn Undergr Space Technol. 2024;153:106035. doi:10.1016/j.tust.2024.106035. [Google Scholar] [CrossRef]
7. Wu Y, Wang K, Zhang L, Zhang Q, Li S, Li L, et al. Sand-layer collapse treatment: an engineering example from Qingdao Metro subway tunnel. J Clean Prod. 2018;197:19–24. doi:10.1016/j.jclepro.2018.05.260. [Google Scholar] [CrossRef]
8. Dufresne A, Dunning SA. Process dependence of grain size distributions in rock avalanche deposits. Landslides. 2017;14(5):1555–63. doi:10.1007/s10346-017-0806-y. [Google Scholar] [CrossRef]
9. Huo T, Ren H, Zhang X, Cai W, Feng W, Zhou N, et al. China’s energy consumption in the building sector: a statistical yearbook-energy balance sheet based splitting method. J Clean Prod. 2018;185:665–79. doi:10.1016/j.jclepro.2018.02.283. [Google Scholar] [CrossRef]
10. Liu G, Zhong Z, Ma K, Wang S, Cai Y, Li X, et al. Field experimental verifications of 3D DDA and its applications to kinematic evolutions of rockfalls. Int J Rock Mech Min Sci. 2024;175:105687. doi:10.1016/j.ijrmms.2024.105687. [Google Scholar] [CrossRef]
11. Souza B, Benoît J. Rockfall motion using a smart rock sensor. Can Geotech J. 2023;61(4):802–19. doi:10.1139/cgj-2022-0599. [Google Scholar] [CrossRef]
12. Yang YX, Zhang YG, Teng ZM, Liu P, Qiao L. Study on movement characteristics and numerical simulation of high-altitude rockfall in babao mountain in China. Front Earth Sci. 2023;11:1281364. doi:10.3389/feart.2023.1281364. [Google Scholar] [CrossRef]
13. Nasery MM, Çelebi E, Ağcakoca E, İstegün B, Yaman Z. Development of fully controlled rock crushing method and its vibration impact during rockfall risk reduction at Assos ancient port: experimental and field studies. Case Stud Constr Mater. 2024;21:e03882. doi:10.1016/j.cscm.2024.e03882. [Google Scholar] [CrossRef]
14. Akin M, Dinçer İ, Orhan A, Varol OO. A comparative study on rockfall block motion characteristics using 3-D and 2-D rockfall simulations: a case study from Cappadocia (Mazı, Türkiye). Nat Hazards. 2024;121:2265–91. doi:10.1007/s11069-024-06905-6. [Google Scholar] [CrossRef]
15. Sarro R, Mateos RM, García-Moreno I, Herrera G, Reichenbach P, Laín L, et al. The Son Poc rockfall (Mallorca, Spain) on the 6th of March 2013: 3D simulation. Landslides. 2014;11:493–503. doi:10.1007/s10346-014-0487-8. [Google Scholar] [CrossRef]
16. Sasiharan N, Muhunthan B, Badger TC, Shu S, Carradine DM. Numerical analysis of the performance of wire mesh and cable net rockfall protection systems. Eng Geol. 2006;88(1–2):121–32. doi:10.1016/j.enggeo.2006.09.005. [Google Scholar] [CrossRef]
17. Gentilini C, Gottardi G, Govoni L, Mentani A, Ubertini F. Design of falling rock protection barriers using numerical models. Eng Struct. 2013;50:96–106. doi:10.1016/j.engstruct.2012.07.008. [Google Scholar] [CrossRef]
18. Delhomme F, Mommessin M, Mougin JP, Perrotin P. Behavior of a structurally dissipating rock-shed: experimental analysis and study of punching effects. Int J Solids Struct. 2005;42(14):4204–19. doi:10.1016/j.ijsolstr.2004.12.008. [Google Scholar] [CrossRef]
19. Bhatti AQ, Khatoon S, Mehmood A, Dastgir A, Kishi N. Numerical study for impact resistant design of full scale arch type reinforced concrete structures under falling weight impact test. J Vib Control. 2012;18(9):1275–83. doi:10.1177/1077546311419176. [Google Scholar] [CrossRef]
20. Kanno H, Moriguchi S, Tsuda Y, Yoshida I, Iwanaga S, Terada K. A method for rockfall risk quantification and optimal arrangement of protection structures along a road. Eng Geol. 2023;314:107004. doi:10.1016/j.enggeo.2023.107004. [Google Scholar] [CrossRef]
21. Tong JH, Yang XY, Guo Q, Zhang Y, Tian YD. Noncontact full-field spatial-temporal deformation measurement of rockfall prevention structure with deep learning-based optic flow algorithm under complex environments: full-scale experiments and field tests. Mech Syst Signal Process. 2025;234:112820. doi:10.1016/j.ymssp.2025.112820. [Google Scholar] [CrossRef]
22. Shadabfar M, Mahsuli M, Zhang Y, Xue YD, Huang HW. Probabilistic data-driven framework for performance assessment of retaining walls against rockfalls. Probabilistic Eng Mech. 2022;70:103339. doi:10.1016/j.probengmech.2022.103339. [Google Scholar] [CrossRef]
23. Prisco CD, Vecchiotti M. Design charts for evaluating impact forces on dissipative granular soil cushions. J Geotech Geoenvironmental Eng. 2010;136(11):1529–41. doi:10.1061/(ASCE)GT.1943-5606.0000363. [Google Scholar] [CrossRef]
24. Wu JL, Ma GT, Zhou ZH, Mei XF, Hu XW. Experimental investigation of impact response of RC slabs with a sandy soil cushion layer. Adv Civ Eng. 2021;2021(1):1562158. doi:10.1155/2021/1562158. [Google Scholar] [CrossRef]
25. Ouyang C, Liu Y, Wang DP, He SM. Dynamic analysis of rockfall impacts on geogrid reinforced soil and EPS absorption cushions. KSCE J Civ Eng. 2019;23(1):37–45. doi:10.1007/s12205-018-0704-4. [Google Scholar] [CrossRef]
26. Kawahara S, Muro T. Effects of dry density and thickness of sandy soil on impact response due to rockfall. J Terramech. 2006;43(3):329–40. doi:10.1016/j.jterra.2005.05.009. [Google Scholar] [CrossRef]
27. Meree H, Wang DP, Yan SX, Li MJ, Lu S, Lovati M, et al. Dynamic response of rock sheds to successive rockfall impacts using lightweight expanded clay aggregate (LECA) cushions: an experimental and numerical study. Int J Impact Eng. 2024;193:105047. doi:10.1016/j.ijimpeng.2024.105043. [Google Scholar] [CrossRef]
28. Umili G, Taboni B, Ferrero AM. Influence of uncertainties: a focus on block volume and shape assessment for rockfall analysis. J Rock Mech Geotech Eng. 2023;15(9):2250–63. doi:10.1016/j.jrmge.2023.03.016. [Google Scholar] [CrossRef]
29. Breugnot A, Lambert S, Villard P, Gotteland G. A discrete/continuous coupled approach for modeling impacts on cellular geostructures. Rock Mech Rock Eng. 2016;49(5):1831–48. doi:10.1007/s00603-015-0886-8. [Google Scholar] [CrossRef]
30. Lu L, Lin HX, Wang ZJ, Xiao L, Ma SW, Arai K, et al. Experimental and numerical investigations of reinforced soil wall subjected to impact loading. Rock Mech Rock Eng. 2021;54:5651–66. doi:10.1007/s00603-021-02579-9. [Google Scholar] [CrossRef]
31. Nagendran SK, Ismain MAM. Analysis of rockfall hazards based on the effect of rock size and shape. Int J Civ Eng. 2019;17(12):1919–29. doi:10.1007/s40999-019-00418-1. [Google Scholar] [CrossRef]
32. Cui SH, Pei XJ, Huang RQ. Rolling motion behavior of rockfall on gentle slope: an experimental approach. J Mt Sci. 2017;14(8):1550–62. doi:10.1007/s11629-016-4144-7. [Google Scholar] [CrossRef]
33. Okura Y, Kitahara H, Sammori T, Kawanami A. The effects of rockfall volume on runout distance. Eng Geol. 2000;58(2):109–24. doi:10.1016/S0013-7952(00)00049-1. [Google Scholar] [CrossRef]
34. Hu J, Li SC, Shi SS, Li LP, Zhang Q, Liu HL, et al. Experimental study on parameters affecting the runout range of rockfall. Adv Civ Eng. 2018;2018(1):4739092. doi:10.1155/2018/4739092. [Google Scholar] [CrossRef]
35. Caviezel A, Ringenbach A, Demmel SE, Dinneen CE, Krebs N, Bühler Y, et al. The relevance of rock shape over mass—implications for rockfall hazard assessments. Nat Commun. 2021;12(1):5546. doi:10.1038/s41467-021-25794-y. [Google Scholar] [PubMed] [CrossRef]
36. Yan P, Zhang JH, Fang Q, Zhang YD. Numerical simulation of the effects of falling rock’s shape and impact pose on impact force and response of RC slabs. Constr Build Mater. 2018;160:497–504. doi:10.1016/j.conbuildmat.2017.11.087. [Google Scholar] [CrossRef]
37. Xue JY, Cao C, Yan JH, Ji YP, Chen JP. Coupled DEM-FDM analyses of the effects of falling rock’s shape and impact angle on response of granular cushion and rock shed. J Rock Mech Geotech Eng. 2024;16(8):3353–64. doi:10.1016/j.jrmge.2023.12.028. [Google Scholar] [CrossRef]
38. Wang Y, Xu M, Yang C, Lu M, Meng J, Wang Z, et al. Effects of elastoplastic strengthening of gravel soil on rockfall impact force and penetration depth. Int J Impact Eng. 2020;136:103411. doi:10.1016/j.ijimpeng.2019.103411. [Google Scholar] [CrossRef]
39. Xie MJ, Wang YF, Zhao JL, Pei XJ, Zhang TR. Prediction of pipeline fatigue crack propagation under rockfall impact based on multilayer perceptron. Reliab Eng Syst Saf. 2024;242:109772. doi:10.1016/j.ress.2023.109772. [Google Scholar] [CrossRef]
40. Qi ZY, Liu AB, Xue B, Wang GH, Xu B, Tang XD, et al. Damage characteristics and dynamic responses of high arch dams under rockfall impact loads. Structures. 2024;62:106308. doi:10.1016/j.istruc.2024.106308. [Google Scholar] [CrossRef]
41. Yuen TYP, Weng MC, Fu YY, Lu GT, Shiu WJ, Lu CA, et al. Assessing the impact of rockfall on a bridge by using hybrid DEM/FEM analysis: a case study in Central Taiwan. Eng Geol. 2023;314:107000. doi:10.1016/j.enggeo.2023.107000. [Google Scholar] [CrossRef]
42. Yan JH, Chen JP, Tan C, Zhang YS, Liu YQ, Zhao XH, et al. Rockfall source areas identification at local scale by integrating discontinuity-based threshold slope angle and rockfall trajectory analyses. Eng Geol. 2023;313:106993. doi:10.1016/j.enggeo.2023.106993. [Google Scholar] [CrossRef]
43. Zhang W, Zhao X, Pan X, Wei M, Yuan JH, Chen JP. Characterization of high and steep slopes and 3D rockfall statistical kinematic analysis for Kangyuqu area. China Eng Geol. 2022;308:106807. doi:10.1016/j.enggeo.2022.106807. [Google Scholar] [CrossRef]
44. Nasery MM, Cosgun SI, Temel BA. Multi-scenario analysis of rockfall hazard for a historical vaulted masonry building in Sumela Monastery. Int J Archit Herit. 2023;17(11):1876–904. doi:10.1080/15583058.2022.2091967. [Google Scholar] [CrossRef]
45. Mei XF. Dynamic response of pile-slab rock-blocking wall with buffer layer under rockfall impact load [dissertation]. Chengdu, China: Southwest Jiaotong University; 2020. (In Chinese). 10.27414/d.cnki.gxnju.2020.002500. [Google Scholar] [CrossRef]
46. Meree H, Wang DP, Yan SX, Lambert S, Chen YH, Dong Q. Optimization and performance analysis of novel waste EPS bead-sand composite cushions for rockfall mitigation: an integrated experimental and numerical study. Geotext Geomembr. 2025;53(6):1314–31. doi:10.1016/j.geotexmem.2025.06.007. [Google Scholar] [CrossRef]
47. Krengel D, Shiyake R, Kikumoto M. Effect of particle shape and initial orientation on the kinematics and runout behavior of rockfalls. Landslides. 2024;21(8):1797–809. doi:10.1007/s10346-024-02256-2. [Google Scholar] [CrossRef]
48. Yan P, Zhang JH, Kong XZ, Fang Q. Numerical simulation of rockfall trajectory with consideration of arbitrary shapes of falling rocks and terrain. Comput Geotech. 2020;122:103511. doi:10.1016/j.compgeo.2020.103511. [Google Scholar] [CrossRef]
49. GB 50010-2010. Code for design of concrete structures. Beijing, China: AQSIQ; 2010. (In Chinese). [Google Scholar]
50. Li RW, Meng SB, Chen Y, Wu H, Zhou YD. Influence of sand cushion on rockfall-impact resistance of RC sheds. Eng Struct. 2025;331:119992. doi:10.1016/j.engstruct.2025.119992. [Google Scholar] [CrossRef]
51. Hu HQ, Huang Y, Bao YJ, Wang WW. Experimental study on the dynamic behavior of pile-anchor structures under impact loading of debris flow and rockfall. Soil Dyn Earthq Eng. 2024;184:108839. doi:10.1016/j.soildyn.2024.108839. [Google Scholar] [CrossRef]
52. Gupta R, Bourrier F, Lambert S. Bayesian inference based inverse analysis of the impact response of a rockfall protection structure: application towards warning and survey. Eng Struct. 2024;321:118800. doi:10.1016/j.engstruct.2024.118800. [Google Scholar] [CrossRef]
53. Shen WG, Zhao T, Dai F. Influence of particle size on the buffering efficiency of soil cushion layer against rockfall impact. Nat Hazards. 2021;108:1469–88. doi:10.1007/s11069-021-04741-6. [Google Scholar] [CrossRef]
54. Zhang YL, Zhang J, Liu ZB, Liu K, Zhu S, Jia Y. Numerical and experimental studies on the motion and deposition of collapsing rock clusters: effect of rock particle sphericity. Powder Technol. 2024;447:120213. doi:10.1016/j.powtec.2024.120213. [Google Scholar] [CrossRef]
55. Shen WG, Zhao T, Dai F, Jiang MJ, Zhou GD. DEM analyses of rock block shape effect on the response of rockfall impact against a soil buffering layer. Eng Geol. 2019;249:60–70. doi:10.1016/j.enggeo.2018.12.011. [Google Scholar] [CrossRef]
56. Zhao P, Liu J, Zhang Y. Experimental and numerical investigations on buffer performance of geofoam subjected by the impact of falling rocks with respect to different shapes. Geotext Geomembr. 2023;51(4):108–24. doi:10.1016/j.geotexmem.2023.04.006. [Google Scholar] [CrossRef]
57. Cosgun SI, Nasery MM. Performance of steel protective structure for historical masonry aqueducts against rockfall: numerical and field studies. Case Stud Constr Mater. 2024;21:e03477. doi:10.1016/j.cscm.2024.e03477. [Google Scholar] [CrossRef]
Cite This Article
 Copyright © 2025 The Author(s). Published by Tech Science Press.
This work is licensed under a Creative Commons Attribution 4.0 International License , which permits unrestricted use, distribution, and reproduction in any medium, provided the original work is properly cited.
 Downloads
 Citation Tools