
 Submit a Paper
 Propose a Special lssue
 Open Access
ARTICLE

Application of Wireless Sensor Technology in Processing Random Signals for Urban Bridge Inspections
1 Department of State Management, Thu Dau Mot University, No. 06 Tran Van On, Phu Hoa Ward, Thu Dau Mot City, 82000, Binh Duong Province, Vietnam
2 Faculty of Engineering and Technology, Thu Dau Mot University, No. 06 Tran Van On, Phu Hoa Ward, Thu Dau Mot City, 82000, Binh Duong Province, Vietnam
3 Institute of Interdisciplinary Sciences, Nguyen Tat Thanh University, No. 300A Nguyen Tat Thanh Street, Ward 13, District 4, Ho Chi Minh City, 700000, Vietnam
4 NTT Hi-Tech Institute, Nguyen Tat Thanh University, Ho Chi Minh City, 700000, Vietnam
* Corresponding Author: Thanh Q. Nguyen. Email:
(This article belongs to the Special Issue: Advances in Intelligent Operation and Maintenance Applications for Bridge Structures)
Structural Durability & Health Monitoring 2026, 20(2), 6 https://doi.org/10.32604/sdhm.2025.070202
Received 10 July 2025; Accepted 10 November 2025; Issue published 31 March 2026
 View Full Text
 Download PDF
Abstract
This study introduces a method for processing various types of random real-world signals from bridges in both experimental models and real-world scenarios using a wireless sensor system. By analyzing and processing signals collected during actual traffic on bridges, the study identifies and provides parameters that meet current quality inspection requirements to ensure the safety of bridge users. The parameters investigated in this study include deformation, natural frequency, amplitude, impact factor, and damping coefficient. Research has determined and highlighted key parameters to assess the quality of bridge spans to meet quality inspection standards. Using actual traffic vibration signals provides accurate and useful information that supports the government in conducting regular inspections. Furthermore, this study reduces inspection costs for regulatory agencies by significantly reducing costs compared to traditional methods, offering economic benefits. In general, this research not only introduces a new approach to vibration signal processing, but also brings practical benefits to bridge infrastructure management and inspection.Keywords
Bridges are indispensable nodes of transportation networks, and their safety is based on understanding how they actually behave under everyday traffic rather than only under controlled tests or sporadic visual checks [1–3]. Conventional routines, visual surveys, photographic documentation, and occasional proof loads, are practical and low cost, but mainly reveal surface symptoms or quasistatic responses and seldom resolve the dynamic state of the structure [4–6]. In particular, key system descriptors, such as natural frequency, damping ratio, in-service deflection, dynamic amplification (impact) coefficient, and vibration amplitude, are precisely the quantities that encode stiffness, energy dissipation, and serviceability, but they are rarely estimated jointly, repeatedly, and in situ during normal operations [7,8].
The last decade has seen significant advances in coverage (unmanned aerial vehicles (UAV)-based imaging, computer vision), data management (digital twins, cloud logging) and analytics (signal processing and Artificial Intelligence (AI)-enabled interpretation) [9–11]. However, most implementations either (i) enhance how we see the bridge without extracting physics-based dynamic parameters [12], or (ii) focus on a single indicator or lab-style excitations that do not reflect the variability of real traffic [13]. Permanent multisensor structural health monitoring (SHM) systems can recover dynamics but remain expensive to deploy and maintain at scale, with limited lifetime and coverage beyond flagship assets [9]. As a result, a practical, low-disruption pathway to convert routine traffic-induced vibrations into a complete parameter set usable for inspection and maintenance decisions is still lacking.
This paper addresses that gap by turning random, nonstationary traffic events into reliable estimates of multiple dynamic parameters without interrupting service. Methodologically, we leverage short-time Fourier transforms (STFT) to localize the modal energy around vehicle passages and enable output-only modal identification robust to transient and mixed excitations [6,14,15]. Field protocols emphasize practicality and repeatability: calibrated Linear Variable Displacement Transducer (LVDTs) and accelerometers are placed in the middle of critical girders to maximize signal-to-noise; time bases are synchronized and filtered; and load events are stratified by vehicle type and speed so that parameter estimates are comparable under operating conditions [16]. In this way, the workflow unifies time–frequency analysis, ambient/operational modal analysis, and event stratification into a single pipeline that can be deployed with wireless sensors and with minimal site disturbance [12,14].
The major contribution is a field-validated, end-to-end traffic-driven signal processing pipeline that (i) yields a comprehensive set of in-service parameters: deflection, natural frequency, damping ratio [17], dynamic amplification coefficient [2], and amplitude, rather than a single proxy [18]; (ii) demonstrates STFT-assisted output-only identification on urban bridges to obtain stable frequency and damping estimates from routine traffic; (iii) quantifies the divergence between static and dynamic deflections and the resulting impact factors under realistic service conditions through event stratification; and (iv) articulates how these indicators can be folded into inspection policy and resilience-oriented assessment as a lower cost, minimally intrusive alternative or complement to conventional SHM deployments. Collectively, the study advances SHM from ‘better images and more data’ toward actionable, physics-based parameters extracted under the exact conditions bridges are designed to endure.
Bridges and roads are a crucial part of transportation infrastructure, playing a key role in connecting regions and promoting socioeconomic development [7,19,20]. In various countries, bridge and road systems not only facilitate transportation, but also endure increasing and evolving traffic loads over time. Therefore, effective and accurate inspection and maintenance of bridge and road structures are essential.
– Direct observation method: This method can involve visual inspection with the naked eye or using observation devices such as cameras [21–23], binoculars [24], or drones [25,26]. It is performed manually when performing visual inspection of structures or with specialized equipment. This method [7] is qualitative and is used for daily, weekly, quarterly, or predefined cyclical inspections, depending on the importance of the bridge. During bridge patrols, the manuscript can detect anomalies and issue warnings to people and vehicles on the bridge. The advantages of this method are its simplicity [27], ease of implementation [28], and low initial investment cost [29]. However, it has several disadvantages, including the inability to detect internal structural damage and assess changes in material properties. Regardless of the level of technological advancement, this method is maintained by technical teams in all countries [16,30,31]. It allows for early detection and prevention of surface defects, eliminating the causes of aesthetic and functional degradation of the structure.
– Periodic inspection method: This method [32] includes inspection activities similar to the direct observation method and can determine the quality or assess the compliance of the structure with the required standards. It involves visual inspection of the current state of the structure [33], combined with analysis and evaluation using experimental data from the site [25,26], based on design requirements, technical regulations [4], and technical standards [29]. This periodic inspection method [34,35] will reveal some basic mechanical behaviors of the bridge. Recent advances in bridge inspection technologies have used unmanned aerial vehicles (UAV) and digital frameworks to improve efficiency and coverage. For example, Cano et al. [34] introduced a UAV-based methodology for inspecting linear infrastructure bridges using optical images and HD videos, allowing high-resolution, large-area assessments without disrupting traffic. Similarly, Talebi et al. [35] developed a digitally enhanced visual inspection framework for masonry bridges in the UK, integrating digital storage and visualization tools for long-term condition monitoring. Although both approaches significantly improve visual assessment capabilities, they focus primarily on surface-level defect detection and historical data management, without addressing the extraction of key dynamic parameters, such as natural frequency, damping ratio, impact coefficient, and deformation, from in-service vibration data. This gap underscores the need for methodologies, such as the one proposed in this study, that integrate real traffic-induced vibration analysis into bridge health monitoring frameworks. Although this method is intended to assess the actual working capacity of the bridge, its effectiveness is not very high.
– Continuous health monitoring method: For about 20 years, systems have emerged worldwide to continuously measure the parameters of structures under real traffic conditions. These systems [3,8] are typically called bridge “health monitoring” systems. In the broader context of structural health monitoring (SHM), Zinno et al. [3] provided a comprehensive review of emerging AI approaches and emerging technologies for bridge SHM, covering machine learning, deep learning, IoT-based sensing, UAV-assisted inspection and big data analytics. Their work highlighted the potential of AI to automate data interpretation and improve predictive maintenance. Similarly, Rizzo and Enshaeian [8] reviewed critical challenges in bridge health monitoring, including sensor selection, environmental effects, data standardization, and long-term reliability of the system. Although these studies outline cutting-edge analytical tools and identify practical limitations, they rely predominantly on controlled-condition or fixed-sensor datasets. Neither fully addresses the direct extraction of dynamic parameters, such as natural frequency, damping ratio, deformation, and impact coefficient, from traffic-induced vibration signals, which is the focus of the present study. They are widely used in developed countries such as the United States, Canada, EU countries, and notably South Korea and Japan, which are Asian countries with extensive river and sea networks [12,36]. Recent advances in non-contact and indirect SHM methods have further diversified bridge monitoring strategies. Marchewka et al. [36] proposed a computer vision-based framework for monitoring steel bridges, employing high resolution cameras and image processing algorithms to track surface deformations and detect cracks. Although effective in geometric surface assessment, this approach is sensitive to environmental conditions and does not yield direct dynamic parameters. In a complementary direction, Shokravi et al. [12] reviewed vehicle-assisted bridge monitoring techniques, in which instrumented or non-instrumented vehicles act as both excitation sources and data acquisition platforms. Although such methods facilitate cost-effective and traffic-friendly monitoring, they generally focus on global damage detection or basic modal frequency estimation, without integrating full parameter extraction, such as deformation, impact coefficient, and damping ratio, from actual traffic-induced vibrations. Addressing this limitation, our study develops a methodology capable of extracting a complete set of dynamic parameters from in-service traffic loads, thus contributing to more comprehensive SHM and resilience assessment. In these systems, the behavior under traffic is observed through vibrations with frequencies that depend on traffic conditions [37]. Although it is not possible to determine the exact load value when vehicles are in transit, capturing the real vibration parameters of the bridge allows understanding of the behavior of the entire system and, subsequently, its “health” status. Data [38] used for the analysis can come from high-accuracy specialized electronic devices that are constantly being developed. These systems are more advanced than the older methods, integrating various techniques to achieve high efficiency in use. The health monitoring system [39] operates with continuous monitoring and alert capabilities, particularly during severe environmental incidents such as wind, storms, and snow. However, the drawbacks of these systems include high installation and maintenance costs and a short operating life (typically only 2–3 years per system). Therefore, these systems are usually installed on large bridges, cable-stayed bridges, and other critically important bridges. Consequently, it is challenging to apply them to medium and small bridges.
– Inspection method: In this method [19,40], various devices are used to quantitatively assess the condition of the bridge, including strain gauges, deflection meters, and devices to measure the relative displacement of bridge components (such as abutment displacement and bearing settlement) and natural frequencies. The advantage of this inspection method [1,41] is that it provides bridge span deformation data under known load values and different impact scenarios. These impact scenarios are designed to create the most critical deformation state of the bridge [13,41]. However, the disadvantages of this method include the fact that the measurements are obtained in a static state, except for the values of the natural frequency [42] and the impact coefficient [43], which are determined by inducing vibrations through an impact force. Furthermore, load test scenarios (both in terms of value and specific placement of loads) cannot encompass all possible real-life situations.
Recent advances in seismic resilience research for bridge structures have adopted various approaches to quantify and improve infrastructure performance post-earthquake. Wei et al. [40] examined resilience as the ability of bridges to recover original functionality within a defined time window after seismic events. Mata et al. [44] investigated how damage mechanisms affect seismic resilience in bridges subjected to subduction earthquake effects, while Lee et al. [45] evaluated resilience and seismic loss of bridges located in soft soils using models based on fragility functions. Furthermore, Liu et al. [21–23] introduced the concept of generalized bridge resilience, integrating safety, social, environmental, and economic dimensions for a comprehensive assessment of lifecycle resilience. Khan et al. [46] further proposed a Bayesian belief network framework to quantify uncertainty and interdependencies among resilience parameters for seismic bridge infrastructure. These state-of-the-art studies underscore the multidimensional and probabilistic nature of resilience, but none specifically leverage real-world traffic-induced vibration data to simultaneously estimate deformation, natural frequency, amplitude, impact coefficient, and damping, which is essential for resilience-informed structural health monitoring (SHM).
This study focuses on the method for processing real-time signals from bridge girders through wireless sensor systems, applied in several bridge models in Ho Chi Minh City, Vietnam. The purpose of the research is to analyze and process signals collected from actual traffic to determine important technical parameters such as deformation, natural frequency, amplitude, impact coefficient, and damping coefficient. In particular, modal damping can be identified from ambient vibrations, including traffic-induced responses, using operational modal analysis (OMA). This output-only approach is widely applied in long-span bridge monitoring [20,47], avoiding the need for artificial excitation and ensuring continuous service without interruption. These parameters not only help meet the current inspection requirements of management agencies, but also support the effective and cost-effective implementation of periodic inspections. Seismic resilience is a broad performance concept that describes a structure’s ability to withstand an earthquake and rapidly recover its functionality afterward. In the context of bridges, resilience includes not only avoiding collapse, but also minimizing downtime and repair time so that the bridge can continue to serve traffic soon after a seismic event. Recent studies have advanced quantitative frameworks to assess bridge resilience. For example, modern definitions consider how quickly a bridge returns to an operational state within a prescribed time window after an earthquake. Researchers have introduced multidimensional resilience metrics that include structural safety, social impacts, environmental consequences, and economic losses throughout the life cycle of a bridge. Probabilistic approaches (such as Bayesian network models) have been used to account for uncertainty and interdependencies in these resilience factors. This state-of-the-art understanding of seismic resilience underlines that beyond traditional strength and serviceability, the design and monitoring should facilitate rapid recovery of post-earthquake functionality. By extracting key dynamic response parameters from traffic vibrations, the present study contributes data that can support resilience evaluations, bridging the gap between routine health monitoring and resilience-based design.
The method using real-time signals from this research brings significant benefits because of wireless sensor technology. First, it provides accurate data and reflects the actual condition of the bridge, thus enhancing the reliability of the inspection results. Second, the application of this method helps minimize inspection costs compared to traditional methods while improving the efficiency of bridge management and maintenance. This study not only contributes to improving the bridge inspection process in Ho Chi Minh City, but can also be widely applied to other bridge projects, especially in the context of the increasing demand for bridge inspection and maintenance. With these significant contributions, the research aims to bring practical benefits to management agencies and promote the sustainable development of transportation infrastructure.
3.1 Natural Frequency: Definition, Sensitivity, and Limitations
Changes in natural frequency are among the most commonly used parameters in bridge inspection [48]. Studies [48–51] often monitor variations in a bridge’s natural frequency to detect potential problems. The natural frequency is the frequency at which a structure oscillates freely without external forces [11,12,14]. It is a crucial indicator of the integrity and health of the bridge structure. When a bridge is newly constructed [4,8,11], its natural frequency is always higher than the frequency of excitations from environmental loads such as wind, earthquakes, and traffic loads. When new, its natural frequency is designed to be higher than the frequencies of the excitations from the surrounding environment. This ensures that the forces of wind, earthquakes and traffic do not cause resonance, which means that they do not induce excessive bridge vibrations that cause damage [16,20,31]. However, over time, as the bridge deteriorates, its natural frequency decreases below the level of environmental loads. Over time, bridges can be affected by factors such as corrosion, rust, cracking, or other types of damage. These damages reduce the stiffness of the bridge, leading to a decrease in natural frequency. When the natural frequency decreases below the frequency of environmental loads, the bridge can be more severely affected by these forces, increasing the risk of further damage.
Salawu [11] has reported many damage detection methods using information on natural frequencies. Various techniques and methods have been developed to detect damage based on changes in natural frequency [52,53]. These methods utilize natural frequency data to determine the extent and location of the damage on the bridge. Hou and Xia [54] reported several different methods that use natural frequency information to detect and evaluate bridge damage. Therefore, monitoring the natural frequency of bridges is an important tool in inspection and maintenance [55], helping to detect issues early and prevent serious damage.
in which
If Eq. (3) then
It is concerned only with the first natural frequency because it represents the bending mode of the element. From Eqs. (3) and (4), the manuscript sees the value of natural frequency
This research has [5]:
with y is the static elongation of the bar under the action of the load P.
Because:
but:
where
However, measuring natural frequencies alone does not provide sufficient information to detect structural damage [2,56,57]. Although the natural frequency is an important parameter, relying solely on it for damage detection does not provide the necessary data to assess the detailed condition of the bridge. It does not clearly indicate the extent and specific location of the damage. Furthermore, natural frequencies often lack the sensitivity to detect initial damage in structures [36,41]. The natural frequency of the bridge may not change significantly with minor or newly emerging damage [9,31]. This means that minor issues in the structure may not be detected early if the structure is solely based on natural frequency measurement. Typically, this method can only identify the existence of significant damage but may not precisely determine the location of the damage because damage at different locations may cause similar frequency changes. The method of measuring natural frequencies [58] is capable of detecting major damage to bridges, but it has difficulty accurately determining the location of those damages. This is because damage at different locations on the bridge can cause similar changes in natural frequencies. This makes it difficult to determine the specific location of the damage, if only on the basis of natural frequency. This limitation arises because the natural frequency is a global parameter that reflects the overall stiffness and mass distribution of the structure rather than pinpointing local anomalies. Different damage scenarios can lead to similar frequency reductions, especially in large, redundant structures. In addition, environmental and operational factors, such as temperature variation, humidity, and traffic load patterns, can cause frequency changes of magnitude similar to those caused by minor damage, further complicating the location. Therefore, accurate damage location requires complementary indicators, such as the curvature of the mode shape, the modal strain energy, or time–frequency features extracted from the measured responses. Thus:
– Natural frequencies are not sufficiently detailed to detect and assess structural damage.
– Natural frequencies are not sensitive to initial or minor damage.
– This method is only useful for detecting major damage, but it cannot determine the specific location of the damage because the frequency changes may be similar at different locations on the bridge.
This emphasizes that the use of natural frequencies should only be part of a comprehensive inspection system, combined with other methods, to ensure accurate detection and evaluation of structural damage.
3.2 Modal Damping as a Damage-Sensitive Indicator
The damping model [59,60] is highly respected for its sensitivity to structural damage compared to models based on stiffness. This means that when the structure material is damaged, the damping parameters, specifically the damping coefficient, will undergo clearer and more easily identifiable changes [18]. The relationship between the damping coefficient and the damage is expressed through the transformation of the energy dissipation of the structure. The damping coefficient measures the structure’s ability to dissipate energy under dynamic loads. When the structure is damaged, such as cracks [61], reduced stiffness [62], or loss of material [13], the energy dissipation capacity increases [21,22]. This leads to an increase in the damping coefficient because damaged elements in the structure absorb and dissipate more energy when the structure vibrates. The damping ratios in this study were determined from vibration data using output-only system identification. Similar approaches have been applied successfully in various bridge SHM projects [63–65], demonstrating that ambient excitation can produce reliable damping estimates when processed with advanced identification algorithms and sufficient data duration. The first advantage of the damping model in assessing damage lies in its ability to detect damage early [21,66]. An increase in the damping coefficient can be detected even when the degree of damage is very small. This helps to identify and assess damage early on, before they develop into more serious problems. Early detection allows timely maintenance and repair measures to be taken, preventing major damage and ensuring the safety of the structure [66,67]. Furthermore, the damping model compares favorably with the stiffness-based models, which include general stiffness and local stiffness. In stiffness-based models, small changes in stiffness [2,30] can be difficult to detect and often require complex measurement and analysis techniques. On the contrary, the damping model shows clearer changes when there is damage, since the damping coefficient directly reflects increased energy dissipation [68]. Therefore, the damping model, with its high sensitivity to minor damage, is an effective tool for monitoring and evaluating the condition of the structure [16,69]. Early detection of changes in damping coefficient helps to ensure safety and efficiency in the maintenance and repair work of the structure. The selected vehicle passages for damping identification were chosen to maximize dynamic excitation, including heavy multi-axle trucks and tankers at varying speeds. This ensured sufficient modal participation and amplitude in the recorded response. Although no explicit coupled vehicle–bridge numerical model was implemented, the choice of load cases reflects the practical ambient testing procedures widely adopted in OMA for in-service bridges [47,65].
In the study of oscillatory systems, understanding the response of a vibrational mode to random excitation is crucial. This section examines a single degree-of-freedom (SDOF) oscillatory system under the influence of randon Eq. (7) formulas. A single degree-of-freedom oscillatory system (SDOF) is the simplest form of such a system, characterized by a mass
According to the theory of vibrational modes of linear systems, this equation can also represent the response of a single resonant mode in a multidegree-of-freedom system, where
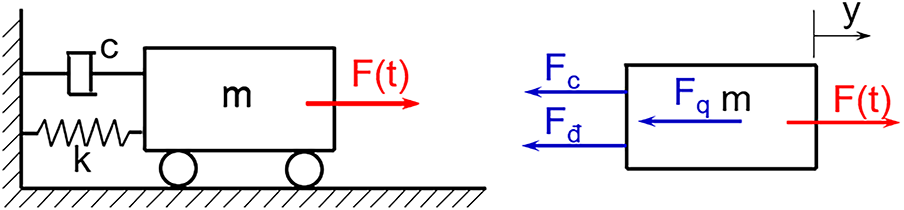
Figure 1: Linear damped vibration representing the response of a resonant mode
If the damping force is proportional to the velocity in a mathematical model, it causes energy loss, resulting in a logarithmic decrease in the vibration amplitude, as illustrated in Fig. 2. In practice, it is not always possible to determine the exact value of the damping coefficient, which becomes apparent only when the damping reduces the amplitude over time. Determining the range of the damping coefficient requires us to pay attention to the acceleration graphs. The following diagram shows the damping coefficient calculated based on real data.
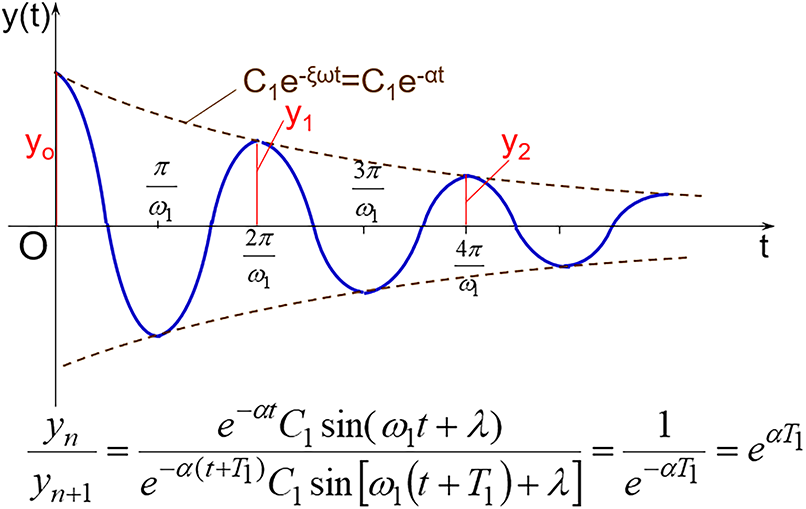
Figure 2: Attenuation of the logarithmic graph vibration damping
The main focus of the damping coefficient estimation methods presented is their ability to perform on-site assessments of large-scale engineering structures using ambient response measurements, as shown in Fig. 3. Consequently, in some studies, there is a tendency to use the damping coefficient to evaluate the condition of bridge structures, as it is more sensitive to damage than changes in stiffness. Material damage often leads to an increase in the damping coefficient, related to energy dissipation during dynamic excitation. Therefore, the authors [70] also proposed using the damping coefficient as a sensitive and attractive damage indicator. Zhang and Hartwig recommended using the damping coefficient, as it is more sensitive than the natural frequency in structural health monitoring [71], due to the higher statistical variation of the damping coefficient compared to the natural frequency in experimental models [17]. Similarly, Saravanos and Hopkins tested composite beams and showed that delamination had a greater effect on the modal damping coefficient than on the natural frequency. Colakoglu [50] demonstrated that the damping coefficient increased with the number of fatigue cycles.
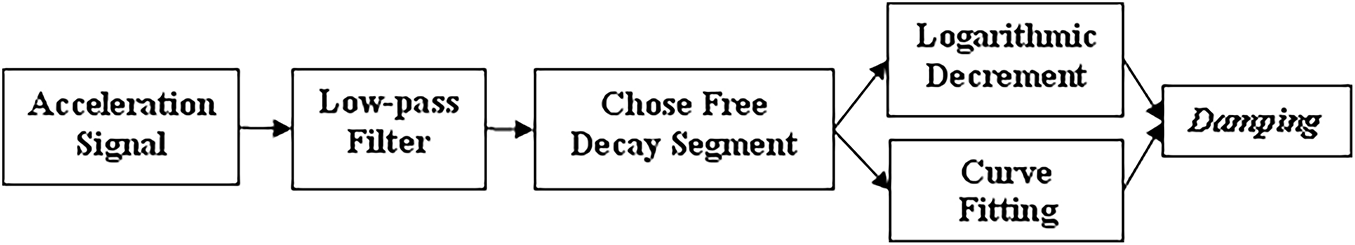
Figure 3: Diagram damping coefficient calculated from actual measured data
The drawbacks of using the damping model in the assessment of structural damage include several key points [39,49]. The first is the complexity involved in the measurement, data processing, and evaluation of the results. Accurate measurement of the damping coefficient can be complicated and requires special measurement equipment and sophisticated analytical techniques. Furthermore, due to the nature of energy transformation within the structure, the damping model exhibits high variability. The damping coefficient can change due to various factors, such as temperature, humidity, and loading conditions, which complicates the analysis and evaluation process. Furthermore, the damping model struggles to identify the exact causes and locations of damage within the structure. Although changes in the damping coefficient can indicate damage, it is not always easy to pinpoint the exact cause or precise location of the damage. Finally, an accurate analysis requires long-term measurement data to monitor variations in the damping coefficient over time.
3.3 Dynamic Amplification (Impact Factor) and In-Service Deflection
Bridge structures undergo progressive deterioration during their service life due to multiple factors such as reinforcement corrosion, fatigue cracking, material aging, creep, shrinkage, and bearing wear. These mechanisms alter the stiffness distribution, mass, and damping properties, which in turn affect modal frequencies, mode shapes, and vibration amplitudes [72]. Corrosion in steel members, for example, reduces cross-sectional area and stiffness, leading to downward shifts in natural frequencies; fatigue-induced cracking can localize stiffness losses, producing subtle but detectable changes in modal curvature [25,73]. Long-term environmental exposure can also increase damping due to microcracking and material softening. Therefore, deterioration is a critical factor in interpreting dynamic response data for structural health monitoring (SHM).
Bridge structure assessment and inspection procedures are often demonstrated by driving vehicles over the bridge at various high speeds to collect dynamic characteristics such as impact factor, natural frequency, mode shapes, and damping coefficient values. However, mode shapes and damping coefficient values are not often used in evaluating the load bearing capacity of bridges. The primary purpose of these testing methods is to calculate the impact factor, considering the dynamic amplification effects of the vehicle as it crosses the bridge under real conditions. The impact factor is related to the mass of the vehicle, the roughness of the vehicle bridge, and the interaction between the bridge and the vehicle, making it difficult to obtain consistent values from vehicle tests. Therefore, the maximum value is often taken as an impact factor to provide a conservative estimate. The impact factor is evaluated as follows:
where
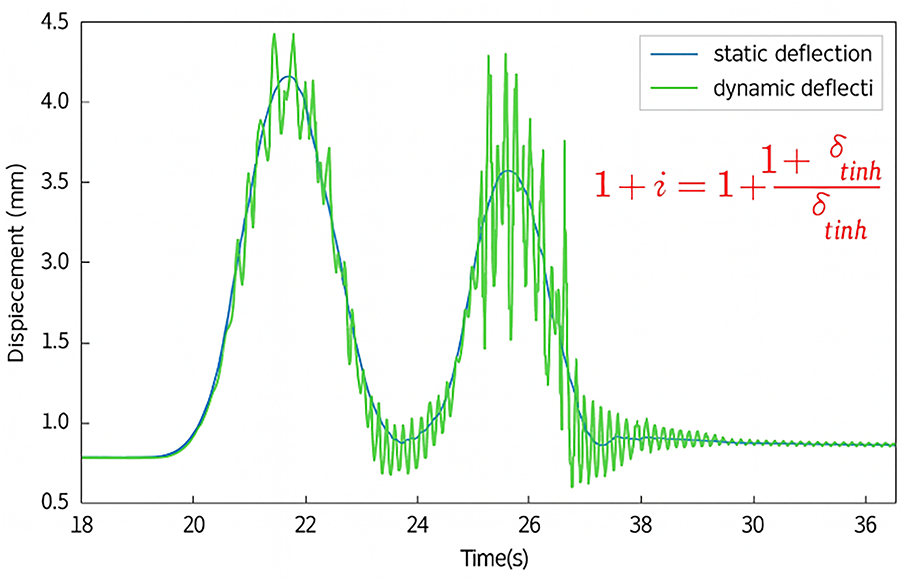
Figure 4: Dynamic and pseudo-static deflections
However, according to Timosenco expression [74], impact factors were identified using the formula:
in which EJ represents the stiffness of the element; P denotes the load on the element; l represents the length of the element; v indicates the velocity of the load. The impact factor model offers several advantages in assessing structural damage because it effectively evaluates real-world dynamic effects. The impact factor reflects the actual dynamic amplification effects when a vehicle crosses a bridge, providing an accurate assessment of the impact of dynamic load on the structure. Furthermore, this model is simple and intuitive, making it easy for engineers and bridge managers to apply and interpret the results. Most importantly, the impact factor can integrate various real-world factors in the assessment of structural damage. It incorporates factors such as vehicle mass, bridge roughness, and vehicle-bridge interaction, allowing the model to more accurately reflect real operating conditions. Using the maximum value of the impact factor for a conservative estimate helps ensure the safety of the structure, preventing an underestimation of the risk of damage. Despite these advantages, the impact factor model also has drawbacks that make it difficult to apply in practice. The impact factor can vary significantly due to factors such as vehicle mass, bridge roughness, and operational conditions, causing difficulties in obtaining consistent values from vehicle tests. Importantly, the impact factor model does not provide detailed information about other dynamic characteristics of the bridge, such as the shape of the mode and the values of the damping coefficients, which can limit the ability to perform a comprehensive analysis and evaluation of the structural condition. The results of the model heavily depend on the actual conditions at the time of testing, which may not accurately reflect the condition under different circumstances or over time. Finally, this model focuses primarily on the dynamic impact of vehicles on the bridge and does not help identify specific types of damage within the bridge structure. In conclusion, the impact factor model has many advantages in assessing bridge damage due to its ability to reflect real dynamic effects and its simplicity in application. However, it also has limitations, such as inconsistency, lack of detailed information, and strong dependence on real world conditions. Therefore, it should be used in combination with other methods to ensure a complete and accurate assessment of structural condition.
3.4 Deflection Models and Serviceability
Deflection is one of the key parameters that determine the operational capacity of a bridge, and its values are clearly specified in government verification documents [33,34,50]. For bridges with spans larger than their width, certain modeling patterns are generally followed. However, this is the most crucial model in assessing the quality of the structure because deflection is directly related to the performance of the bridge. Deflection measures the deformation of the bridge under load. Large deflection values can indicate weakness or damage to the structure, affecting the load capacity and the safety of the bridge. Deflection limits are stipulated in the standards and technical documents issued by the government to ensure that the bridges operate within safe and sustainable limits.
The characteristics of deflection in bridge structures typically exhibit certain characteristics, especially in bridges with spans longer than their width, where the deflection modeling becomes more apparent. Deflection depends on the ratio of span length to width, as well as the design factors and materials used. It is significantly influenced by both dynamic and static loads, such as traffic, wind, and other environmental conditions. Deflection models must reflect these influences to provide an accurate assessment of structural condition. This can be achieved by incorporating reductions in stiffness reductions, temperature-induced expansion/contraction effects [25,72,73], long-term creep and shrinkage in concrete components, and non-linear load-deflection relationships into the modeling process. In practice, this involves calibrating deflection models with field measurement data collected under varying environmental and traffic conditions, updating finite element models to reflect measured stiffness loss, and validating predictions against observed deformation patterns. By integrating these influences, deflection models provide a more realistic representation of the actual performance state, allowing for early detection of abnormal behavior. Measurement and control of deflection is critical to evaluate operational capability and ensure bridge safety. Deflection values must comply with government regulations and technical standards, and deflection modeling is often more evident in bridge structures with spans larger than their width.
3.4.1 Static Deflection of a Simply Supported Beam
For the above pattern, as seen in Fig. 5, the formula to calculate the static deflection is as follows.
in which EJ represents the stiffness of the element; P denotes the load on the element. The static deflection model in bridge structures is a crucial tool for assessing the load bearing capacity and safety of a bridge. The characteristics of this model include its dependence on the shape and size of the bridge, the applied loads, the type of materials and their mechanical properties, as well as the calculation and modeling methods used. Understanding and correctly applying these characteristics helps to ensure that the bridge runs safely and sustainably throughout its useful life.
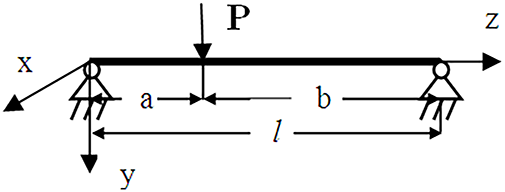
Figure 5: Single beam under static load
3.4.2 Dynamic Deflection under Moving Loads
If the load on a single beam changes its position while maintaining the same magnitude, we will follow the pattern illustrated in Fig. 6. This approach helps us analyze how the beam responds to the load at different points along its length, providing insights into the beam’s behavior under varying load positions:
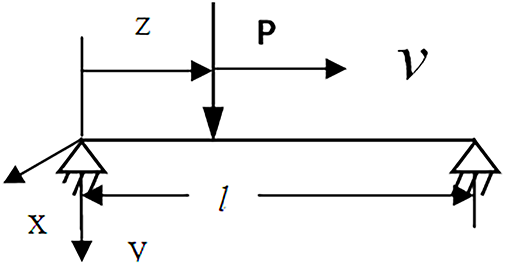
Figure 6: Single beam under dynamic load and without changing the magnitude
The formula for calculating the value of dynamic deflection is as follows:
in which A is the cross-sectional area; ρ is the mass per unit length
and:
If the load on a single beam changes its position and the magnitude follows a harmonic vibration, the manuscript will use the pattern illustrated in Fig. 7. This approach allows us to analyze the beam response under varying load positions and oscillating magnitudes, providing a comprehensive understanding of the beam’s dynamic behavior. Harmonic vibration represents the load that fluctuates sinusoidally over time and can simulate real-world conditions with greater precision.
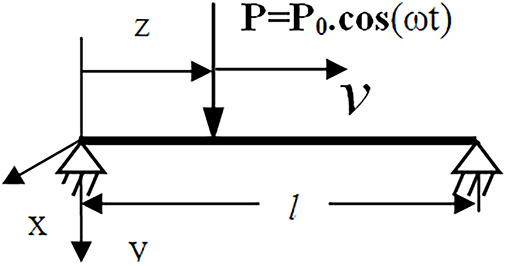
Figure 7: Single beam under dynamic load and harmonic oscillator magnitude
The deflection is given by:
in which
4.1 Single-Degree-of-Freedom (SDOF) Dynamics
According to the inspection rules [50,74], the bridge is always modeled as a single degree-of-freedom system. First, we consider a linear time-invariant vibration system with one degree of freedom. In this system, a body of mass m is connected by a spring and a viscous damper to a fixed support. A harmonic force with frequency ω and amplitude F acts on the mass in the line of motion. This setup allows analysis of the dynamic response of the bridge to harmonic excitation, considering the effects of stiffness, damping, and external forces. The equation of motion is Eq. (7)
Substituting Eqs. (7) in (13), and expressing it in terms of the undamped natural frequency ωn on and the damping coefficient ξ, manuscript obtains:
where
The free response of the system is given by the following:
where
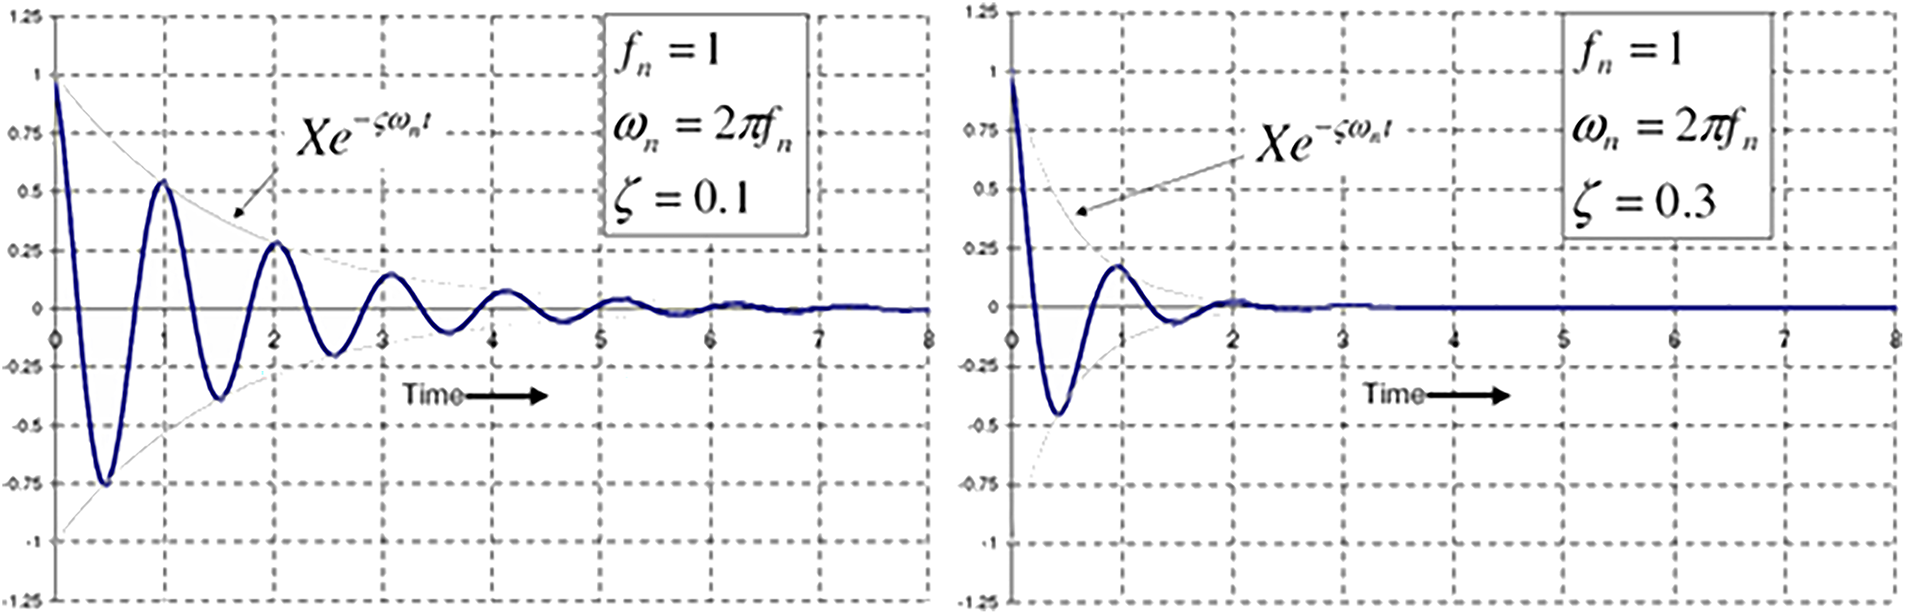
Figure 8: Vibration of some damped systems
4.2 Time–Frequency Analysis (FT and STFT)
To investigate the dynamic components of measured signals, an effective method is to decompose a complex signal into its fundamental components. The Fourier transform (FT) converts a function from the time domain to the frequency domain using sine and cosine functions. The Fourier transform of a signal
This transformation allows us to analyze the frequency content of the signal, providing insight into its dynamic behavior and underlying periodicities, as shown in Fig. 9.
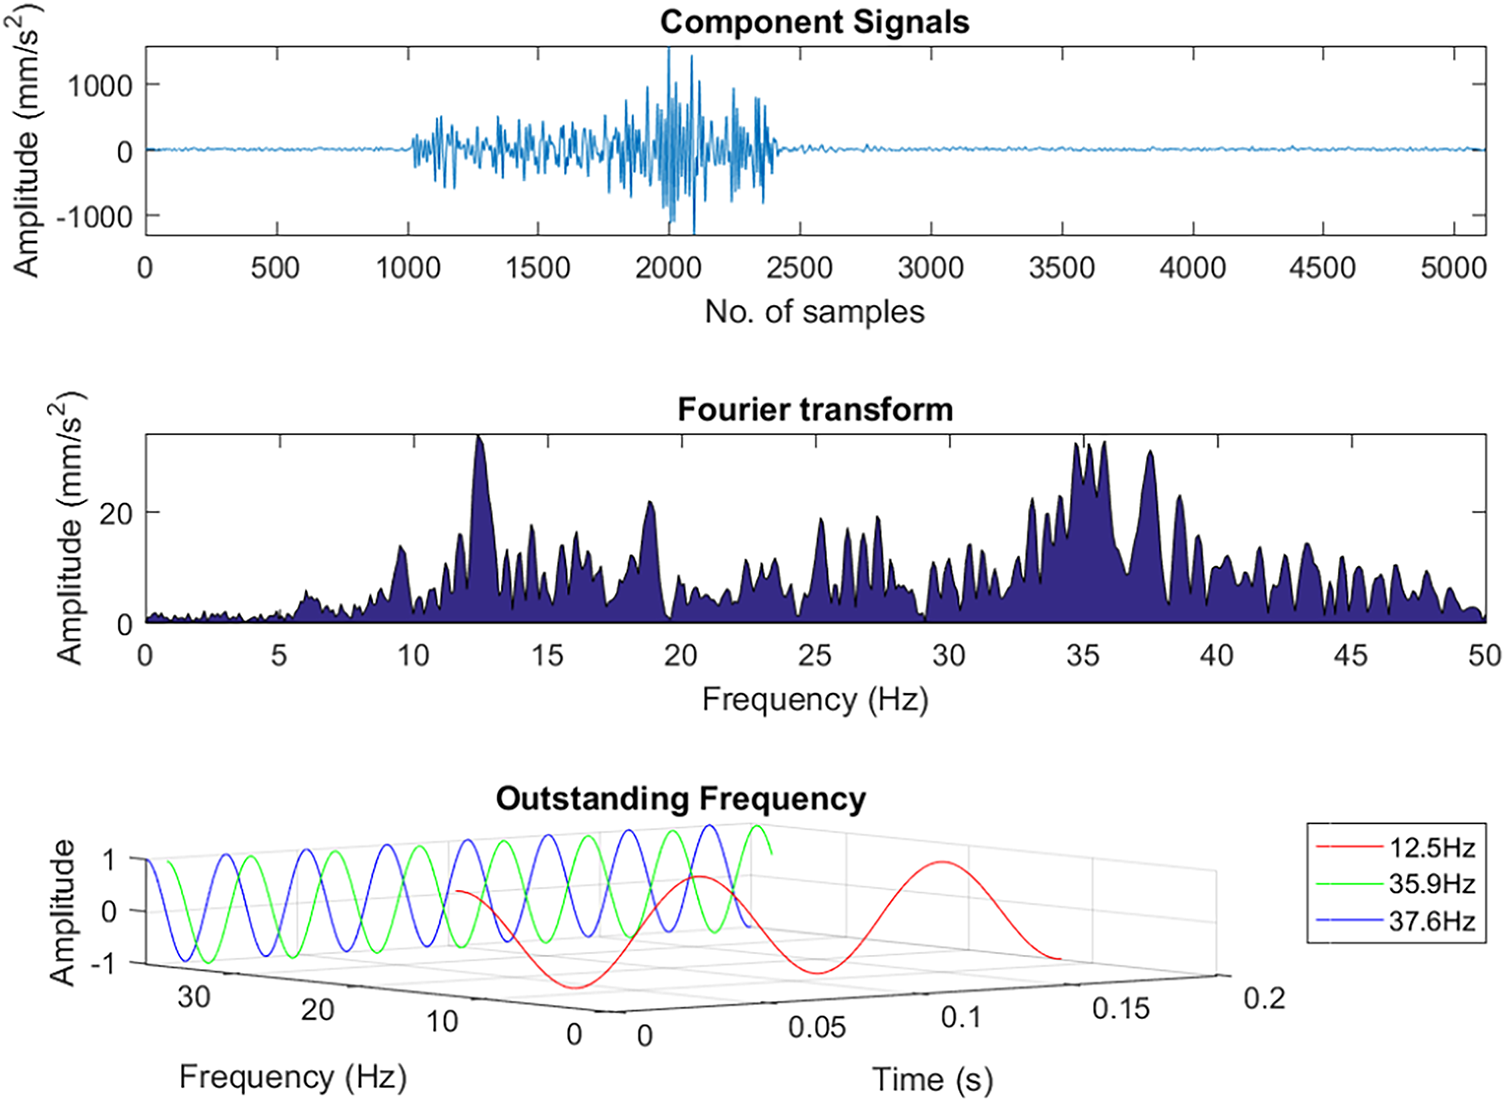
Figure 9: Fourier analysis model
The fundamental principle of the Fourier transform is to analyze a complex signal by breaking it down into its basic frequency components. This means that the original signal is decomposed into a series of sine and cosine waves with different frequencies and amplitudes. The Fourier transform is widely used in signal analysis to determine the frequency components of a signal. It is useful in many fields, such as audio processing, image analysis, and seismic analysis. When investigating the dynamic components of the measured signals, the Fourier transform helps to identify the present frequencies, thus analyzing the dynamic characteristics of the system.
The accurate characterization of oscillatory signals is critical to the detailed analysis of each individual wave packet (or mode) within the vibration model. This approach enables the precise extraction of modal parameters, such as natural frequency, damping ratio, and amplitude, by isolating discrete oscillatory components and mitigating interference from overlapping modes [75,76]. The accurate characterization of oscillatory signals is critical to the detailed analysis of each individual wave packet (or mode) within the vibration model. This modal isolation enables robust extraction of dynamic parameters, such as natural frequency, damping ratio, and amplitude, by minimizing mode overlap and interference by Mallat, 1999 [75] and Rainieri & Fabbrocino, [76]. Although the Fourier transform may not be the best tool for this detailed task, it is a simple and quick method to address the problem at hand. Fourier analysis provides information about frequencies (the vibrations produced by the structure) and converts signals from the time domain to the frequency domain. This analysis does not directly provide information on when the vibrations occur nor details the constituent waves that make up the overall vibration model.
Fourier analysis can be divided into two main types: the short-time Fourier transform (STFT) and the continuous Fourier transform (CFT). In STFT, the total measurement time is divided into several small equal intervals, and these intervals are individually analyzed using the Fourier transform. This approach transitions from a short-term Fourier analysis to a continuous Fourier analysis. The result of this transformation contains information about the relationship between time and structural vibration frequencies. However, equal time intervals cannot be adjusted, making it challenging to detect high-frequency vibrations occurring in very short durations.
5.1 Characteristics of Deflection Signals in Practice
To clarify the problem related to the Ben Noc Bridge and the use of a displacement transducer for testing by deflection signal, the Ben Noc Bridge is made up of three spans, each measuring 18.6 m in length. Each span is supported by six pre-ressed concrete T-beams. The middle beam in the first span was selected as the test beam. This decision is driven by the limited number of sensors available and the capacity for their installation. The middle beam is chosen because it can provide representative data on the span’s behavior under load, given its central position.
To ensure reproducibility, we provide a step-by-step description of our procedure:
1. Sensor selection & calibration—LVDTs (±0.01 mm accuracy) and piezoelectric accelerometers (±0.05% full scale) were calibrated against a standard displacement transducer and reference shaker before installation.
2. Placement rationale—The sensors were placed on the underside of the central beam in the first span because this location provides maximum deflection visibility, minimizes interference from expansion joints, and ensures stable sensor mounting.
3. Data acquisition—Signals were digitized at 512 Hz, synchronized via NI cDAQ hardware, and logged in LabVIEW in 30-min segments.
4. Signal preprocessing—Raw signals were detrended, band-pass filtered (20 to 80 Hz), and segmented by load event using a peak detection algorithm.
5. Deflection computation—Vertical displacement time series were converted from LVDT readings and averaged across identical load events for variability analysis.
Fig. 10 shows the location of displacement sensors (LVDT) and accelerometers installed on the central beam in the first span, together with the data acquisition unit (NI cDAQ-9174) connected to a laptop running LabVIEW software. The central beam in the first span was selected for monitoring because it is directly aligned with the lane that carries the highest traffic load and experiences the most representative mid-span deflections under service conditions. Data were collected continuously for 24 h at a sampling rate of 512 Hz, filtered using a 20–80 Hz bandpass filter to remove noise, and stored for subsequent time–frequency and deflection analysis. A single displacement transducer is installed at the midpoint (1/2 point) of the middle beam, as shown in Fig. 10. This installation point is strategic, as maximum deflection is typically observed at the midpoint for a simply supported beam under uniform or central loading conditions. The displacement transducer measures the vertical displacement (deflection) of the beam at the midpoint. This measurement is critical for assessing structural performance and verifying design calculations. The device converts mechanical displacement into an electrical signal, which can then be recorded and analyzed to understand the deformation behavior of the beam.
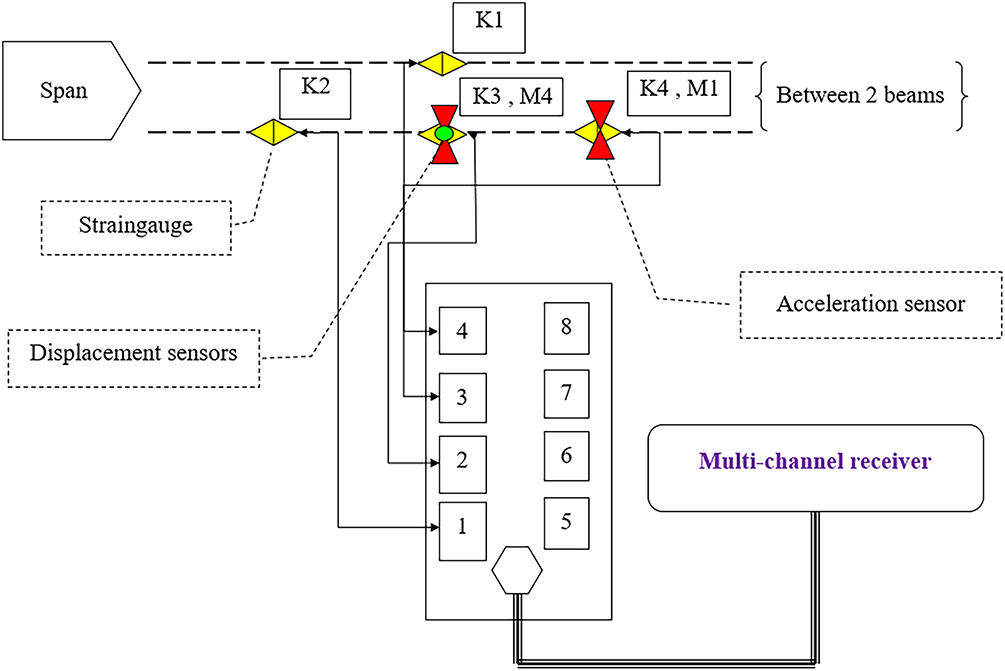
Figure 10: Experimental setup to monitor the structural response under traffic load
At the Ben Noc Bridge, we installed a single displacement transducer in the midspan of the central girder in the first span. Midspan is the critical section where bending moments and deflections peak under vehicle loads, maximizing sensitivity to stiffness changes while avoiding boundary effects from abutments and expansion joints. The central girder sits directly beneath the main traffic lane carrying the heaviest vehicles, so its response represents the most demanding service conditions. Given limited sensors, this placement offers the highest information yield: peak midspan deflection provides a robust proxy for global stiffness and overall structural integrity. Monitoring this point in routine traffic captures the global behavior and supports ongoing performance and safety evaluation.
Following multiple measurements, the results of the deflection values are summarized in Table 1 and Fig. 11. This table shows the deflection values recorded during the tests with different vehicles passing over the bridge at various times. The data highlight how the bridge deflects differently under various loads, with each type of vehicle causing distinct deflection patterns. Differences in deflection values reflect the varying weights and impacts of the vehicles, providing insight into the structural behavior and performance of the bridge under real world conditions.
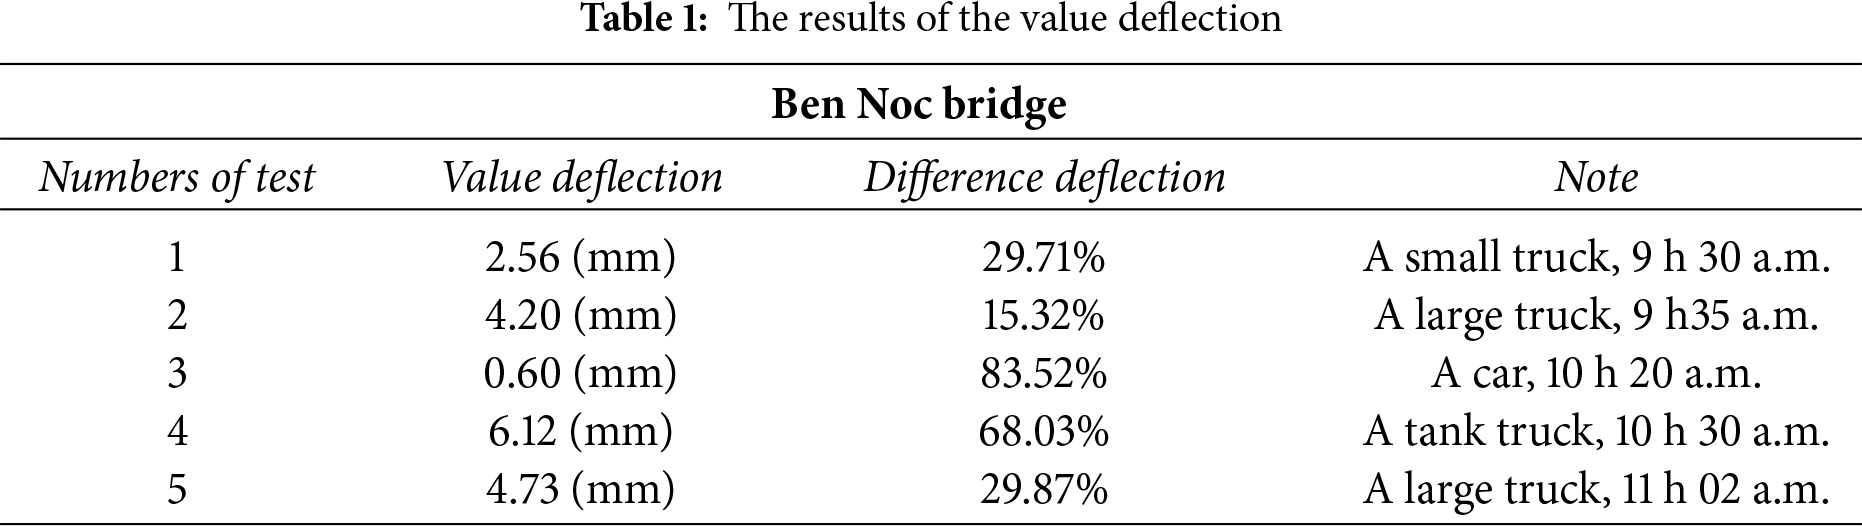
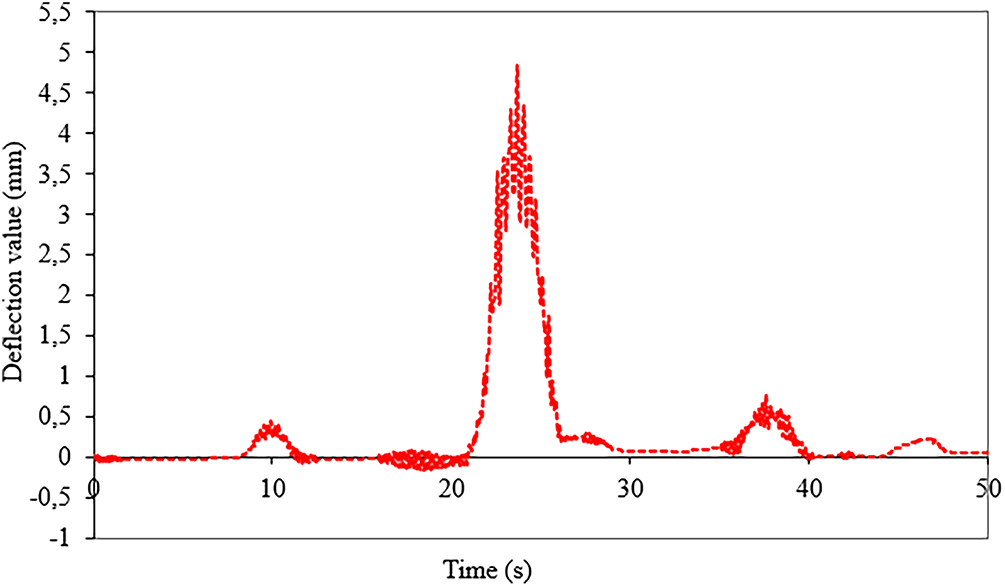
Figure 11: Deformation at the 1/2 point of the middle beam
Using Table 1 and Fig. 12, deflection clearly scales with vehicle mass: the tanker truck produced 6.12 mm vs. 0.60 mm for a car; a small truck reached 2.56 mm and a large truck 4.20–4.73 mm. Even under comparable conditions (three-axle trucks, 40 ± 5 km/h, 25°C–28°C), the deflection varied by ~15%–30%, reflecting differences in load distribution, exact speed, and other dynamic effects. The much lower car response confirms the sensitivity to load type. Overall, heavier vehicles produce larger deflections, as expected, indicating that the bridge behaves correctly; however, the 6.12 mm and its notably high relative difference (68%) merit closer tracking. These findings support continuous displacement monitoring and regular inspections in all loading scenarios to safeguard long-term integrity and safety.
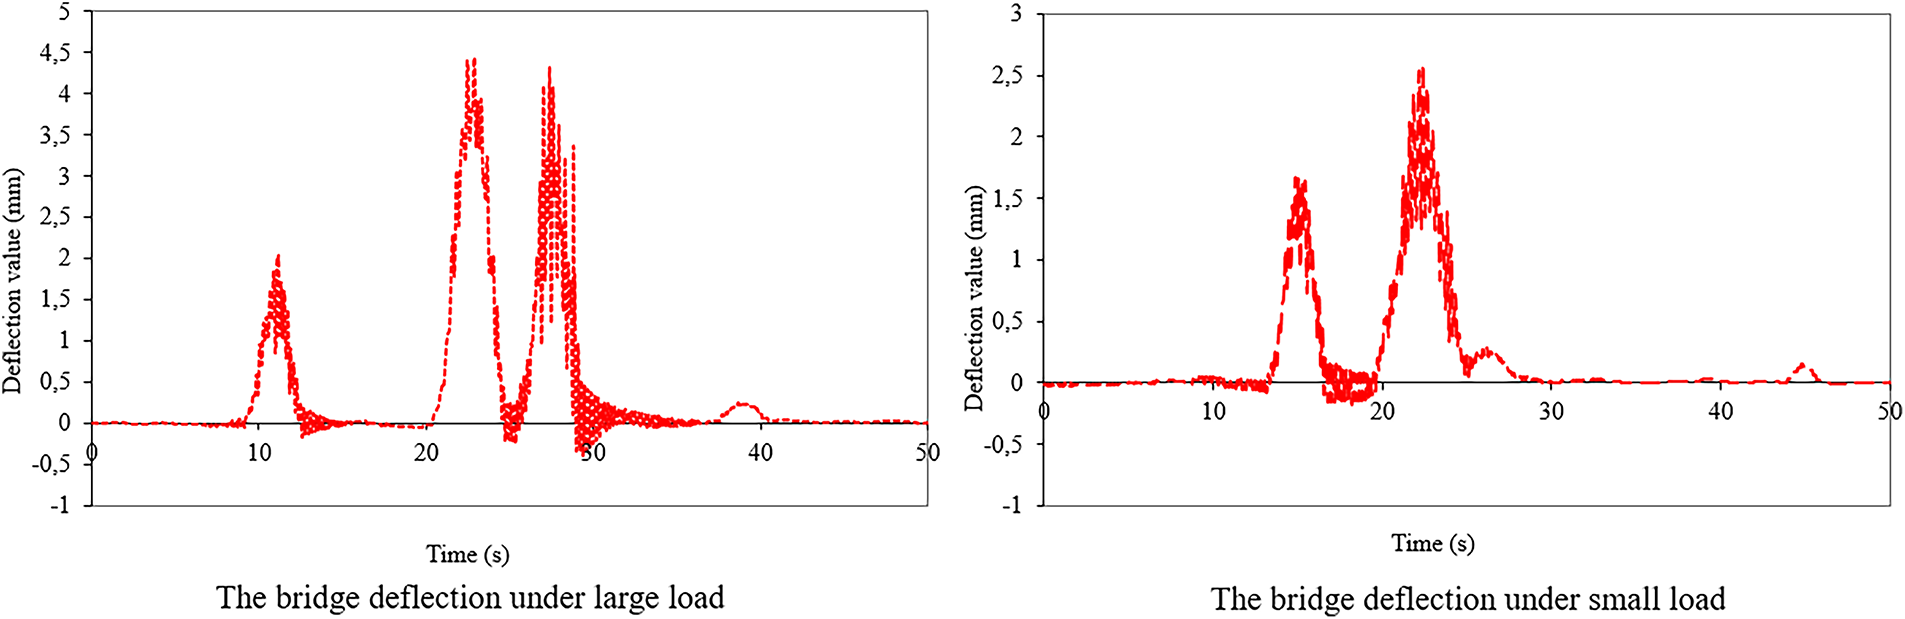
Figure 12: Deflection value under different loading conditions
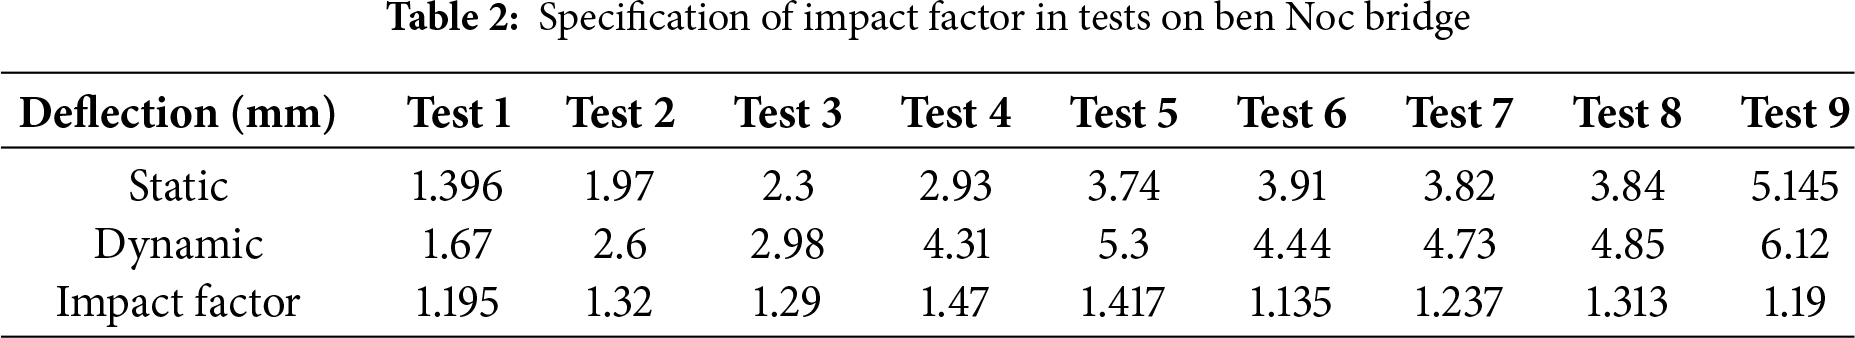
5.2 Impact Factor across Bridges: Comparative Study
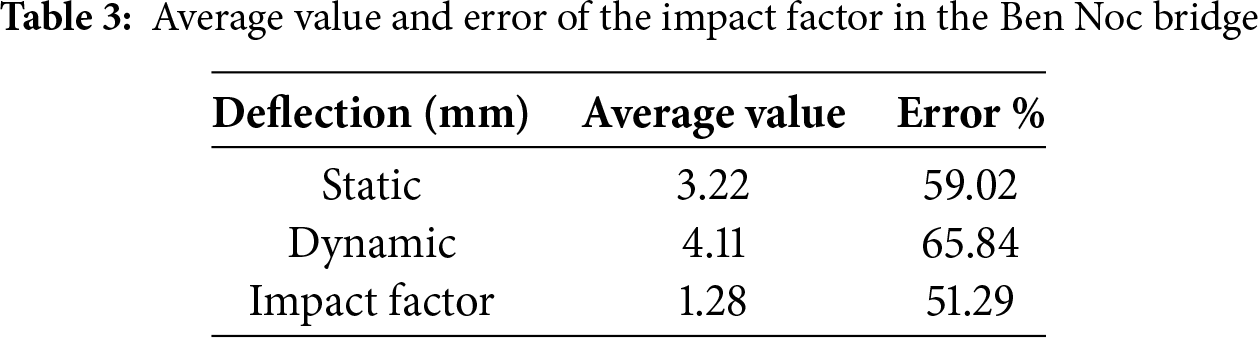
The Ben Noc Bridge the Sai Gon Bridge, and others were tested for structural responses using the impact factor. The results are summarized in Tables 2 and 3. The data collected from both tables provide a comprehensive understanding of the structural performance and safety of bridges under various loading conditions. The impact factor serves as a critical metric for assessing dynamic effects and ensuring that bridges operate within safe and sustainable limits.
The errors reported in Table 3, ranging from 51.29% to 65.84%, appear relatively high compared to the typical accuracy of LVDT. Possible contributing factors include the following:
(i) slight misalignment or slip in sensor mounting under repeated load cycles,
(ii) unmodeled dynamic amplification due to transient vehicle–bridge interaction, and
(iii) environmental influences such as wind gusts and temperature drift during measurements. These factors, especially transient load-induced vibrations, can magnify short-term measurement discrepancies.
However, observed trends are consistent across repeated trials, indicating that the data remain reliable for comparative and modal analysis purposes. The error values reported in Table 3 (ranging from 51.29% to 65.84%) are notably higher than the typical uncertainties expected for the LVDT and accelerometer measurements. These elevated errors can be attributed to several operational and environmental factors that are inherent in in-service bridge testing under uncontrolled traffic conditions.
1. Sensor mounting tolerances and slip—Repeated dynamic loading over extended periods can cause microslippage or alignment shifts in the displacement transducers, introducing small but cumulative deviations in recorded deflections.
2. Transient vehicle-bridge interaction effects: Differences in axle configurations, suspension characteristics, and tire pressure produce varying dynamic amplification effects, which can increase measurement variability even under similar nominal load classes.
3. Environmental influences—Temperature fluctuations (25°C–28°C range during measurements), wind gusts, and humidity changes can cause short-term variations in stiffness and damping, which in turn affect recorded deflections and impact factors.
4. Spectral leakage and event segmentation—When load events are truncated by analysis windows, some modal energy content is lost, slightly altering computed dynamic parameters.
Although these factors inflate the absolute error percentages, they are consistent across repeated runs, allowing relative comparisons and trend analysis to remain valid. Importantly, the persistence of proportional differences between static and dynamic deflection measurements suggests that the observed variability reflects genuine structural behavior under realistic service conditions, rather than purely measurement noise.
The difference between static and dynamic deflection on the Ben Noc bridge indicates that dynamic deflection is greater than static deflection in all test cases. This suggests that the bridge exhibits a stronger response under dynamic loading. This is a novel observation because, in the process of evaluating the quality of bridge structures, studies often focus solely on static deflection, lacking a comparative analysis between static and dynamic deflection. The results of the survey show that the Ben Noc Bridge has a higher capacity for dynamic loads compared to static loads, which is important in the design and safety assessment of the bridge.
Regarding the impact factor on the bridge through the test model of this study, the impact factor varied significantly between the tests, with values ranging from 1.135 to 1.47. However, the average impact factor is 1.28 with an error margin of 51.29%, indicating considerable fluctuation that may result from various factors during the test, such as test conditions, load characteristics, and surrounding environmental conditions.
Both static and dynamic deflections have high error margins (59.02% and 65.84%). This suggests that measurements or test conditions exhibit substantial variability, which highlights the need to improve accuracy and consistency in testing. The research results indicate significant variability in the deflection and impact factor tests on the Ben Noc Bridge. Increasing the precision and stability of the measurements is necessary to obtain more reliable results. The average values of the impact factor can serve as a basis for further analysis and design of the durability and safety of the bridge under dynamic loading conditions.
A survey of the impact factor on a large number of bridges, as shown in Table 4, reveals significant variability in the impact factor values for bridges such as the Den 1 Bridge, the Den 2 Bridge, and the Giong Ong To 2 Bridge, with values ranging from approximately 1.037 to 1.503. However, the Huyen Thanh Bridge shows less variability, with values ranging from 1.019 to 1.375, indicating that this parameter lacks stability in the measurements.
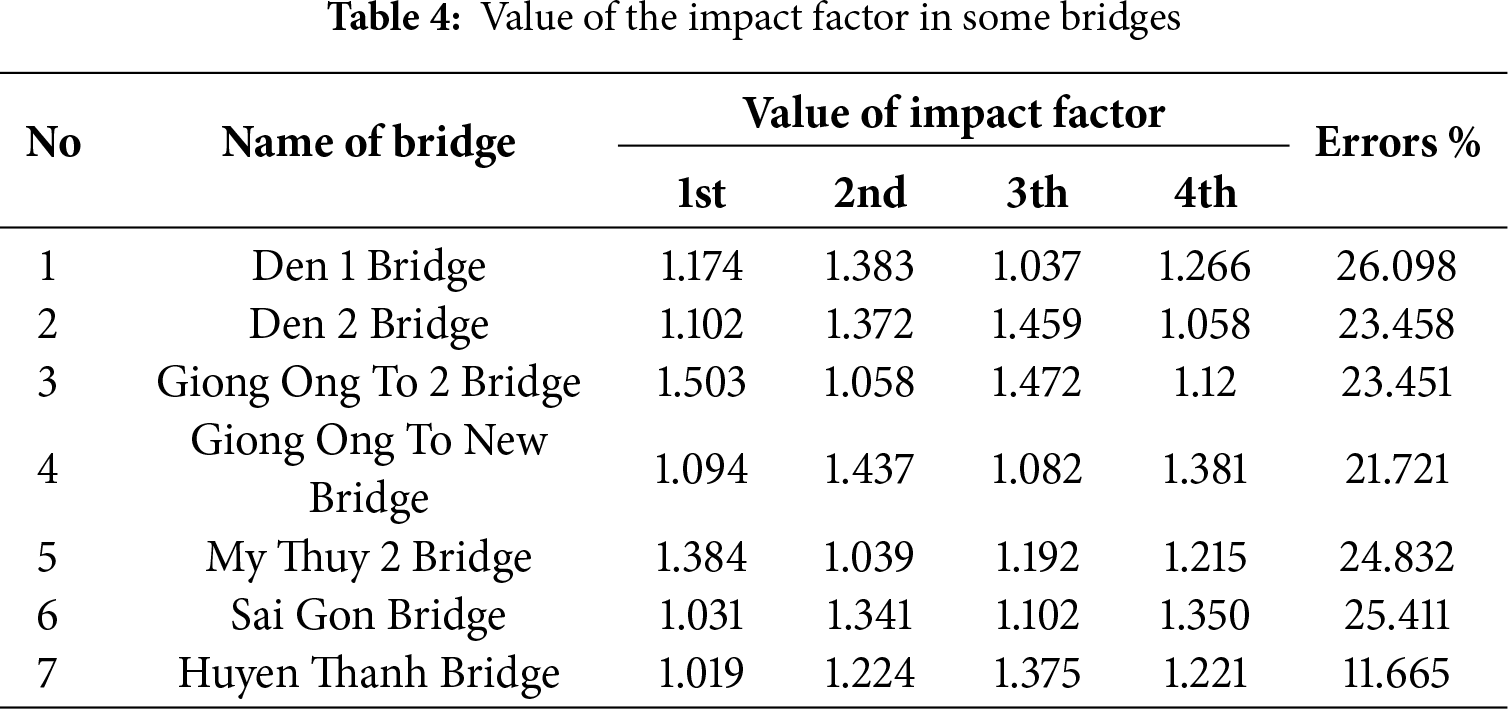
Combining this with the analysis of the Ben Noc Bridge, which has an average impact factor of 1.28 and an error margin of 51.29%, higher than most other bridges in the table, suggests greater variability in the measurements at Ben Noc Bridge. This could be due to various factors, such as testing conditions, structural characteristics, or loading conditions.
The large variability in this parameter can be attributed to several factors, including the testing conditions or the conditions of the actual measurement model. Specifically, environmental conditions, traffic conditions, and weather can affect the measurements. Therefore, more detailed studies are needed on the impact of these factors. Furthermore, structural characteristics are one of the main causes of the high error margin for this parameter. The structure and materials of the bridge can influence the impact factor. Further studies of the structure and materials of each bridge will help better understand the variability of the impact factor.
5.3 Damping-Damage Relationship and Cross-Bridge Comparison
It is recognized that ambient-based damping estimates may show a higher scatter than those from free decay tests [15,17,77]. To address this, we analyzed multiple heavy-vehicle passages and extracted clear decay segments to improve the stability of the estimate. This approach has been shown to reduce variability and produce values comparable to forced vibration methods while maintaining operational practicality [65].
To verify that the selected events contained adequate modal excitation, a short-time Fourier transform (STFT) was applied to the acceleration and displacement records (see Fig. 13). STFT spectra confirmed the presence of sustained energy around the first bending mode during and immediately after vehicle passage. These post-passage decay segments were then isolated and used in damping estimation, consistent with established ambient vibration practices [20].
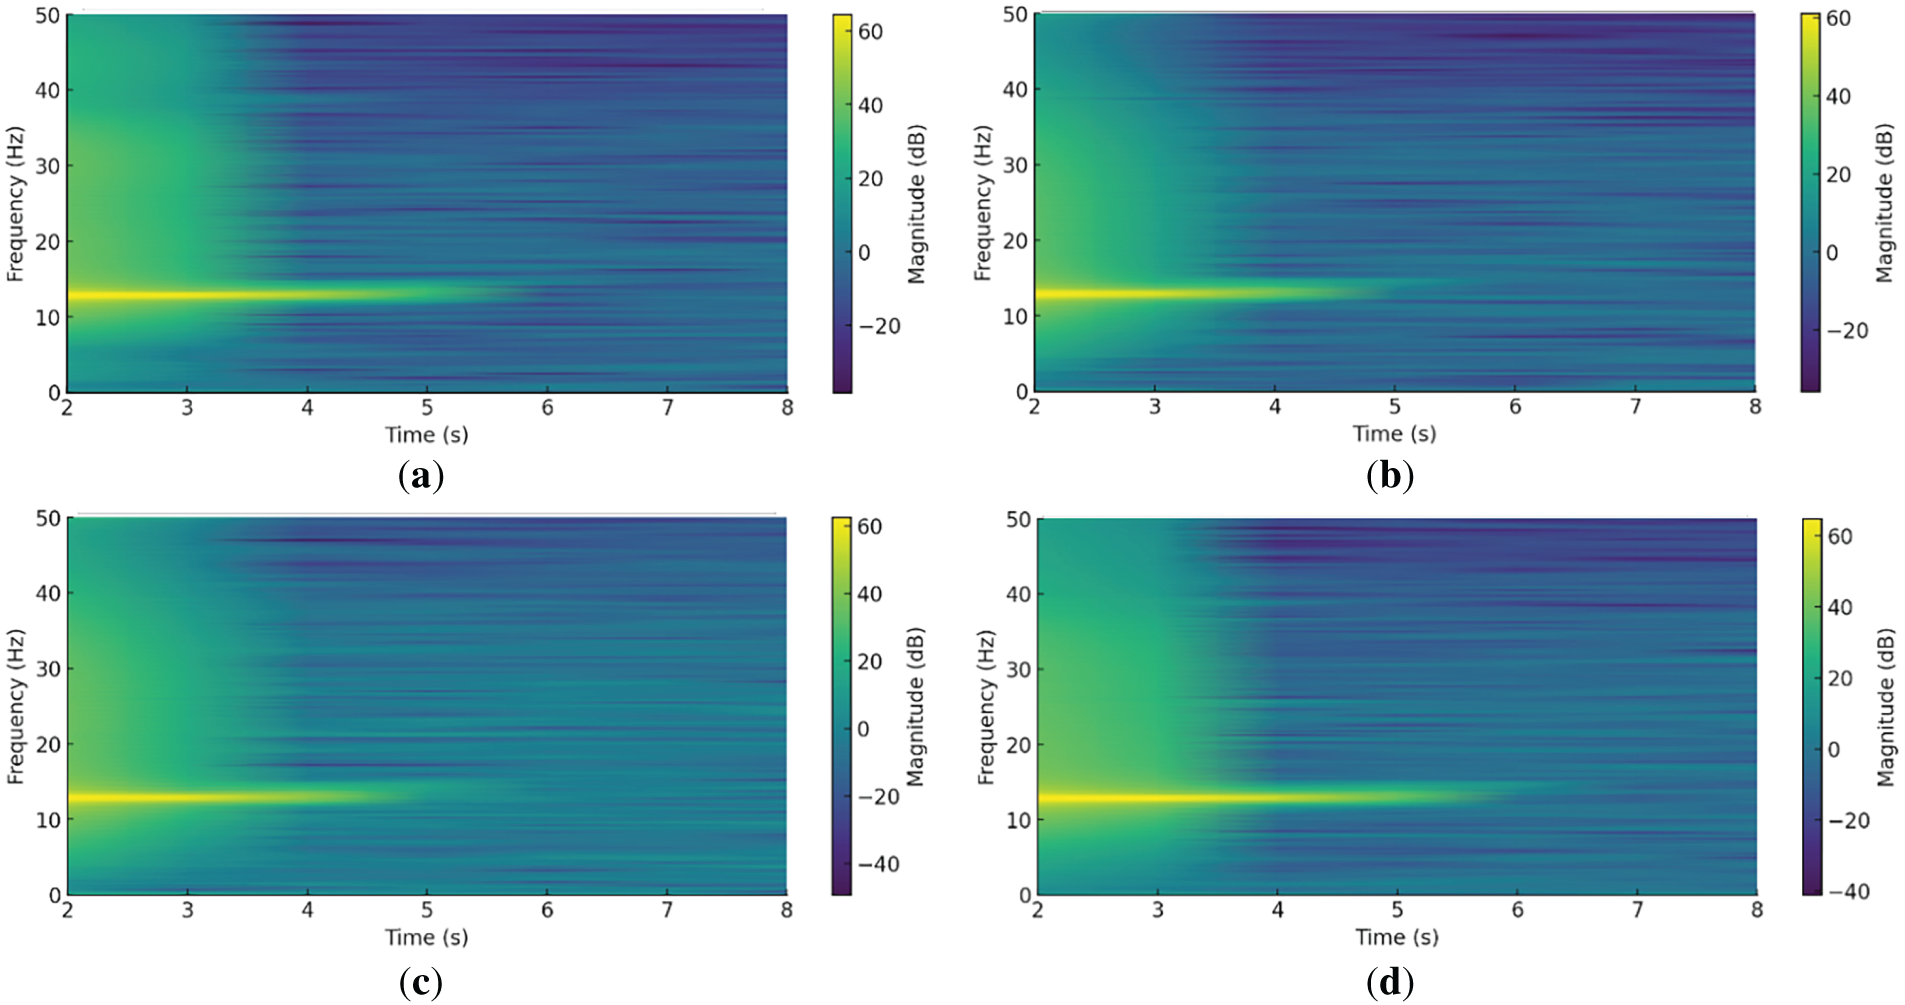
Figure 13: Time-frequency spectrograms of bridge vibration responses at four measurement positions under a heavy vehicle passage. (a) Location at the beginning of the bridge span; (b) Location 1/3 of the bridge span; (c) Location 1/2 of the bridge span; (d) Location 2/3 of the bridge span
In Fig. 13, each panel (a–d) corresponds to a different accelerometer position along the bridge span, sampled at 512 Hz. Short-time Fourier transform (STFT) was applied using a Hanning window of 4 s with 75% overlap, and the frequency range is limited to 0–50 Hz to emphasize the dominant structural modes. The spectrograms reveal sustained modal energy concentrated within the first bending mode band (~3.8–5.1 Hz) during and immediately after heavy vehicle passages. The bright, narrow-band ridges indicate strong excitation of the fundamental mode by multi-axle trucks and tankers, followed by gradual amplitude decay, which is suitable for damping estimation. Time–frequency localization also confirms that excitation occurs over a broad time interval during vehicle transit, ensuring adequate modal participation despite the absence of explicit vehicle–structure interaction modeling. The consistent presence of modal ridges across all four positions demonstrates that the selected events provide sufficient dynamic response amplitude and frequency content for reliable operational modal analysis. Minor variations in intensity between positions reflect differences in the amplitude of the local mode shape and sensor placement, which is consistent with theoretical expectations. These findings validate the suitability of the chosen moving load events for ambient-based damping identification.
Measurement of real damping values for the five tests on each bridge using logarithmic decay and curve fitting methods also shows high convergence with little variance, as presented in Table 5 and Figs. 14 and 15.
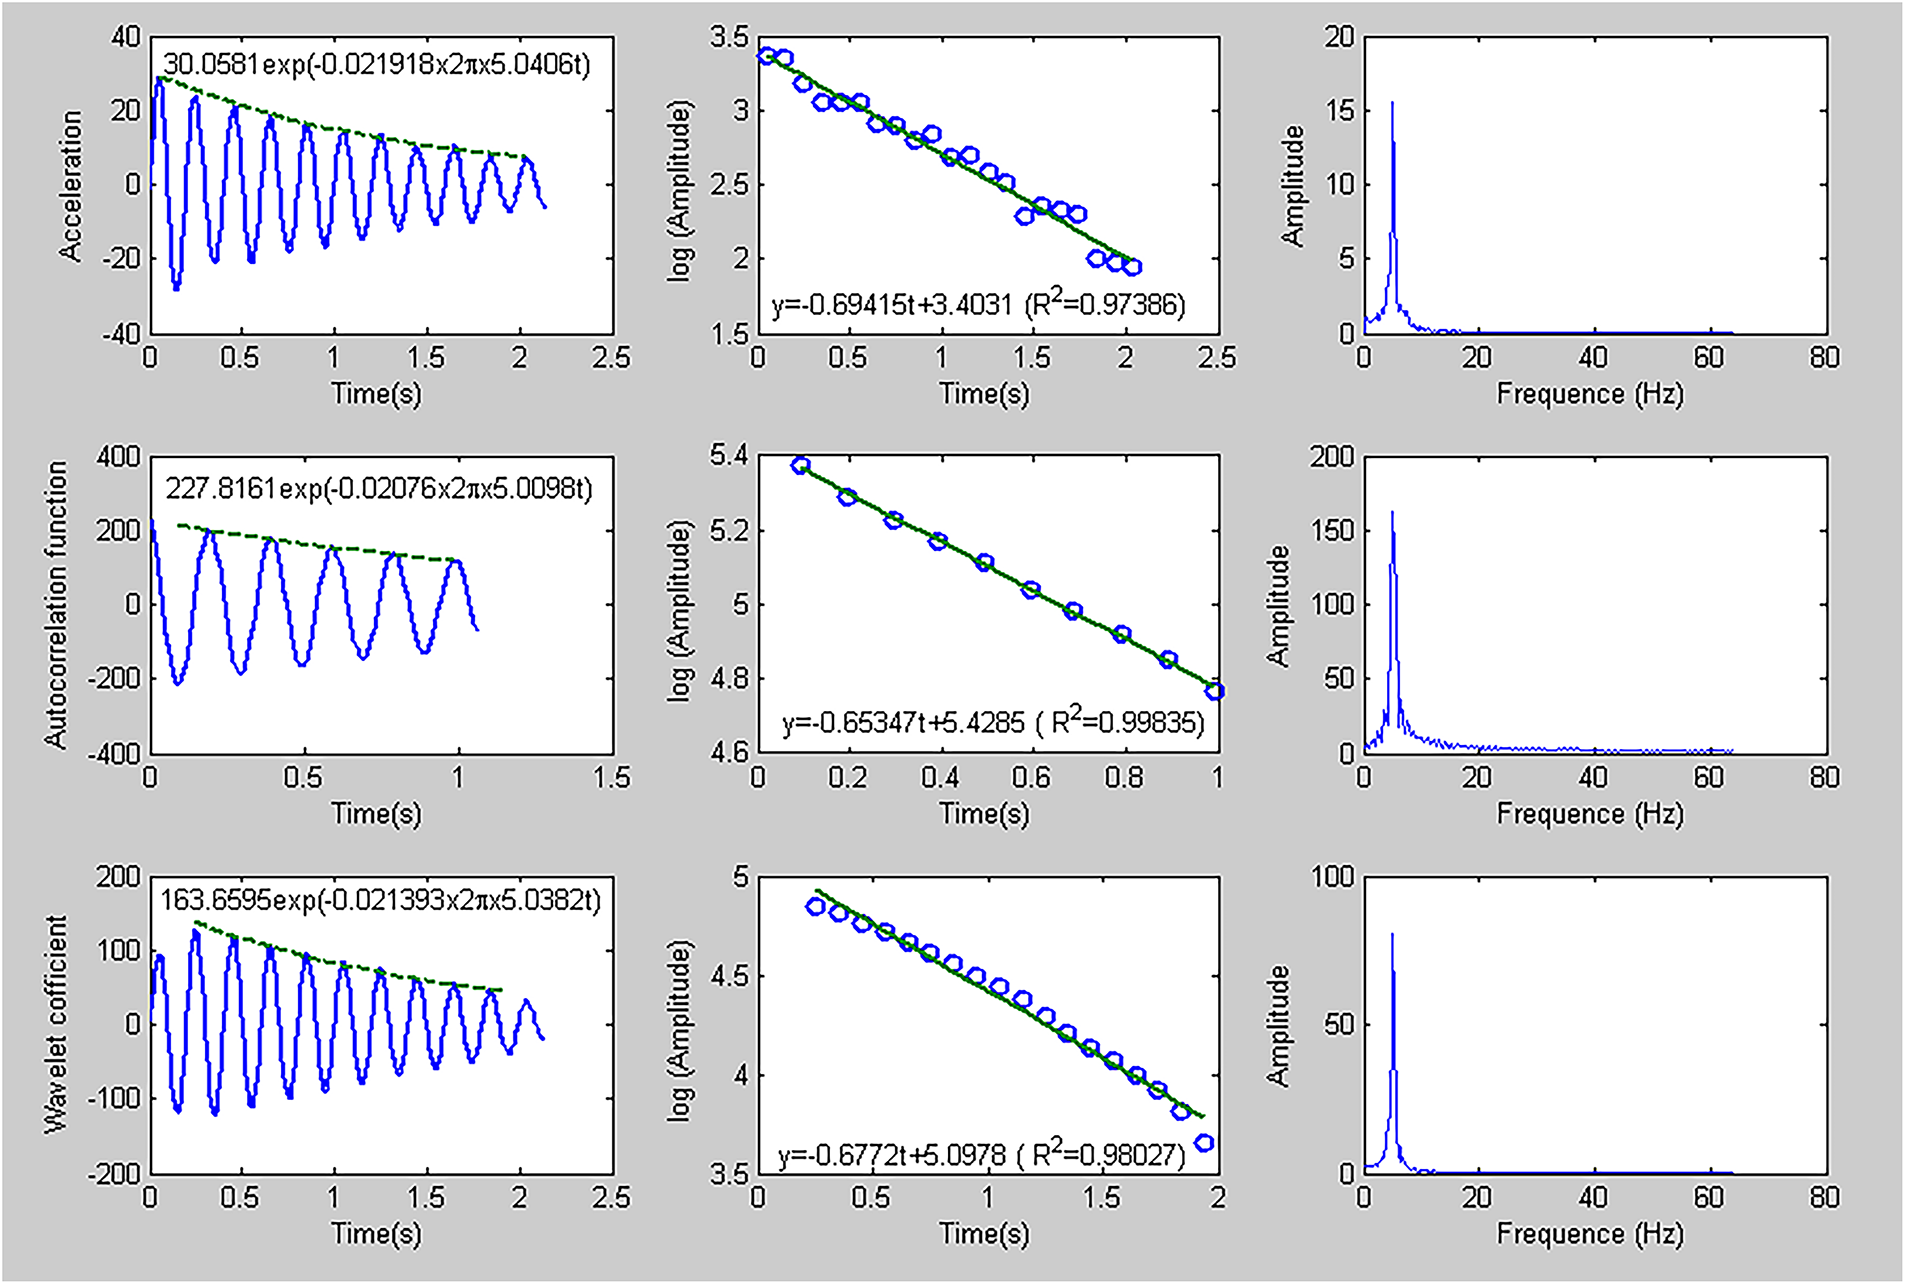
Figure 14: Damping model from research at Ben Noc bridge
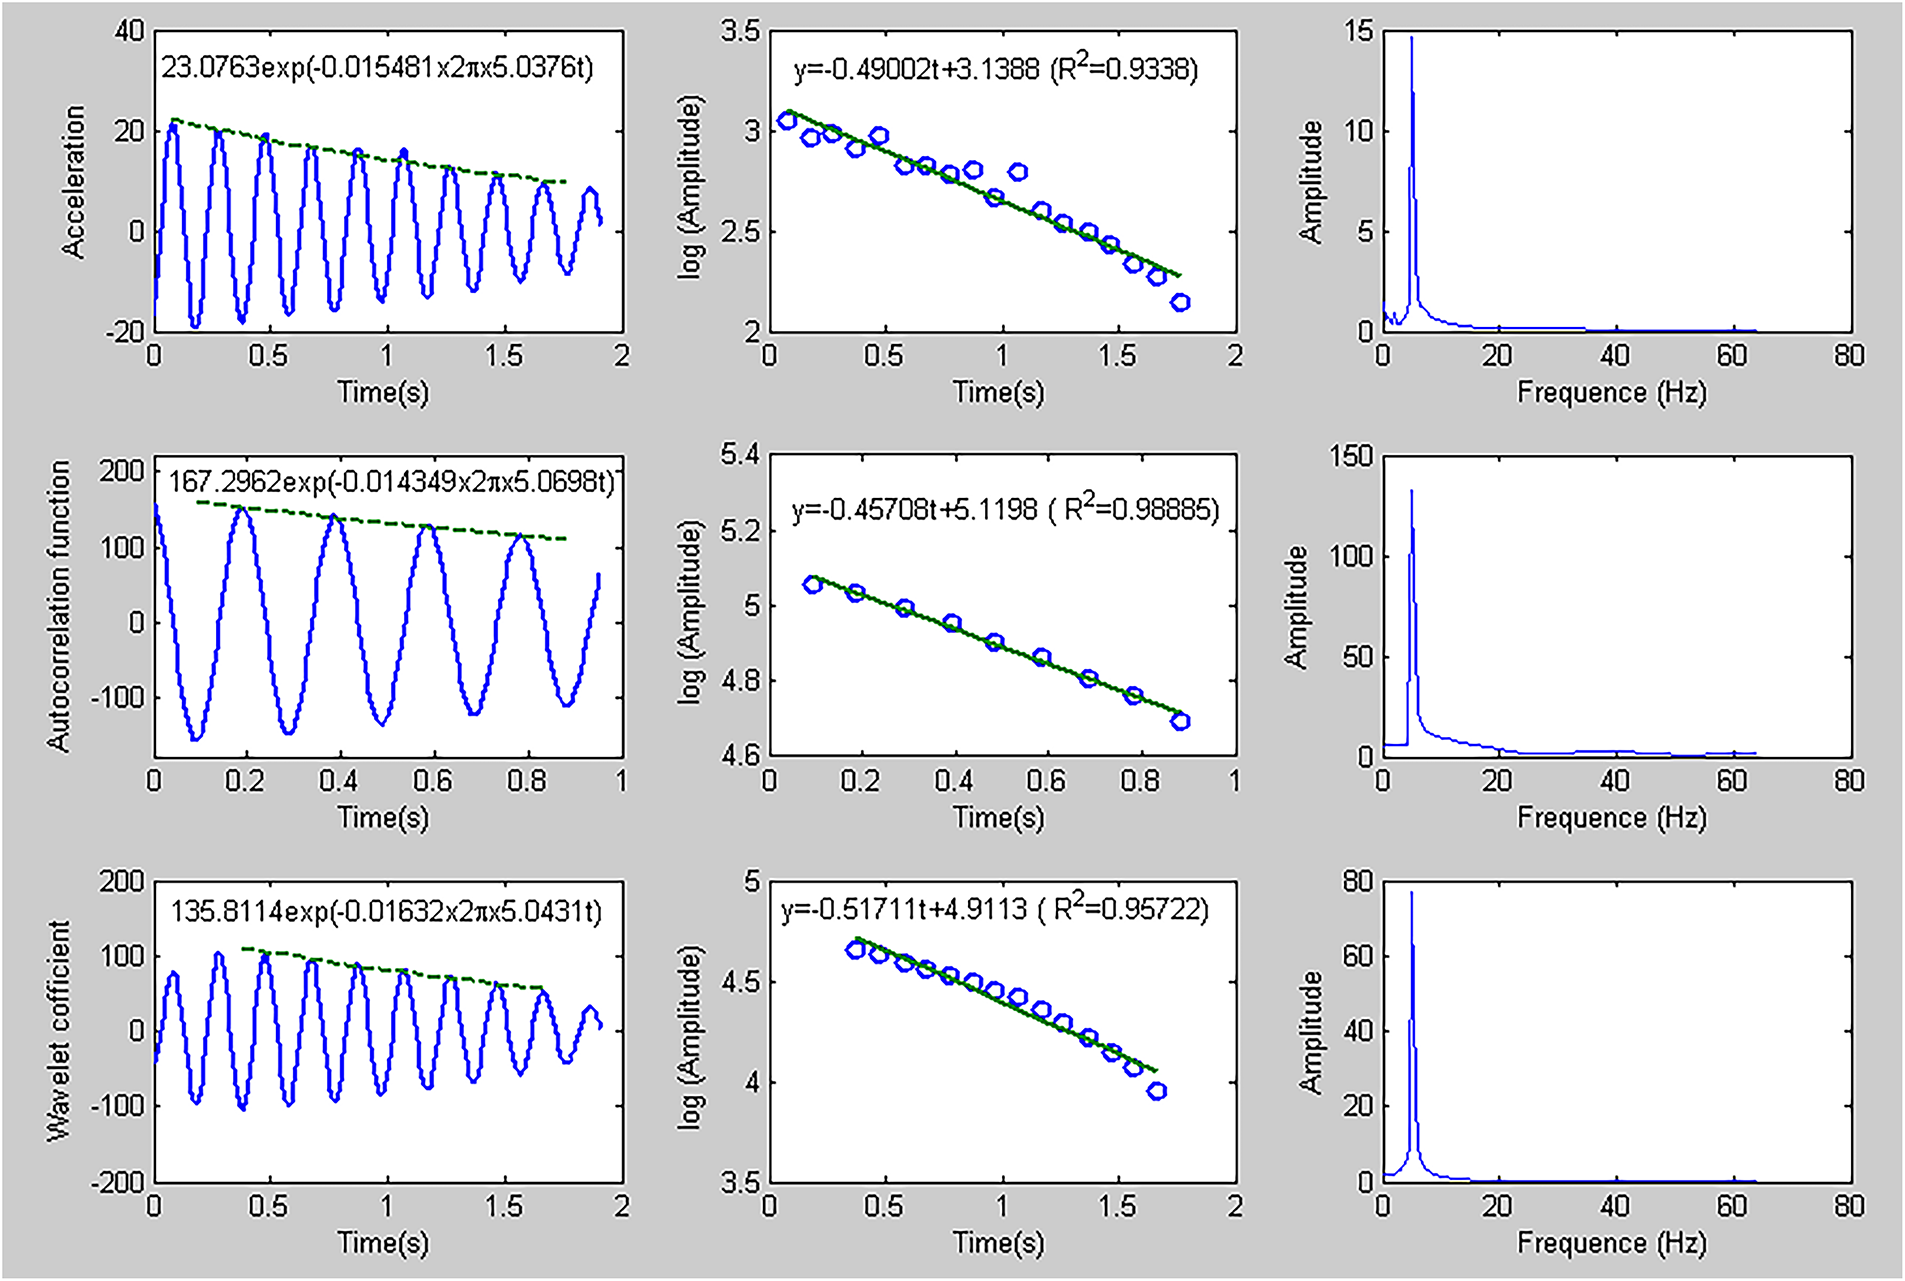
Figure 15: Damping model from research at the Ong Tan bridge
The Ben Noc Bridge has a higher mean damping value (0.02355) compared to the Ong Tan Bridge (0.01201). This indicates that the Ben Noc bridge has a higher energy dissipation capability, which could suggest a design or material characteristic that allows greater vibration damping. The variance in damping values for the Ben Noc Bridge (
The difference in mean values and variance between the two bridges could be due to several factors, including differences in construction materials, structural design, maintenance status, and environmental exposure. In more detail, the differences can be attributed to several interacting factors.
– Construction materials—Material composition and damping capacity play a significant role in dynamic behavior differences. Composite materials often exhibit higher damping than conventional metals, leading to faster energy dissipation and lower vibration amplitudes [6].
– Structural design—Variations in span length, skewness, foundation stiffness, and superstructure configuration can significantly alter dynamic response. For example, parametric studies show that a bridge and span geometry significantly affect its modal frequencies and displacement patterns [69].
– Maintenance status—Scouring and degradation of the stiffness of the foundation can modify dynamic characteristics, particularly the lateral modes; monitored bridges have shown that frequency changes in lateral vibration modes are more sensitive to foundation stiffness variations.
– Environmental exposure—Changes in damping ratios reflect aging of the material and accumulated damage. Both modal damping and energy dissipation capacity have been found to decrease with aging or damage progression, affecting vibration amplitude and dynamic consistency [14].
The interplay of these factors underscores the need for site-specific SHM calibration for accurate cross-bridge comparisons.
The Ben Noc Bridge may be subject to more diverse loading conditions or have varying material properties that affect its damping capacity. Comparison of damping values between the Ben Noc and the Ong Tan Bridge provides valuable insight into their dynamic performance. The higher mean damping value of the Ben Noc Bridge suggests that it can better dissipate energy, but its higher variance indicates potential variability in performance that needs to be addressed. The Ong Tan Bridge shows a more consistent damping behavior, which is indicative of stable structural performance. These findings highlight the importance of continuous monitoring and customized maintenance strategies to ensure the long-term safety and reliability of bridge structures. Surveying some other bridges through four different measurements gives us the following result in Table 6.
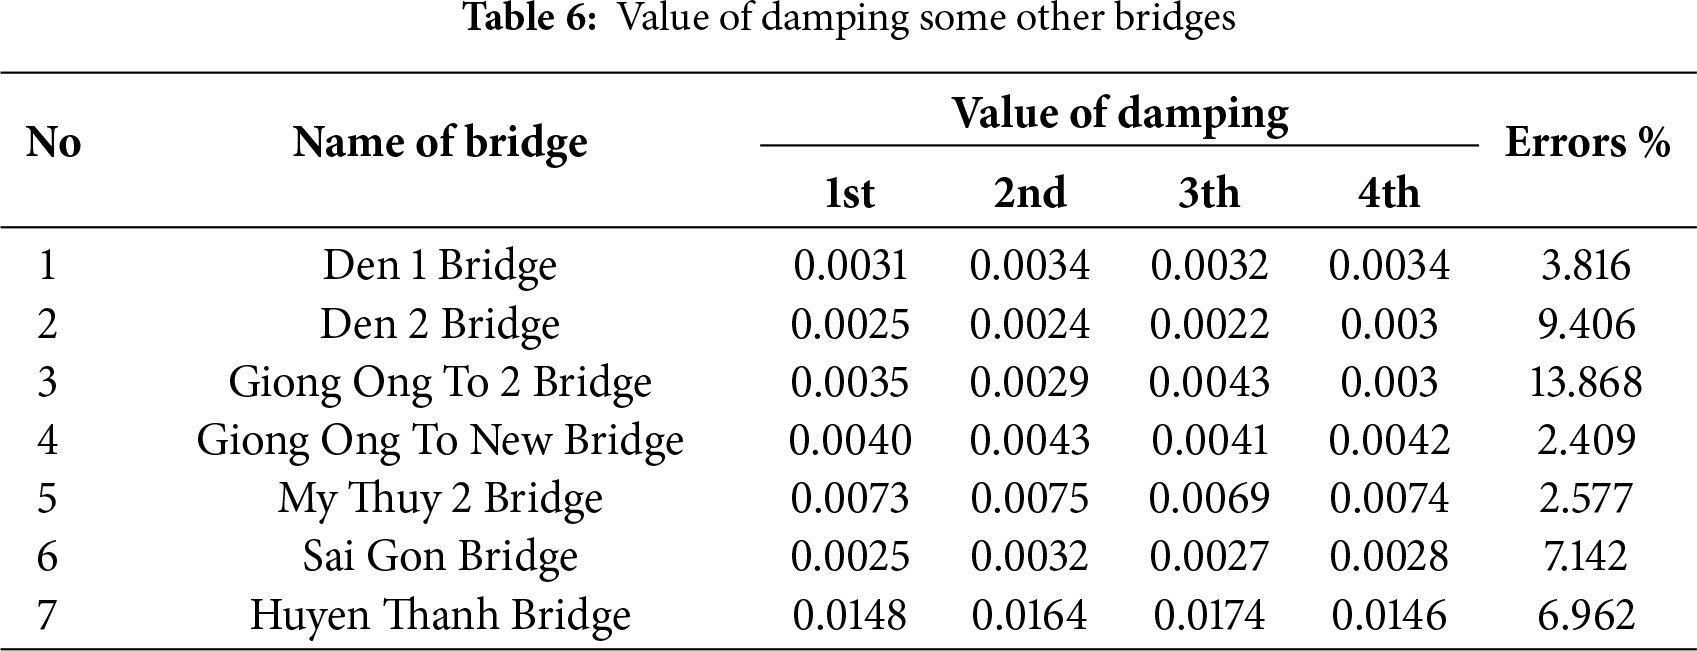
Damping varies markedly across bridges, reflecting differences in design, materials, and environment. Huyen Thanh shows the highest mean (0.0158), while Den 2 is among the lowest (0.00253). Measurement consistency also differs: Giong Ong To 2 has the largest error margin (13.868%), indicating high variability or inconsistent test conditions; Giong Ong To New and My Thuy 2 have the lowest (2.409% and 2.577%), suggesting stable damping behavior. High damping (e.g., Huyen Thanh) can aid in vibration reduction but warrants follow-up to understand the underlying mechanisms. These contrasts highlight the need for targeted SHM: prioritize closer inspection and improved measurement protocols for bridges with large uncertainties (e.g., Giong Ong To 2), while maintaining routine tracking where error margins are low. In general, comparative damping metrics provide a practical basis for assessing maintenance and tailoring monitoring strategies for long-term safety and reliability.
5.4 Natural Frequency Variability between Sites
According to documents [5,56,62], the frequencies excited by traffic loads range from 1.6 to 2.2 Hz, which is less than the natural frequency of the bridge. The shape of the ambient spectrum of acceleration signals measured under random traffic loads at other times remains fairly consistent, as shown in Fig. 16. The natural frequencies recorded in each test are presented in Table 7.
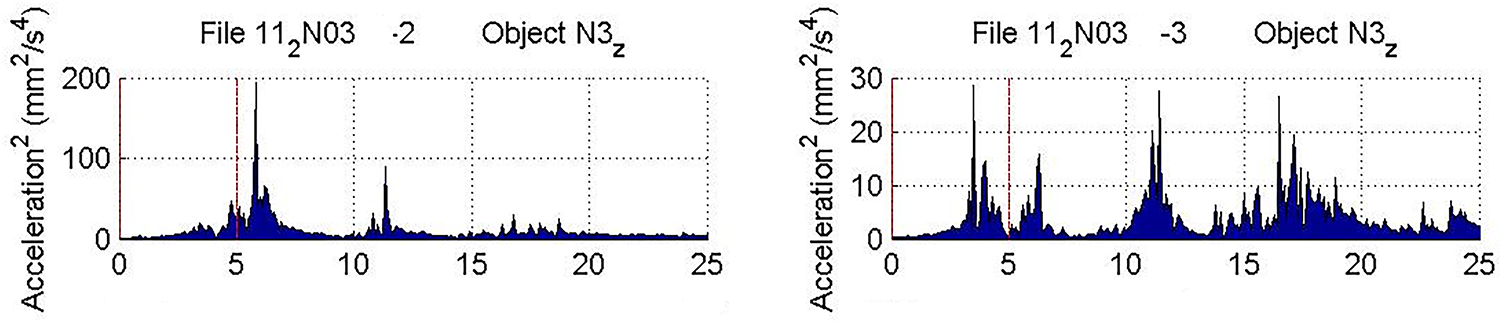
Figure 16: Power density spectrum in the Sai Gon bridge
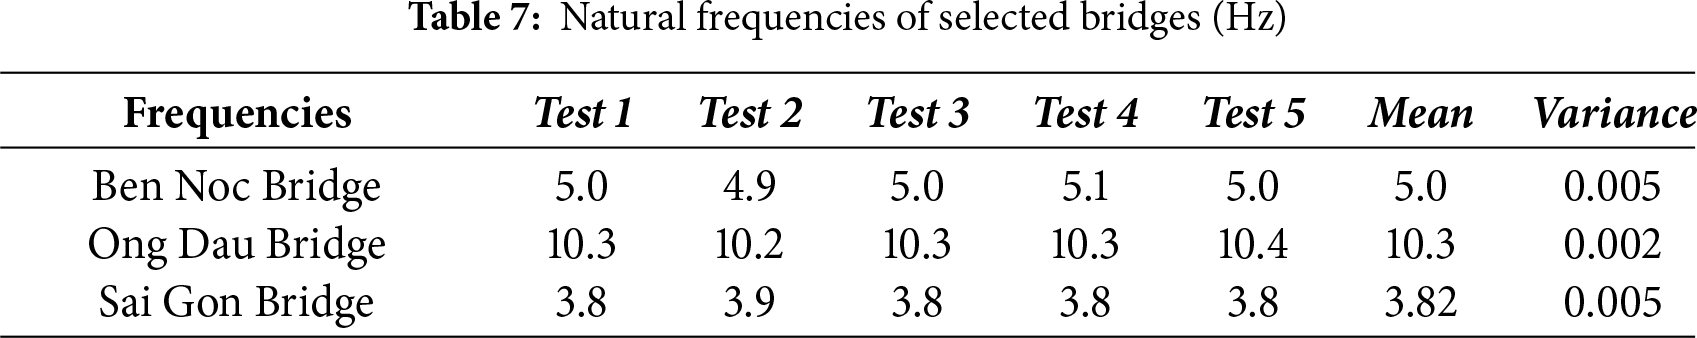
The Ong Dau Bridge shows the lowest variance in natural frequency (0.002), indicating exceptionally consistent measurements and a stable structural response. Ben Noc and Sai Gon Bridges each have slightly higher variance (0.005), but still exhibit consistent behavior under varying conditions. Differences in mean frequencies probably reflect structural design: The higher mean suggests greater global stiffness, while the lower mean implies more flexibility as shown in Fig. 17. The uniformly low variances validate the SHM approach as a reliable baseline for change detection. Routine tracking of natural frequencies will allow early identification of stiffness loss and help to maintain long-term safety and performance.
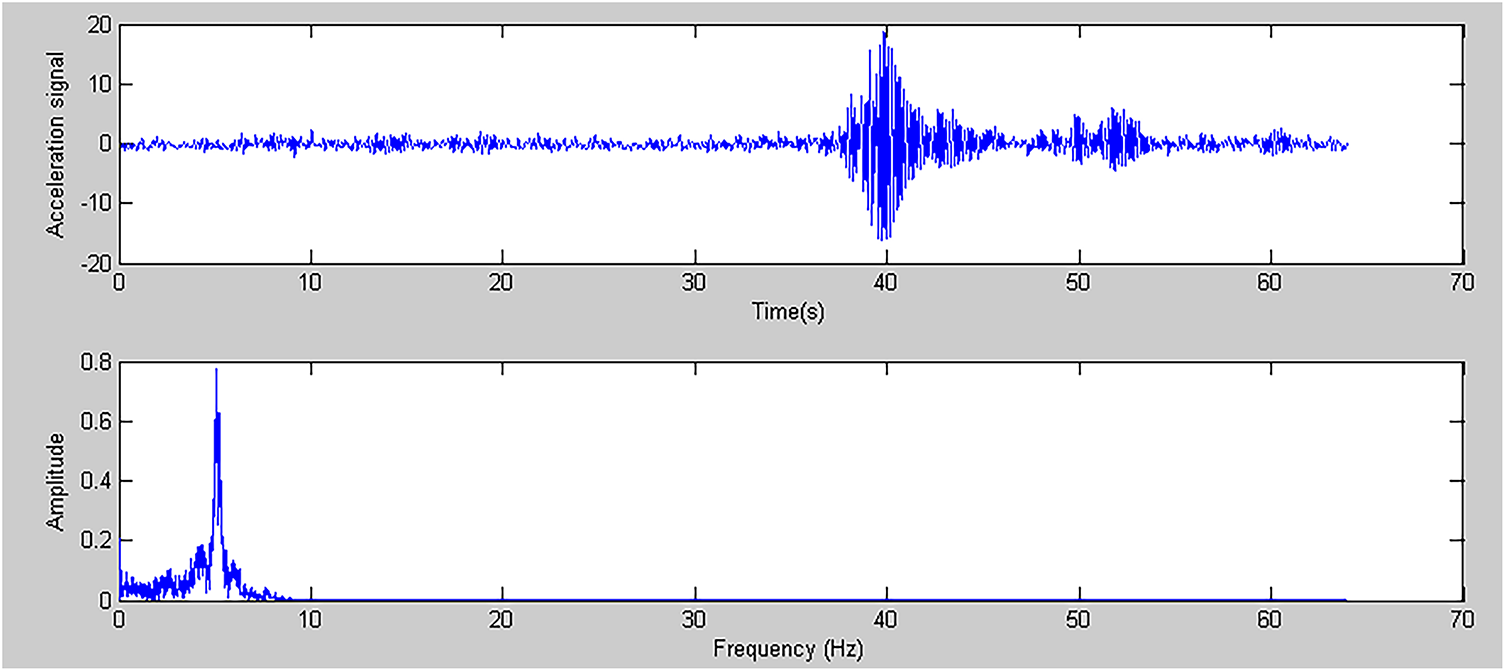
Figure 17: Relationship between the measured signal in the time domain and the signal in the frequency domain on the Saigon Bridge
At Sai Gon Bridge, for more than a year has been monitored similar to the following:
Table 8 shows that the natural frequency is essentially constant (3.8 to 3.9 Hz) across times of day and traffic mixes. Morning/afternoon with pickups and buses yield 3.8 and 3.9 Hz, while night traffic dominated by large containers remains 3.8 Hz. Heavier container loads therefore do not depress the frequency relative to lighter vehicles, indicating a low live-load sensitivity. This narrow band and lack of drift point to stable stiffness, no evident degradation, and robust design. Continued periodic monitoring is still advisable to detect subtle changes early and ensure long-term safety.
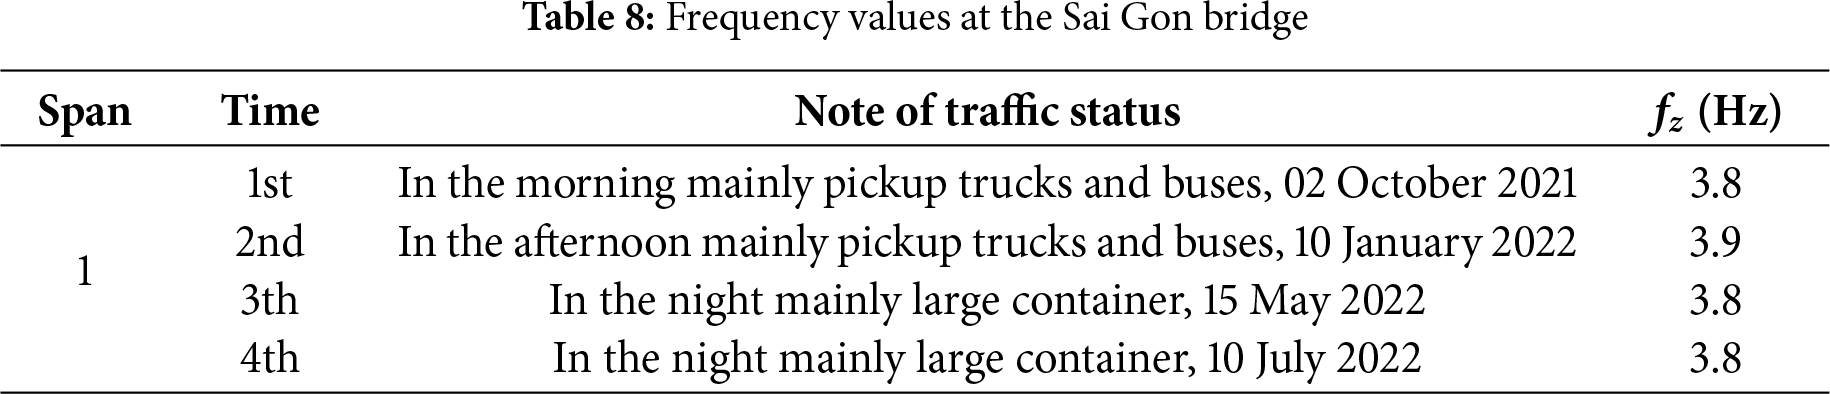
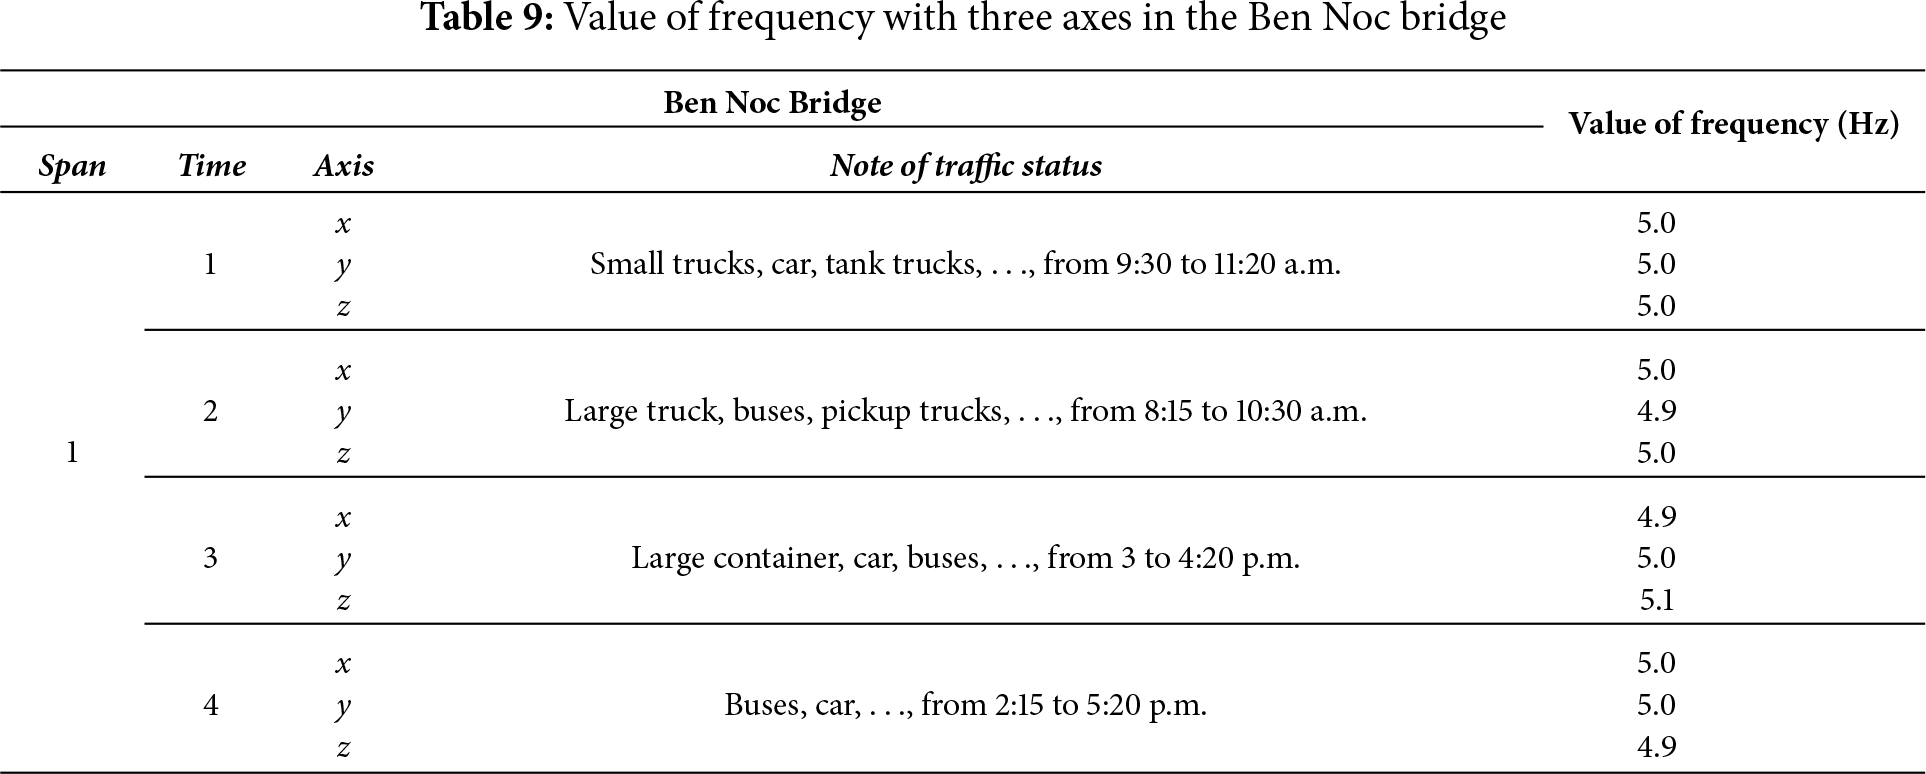
Table 9 shows natural frequencies clustered around 5.0 Hz in spans 1–4 and axes x–z, with only a 4.9–5.1 Hz spread despite differing traffic and times. The peak is 5.1 Hz (Span 3, z) and the minimum is 4.9 Hz (Span 2, y; Span 3, x; Span 4, z). This narrow band indicates a directionally consistent response and limited sensitivity to live-load variability, corroborating earlier statistics (mean 5.0 Hz; variance 0.005). Overall, the bridge exhibits stable global stiffness; continued multi-axis tracking is recommended to detect subtle degradation over time.
The results of this study demonstrate that vibration measurements induced by actual traffic loads can provide reliable estimates of the natural frequency, damping ratio, deflection, and impact (dynamic amplification) coefficients for in-service bridges without interrupting traffic. By combining time–frequency analysis with carefully selected load segments and mid-span measurements on the central beam, the extracted modal indicators remain stable under comparable operational conditions and allow quantification of variability across repeated runs. In contrast to UAV or computer-vision-based frameworks that focus primarily on surface condition assessment [34–36], the proposed approach targets dynamic response features that directly reflect stiffness, energy dissipation capacity, and serviceability. These parameters are also valuable inputs for resilience-oriented evaluations.
The time–frequency workflow employed, based on the short-time Fourier transform (STFT), is well suited for non-stationary responses generated by mixed traffic streams. Decomposing and analyzing each wave packet or modal component allows overlapping contributions to be separated and reduces spectral smearing, thereby improving estimates for lightly damped structures. This approach is consistent with modern signal processing theory on time–frequency localization and wavelet-based modal separation [75,76]. Compared to traditional power spectral density (PSD) methods prevalent in bridge SHM practice [3,8,16,69], the present strategy uses short windows tuned to the modal bandwidths observed in service, balancing the time–frequency trade-off to preserve transient dynamics while maintaining sufficient frequency resolution. A sampling rate of 512 Hz satisfies the Nyquist criterion for dominant bridge modes under traffic, typically below 50 Hz. Detrending and 20–80 Hz bandpass filtering remove quasi-static drift and high-frequency noise prior to signal segmentation. The grouping of events by vehicle type, speed, and ambient temperature improves the signal-to-noise ratio and supports the repeatability analysis, which is essential for operational modal analysis [78,79]. Damping ratios were estimated using the half-power bandwidth method around spectral peaks and cross-checked with logarithmic decrement on free-decay tails where feasible, thus reducing bias from short records or overlapping modes [63,64].
The measurement location—the mid-span of the central beam in the first span—was selected because bending moments are maximized at the mid-span for dominant flexural modes under moving loads, it is geometrically representative of the global response while remaining sufficiently distant from bearings and joints to minimize boundary condition artefacts, and it experiences the heaviest lane load, providing a high signal-to-noise ratio [2,5,57,62]. Under similar conditions, defined here as three-axle trucks traveling at 40 ± 5 km/h and ambient temperatures between 25°C and 28°C, the natural frequency is a global indicator and may be insufficient to localize damage because small spatially localized stiffness losses may not cause uniquely identifiable frequency changes, while environmental variations can mask these changes [11,51,80]. Therefore, the study combines natural frequency with deflection, impact coefficient, and damping ratio to provide complementary information on stiffness, dynamic amplification, and energy dissipation. Modal shape-sensitive indices, such as curvature or modal strain energy, are recommended for integration into long-term monitoring to enhance damage localization capability.
The relatively high percentage errors reported in Table 3 were explicitly analyzed rather than overlooked. Potential contributors include mounting tolerances and minor sensor slip under repeated live loads, unmodeled vehicle–bridge interaction producing transient dynamic amplification, temperature drift, and environmental influences altering stiffness during measurement, and spectral leakage when events are truncated by the analysis window. These factors are consistent with the SHM challenges summarized in Rizzo and Enshaeian [8]. They were mitigated through repeated calibration of LVDTs and accelerometers, event stratification by vehicle class/speed/temperature, consistent filtering and Welch averaging for PSDs, and cross-validation of damping estimates using two methods. The persistence of consistent trends across repeats indicates that, despite the inflated absolute errors in some runs, the comparative inferences between runs and between bridges remain robust.
Differences in the mean and variance of deflection and damping between Giong Ong To 2 and Giong Ong To New are plausibly explained by variations in materials and inherent damping (for example, concrete mix design, steel grade, composite action affecting stiffness and loss factors), structural design (span length, skewness, girder spacing and support conditions affecting modal frequencies and deflection envelopes), maintenance condition and deterioration (corrosion, fatigue cracking, bearing wear, creep/shrinkage, and loss of prestress altering stiffness and damping over time), and environmental exposure (differences in temperature/humidity regimes and foundation stiffness due to scour or soil–structure interaction). These factors account for cross-bridge dispersion beyond measurement artifacts and underscore the necessity of site-specific calibration prior to cross-asset benchmarking.
In the context of current SHM practice, most systems emphasize digitized visual inspections and UAV inspections [34,35], computer vision for non-contact deformation/crack tracking [36], and vehicle-assisted methods for global indicator acquisition [12]. Comprehensive reviews have cataloged AI-enabled SHM workflows [3,8] but still predominantly rely on fixed-sensor or controlled-load datasets. The contribution of this study lies in operationalizing dynamic parameter extraction from routine traffic in a reproducible pipeline (documented in Section 4.1), thus linking visual condition data with modal health indicators and improving readiness for continuous monitoring.
The dynamic parameters estimated here can serve as inputs to resilience-oriented performance models, where functionality loss and recovery curves can be parameterized by shifts in natural frequency and increases in damping ratio associated with damage and repairs; impact coefficient and deflection envelopes inform serviceability limits under traffic and extreme events; and integration with resilience frameworks, such as FEMA P-58 or Bruneau’s resilience triangle, supports quantification of downtime and repairability. Combining routine traffic-based dynamic indicators with periodic visual/UAV surveys merges global and local evidence streams, consistent with the multievidence perspective advocated in recent resilience literature. For practical deployments, primary sensors should be located at mid-span of beams with the highest lane loading, events should be stratified by vehicle type/speed/temperature, redundant damping estimators should be used, seasonal baselines should be tracked to decouple damage from environmental variability, and modal-shape-sensitive measurements should be added where feasible to support damage localization.
This study shows that the deflection and impact factor are strongly conditioned by live-traffic variability (axle loads and speeds), leading to relatively high scatter and reduced reliability for inferring changes in load-bearing capacity from short field campaigns. This behavior is consistent with theory: traffic-induced responses embed empirical variability that can mask subtle stiffness changes. On the contrary, natural frequency and, to a lesser extent—modal damping are less sensitive to instantaneous traffic conditions. Although damping estimates were occasionally affected by signal reception noise and were therefore not used as primary indicators here, natural frequency remained stable over time, providing a robust proxy for global stiffness and a practical screening metric for long-term integrity assessment. In short, the deflection/impact factor is informative yet traffic-dependent, whereas the natural frequency offers a more reliable baseline for ongoing health monitoring; continued observation can alert to emerging stiffness loss.
The present analysis is limited to two bridges, a specific loading context, and single-day measurements; Performance was not evaluated under seasonal and temperature cycles, extreme environmental events, and for structurally dissimilar bridges. Future work will broaden coverage to additional bridge typologies and deploy long-term monitoring to capture seasonal effects; incorporate damage-localization techniques (e.g., mode-shape curvature, Bayesian updating) with uncertainty quantification; and fuse complementary sensing modalities such as UAV imagery and strain measurements to enhance diagnostic specificity. Practically, the methodology supports rapid, nonintrusive condition assessment without traffic interruption, enabling maintenance prioritization and network-level resilience evaluation, and it is well suited for integration into continuous SHM systems that require real-time vibration-based feedback to trigger inspections and guide decision-making.
Acknowledgement: We acknowledge Nguyen Tat Thanh University, Ho Chi Minh City, Vietnam for supporting this study.
Funding Statement: This research did not receive any specific grant from funding agencies in the public, commercial, or not-for-profit sectors. All computational resources and research activities were supported independently by the authors.
Author Contributions: Trinh Thi Nhu Quynh: Conceptualization, Methodology, Software, Writing—original draft. Hoa-Cuc. Nguyen: Formal analysis, Visualization, Validation, Writing—review & editing. Bich-Ngoc. Mach: Formal analysis, Visualization, Methodology, Software. Thanh Q. Nguyen: Supervision, Project administration, Methodological review, Final approval of the manuscript. All authors reviewed the results and approved the final version of the manuscript.
Availability of Data and Materials: The dataset used and analyzed during the current study is available from the corresponding author upon reasonable request. All preprocessing pipelines and model codes used in this study are available upon request to support reproducibility and further research collaboration.
Ethics Approval: This study did not involve human participants, patient data, or animals. Field activities were limited to non-invasive vibration measurements on existing bridge structures using temporary wireless accelerometers. No images, license plates, or personally identifiable information were recorded. All measurements were conducted with permission from the bridge management authority, followed applicable safety regulations, did not alter the structure, and did not disrupt traffic. As the work does not involve human subjects or personal data, institutional ethics/IRB approval was not required under the authors’ institutional guidelines. Environmental impact was negligible; all devices were removed after testing.
Conflicts of Interest: The authors declare no conflicts of interest to report regarding the present study.
References
1. Wang D, Zhang Y, Pan Y, Peng B, Liu H, Ma R. An automated inspection method for the steel box girder bottom of long-span bridges based on deep learning. IEEE Access. 2020;8:94010–23. doi:10.1109/ACCESS.2020.2994275. [Google Scholar] [CrossRef]
2. Zhang J, Yang D, Ren WX, Yuan Y. Time-varying characteristics analysis of vehicle-bridge interaction system based on modified S-transform reassignment technique. Mech Syst Signal Process. 2021;160:107807. doi:10.1016/j.ymssp.2021.107807. [Google Scholar] [CrossRef]
3. Zinno R, Haghshenas SS, Guido G, Rashvand K, Vitale A, Sarhadi A. The state of the art of artificial intelligence approaches and new technologies in structural health monitoring of bridges. Appl Sci. 2023;13(1):97. doi:10.3390/app13010097. [Google Scholar] [CrossRef]
4. Turksezer ZI, Iacovino C, Giordano PF, Limongelli MP. Development and implementation of indicators to assess bridge inspection practices. J Constr Eng Manage. 2021;147(12):04021165. doi:10.1061/(asce)co.1943-7862.0002195. [Google Scholar] [CrossRef]
5. Yang Y, Zhang Y, Tan X. Review on vibration-based structural health monitoring techniques and technical codes. Symmetry. 2021;13(11):1998. doi:10.3390/sym13111998. [Google Scholar] [CrossRef]
6. Meng JY, Lui EM, Liu Y. Dynamic response of skew highway bridges. J Earthq Eng. 2001;5(2):205–23. doi:10.1080/13632460109350392. [Google Scholar] [CrossRef]
7. Rens KL, Nogueira CL, Transue DJ. Bridge management and nondestructive evaluation. J Perform Constr Facil. 2005;19(1):3–16. doi:10.1061/(asce)0887-3828(2005)19:. [Google Scholar] [CrossRef]
8. Rizzo P, Enshaeian A. Challenges in bridge health monitoring: a review. Sensors. 2021;21(13):4336. doi:10.3390/s21134336. [Google Scholar] [PubMed] [CrossRef]
9. Rocha H, Semprimoschnig C, Nunes JP. Sensors for process and structural health monitoring of aerospace composites: a review. Eng Struct. 2021;237:112231. doi:10.1016/j.engstruct.2021.112231. [Google Scholar] [CrossRef]
10. Zar A, Hussain Z, Akbar M, Rabczuk T, Lin Z, Li S, et al. Towards vibration-based damage detection of civil engineering structures: overview, challenges, and future prospects. Int J Mech Mater Des. 2024;20(3):591–662. doi:10.1007/s10999-023-09692-3. [Google Scholar] [CrossRef]
11. Salawu OS. Detection of structural damage through changes in frequency: a review. Eng Struct. 1997;19(9):718–23. doi:10.1016/S0141-0296(96)00149-6. [Google Scholar] [CrossRef]
12. Shokravi H, Shokravi H, Bakhary N, Heidarrezaei M, Rahimian Koloor SS, Petrů M. Vehicle-assisted techniques for health monitoring of bridges. Sensors. 2020;20(12):3460. doi:10.3390/s20123460. [Google Scholar] [PubMed] [CrossRef]
13. Stoura CD, Dimitrakopoulos EG. Additional damping effect on bridges because of vehicle-bridge interaction. J Sound Vib. 2020;476:115294. doi:10.1016/j.jsv.2020.115294. [Google Scholar] [CrossRef]
14. Yamaguchi H, Matsumoto Y, Kawarai K, Dammika AJ, Shahzad S, Takanami R. Damage detection based on modal damping change in bridges. Proc ICSBE. 2013;12:14–6. [Google Scholar]
15. Zini G, Giachetti A, Betti M, Bartoli G. Vibration signature effects on damping identification of a RC bridge under ambient vibrations. Eng Struct. 2024;298:116934. doi:10.1016/j.engstruct.2023.116934. [Google Scholar] [CrossRef]
16. Nguyen TQ. A data-driven approach to structural health monitoring of bridge structures based on the discrete model and FFT-deep learning. J Vib Eng Technol. 2021;9(8):1959–81. doi:10.1007/s42417-021-00343-5. [Google Scholar] [CrossRef]
17. Sinha U, Chakraborty S. Detection of damages in structures using changes in stiffness and damping. In: Recent advances in computational mechanics and simulations. Singapore: Springer; 2020. p. 259–71. doi:10.1007/978-981-15-8138-0_21. [Google Scholar] [CrossRef]
18. Su X, Liu G, Kang H, Zhang W, Liu T, Wang Y. Study on dynamic behaviors of the cable-cross-Tie system considering the vibration of the bridge deck. J Vib Eng Technol. 2025;13(1):126. doi:10.1007/s42417-024-01604-9. [Google Scholar] [CrossRef]
19. Omer M, Margetts L, Mosleh MH, Cunningham LS. Inspection of concrete bridge structures: case study comparing conventional techniques with a virtual reality approach. J Bridge Eng. 2021;26(10):05021010. doi:10.1061/(asce)be.1943-5592.0001759. [Google Scholar] [CrossRef]
20. Qu C, Tu G, Gao F, Sun L, Pan S, Chen D. Review of bridge structure damping model and identification method. Sustainability. 2024;16(21):9410. doi:10.3390/su16219410. [Google Scholar] [CrossRef]
21. Liu B, Yang S, Li W, Zhang M. Damping dissipation properties of rubberized concrete and its application in anti-collision of bridge piers. Constr Build Mater. 2020;236:117286. doi:10.1016/j.conbuildmat.2019.117286. [Google Scholar] [CrossRef]
22. Liu P, Shi Y, Xiong R, Tang P. Quantifying the reliability of defects located by bridge inspectors through human observation behavioral analysis. Dev Built Environ. 2023;14:100167. doi:10.1016/j.dibe.2023.100167. [Google Scholar] [CrossRef]
23. Jalaei F, Zhang J, Mcneil-Ayuk N, McLeod C. Environmental life cycle assessment (LCA) for design of climate-resilient bridges—a comprehensive review and a case study. Int J Constr Manage. 2025;25(1):99–114. doi:10.1080/15623599.2024.2304479. [Google Scholar] [CrossRef]
24. Abudayyeh O, Abdel-Qader I, Nabulsi S, Weber J. Using non-destructive technologies and methods in Bridge management systems. J Urban Technol. 2004;11(1):63–76. doi:10.1080/1063073042000341989. [Google Scholar] [CrossRef]
25. Giraldo DF, Dyke SJ, Caicedo JM. Damage detection accommodating varying environmental conditions. Struct Health Monit. 2006;5(2):155–72. doi:10.1177/1475921706057987. [Google Scholar] [CrossRef]
26. Abdelkhalek S, Zayed T. Comprehensive inspection system for concrete bridge deck application: current situation and future needs. J Perform Constr Facil. 2020;34(5):03120001. doi:10.1061/(asce)cf.1943-5509.0001484. [Google Scholar] [CrossRef]
27. Yanmaz AM, Caner A, Berk A. Renovation of a safety-inspection methodology for river bridges. J Perform Constr Facil. 2007;21(5):382–9. doi:10.1061/(asce)0887-3828(2007)21:. [Google Scholar] [CrossRef]
28. Xu Y, Turkan Y. BrIM and UAS for bridge inspections and management. Eng Constr Archit Manage. 2019;27(3):785–807. doi:10.1108/ecam-12-2018-0556. [Google Scholar] [CrossRef]
29. Akgul F. Inspection and evaluation of a network of concrete bridges based on multiple NDT techniques. Struct Infrastruct Eng. 2021;17(8):1076–95. doi:10.1080/15732479.2020.1790016. [Google Scholar] [CrossRef]
30. Nguyen TD, Nguyen TQ, Nhat TN, Nguyen-Xuan H, Ngo NK. A novel approach based on viscoelastic parameters for bridge health monitoring: a case study of Saigon bridge in Ho Chi Minh City-Vietnam. Mech Syst Signal Process. 2020;141:106728. doi:10.1016/j.ymssp.2020.106728. [Google Scholar] [CrossRef]
31. Abdollahi-Mamoudan F, Ibarra-Castanedo C, Maldague XPV. Non-destructive testing and evaluation of hybrid and advanced structures: a comprehensive review of methods, applications, and emerging trends. Sensors. 2025;25(12):3635. doi:10.3390/s25123635. [Google Scholar] [PubMed] [CrossRef]
32. Abdallah AM, Atadero RA, Ozbek ME. A state-of-the-art review of bridge inspection planning: current situation and future needs. J Bridge Eng. 2022;27(2):03121001. doi:10.1061/(asce)be.1943-5592.0001812. [Google Scholar] [CrossRef]
33. Beltrami C, Bianchi S, Cervio M, Anghileri M, Felicetti R, Quattrone A, et al. Bridge visual inspections: experience of local authorities and the case study of the Corso Grosseto viaduct. In: Bridge maintenance, safety, management, life-cycle sustainability and innovations. Boca Raton, FL, USA: CRC Press; 2021. [Google Scholar]
34. Cano M, Pastor JL, Tomás R, Riquelme A, Asensio JL. A new methodology for bridge inspections in linear infrastructures from optical images and HD videos obtained by UAV. Remote Sens. 2022;14(5):1244. doi:10.3390/rs14051244. [Google Scholar] [CrossRef]
35. Talebi S, Wu S, Al-Adhami M, Shelbourn M, Serugga J. The development of a digitally enhanced visual inspection framework for masonry bridges in the UK. Constr Innov. 2022;22(3):624–46. doi:10.1108/ci-10-2021-0201. [Google Scholar] [CrossRef]
36. Marchewka A, Ziółkowski P, Aguilar-Vidal V. Framework for structural health monitoring of steel bridges by computer vision. Sensors. 2020;20(3):700. doi:10.3390/s20030700. [Google Scholar] [PubMed] [CrossRef]
37. He Z, Li W, Salehi H, Zhang H, Zhou H, Jiao P. Integrated structural health monitoring in bridge engineering. Autom Constr. 2022;136:104168. doi:10.1016/j.autcon.2022.104168. [Google Scholar] [CrossRef]
38. Feroz S, Abu Dabous S. UAV-based remote sensing applications for bridge condition assessment. Remote Sens. 2021;13(9):1809. doi:10.3390/rs13091809. [Google Scholar] [CrossRef]
39. Mousa MA, Yussof MM, Udi UJ, Nazri FM, Kamarudin MK, Parke GAR, et al. Application of digital image correlation in structural health monitoring of bridge infrastructures: a review. Infrastructures. 2021;6(12):176. doi:10.3390/infrastructures6120176. [Google Scholar] [CrossRef]
40. Wei B, Jia J, Bai Y, Du X, Guo B, Guo H. Seismic resilience assessment of bridges considering both maximum and residual displacements. Eng Struct. 2023;291:116420. doi:10.1016/j.engstruct.2023.116420. [Google Scholar] [CrossRef]
41. Mandirola M, Casarotti C, Peloso S, Lanese I, Brunesi E, Senaldi I. Use of UAS for damage inspection and assessment of bridge infrastructures. Int J Disaster Risk Reduct. 2022;72:102824. doi:10.1016/j.ijdrr.2022.102824. [Google Scholar] [CrossRef]
42. Kildashti K, Makki Alamdari M, Kim CW, Gao W, Samali B. Drive-by-bridge inspection for damage identification in a cable-stayed bridge: numerical investigations. Eng Struct. 2020;223:110891. doi:10.1016/j.engstruct.2020.110891. [Google Scholar] [CrossRef]
43. Potenza F, Rinaldi C, Ottaviano E, Gattulli V. A robotics and computer-aided procedure for defect evaluation in bridge inspection. J Civ Struct Health Monit. 2020;10(3):471–84. doi:10.1007/s13349-020-00395-3. [Google Scholar] [CrossRef]
44. Mata R, Nuñez E, Amaya E, Rojas-Asuero H, Santa-María H, Vicencio F. Seismic resilience of simply supported bridges subjected to subduction earthquakes. Structures. 2025;79:109408. doi:10.1016/j.istruc.2025.109408. [Google Scholar] [CrossRef]
45. Lee JH, Ansari A, An H, Jeong JY. Seismic loss and resilience modeling of bridges in soft soils: towards the design of sustainable transportation infrastructure facilities. Sustain Resilient Infrastruct. 2024;9(5):473–95. doi:10.1080/23789689.2024.2328979. [Google Scholar] [CrossRef]
46. Khan MSA, Kabir G, Billah M, Dutta S. Enhancing seismic resilience of bridge infrastructure using Bayesian belief network approach. Eng Proc. 2024;76(1):21. doi:10.3390/engproc2024076021. [Google Scholar] [CrossRef]
47. Siringoringo DM, Fujino Y. System identification of suspension bridge from ambient vibration response. Eng Struct. 2008;30(2):462–77. doi:10.1016/j.engstruct.2007.03.004. [Google Scholar] [CrossRef]
48. Zhu HP, He B, Chen XQ. Detection of structural damage through changes in frequency. Wuhan Univ J Nat Sci. 2005;10(6):1069–73. doi:10.1007/bf02832469. [Google Scholar] [CrossRef]
49. Bjørheim F, Siriwardane SC, Pavlou D. A review of fatigue damage detection and measurement techniques. Int J Fatigue. 2022;154:106556. doi:10.1016/j.ijfatigue.2021.106556. [Google Scholar] [CrossRef]
50. Colakoglu M. Description of fatigue damage using a damping monitoring technique. Turk J Eng Environ Sci. 2023;27(2):125–30. [Google Scholar]
51. Fan W, Qiao P. Vibration-based damage identification methods: a review and comparative study. Struct Health Monit. 2011;10(1):83–111. doi:10.1177/1475921710365419. [Google Scholar] [CrossRef]
52. Avci O, Abdeljaber O, Kiranyaz S, Hussein M, Gabbouj M, Inman DJ. A review of vibration-based damage detection in civil structures: from traditional methods to machine learning and deep learning applications. Mech Syst Signal Process. 2021;147:107077. doi:10.1016/j.ymssp.2020.107077. [Google Scholar] [CrossRef]
53. Mishra M, Lourenço PB, Ramana GV. Structural health monitoring of civil engineering structures by using the Internet of Things: a review. J Build Eng. 2022;48:103954. doi:10.1016/j.jobe.2021.103954. [Google Scholar] [CrossRef]
54. Hou R, Xia Y. Review on the new development of vibration-based damage identification for civil engineering structures: 2010–2019. J Sound Vib. 2021;491:115741. doi:10.1016/j.jsv.2020.115741. [Google Scholar] [CrossRef]
55. Burgos DAT, Vargas RCG, Pedraza C, Agis D, Pozo F. Damage identification in structural health monitoring: a brief review from its implementation to the use of data-driven applications. Sensors. 2020;20(3):733. doi:10.3390/s20030733. [Google Scholar] [PubMed] [CrossRef]
56. Verstrynge E, Lacidogna G, Accornero F, Tomor A. A review on acoustic emission monitoring for damage detection in masonry structures. Constr Build Mater. 2021;268:121089. doi:10.1016/j.conbuildmat.2020.121089. [Google Scholar] [CrossRef]
57. Zhang C, Mousavi AA, Masri SF, Gholipour G, Yan K, Li X. Vibration feature extraction using signal processing techniques for structural health monitoring: a review. Mech Syst Signal Process. 2022;177:109175. doi:10.1016/j.ymssp.2022.109175. [Google Scholar] [CrossRef]
58. Sony S, Dunphy K, Sadhu A, Capretz M. A systematic review of convolutional neural network-based structural condition assessment techniques. Eng Struct. 2021;226:111347. doi:10.1016/j.engstruct.2020.111347. [Google Scholar] [CrossRef]
59. Ashmawi A, Nguyen P, Jawdhari A. State-of-the-art review of machine learning applications for bridge inspections. Adv Struct Eng. 2025;177:13694332251381220. doi:10.1177/13694332251381220. [Google Scholar] [CrossRef]
60. Wang L, Nagarajaiah S, Shi W, Zhou Y. Semi-active control of walking-induced vibrations in bridges using adaptive tuned mass damper considering human-structure-interaction. Eng Struct. 2021;244:112743. doi:10.1016/j.engstruct.2021.112743. [Google Scholar] [CrossRef]
61. Hwang D, Kim S, Kim HK. Long-term damping characteristics of twin cable-stayed bridge under environmental and operational variations. J Bridge Eng. 2021;26(9):04021062. doi:10.1061/(asce)be.1943-5592.0001761. [Google Scholar] [CrossRef]
62. Yang DS, Wang CM. Modal properties identification of damped bridge using improved vehicle scanning method. Eng Struct. 2022;256:114060. doi:10.1016/j.engstruct.2022.114060. [Google Scholar] [CrossRef]
63. Abdel-Ghaffar AM, Scanlan RH. Ambient vibration studies of golden gate bridge: I. Suspended structure. J Eng Mech. 1985;111(4):463–82. doi:10.1061/(ASCE)0733-9399(1985)111:4(463). [Google Scholar] [CrossRef]
64. Brownjohn JMW, Xia PQ, Haskett TL, Ko JM. Ambient vibration re-testing and operational modal analysis of the Humber suspension bridge. Eng Struct. 2010;32(8):2003–18. doi:10.1016/j.engstruct.2010.02.034. [Google Scholar] [CrossRef]
65. Daniotti N, Cheynet E, Jakobsen JB, Snæbjörnsson J. Damping estimation from full-scale traffic-induced vibrations of a suspension bridge. In: Proceedings of the ASCE International Conference on Computing in Civil Engineering 2019; 2019 Jun 17–19; Atlanta, GA, USA. p. 171–9. doi:10.1061/9780784482445.022. [Google Scholar] [CrossRef]
66. Li J, Zhu X, Law SS, Samali B. Time-varying characteristics of bridges under the passage of vehicles using synchroextracting transform. Mech Syst Signal Process. 2020;140:106727. doi:10.1016/j.ymssp.2020.106727. [Google Scholar] [CrossRef]
67. Liang L, Li X, Zheng J, Lei K, Gou H. Structure-borne noise from long-span steel truss cable-stayed bridge under damping pad floating slab: experimental and numerical analysis. Appl Acoust. 2020;157:106988. doi:10.1016/j.apacoust.2019.07.036. [Google Scholar] [CrossRef]
68. Kim S, Park KY, Kim HK, Lee HS. Damping estimates from reconstructed displacement for low-frequency dominant structures. Mech Syst Signal Process. 2020;136:106533. doi:10.1016/j.ymssp.2019.106533. [Google Scholar] [CrossRef]
69. Quang MT, Sousa HS, Duc BN, Matos JC, Bento AM, Ferradosa T, et al. Effect of bridge foundation stiffness on dynamic behavior of bridge structure. In: Proceedings of the IABSE Congress: Engineering for Sustainable Development; 2023 Sep 20–22; New Delhi, India. p. 500–7. doi:10.2749/newdelhi.2023.0500. [Google Scholar] [CrossRef]
70. Lu X, Sun L, Chang KC, Kim CW, Han Z. Damage localization using low-frequency bridge acceleration component under a moving vehicle. Eng Struct. 2025;325:119366. doi:10.1016/j.engstruct.2024.119366. [Google Scholar] [CrossRef]
71. Tavares A, Di Lorenzo E, Cornelis B, Peeters B, Gryllias K, Desmet W. Automated damage localization for lightweight plates. In: Proceedings of the Structure Health Monitoring of Intelligent Infrastructure 10th Conference (SHMII-10); 2021 Jun 30–Jul 2; Porto, Portugal. [Google Scholar]
72. Zhang W, Yuan H. Corrosion fatigue effects on life estimation of deteriorated bridges under vehicle impacts. Eng Struct. 2014;71:128–36. doi:10.1016/j.engstruct.2014.04.004. [Google Scholar] [CrossRef]
73. Jiang X, Cao D, Qiang X, Xu C. Study on fatigue performance of steel bridge welded joints considering initial defects. J Constr Steel Res. 2024;212:108309. doi:10.1016/j.jcsr.2023.108309. [Google Scholar] [CrossRef]
74. Abu Dabous S, Feroz S. Condition monitoring of bridges with non-contact testing technologies. Autom Constr. 2020;116:103224. doi:10.1016/j.autcon.2020.103224. [Google Scholar] [CrossRef]
75. Mallat SG. A wavelet tour of signal processing. San Diego, CA, USA: Academic Press; 1998. [Google Scholar]
76. Kordestani H, Pegah E. A study on the direct application of the gaussian kernel smoothing filter for bridge health monitoring. Infrastructures. 2025;10(3):58. doi:10.3390/infrastructures10030058. [Google Scholar] [CrossRef]
77. Magalhães F, Cunha Á, Caetano E, Brincker R. Damping estimation using free decays and ambient vibration tests. Mech Syst Signal Process. 2010;24(5):1274–90. doi:10.1016/j.ymssp.2009.02.011. [Google Scholar] [CrossRef]
78. Carden EP, Fanning P. Vibration based condition monitoring: a review. Struct Health Monit. 2004;3(4):355–77. doi:10.1177/1475921704047500. [Google Scholar] [CrossRef]
79. Loh CH, Chen MC, Chao SH. Stochastic subspace identification and operational modal analysis of an arch bridge. Sens Smart Struct Technol Civ Mech Aerosp Syst. 2012;8345:39–50. doi:10.1117/12.912514. [Google Scholar] [CrossRef]
80. Fan W, Chen Y, Li J, Sun Y, Feng J, Hassanin H, et al. Machine learning applied to the design and inspection of reinforced concrete bridges: resilient methods and emerging applications. Structures. 2021;33:3954–63. doi:10.1016/j.istruc.2021.06.110. [Google Scholar] [CrossRef]
Cite This Article
 Copyright © 2026 The Author(s). Published by Tech Science Press.
This work is licensed under a Creative Commons Attribution 4.0 International License , which permits unrestricted use, distribution, and reproduction in any medium, provided the original work is properly cited.
 Downloads
 Citation Tools