
 Submit a Paper
 Propose a Special lssue
 Open Access
ARTICLE

Winter–Summer Monitoring and Direct Comparison of Epoxy Pavement on Fatigue-Prone Orthotropic Steel Deck Details in Service on Cable-Stayed Bridges
1 School of Rail Transit, Hunan Railway Professional Technology College, Zhuzhou, 412001, China
2 Department of Civil Engineering and Smart Cities, Shantou University, Shantou, 515063, China
* Corresponding Author: Zhiwen Zhu. Email:
(This article belongs to the Special Issue: Resilient and Sustainable Infrastructure: Monitoring, Safety, and Durability)
Structural Durability & Health Monitoring 2026, 20(2), 18 https://doi.org/10.32604/sdhm.2025.072805
Received 03 September 2025; Accepted 12 December 2025; Issue published 31 March 2026
 View Full Text
 Download PDF
Abstract
Using field monitoring data, this study directly compares the stress responses of fatigue-prone orthotropic steel deck (OSD) details with an epoxy asphalt concrete (EAC) overlay during in-service winter and summer seasons. This study was conducted on the E’dong Yangtze River Bridge in China, a cable-stayed bridge featuring a main span of 936 m and an EAC-paved deck pavement. The findings reveal that across all OSD details, stress levels and loading cycles are generally higher in summer than in winter. The most pronounced increase occurs at the rib-to-deck (RD) detail, particularly on the deck plate side. Under wheel loading, the deck plate side of the RD detail experiences both overall and local stress effects, which are more pronounced in summer. This indicates that high summer temperatures significantly reduce the elastic modulus of the epoxy asphalt pavement, decreasing the pavement layer’s contribution to the stiffness of the bridge deck and increasing the risk of fatigue damage to the OSD. In addition, among all OSD details, the RD detail can distinctly capture the effect of individual truck axles within axle groups, with each axle producing a separate and identifiable stress peak. In contrast, the three rib-to-floor weld details and the Cutout detail only reflect the axle group as a whole, indicating lower fatigue loading cycles at these locations.Keywords
With the rapid expansion of transportation networks, long-span steel bridges have become increasingly vital in modern transportation infrastructure. Orthotropic steel decks (OSD) are widely used worldwide because they offer several advantages, including high structural integrity, lightweight, good ductility, low structural height, and strong load-bearing capacity [1–3]. Based on available data, more than 6000 OSD bridges have been built worldwide [4]. Despite this widespread use, the fatigue performance of OSD under long-term service, particularly under the combined influence of random traffic loads and environmental conditions, remains a key factor affecting the safety and durability of these bridges.
To enhance driving comfort and reduce the impact of vehicle loads on steel bridge decks, a pavement layer is commonly applied. The choice of deck pavement material is a key consideration in the design of long-span cable-stayed bridges [5–8]. Epoxy asphalt overlay was first used in 1967 on the San Mateo-Hayward Bridge in the United States [9]. Subsequently, the use of epoxy asphalt concrete (EAC) on OSD was rapidly adopted worldwide [10]. Most long-span bridges in service today employ EAC as the deck pavement material due to factors such as economic considerations and construction techniques [11].
Among the many factors influencing the fatigue performance of OSD, the properties of deck pavement materials are particularly important. Epoxy asphalt, a commonly used deck pavement material, exhibits significant temperature-dependent changes in its elastic modulus, which strongly affect the mechanical behavior of OSD. As temperature increases, the elastic modulus of epoxy asphalt pavement layers decreases rapidly, reducing the stiffness of the deck and altering stress distribution, thereby impacting the fatigue life of the OSD [12]. This effect is particularly pronounced during high-temperature seasons and can lead to fatigue cracking at critical OSD details, compromising the serviceability and durability of the bridge [13]. Given that OSDs are complex welded structures, repeated loading from concentrated wheel loads on the deck may induce fatigue cracking at various fatigue-prone locations [14–16].
Numerous studies have investigated stress monitoring of fatigue-prone details in OSD, which can be divided into two categories: research on fatigue-prone details within the UHPC (Ultra-High Performance Concrete)-deck plate composite system, and comparative studies between the UHPC-deck plate composite system and EAC overlay. Zhu et al. [17] monitored fatigue stress in critical details of a UHPC-deck plate composite system and found that the composite structure substantially reduced fatigue stress in these areas. Zhu et al. [18] also conducted stress monitoring and finite element analysis on two types of Cutout details in a self-anchored suspension bridge with an EAC overlay, showing that stress concentrations at these details significantly contributed to early crack propagation. Wang et al. [19] monitored fatigue-prone details of an asphalt concrete pavement on a bridge and found that the EAC pavement remained throughout the test period. The stress improvement in fatigue-sensitive regions 1 to 4 under low-temperature conditions was 80%, 14%, 32%, 46%, respectively. Qin et al. [20] compared the fatigue stress of critical details in UHPC-deck plate composite systems and EAC pavements through stress monitoring, concluding that the flexural stiffness of the UHPC-deck plate composite system was significantly higher than that of EAC pavement, and that the fatigue life of EAC pavement did not meet code requirements. Li and Zhu [21] reported a temperature difference of up to 19°C between the top and bottom surfaces of an EAC pavement composite system during peak summer conditions and observed that the fatigue stress life of critical details in summer was only 19.1 years, whereas in winter, it exceeded 100 years. Zeng et al. [22] conducted dynamic and static stress monitoring on EAC, but did not specifically examine fatigue-prone details in OSD. Viet [23] investigated the fatigue performance of EAC pavement material, with a focus on the bond interface between the epoxy pavement layer and the steel deck rather than on the fatigue behavior of critical OSD details.
Epoxy-paved steel decks have been in use for more than 10 years. Their fatigue stress responses under increasing random traffic loads, overloads, and large seasonal temperature variations have not been reported [24]. Continuous stress monitoring of fatigue-prone details was conducted on a 1514.9 m cable-stayed bridge with a 926 m main span, which has been in service for 13 years. Monitoring was performed during both winter and summer. The results provide valuable field data to support intelligent maintenance of long-span cable-stayed steel bridges and to guide the selection of overlay materials in future designs [25].
2 Typical Fatigue Cracks in OSD
The Severn Bridge in the United Kingdom, which opened to traffic in 1960, was constructed with an OSD system overlaid with EAC [26]. After 5 years of service, fatigue-induced cracks were observed in the OSD, primarily at three critical details: rib-to-deck (RD) welds, rib-to-floor-beam (RF) welds, and Cutout details [27,28]. Over the years, numerous instances of fatigue cracking in similar bridges have been reported across Europe, North America, and Asia, highlighting a significant concern in the design and maintenance of OSD bridges.
Typical fatigue damage in OSD generally originates and develops from three key fatigue-prone details [29,30], as shown in Fig. 1a. Specifically, C1, C2, C3, and C8 represent different cracking patterns at the RD connection [31], corresponding to the RD cracking at the weld root, RD cracking at the deck plate side (RD-D), and RD cracking at the rib wall (RD-R) in Fig. 1a. C4, C5, and C6 depict cracking patterns at the RF connection [32], corresponding to the RF at rib side (RF-R), RF at floor-beam side (RF-F), and RF at weld-around region (RF-W) in Fig. 1b. C7 represents the fatigue cracking pattern at the floor beam cutout [33,34], corresponding to the Cutout detail in Fig. 1b.
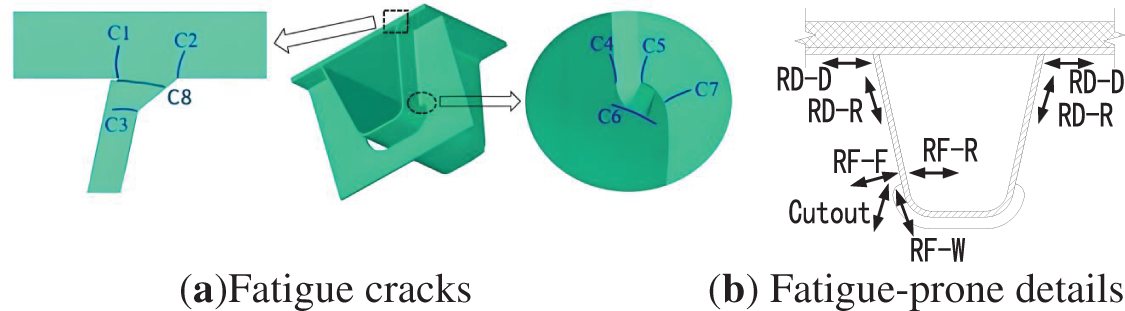
Figure 1: Classification of fatigue cracks and fatigue-prone details in OSD
3.1 Overview of the Test Bridge
A twin-tower spatial cable-stayed bridge was selected for this study. The main bridge has a span arrangement of [(67.5 × 3 + 72.5 + 926 + 72.5 + 67.5 × 3)] m, giving a total length of 1476 m. It is designed as a nine-span continuous semi-floating hybrid girder system. The side spans are supported by three auxiliary piers and one transition pier, as shown in Fig. 2a.
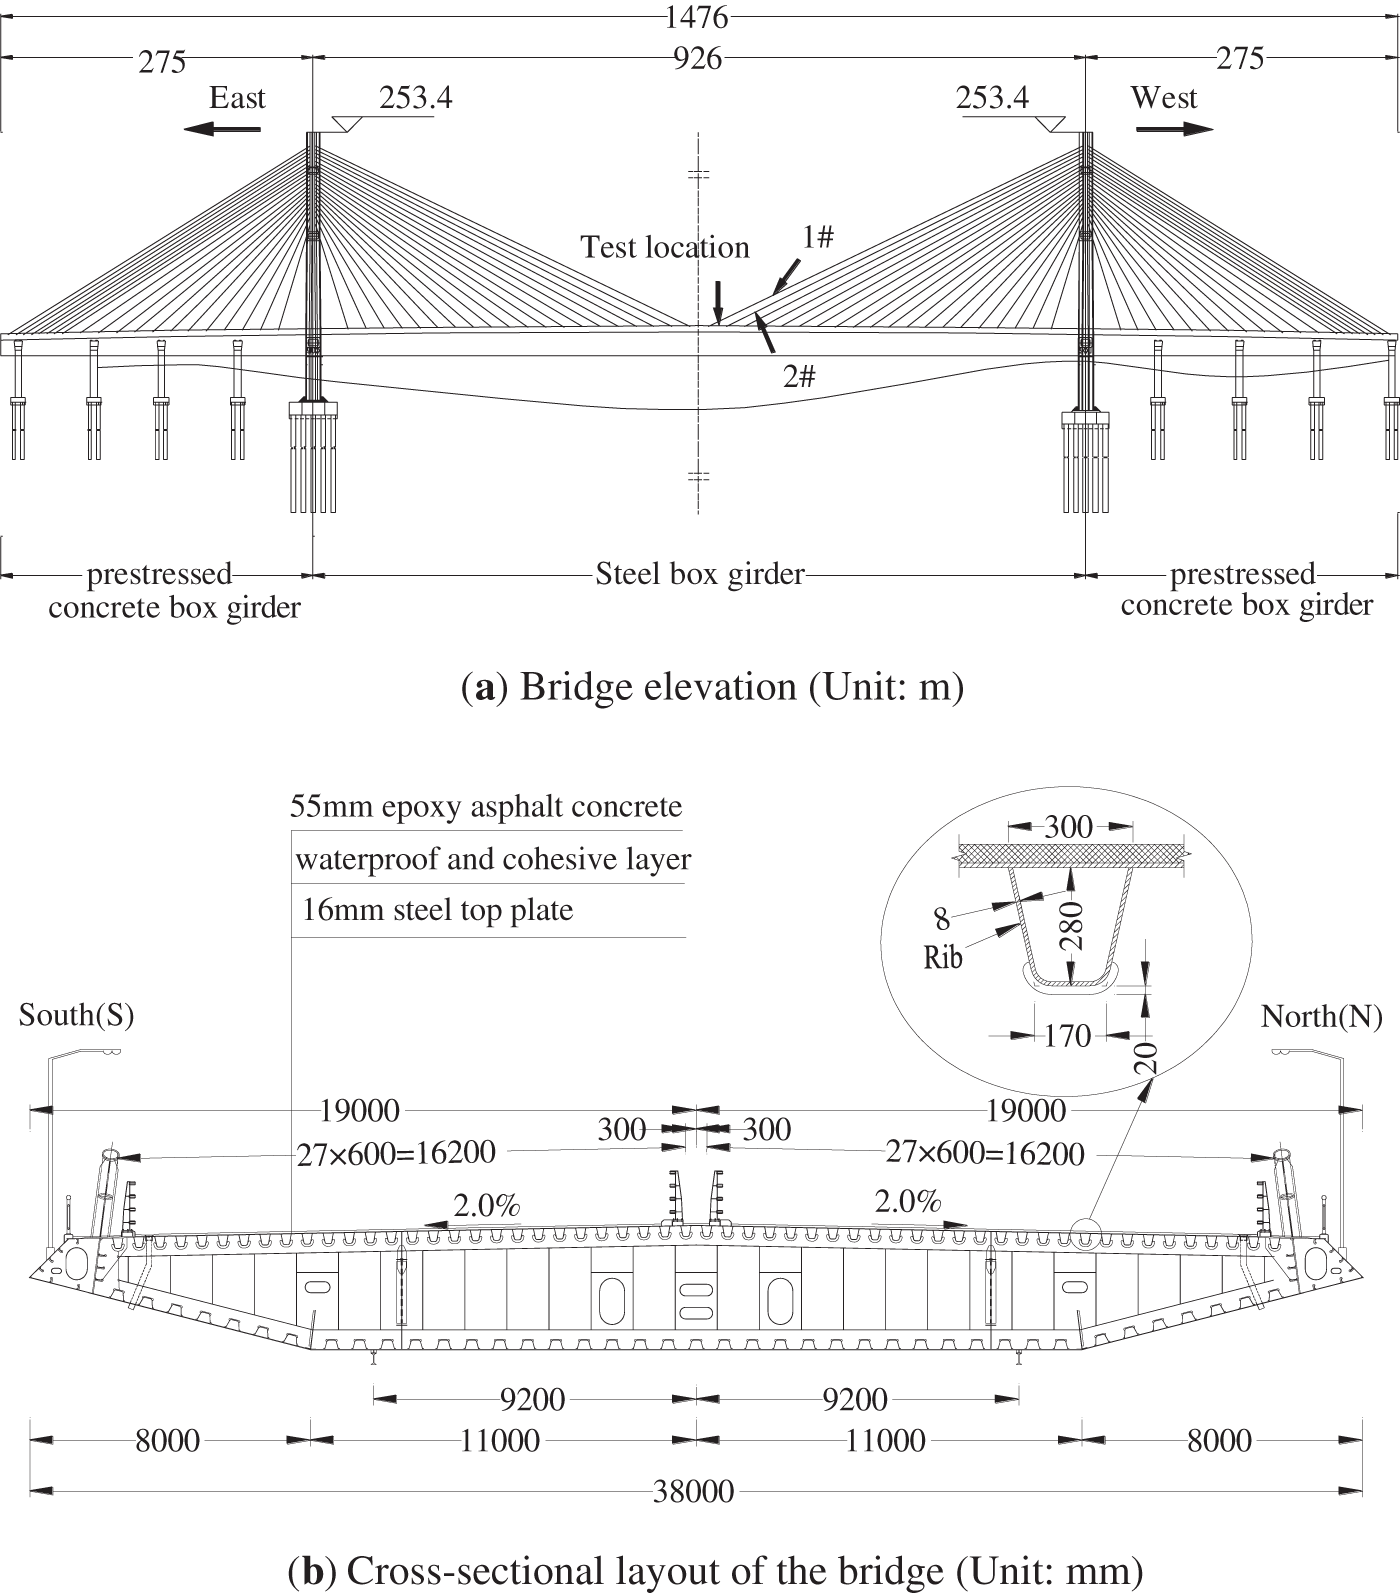
Figure 2: Structural configuration and test locations of the experimental bridge
The main span consists of a twin-box, single-cell PK (Pasco–Kennewick) steel box girder, with four longitudinal floor beams across the transverse section. The steel box girder has a height of 3.8 m at the centerline. The side spans are formed by prestressed concrete box girders with the same external PK cross-section. The total width of the girder, including the wind fairings, is 38 m.
The bridge deck is designed to carry a six-lane dual carriageway with a right shoulder. Vehicular load is based on the Highway Class I standard, and the design speed is 100 km/h. Completed and opened to traffic on 28 September 2010, the bridge ranked as the world’s third-longest cable-stayed bridge span at that time.
The steel box girder features an OSD covered with a 55 mm EAC pavement. The typical OSD segment includes a 16 mm thick deck plate reinforced with trapezoidal longitudinal ribs, which have an upper width of 300 mm, a lower width of 170 mm, a height of 280 mm, and a thickness of 8 mm, as shown in Fig. 2b.
The longitudinal ribs extend continuously across the transverse floor beams, with cutouts provided at their intersections. No cutout holes are included at the welds between the ribs and the deck plate. Longitudinal rib splices are joined using high-strength bolts.
The typical spacing of the floor beams is 3 m. Floor beams at cable anchorage points have a thickness of 14 mm, whereas those at non-cable locations are 12 mm thick. The internal longitudinal diaphragm of the steel box girder is designed with a thickness of 14 mm.
3.2 Selection of Test Locations and Test Period
The selection of field test sections along the bridge’s longitudinal direction was primarily guided by practical and safety considerations. Since the interior of the steel box girder is enclosed and lacks a maintenance vehicle system, elevated summer temperatures make in-box operations difficult. Consequently, stress measurement points were placed near manholes to ensure accessibility, facilitate electrical connections, and provide safe and more manageable working conditions for field personnel.
Considering these factors, the test location was selected near the mid-span of the main bridge, adjacent to the mid-span manhole, as illustrated in Fig. 3a. Using the mid-span centerline as a reference, the floor beams were numbered from west to east, with measurements taken on the sixth-floor beam, as shown in Fig. 3a. This floor beam included three RF weld details and one cutout detail. Furthermore, an RD detail was instrumented at the mid-span of the longitudinal rib between the fifth and sixth floor beams. Therefore, the field test area was situated between the first and second stay cables at the center of the main span.
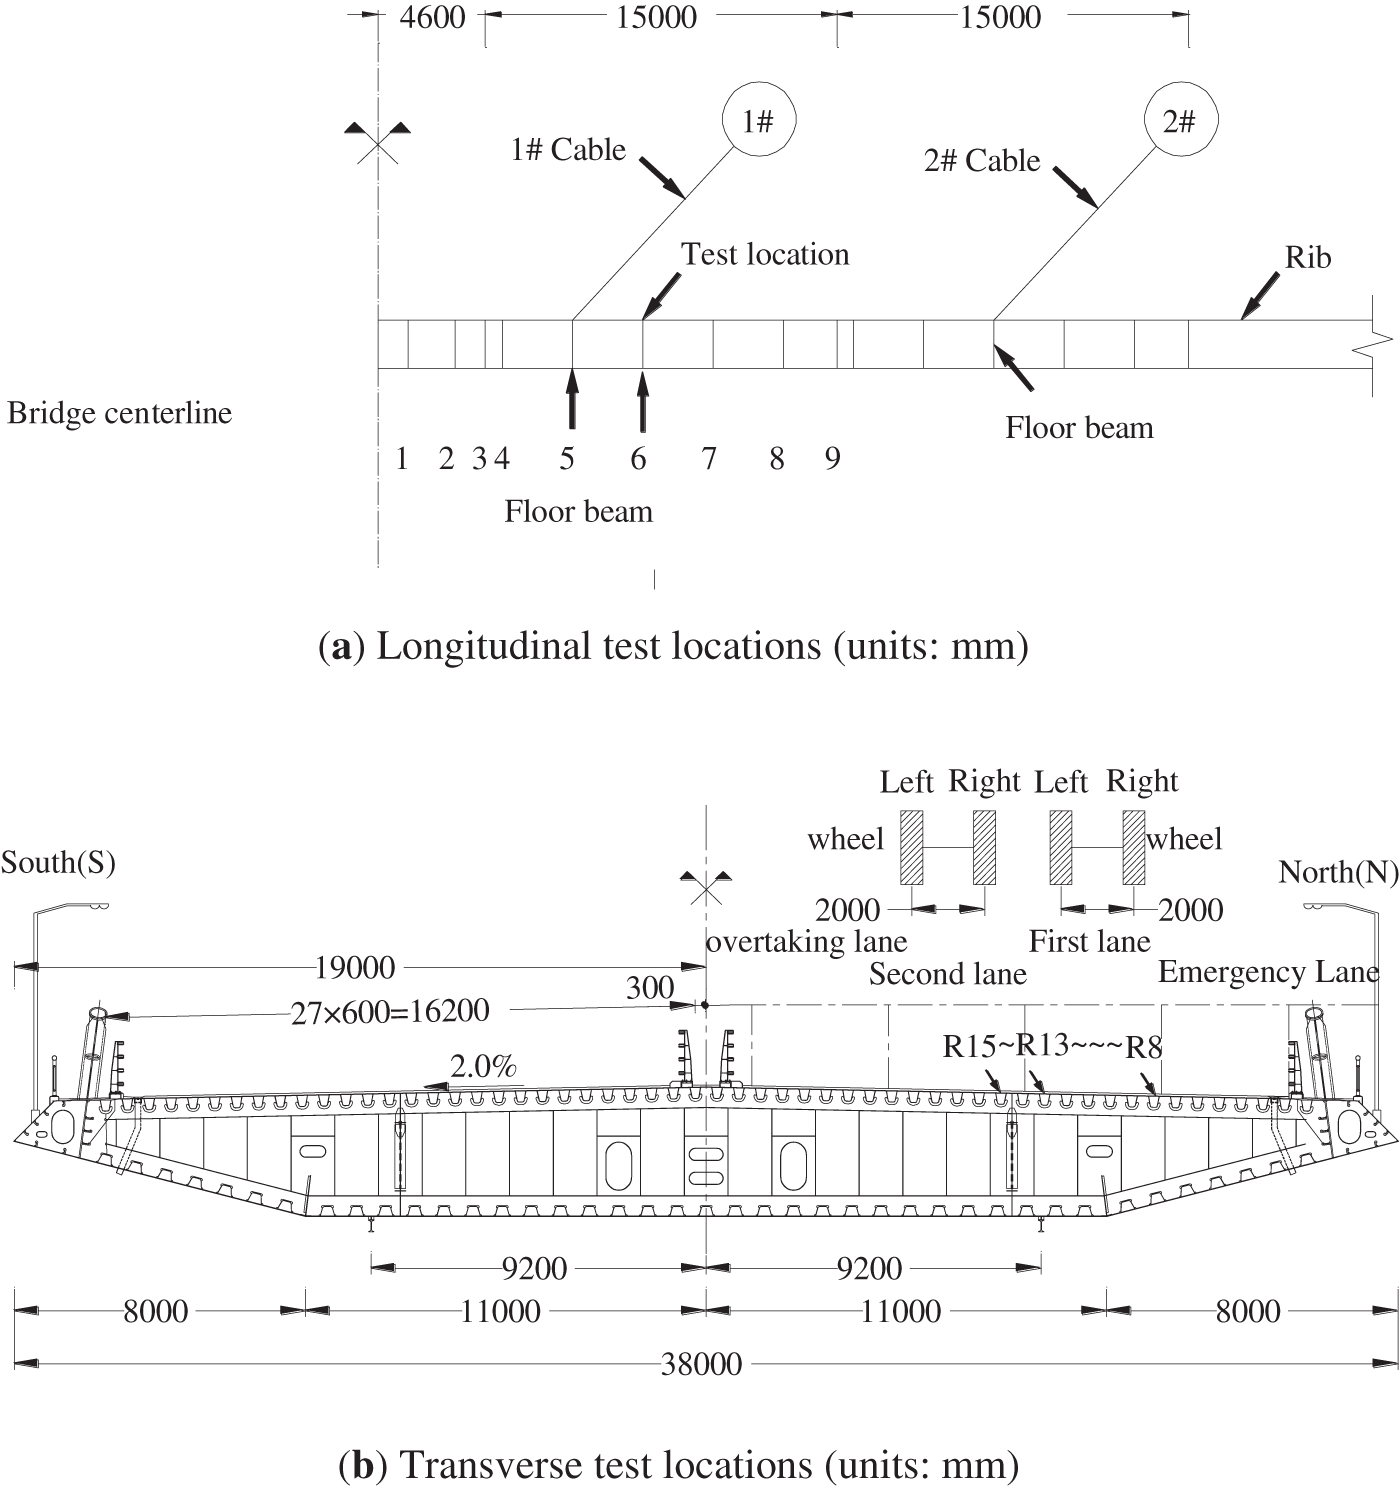
Figure 3: Test locations on the bridge
Due to the limited number of test channels, it was not possible to measure all fatigue-prone details on one side of the bridge deck simultaneously. Observations of truck driving patterns and bridge maintenance feedback indicate that heavy trucks predominantly use the first and second middle lanes. To account for the random distribution of truck traffic, the fatigue-prone details were positioned under these lanes to capture stress responses from both left and right wheel paths.
The longitudinal ribs are numbered R1, R2, and so on, from the north-side emergency lane toward the center. Measurements were conducted on ribs R10-R13 beneath the first lane and R14-R15 beneath the second lane, resulting in a transverse test range R10-R15, as shown in Fig. 3b.
The summer field test was conducted from 3:17 PM on Sunday, 29 July 2018, to 5:00 PM on Sunday, 05 August 2018. The winter field test took place from 4:05 PM on Monday, 24 October 2018, to 5:00 PM on Monday, 31 October 2018. Each test period included a full workweek and the weekend, providing a representative sample of the random traffic crossing the bridge.
Ambient temperatures during the two monitoring periods were obtained from the nearest weather station to the bridge. During the summer campaign (29 July to 5 August 2018), the mean daily air temperature was 32.4°C, ranging from 27°C to 39°C. In the winter campaign (24–31 October 2018), the average temperature was 14.7°C, with a range of 10°C–19°C. The mean wind speed was 2.5 m s−1 in summer and 3.0 m s−1 in winter. Daily solar radiation averaged 18,664 kJ m−2 day−1 in summer and 16,000 kJ m−2 day−1 in winter.
3.3 Strain Gauge Arrangement on Fatigue-Prone Details
To examine the stress behavior of fatigue-prone details on both sides of the floor beam, one side is designated as the west side (W) and the other side as the east side (E). The channels shown in parentheses in Fig. 4 correspond to strain gauges on the west side. The final arrangement of strain gauges for the measured fatigue-prone details is illustrated in Fig. 4, with labels such as 1-1, 2-2, and so on indicating strain gauge numbers.
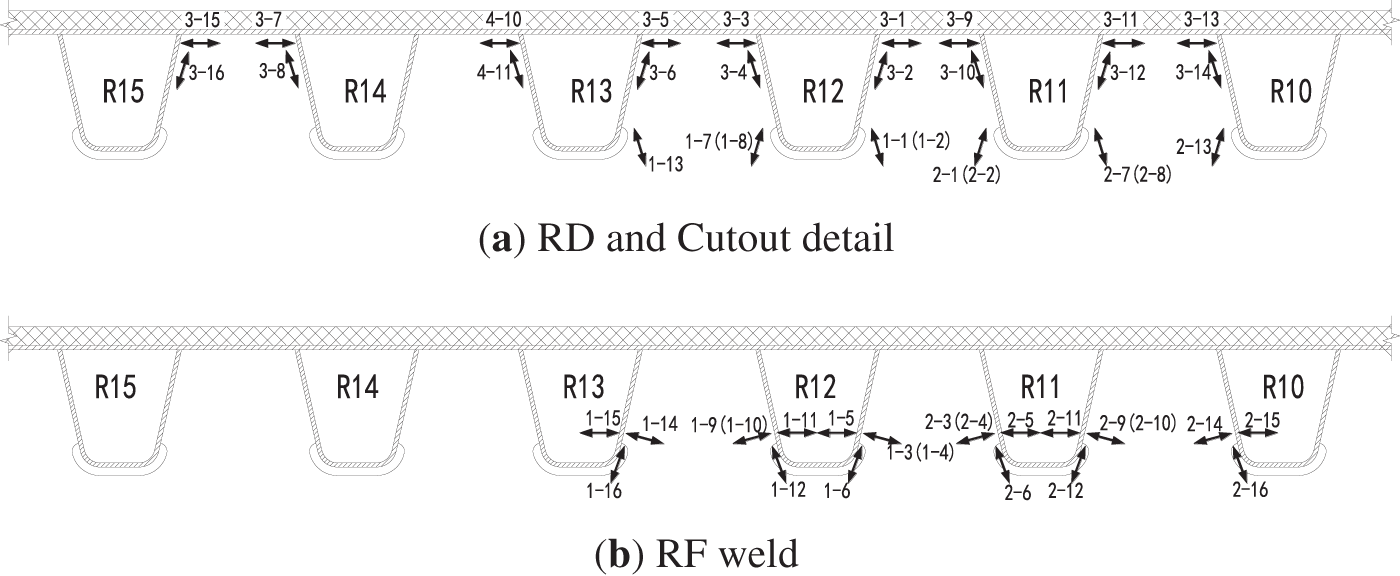
Figure 4: Strain gauge layout for fatigue-prone details
Strain measurements were performed using UFLA-2-11-3LT foil-based, temperature self-compensating strain gauges manufactured by the Tokyo Testing Laboratory, Japan, as illustrated in Fig. 5. Each gauge has a base size of 6.5 × 3 mm and a sensitive grid size of 2 × 1.5 mm, with a lead wire resistance of 119 ± 0.5 Ω and a strain sensitivity coefficient of 2.12 ± 1%. The gauges operate over a temperature range of −20°C to 150°C, providing excellent self-compensation between 10°C and 100°C. Using the elastic modulus of 2.1 × 10¹¹ Pa for the steel material Q345qD employed in the OSD of the bridge, the measured strain time histories were converted into stress records.
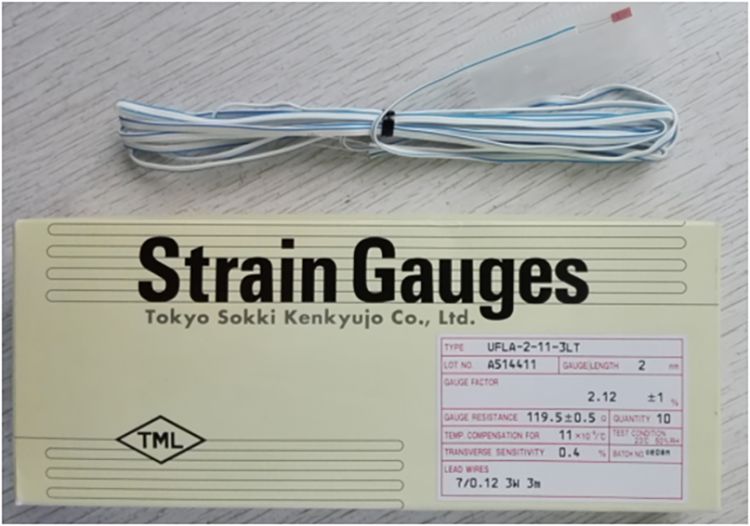
Figure 5: Strain gauges used in the field test
To measure nominal stress at fatigue-prone details caused by random traffic loads on the bridge deck, strain gauges were installed on all fatigue-prone details except the Cutout detail, with their centers positioned 6 mm from the weld toe [1]. The gauges were oriented perpendicular to the weld toe line of the fatigue-prone details. For the Cutout detail, the strain gauge center was placed 6 mm from the free edge of the cutout, with the measurement direction set perpendicular to the most critical connection line created by the removal of adjacent cutouts on the floor beam. Fig. 6 shows photographs of several strain gauges installed on fatigue-prone details on the bridge.
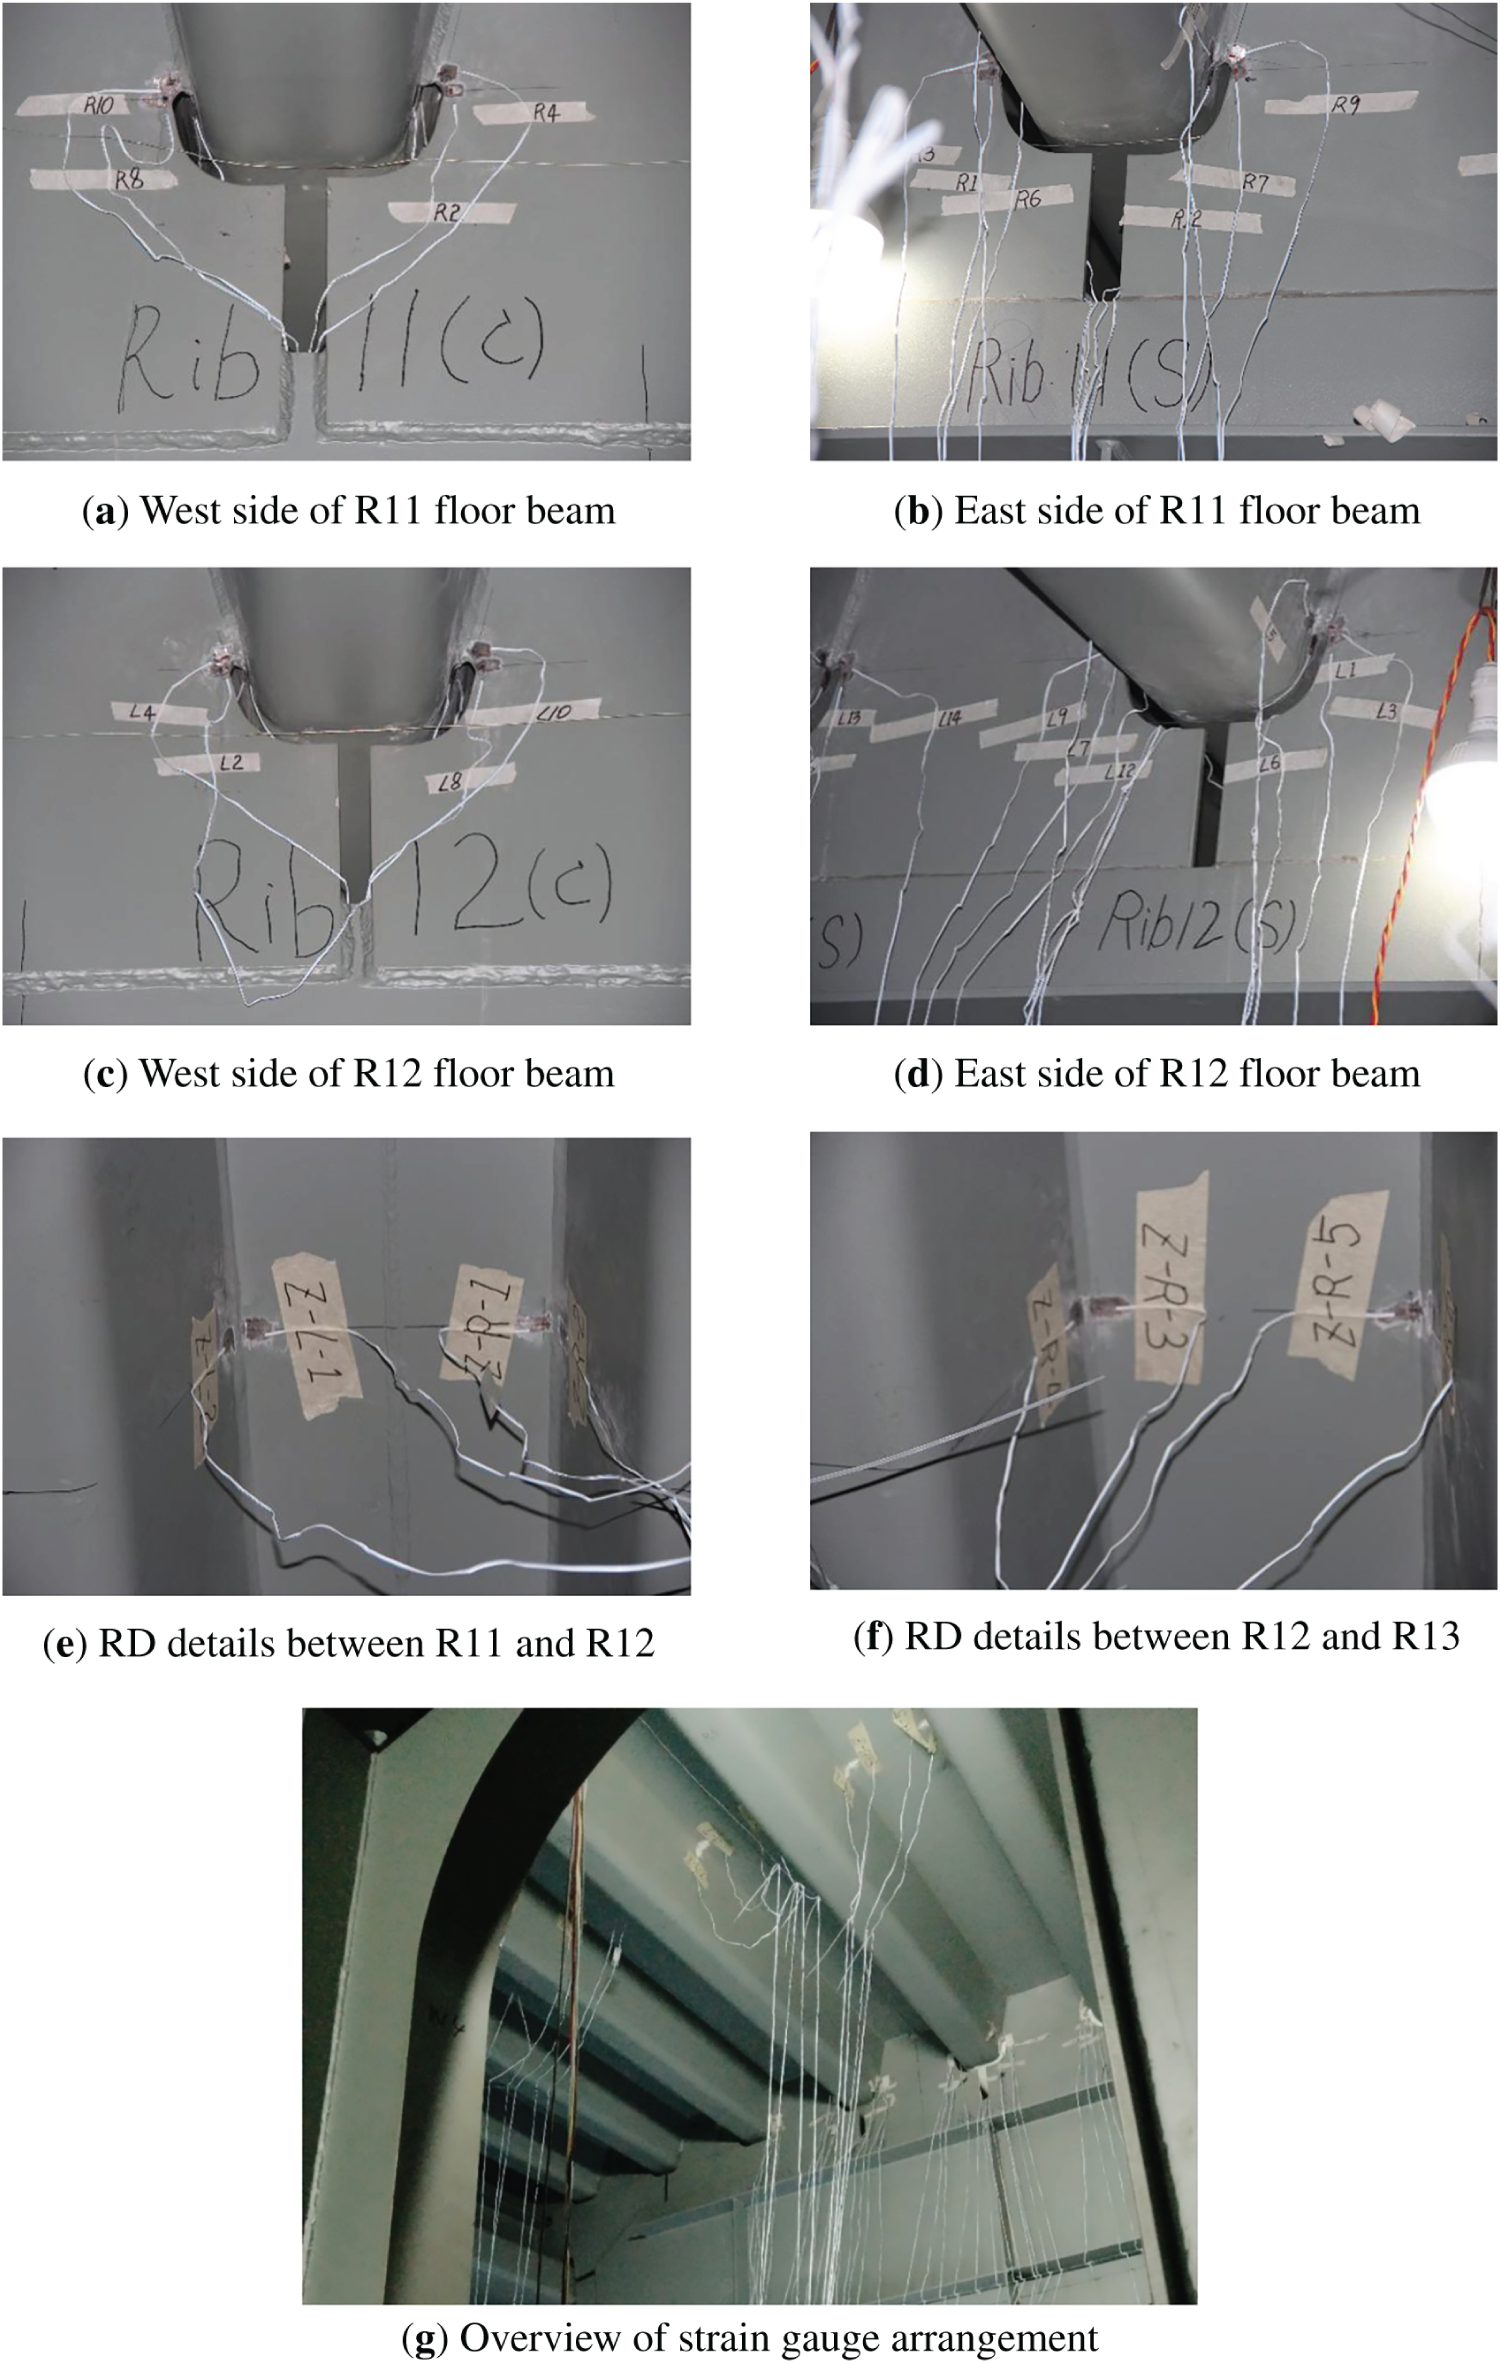
Figure 6: Photographs of strain gauges installed on the bridge
The DH3820 data acquisition system, equipped with 54 channels and a 100 Hz sampling rate, was used for continuous stress measurement and installed inside the steel box girder at the test section (Fig. 7a). Strain gauges initially installed during the winter test were reused in the summer campaign after verifying their functionality. Any Faulty gauges were replaced with the same model without changing their measurement positions. Although occasional channel malfunctions led to minor changes in gauge-to-channel assignments between seasons, the positions of the structural detail remained unchanged. Fig. 7b shows the real-time stress records from the system. All channels were thoroughly checked before official data collection to ensure the accuracy and reliability of the measurements.
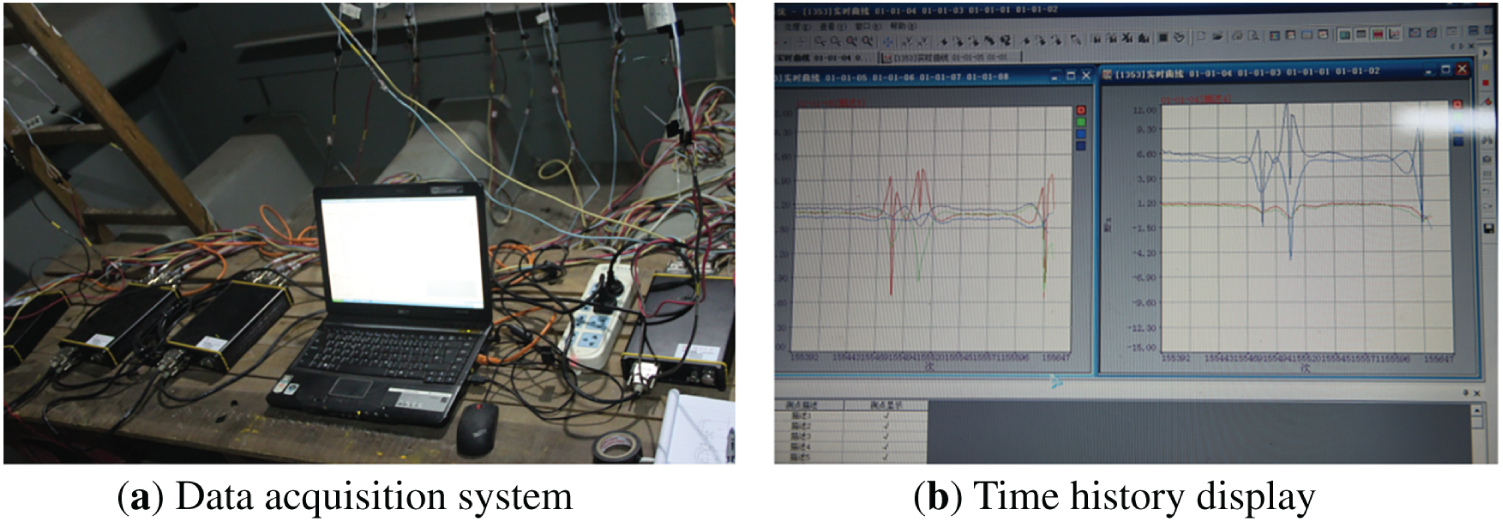
Figure 7: DH3820 data acquisition system used for field measurement
4 Comparison of Measured Stress Behavior in Winter and Summer
Field test data indicate that the strain gauges successfully recorded the stress response of fatigue-prone details under truck loads on the northbound first and second lanes. The highest fatigue stresses and loading counts were observed at R12 on both sides of the deck plate. Since most trucks in the first lane have their left wheels passing over R12, this rib experiences the greatest fatigue loading. Accordingly, the subsequent analysis focuses on the stress measurements of RD details, three RF weld positions, and the Cutout details at R12, with comparisons between winter and summer conditions.
4.1.1 Seven-Day Stress Records
Figs. 8–11 show seven days of continuously recorded stress signals for the RD details on the south and north sides of R12. The week-long monitoring includes both weekdays and weekends, providing a comprehensive assessment of potential variations in truck traffic patterns over the course of a week. This method captures a complete dataset of fatigue loading on the bridge deck induced by truck traffic. Analysis of the stress records curves indicates no significant differences in truck traffic volume between weekdays and weekends.
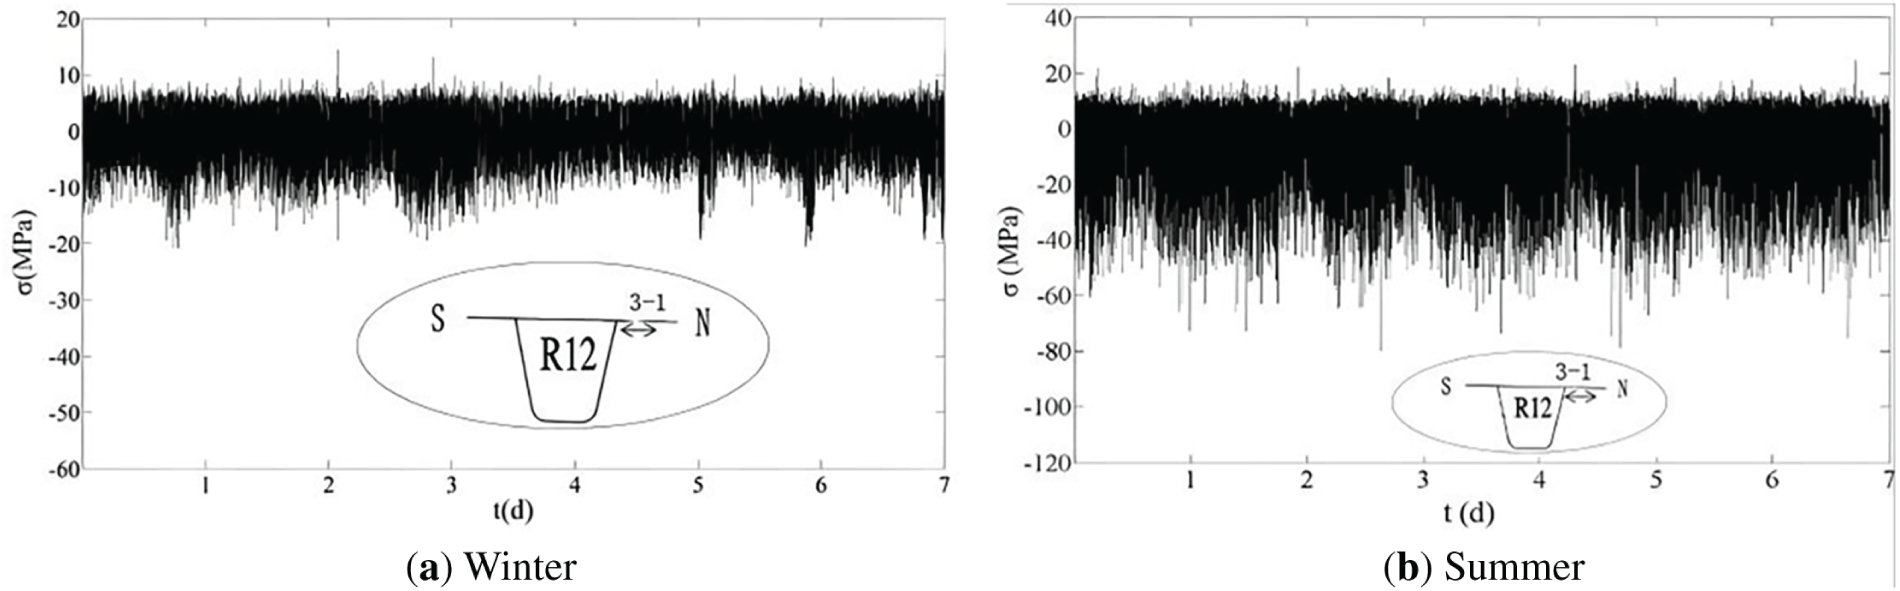
Figure 8: Seven-day stress records at RD-D weld (3-1)
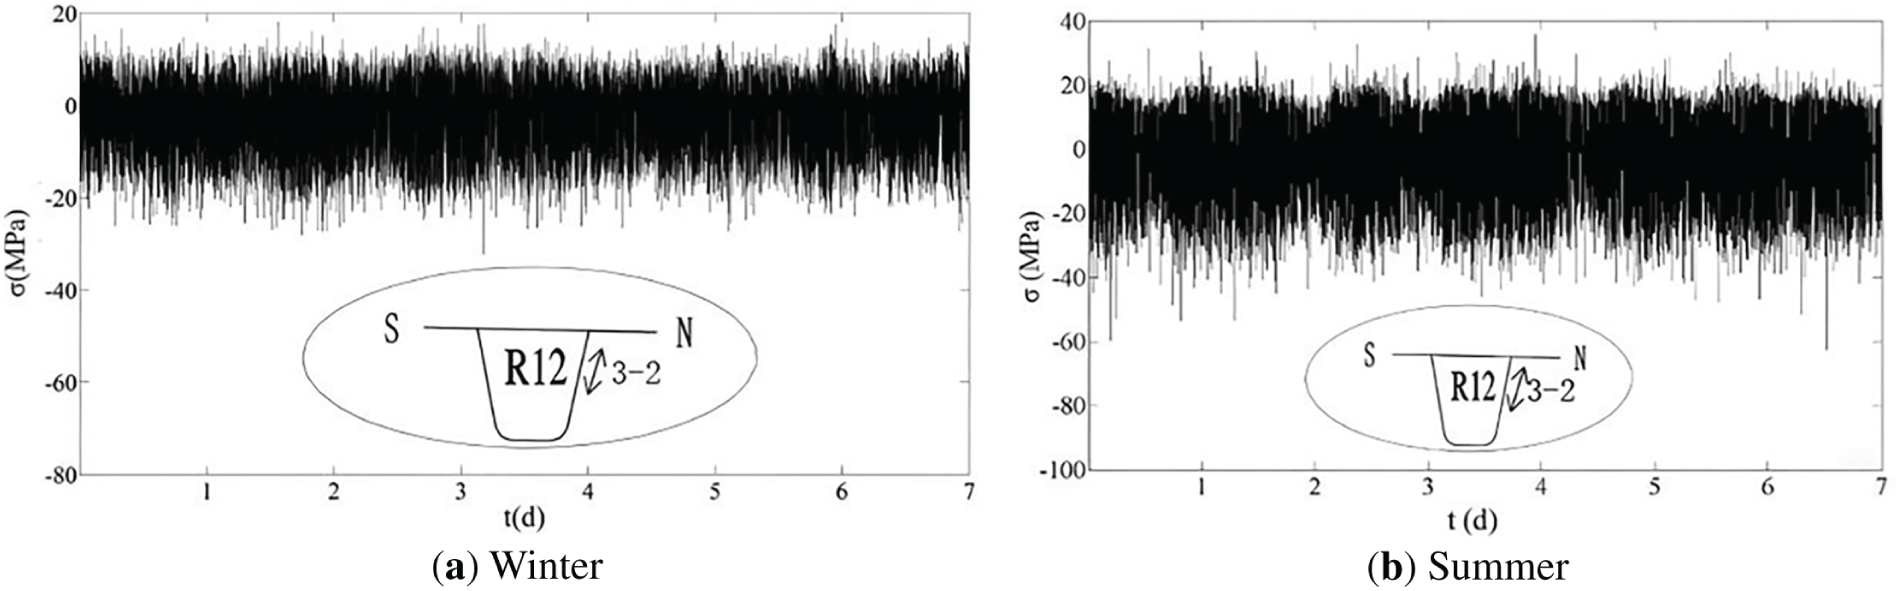
Figure 9: Seven-day stress records at RD-R weld (3-2)
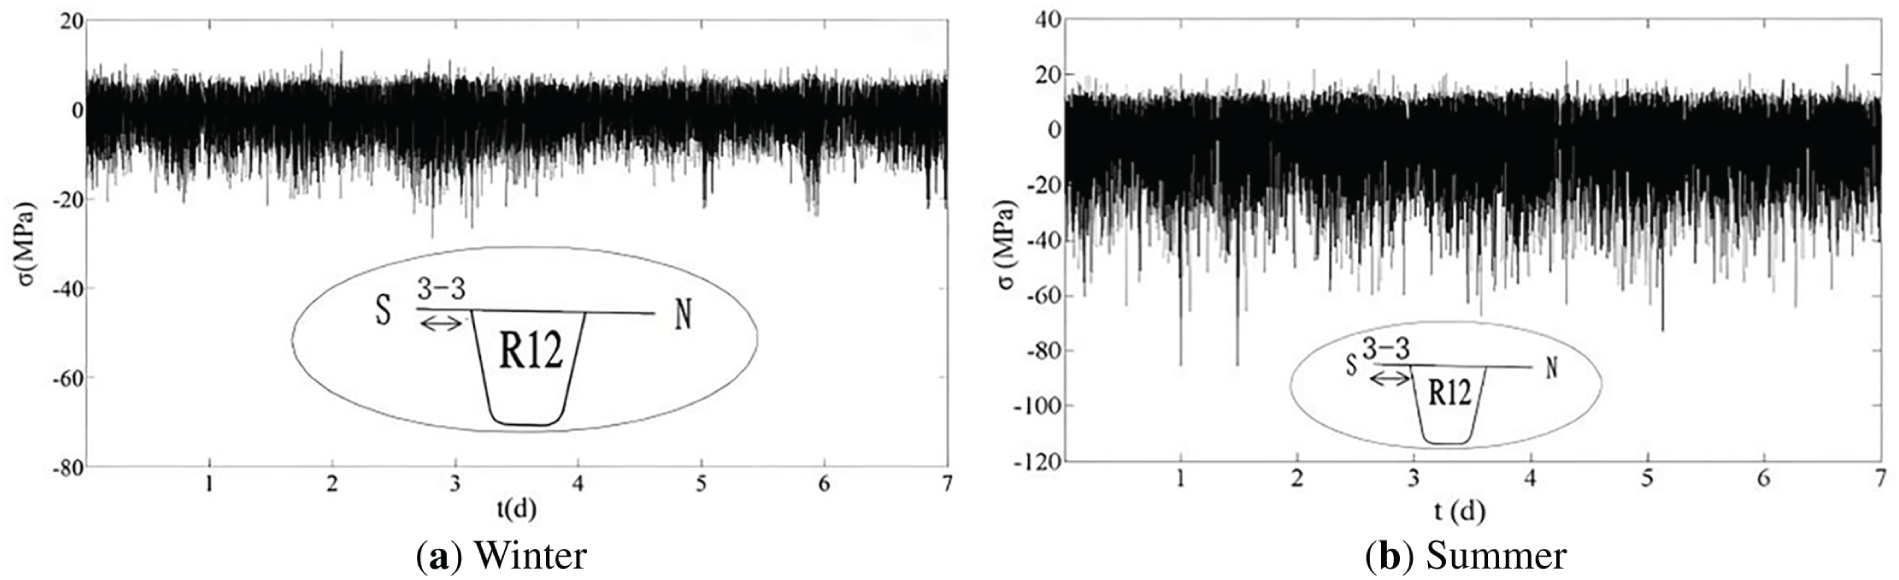
Figure 10: Seven-day stress records at RD-D weld (3-3)
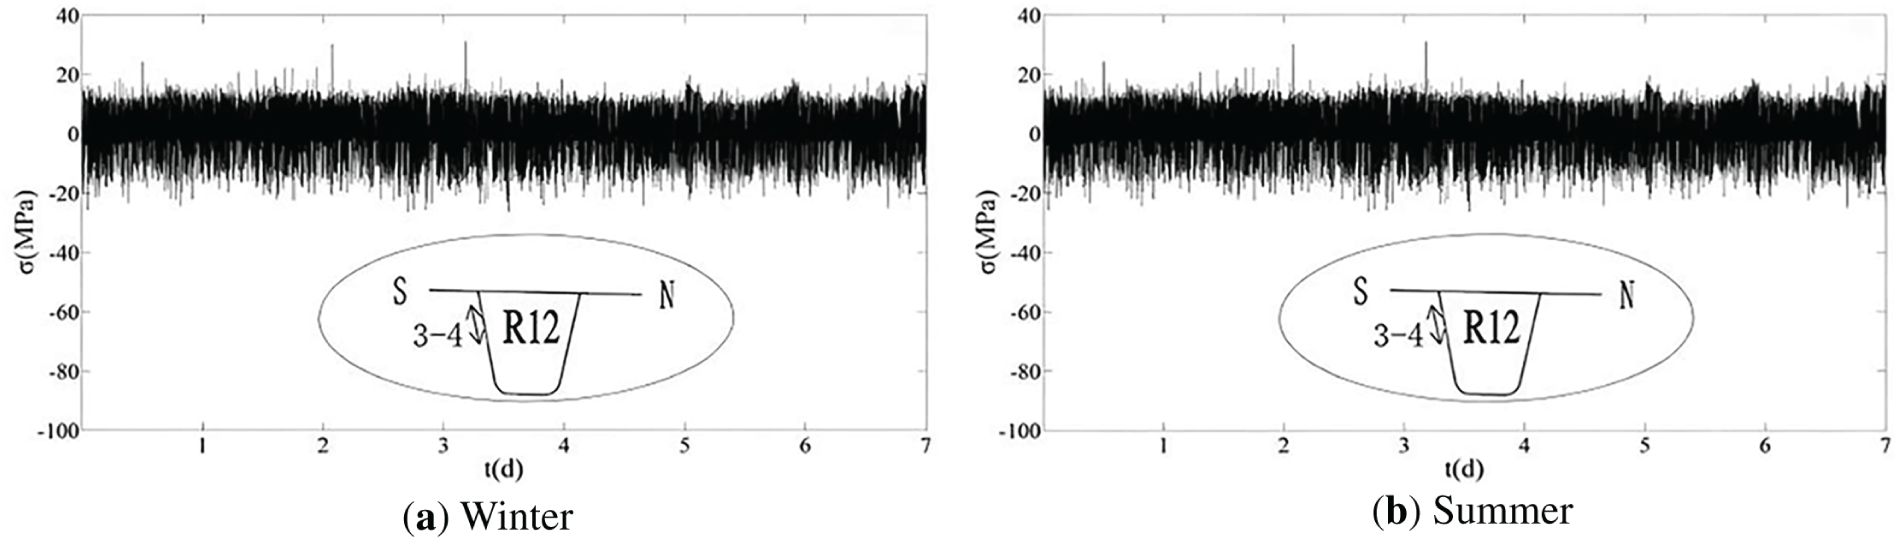
Figure 11: Seven-day stress records at RD-R weld (3-4)
The RD details are subjected to both tensile and compressive stresses in winter and summer, with compressive stresses predominating. These stresses are primarily induced by wheel loads, which have a greater effect than global deck deflection, resulting in a highly localized stress response. Moreover, stress levels in summer are substantially higher than those observed in winter.
The seven-day stress records are too dense to effectively show the stress variation under random bridge deck loading within a 24-h period. Fig. 12 shows the corresponding 24-h continuous stress curve for point 3-1. Comparing the stress on the longitudinal rib side of the RD details between winter and summer shows a significant increase in compressive stress, while the increase in tensile stress is comparatively smaller. For example, at the RD details on the north side of R12 (N), the tensile stress at measurement point 3-1 on the deck plate side is slightly higher in summer than in winter. The average compressive stress at point 3-1 is −15 MPa in winter and −45 MPa in summer, indicating that compressive stress in summer is approximately 30 MPa higher than in winter.
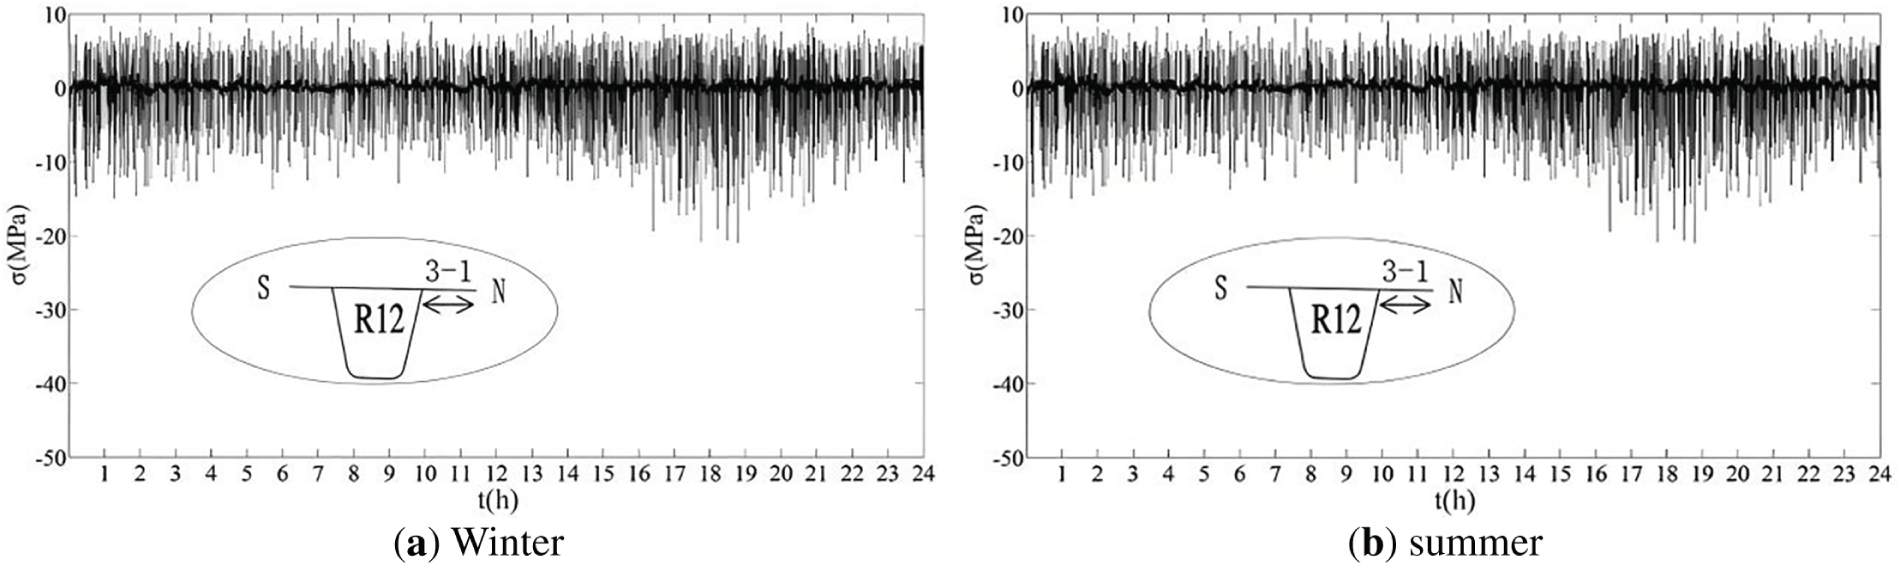
Figure 12: 24-h stress records at RD-D (3-1)
Higher summer temperatures reduce the stiffness of the EAC, decreasing the pavement layer’s contribution to the overall deck stiffness. Thus, RD details experience increased tensile and localized compressive stresses under truck loading.
Higher summer temperatures reduce the stiffness of the EAC pavement relative to the longitudinal rib, leading to increased stress in the rib. Consequently, the stress ranges of the RD detail are substantially larger in summer.
4.1.3 Short-Term Stress Records under Single Truck Passage
Fig. 13 illustrates the short-term stress response of RD details on both the deck plate and longitudinal rib sides under a single truck passage, based on summer measurements. The largest stress responses occur beneath the left design wheel track of the first lane, particularly at the north side of R12 (point 3-1) and the south side of R11. The deck plate side of the RD detail clearly captures the truck’s axle configuration, showing six distinct stress peaks corresponding to a 6-axle truck (front axle, double middle axle, and triple rear axle), with the triple rear axle producing the highest response. In addition, the local stress induced by the wheel load on the deck plate side is substantially greater than the global stress effect.
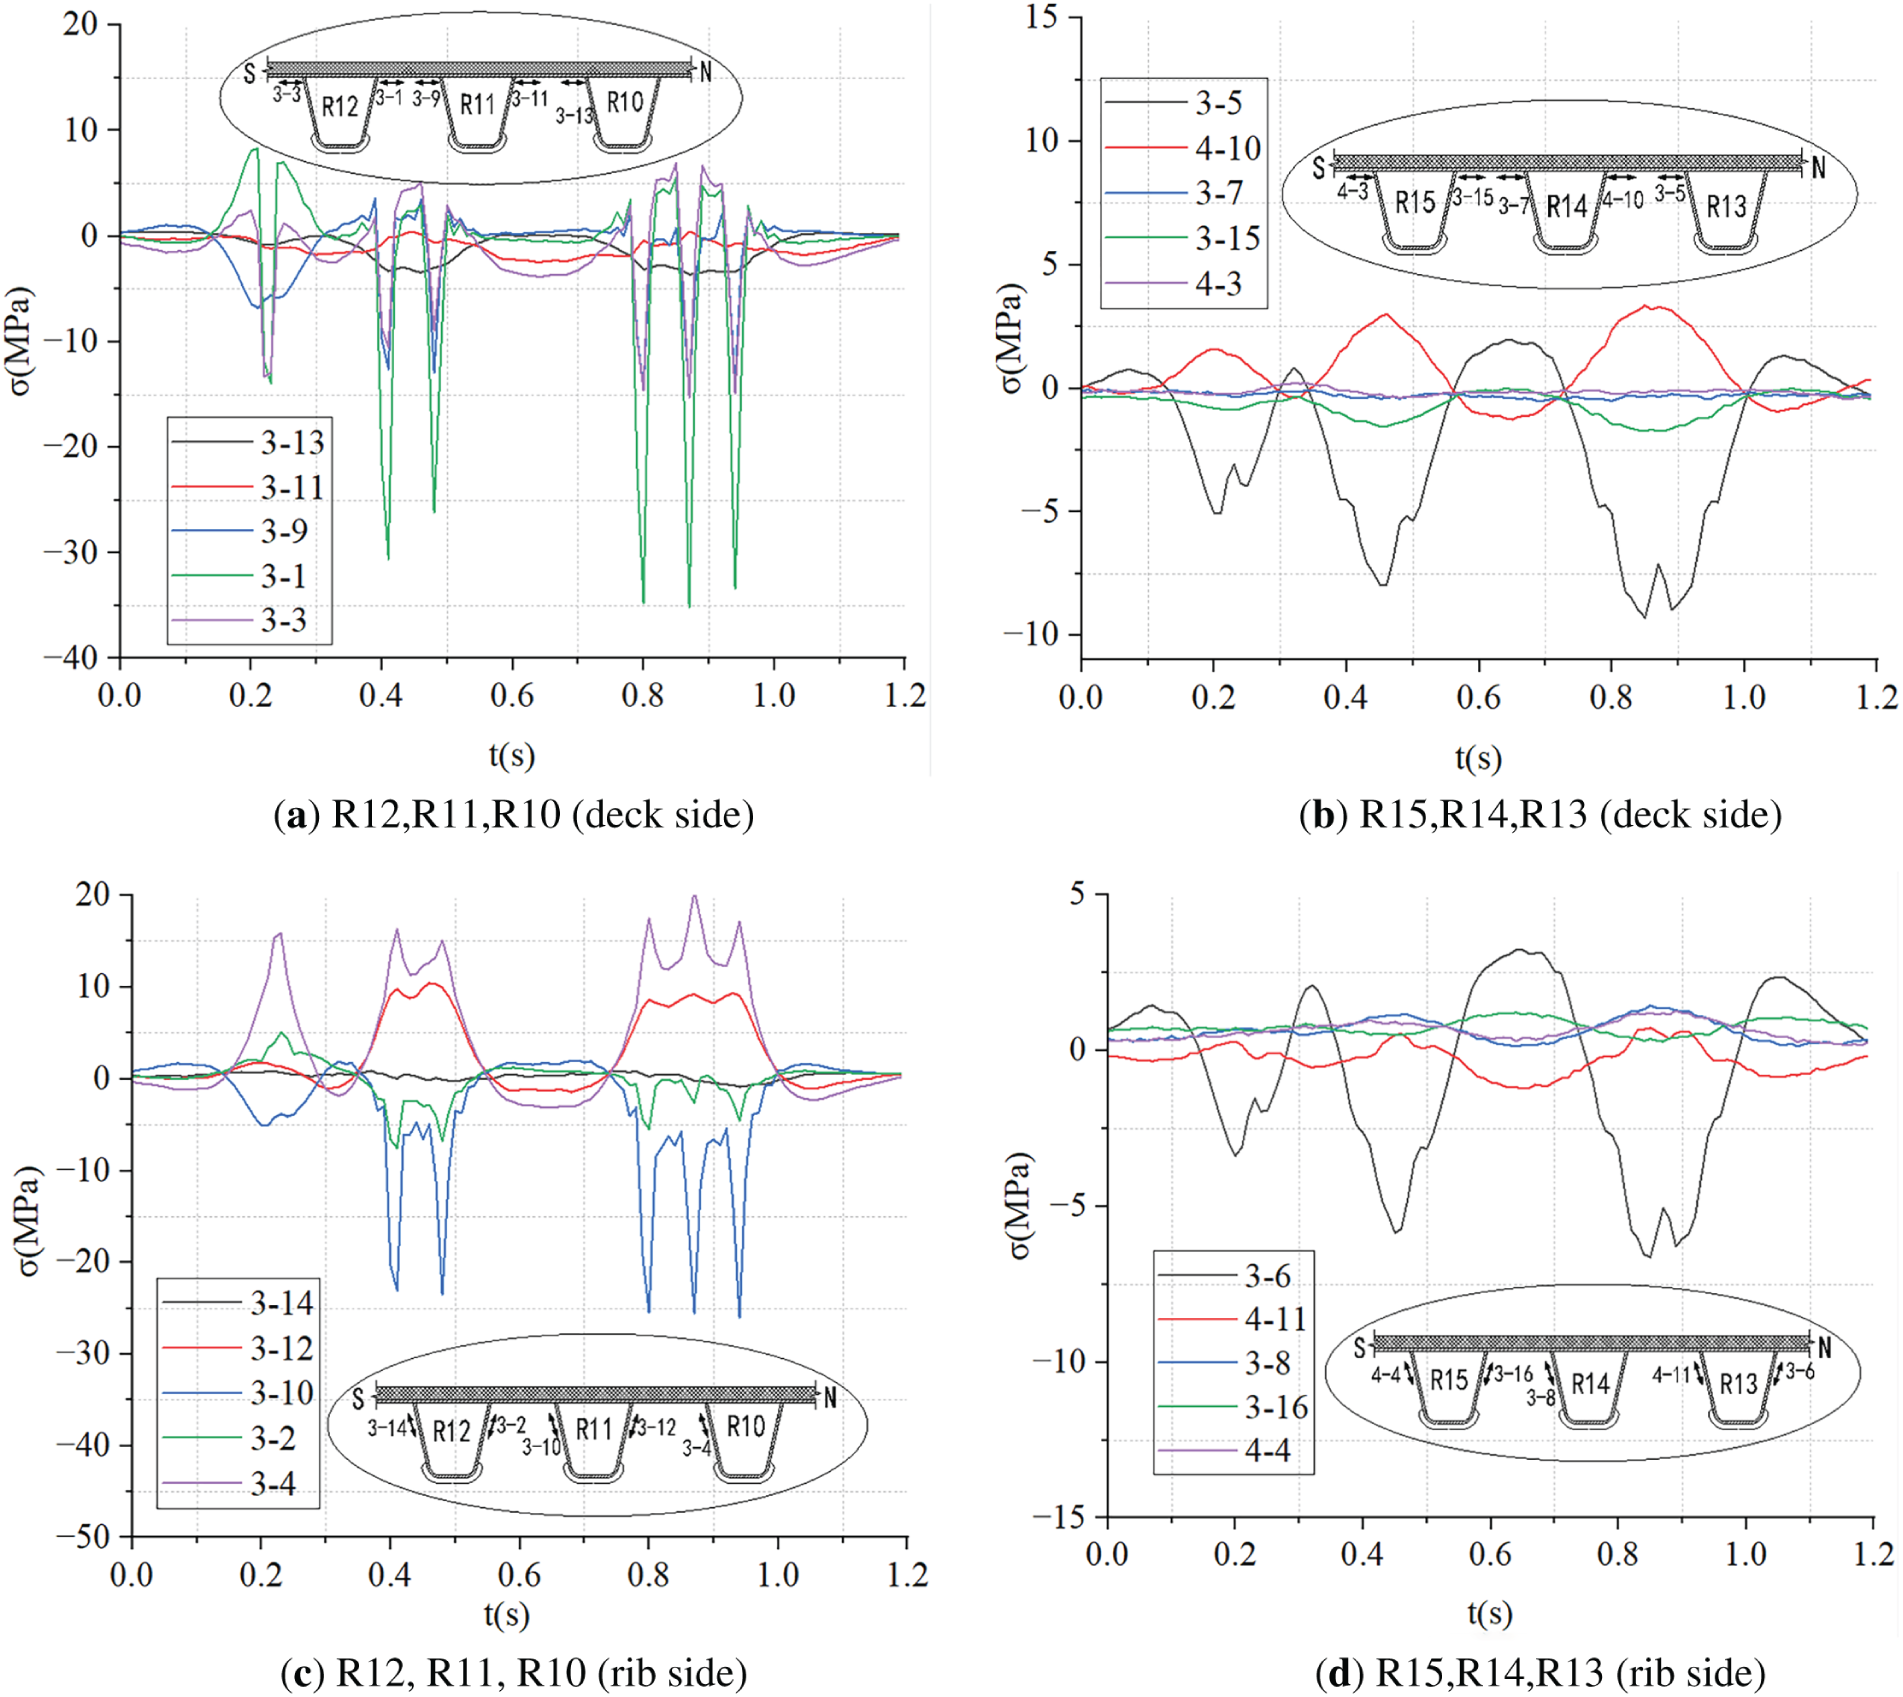
Figure 13: Short-term stress records at RD welds during a single truck passage
The stress response on the longitudinal rib side of the RD detail is tension-dominated at position 3-4 and compression-dominated at position 3-10 (Fig. 13c), indicating the wheel load center lies between these positions, near the north side of R12. This produces pronounced stress peaks on both the deck plate and rib sides. When the detail is farther from the wheel load center, the stress response diminishes, and individual axles within the group are not distinguishable in the stress history (Fig. 13b,d). Conversely, when the detail is close to the wheel load, each axle generates a distinct stress peak on the rib side. Unlike the deck plate side, these peaks overlap with the stress response from the overall axle group, forming a “dromedary back” pattern [35]. The relative contributions of overall and local effects to the rib-side stress vary with position.
The figures show that for both the longitudinal rib and deck plate sides of the RD weld, fatigue-prone details located directly beneath the wheel load experience a pronounced stress response. When the detail is away from the wheel load, the stress response decreases significantly, and it becomes negligible at greater distances from the load center. This pattern is evident in the deck plate side measurements at points 3-11, 3-13, 3-7, 3-15, 4-3, and 4-10, as well as in the longitudinal rib side measurements at points 3-14, 3-8, 3-16, 4-4, and 4-11.
It can be conservatively assumed that when the RD detail is positioned directly beneath the wheel load, each truck axle produces one complete stress cycle in the RD detail. Consequently, the total number of loading cycles generated by a single truck passage is equal to the total number of axles on the truck.
4.2.1 Seven-Day Stress Records
Since R12 experiences the highest number of fatigue loading cycles, four strain gauges beneath the designated wheel track on its north side were selected to present seven days of continuous stress records, as illustrated in Figs. 14–17. Among the RF weld-related fatigue-prone details, namely RF-F, RF-R, and RF-W, the RF-W detail consistently exhibits the highest stress levels in both winter and summer. Even in winter, the maximum stress range at this detail exceeds the Constant Amplitude Fatigue Limit (CAFL) of 69 MPa specified for C-class details in AASHTO LRFD [36]. In summer, the maximum stress ranges further increase, and the number of instances exceeding the CAFL increases significantly. Comparing winter and summer, the stress levels at all three RF details (RF-F, RF-R, and RF-W) are higher in summer, although the increase is less pronounced than that observed in the RD details.
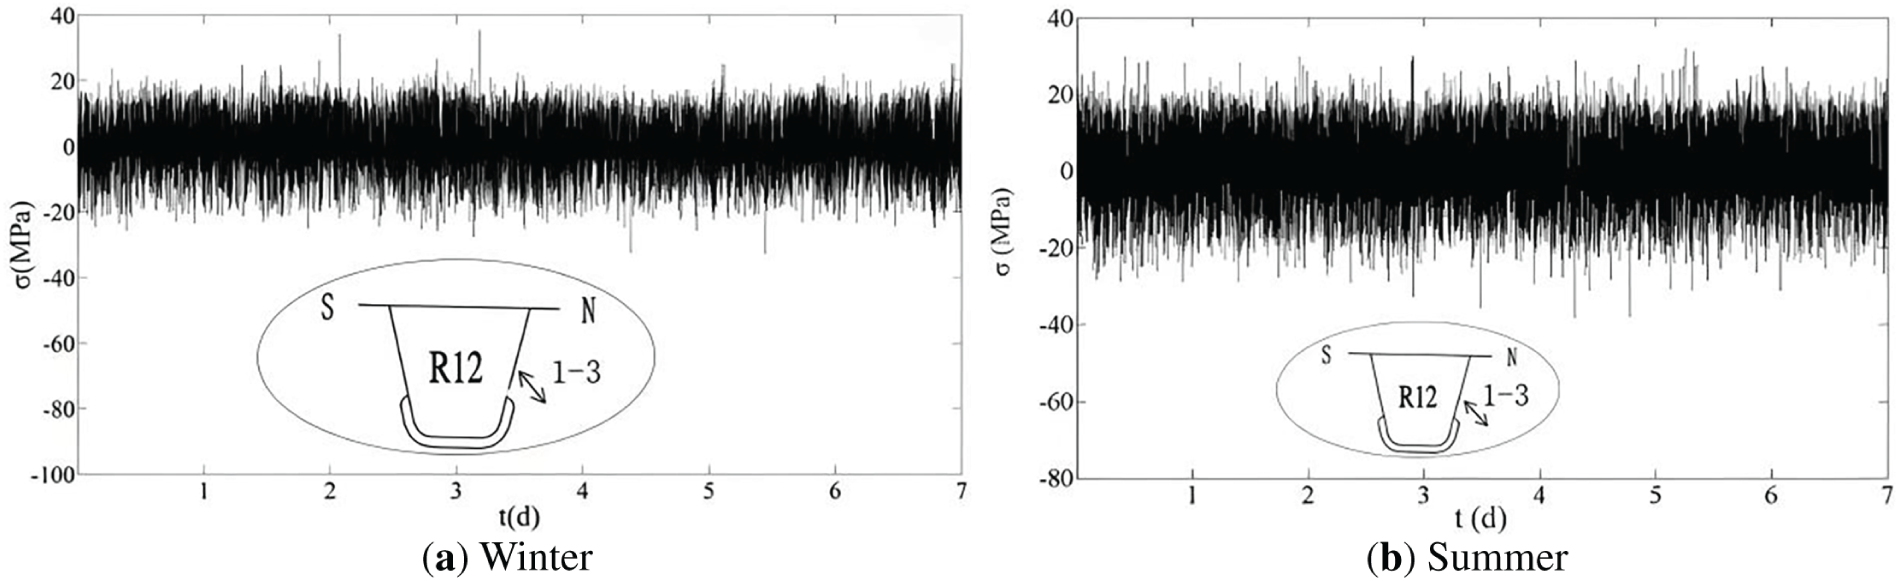
Figure 14: Seven-day stress records at RF-F (1-3) weld
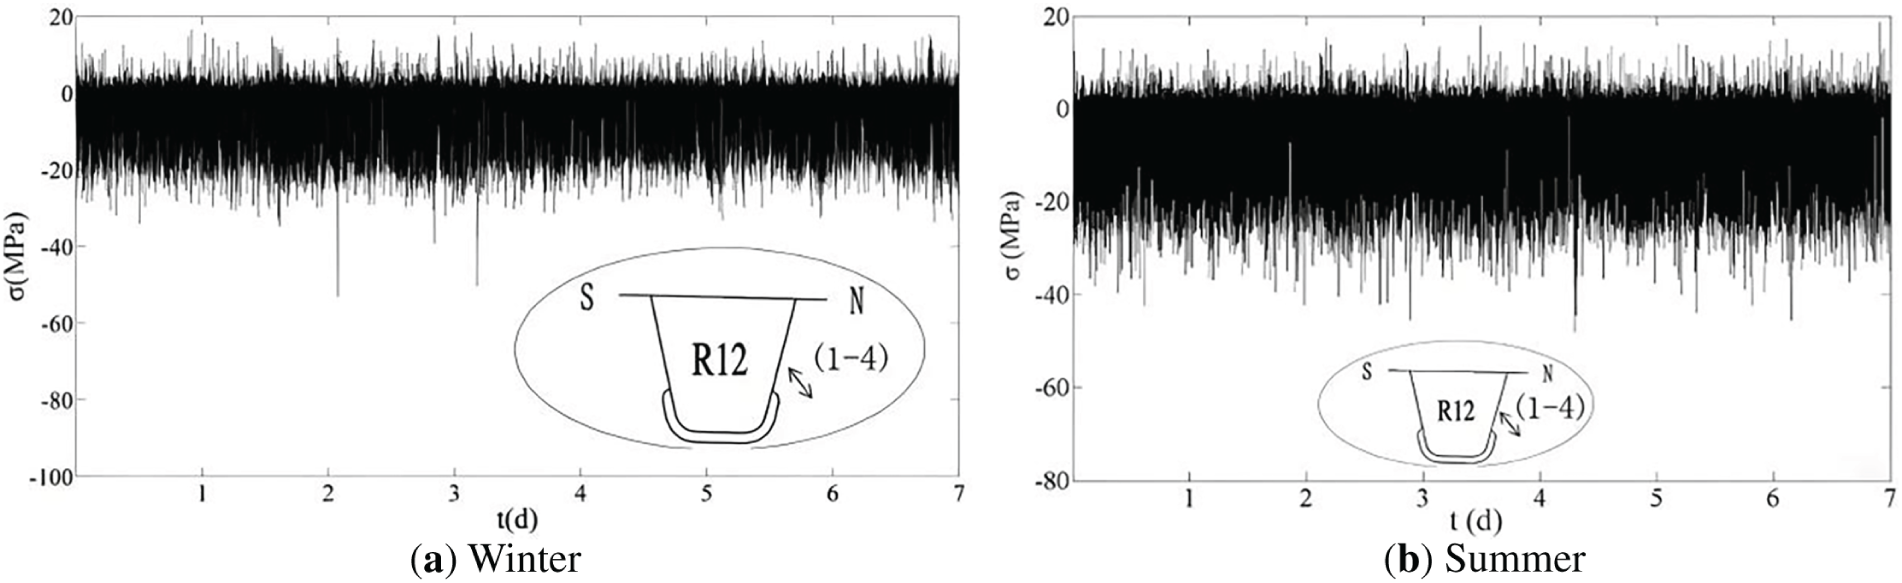
Figure 15: Seven-day stress records at RF-F (1-4) weld
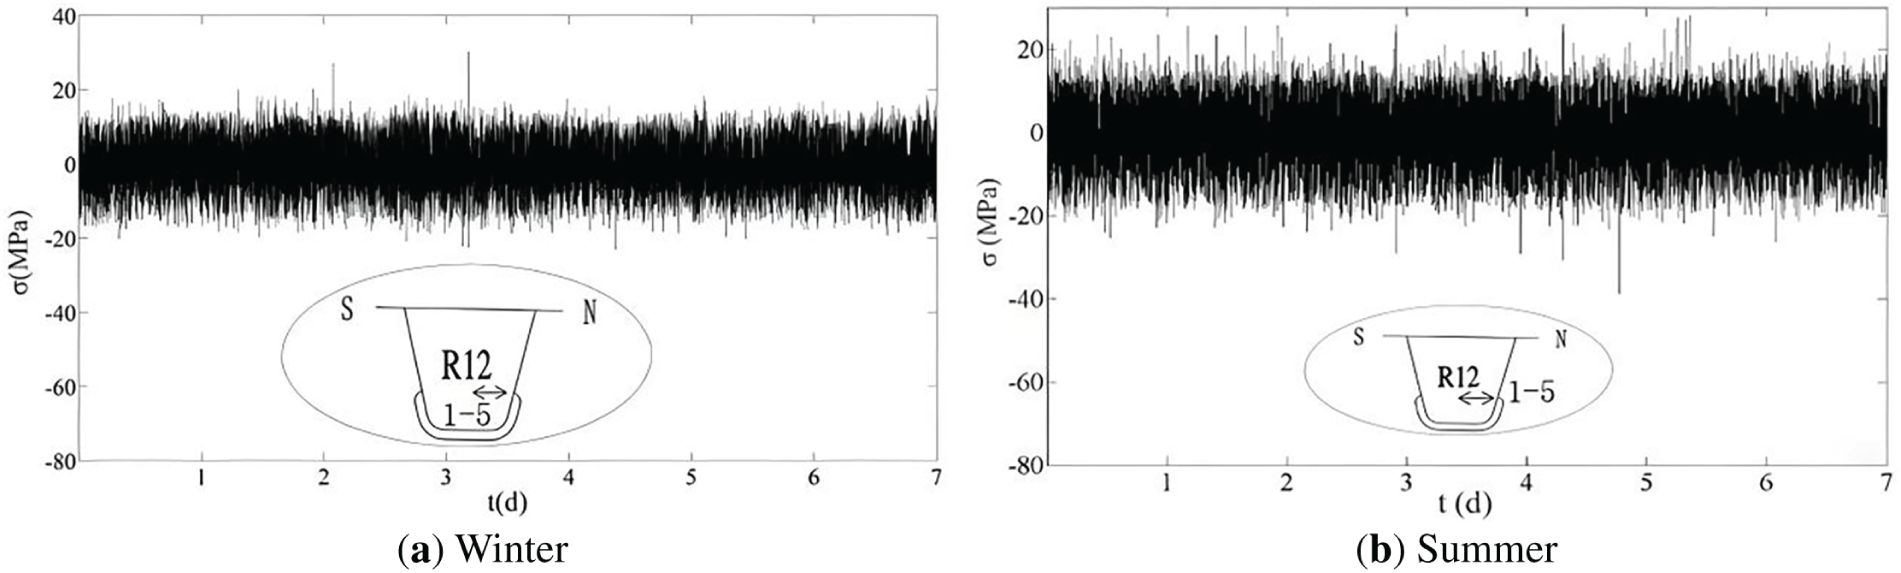
Figure 16: Seven-day stress records at RF-R (1-5) weld
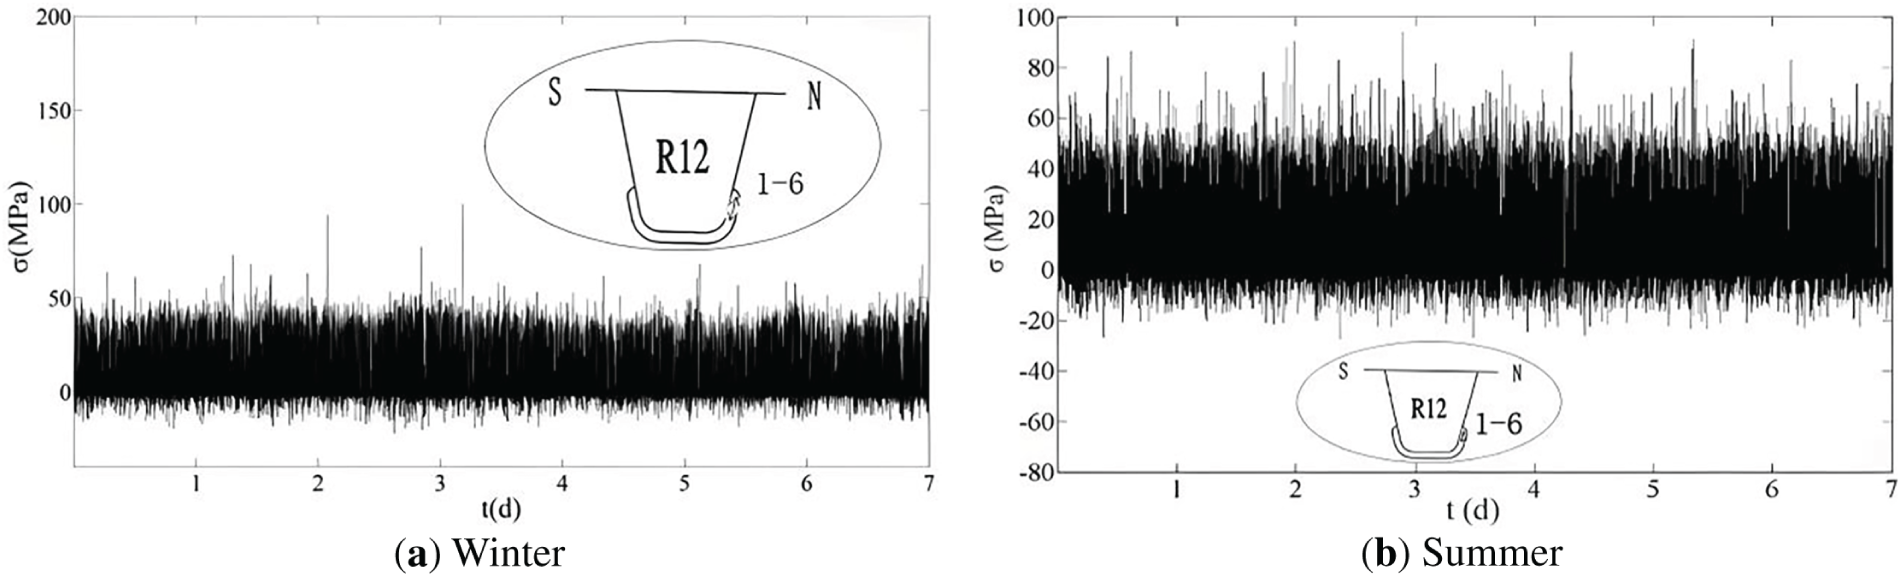
Figure 17: Seven-day stress records at RF-W (1-6) weld
The following analysis focuses on R12, positioned beneath the left design wheel track of the first lane in the traffic direction, to examine the 24-h stress records characteristics of the three RF welds on both sides of R12.
(1) RF-F Weld
Figs. 18 and 19 show the 24-h stress records for the RF-F weld on the north side of R12. Strain gauges 1-3 and 1-4 are symmetrically positioned on the east and west sides of the floor beam web. Winter data show that strain gauge 1-3 experiences both tensile and compressive stresses, whereas 1-4 is predominantly under compressive stress. This asymmetrical stress distribution indicates that out-of-plane deformation of the floor beam web induces bending stresses in the RF-F weld region. Similar patterns are observed in the summer data, confirming that out-of-plane deformation affects the weld in both seasons.
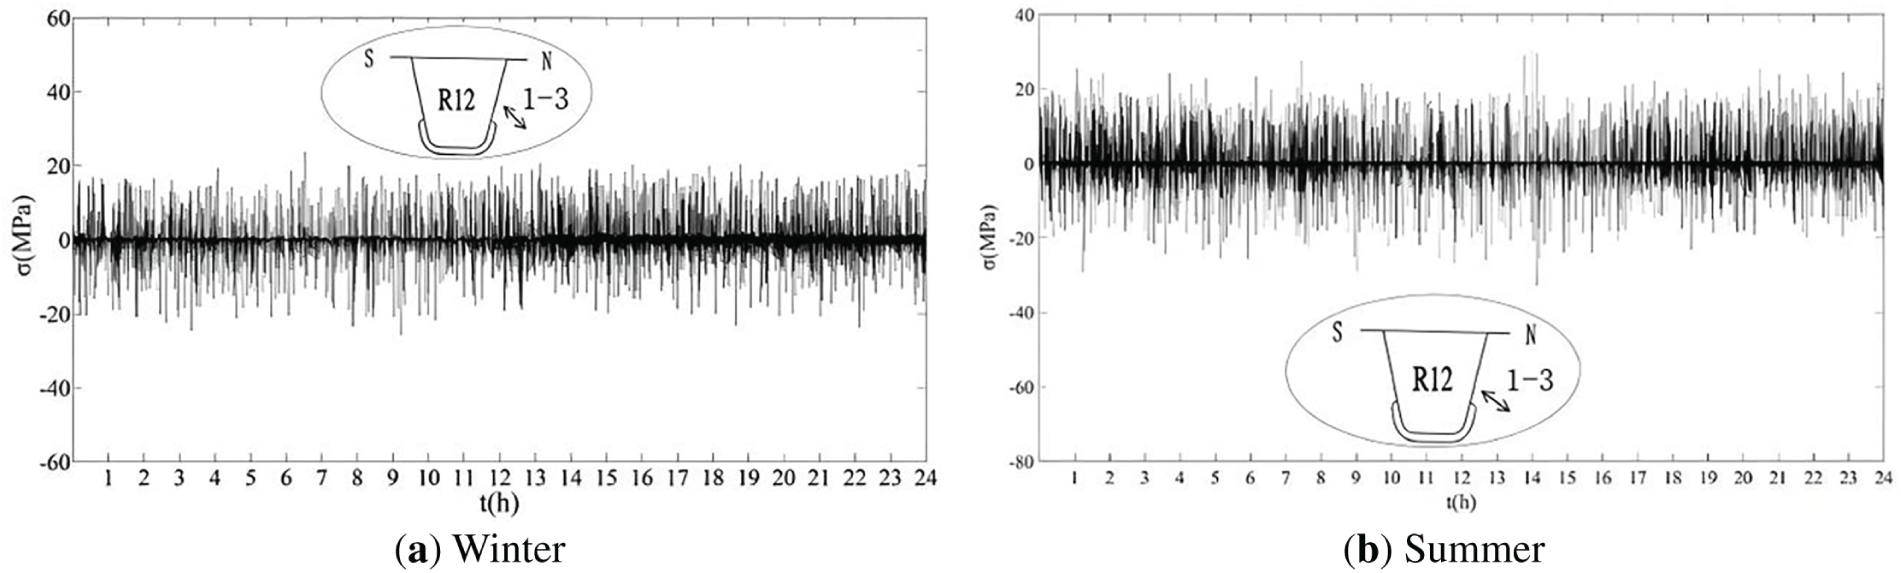
Figure 18: 24-h stress records at RF-F (1-3) weld
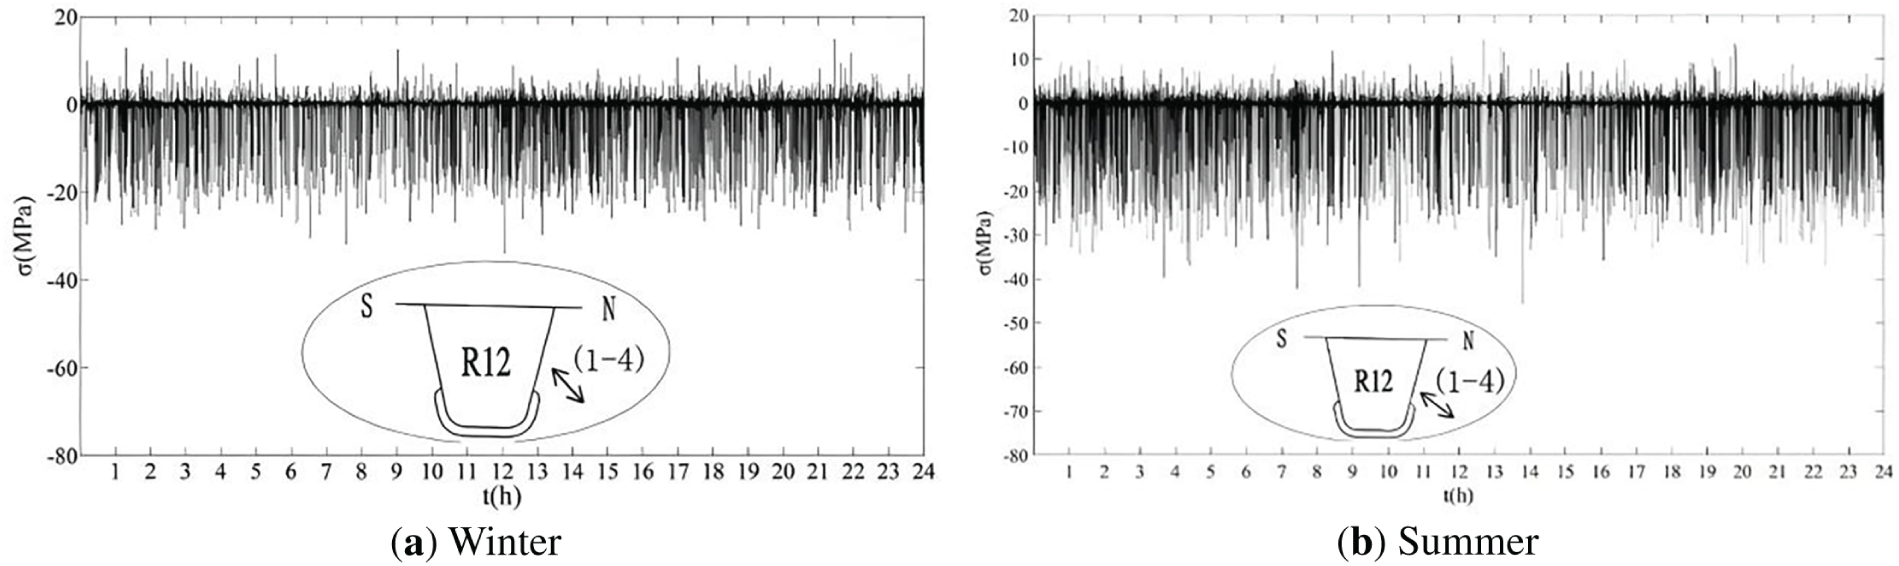
Figure 19: 24-h stress records at RF-F (1-4) weld
Comparing the stress records of strain gauges 1-3 and 1-4 between winter and summer shows that stress levels increase in summer, following a trend similar to that observed in the RD details. However, the increase in stress levels for the RF-F weld during summer is much less pronounced than the corresponding increase in the RD details, as illustrated in Figs. 18 and 19.
(2) RF-R Weld
Figs. 20 and 21 show the 24-h stress records for the RF-R weld on both sides of R12. The stress levels at these details are relatively low. On the south side, strain gauge 1-11 is mainly subjected to compressive stress, whereas on the north side, strain gauge 1-5 experiences nearly equal tensile and compressive stresses. Since the center of the left design wheel track is located close to the RD details on the north side of R12, the wheel load center is eccentric relative to R12. Based on the previously observed opposing stress patterns in the RF-F weld on both sides of R12 and the corresponding out-of-plane bending of the floor beam webs, it can be inferred that the eccentric wheel load on R12 induces lateral bending in the longitudinal rib at the floor beam location. This results in one side of the floor beam web experiencing tension while the other side is in compression. Since the longitudinal rib behaves as a continuous beam elastically supported by the floor beams [37–40], the rib web beneath the support point is subjected to compressive stress. The combination of lateral bending stress and compressive stress at the support point causes one side to be predominantly under compression, while the opposite side shows nearly balanced tensile and compressive stresses in the recorded data.
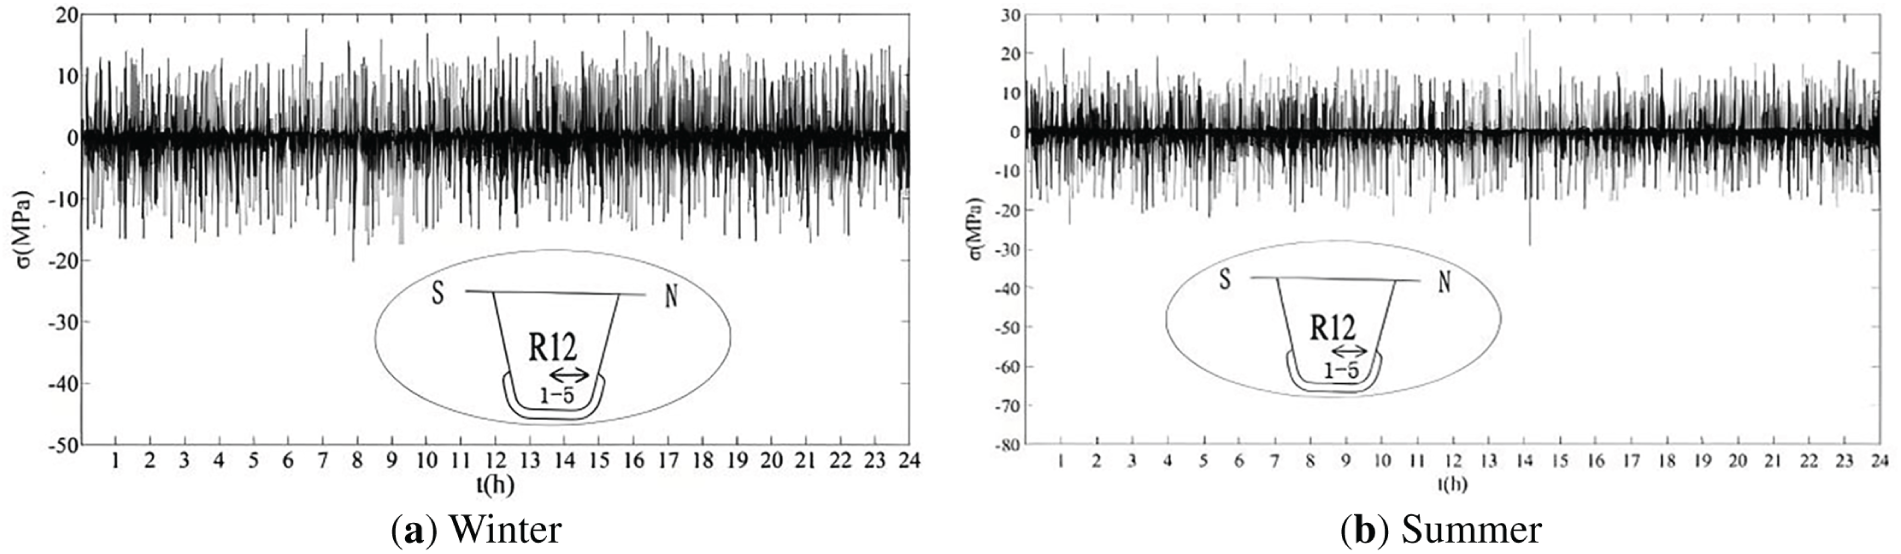
Figure 20: 24-h stress records at RF-R (1-5)
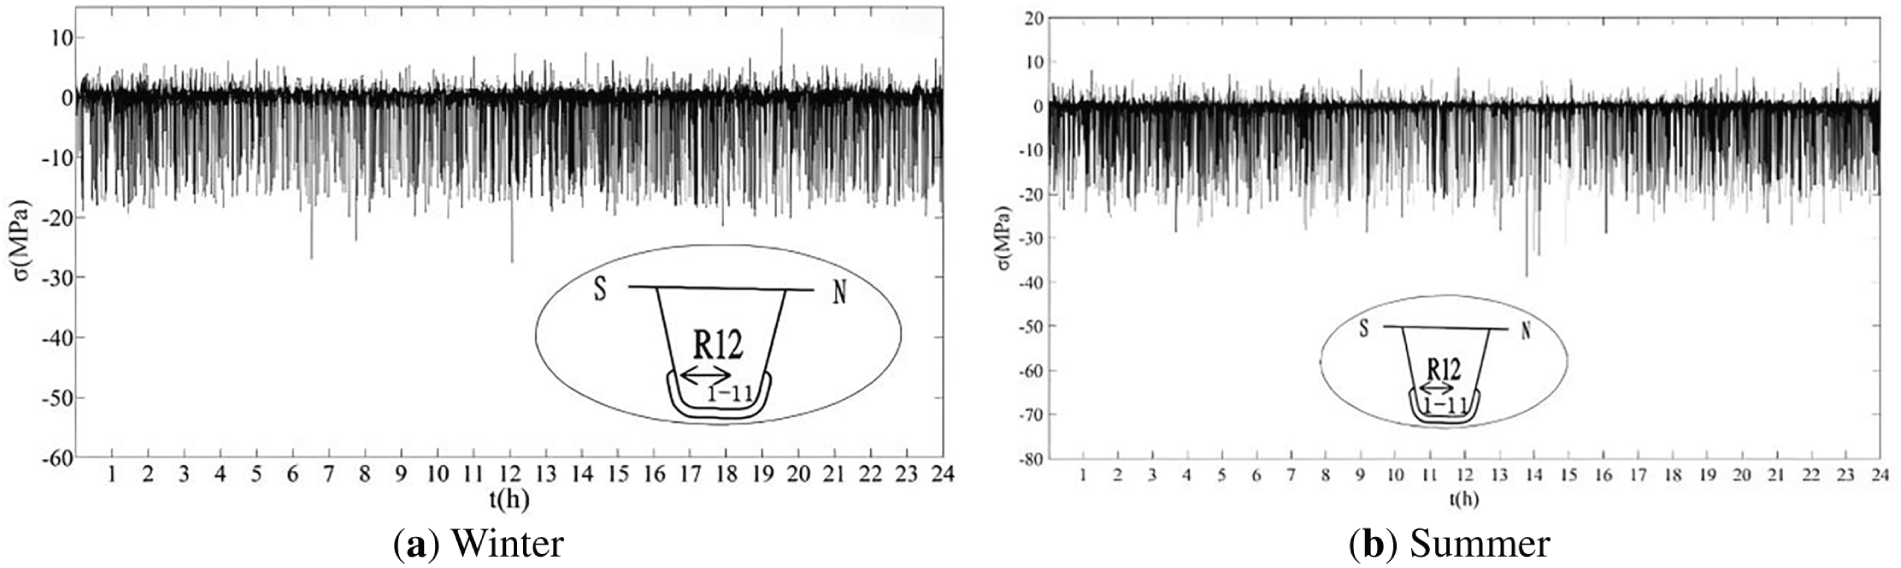
Figure 21: 24-h stress records at RF-R (1-11)
The increase in stress levels for the RF-R weld during summer is much less significant than that observed in the RD details. Stress levels in summer are only slightly higher than those in winter.
(3) RF-W Weld
Fig. 22 shows the 24-h continuous stress records for the RF-W welds on one side of R12, measured by strain gauge 1-6. This weld is located at the low end of the RF connection, at the fully welded joint. Comparison of the stress time histories between winter and summer shows that strain gauge 1-6, positioned directly beneath the design wheel track, is predominantly subjected to tensile stress. Notably, even in winter, the stress levels at the RF-W weld are relatively high, exceeding those of the RD, RF-F, and RF-R details, indicating that the RF-W weld is one of the most fatigue-critical locations in the welded OSD. Seasonal comparison further shows that stress levels are higher in summer, following a similar trend for both seasons.
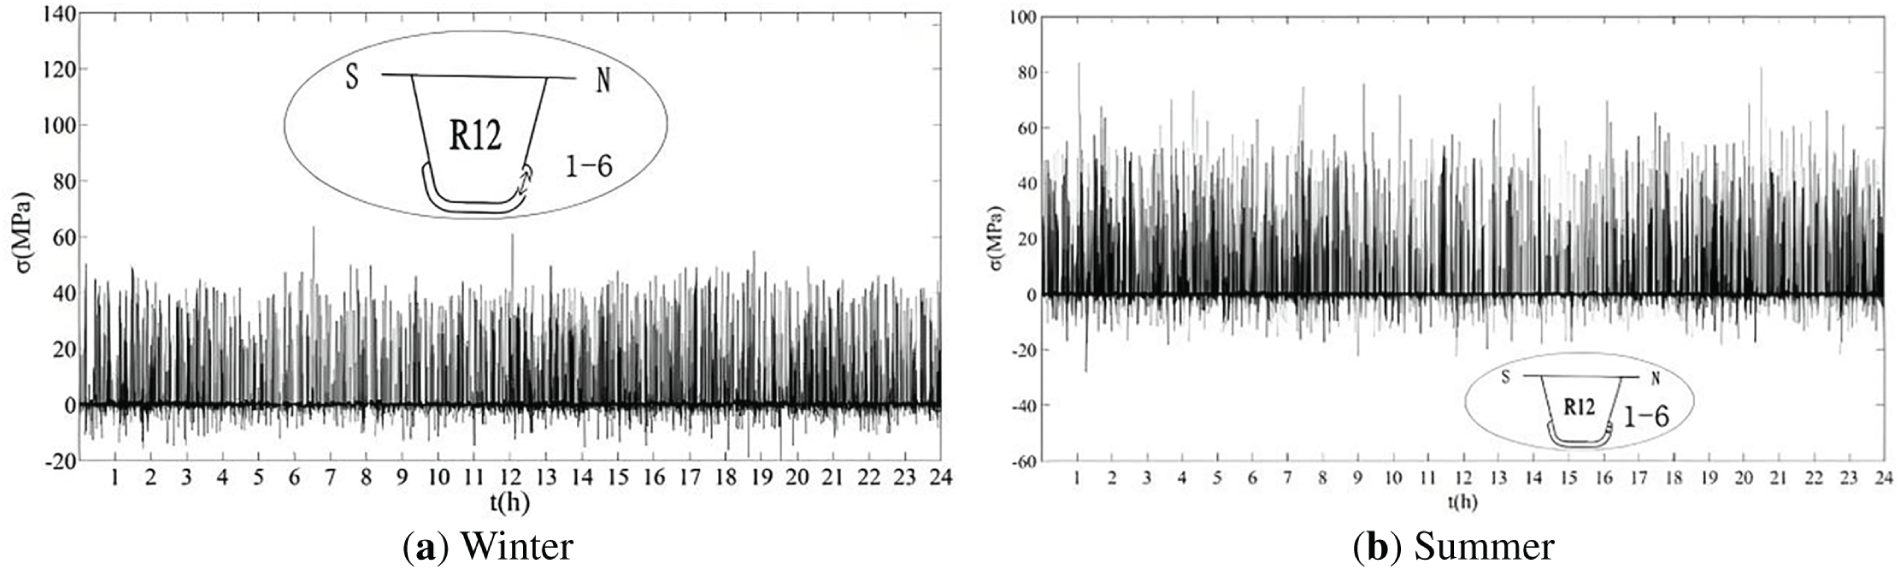
Figure 22: 24-h stress records at RF-W (1-6)
4.2.3 Short-Term Stress Records under Single Truck Passage
Using the three fatigue-prone details on both sides of R12 as examples, Fig. 23 shows the short-term stress records of RF-F, RF-R, and RF-W during the passage of a single truck. Among these details, RF-W (1-6) exhibits the highest stress response. The stress time histories of the two strain gauges positioned on the east and west sides of the floor beam in the RF-F weld on the north side display opposite signs, indicating that the RF-F weld experiences out-of-plane bending deformation under truck loading. Similarly, on the north and south sides of R12, the RF-W weld is subjected to tensile stress on the north side and compressive stress on the south side, indicating that warping deformation of the longitudinal rib produces a concave shape at the north-side weld and a convex shape at the south-side weld. Fig. 23c shows the in-plane and out-of-plane stress components, indicating that the stress at the RF-F weld on the north side is predominantly out-of-plane stress. This suggests that out-of-plane bending contributes significantly to the total stress at the RF-F weld. Therefore, minimizing out-of-plane deformation could be an effective approach to reduce its stress ranges.
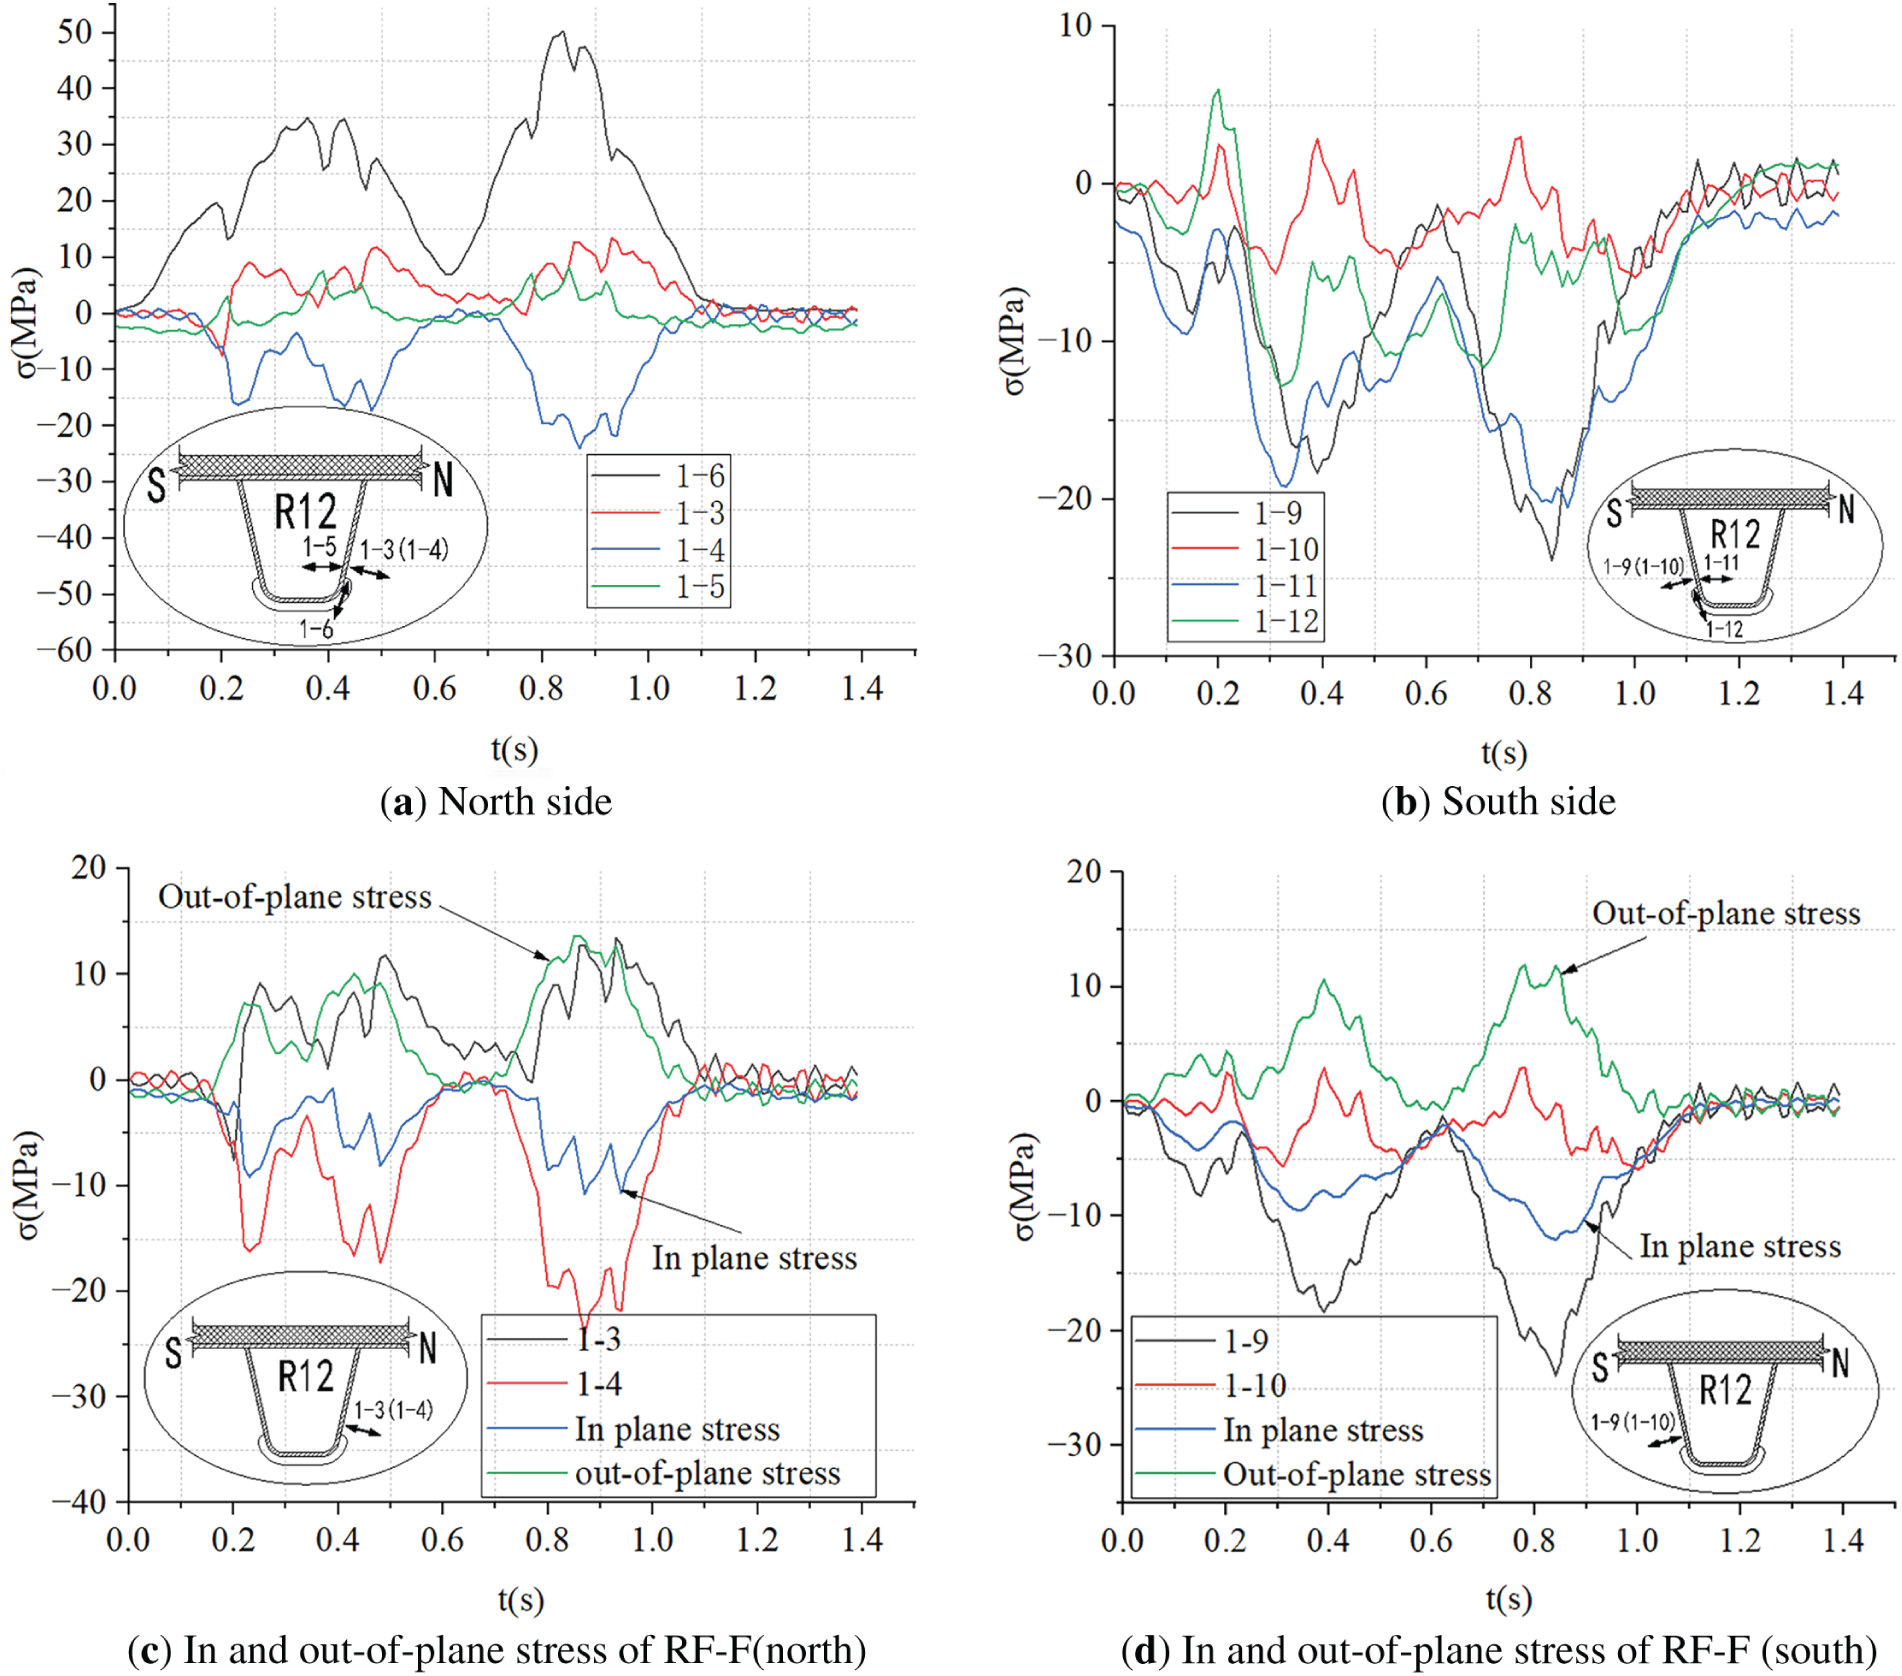
Figure 23: Short-term stress records at the RF weld of R12
Unlike the RD detail, which can clearly capture individual axles, the three RF details do not distinguish single axles within an axle group. Instead, each axle group produces a single stress cycle in these welds, resulting in a more pronounced “camel hump” pattern in the stress records. Since the stress peak from the front axle is significantly smaller than that from the middle and rear axle groups, it can be conservatively assumed that the total number of fatigue loading cycles induced by a single truck passage corresponds to the number of axle groups rather than the total number of individual axles.
4.3.1 Seven-Day Stress Records
Figs. 24–27 show the seven-day continuous stress records of the four Cutout details on the east and west sides of the floor beam web on both sides of R12. The results indicate no notable differences in stress levels between weekdays and weekends. Seasonal comparison reveals that stress levels at all four locations are higher in summer than in winter, although the increase is less pronounced than in the RD details. In addition, the two east-side positions are predominantly under compressive stress, whereas the two west-side positions experience both tensile and compressive stresses, with compressive stress being dominant. This pattern suggests that out-of-plane deformation also affects the Cutout details.
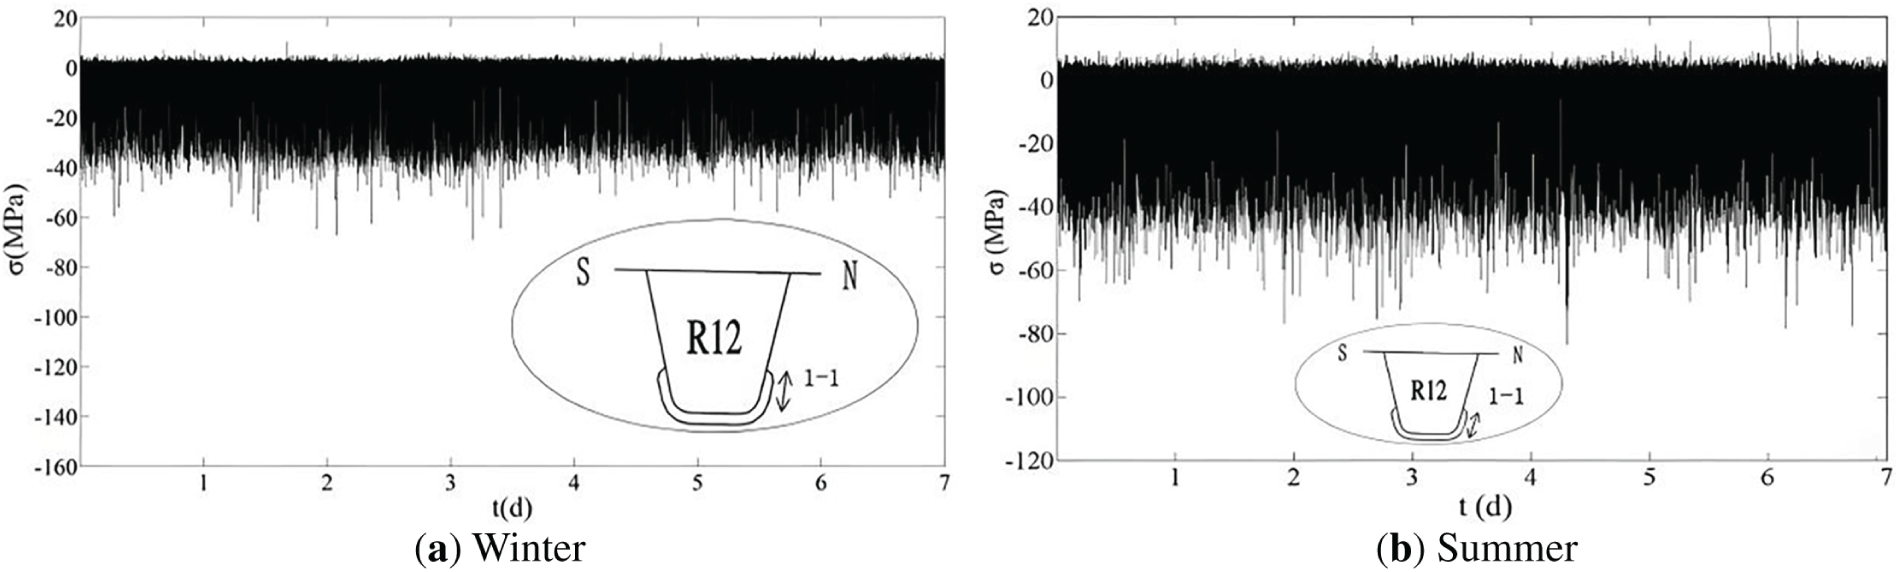
Figure 24: Seven-day stress records at cutout (1-1) weld
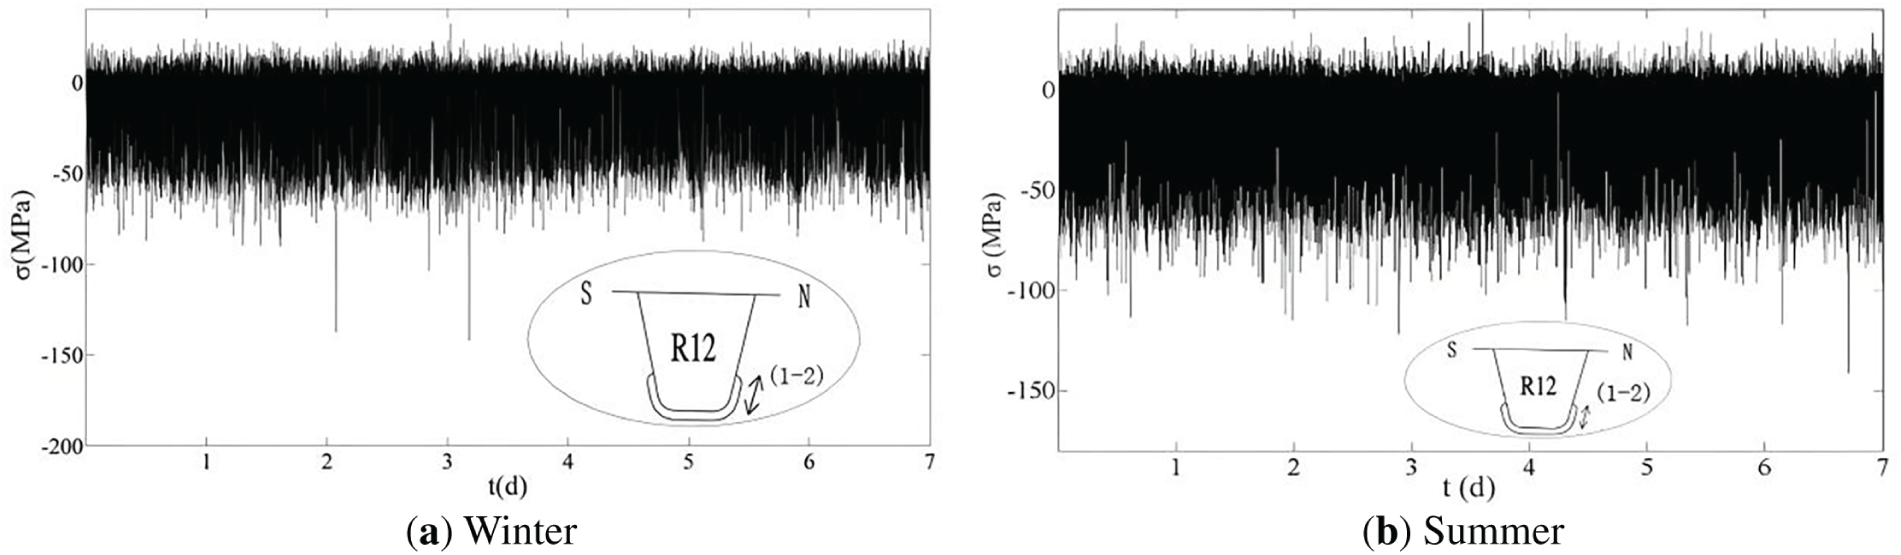
Figure 25: Seven-day stress records at cutout (1-2) weld
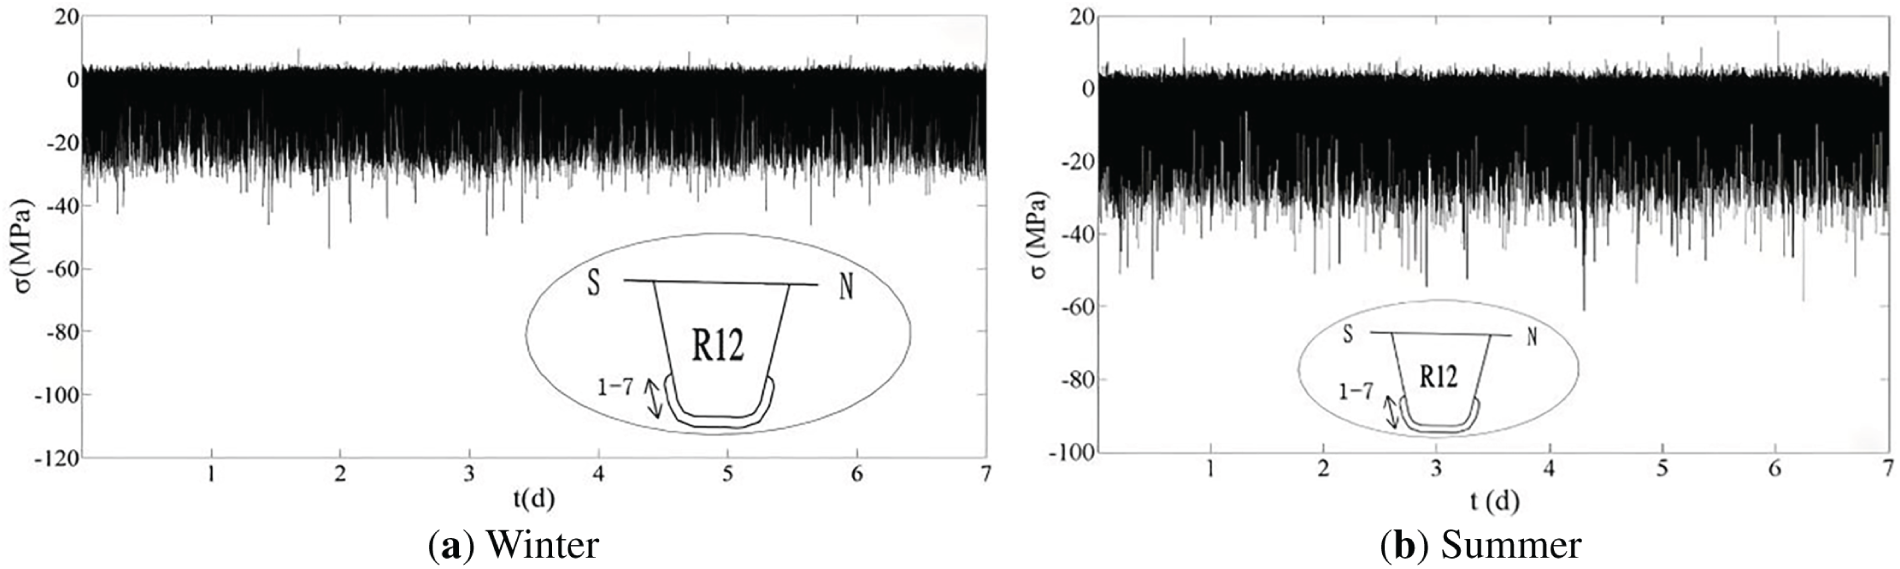
Figure 26: Seven-day stress records at cutout (1-7) weld
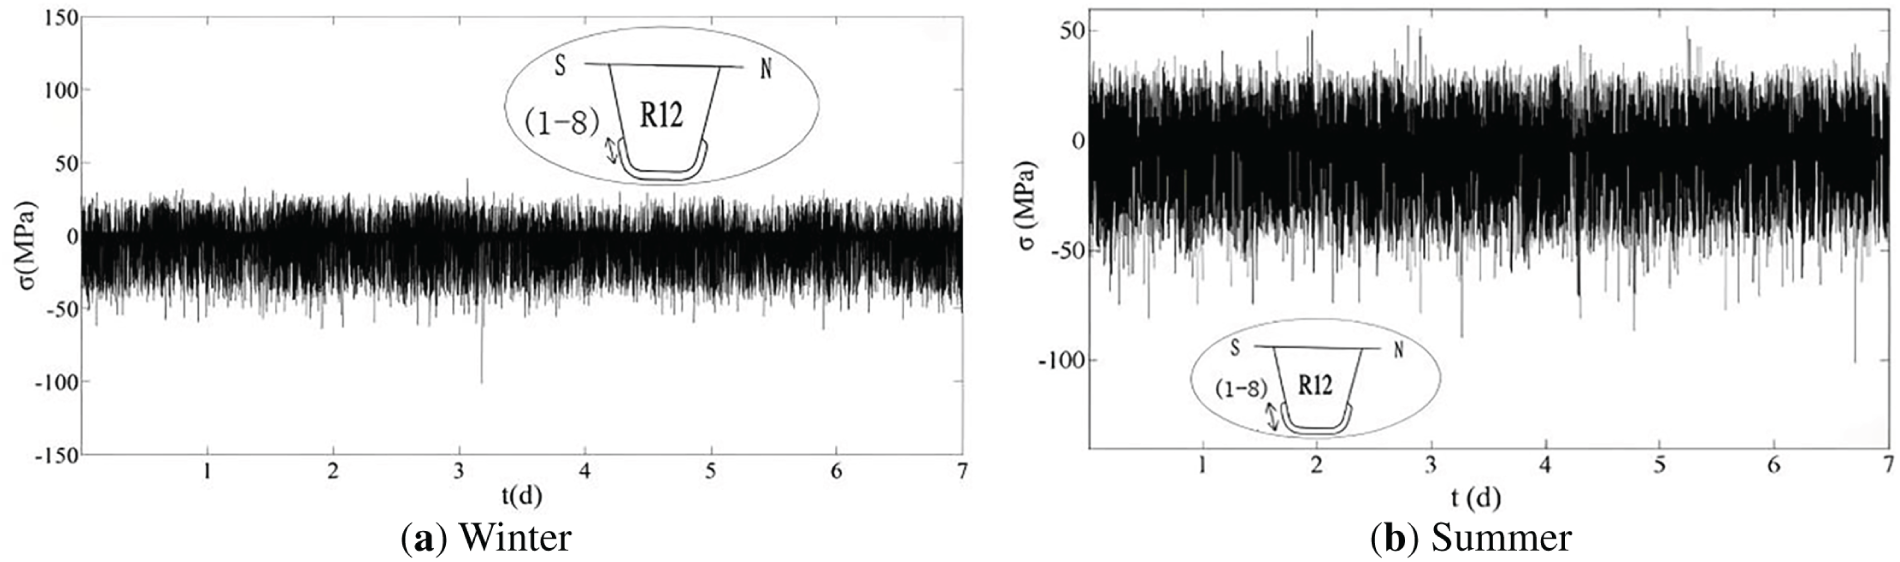
Figure 27: Seven-day stress records at cutout (1-8) weld
The 24-h continuous stress curves at the four Cutout positions (1-1, 1-2, 1-7, 1-8) exhibit similar characteristics. The east side of the transverse bulkhead web is primarily under compressive stress, whereas the west side experiences both tensile and compressive stresses, with lower stress levels on the east side than on the west side, as illustrated in Fig. 28. The observed stress asymmetry between the north and south sides of R12 and between the east and west sides of the transverse bulkhead web indicates that the Cutout region undergoes uneven out-of-plane deformation, resulting in varying out-of-plane bending stresses. Stress levels in summer are higher than in winter, although the increase is less pronounced than in the RD details. Due to space limitations, this study focuses on the 24-h winter and summer stress curves at position 1-1.
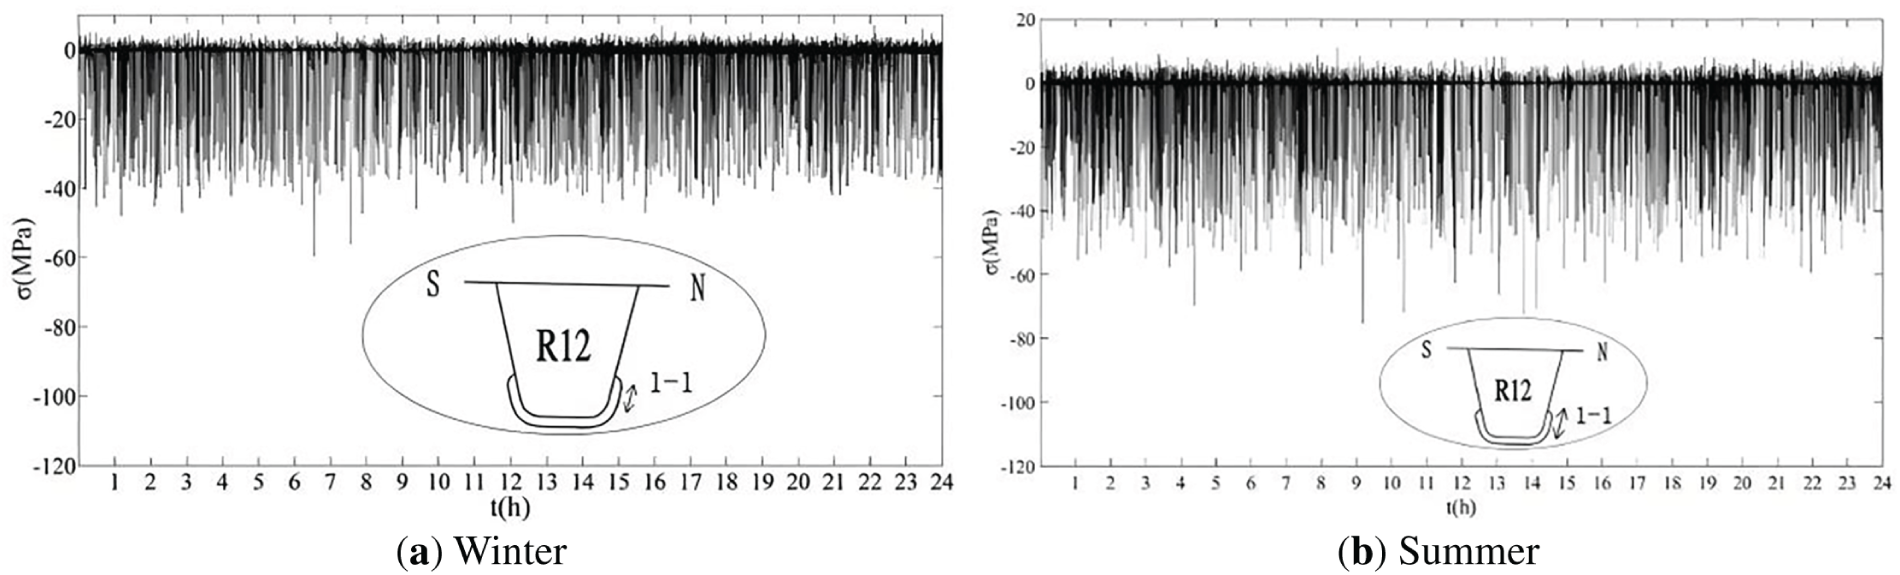
Figure 28: 24-h stress records at cutout (1-1) weld
4.3.3 Short-Term Stress Records under Single Truck Passage
Fig. 29 shows the short-term stress records of the four Cutout details during the passage of a single truck. The stress ranges at the four locations differ considerably. Strain gauge 1-2, positioned on the west side of the floor beam web directly beneath the design wheel track, exhibits the highest stress. In contrast, strain gauge 1-1, located on the opposite side of the floor beam web, experiences a lower stress level. The stress further decreases at strain gauge 1-7 on the south side of R12, whereas strain gauge 1-8, on the opposite side of the floor beam web, records the lowest stress. The variation in stress levels among the four Cutout details indicates that the Cutout details on both sides of R12 experience different load effects, leading to uneven out-of-plane deformation and bending stresses, as shown in Fig. 29b. On the north side of R12, the Cutout at the floor beam web is primarily influenced by in-plane stress, with relatively small out-of-plane bending stress. In contrast, on the south side of R12, the magnitudes of out-of-plane and in-plane stresses are similar, likely due to the eccentric wheel load applied to R12.
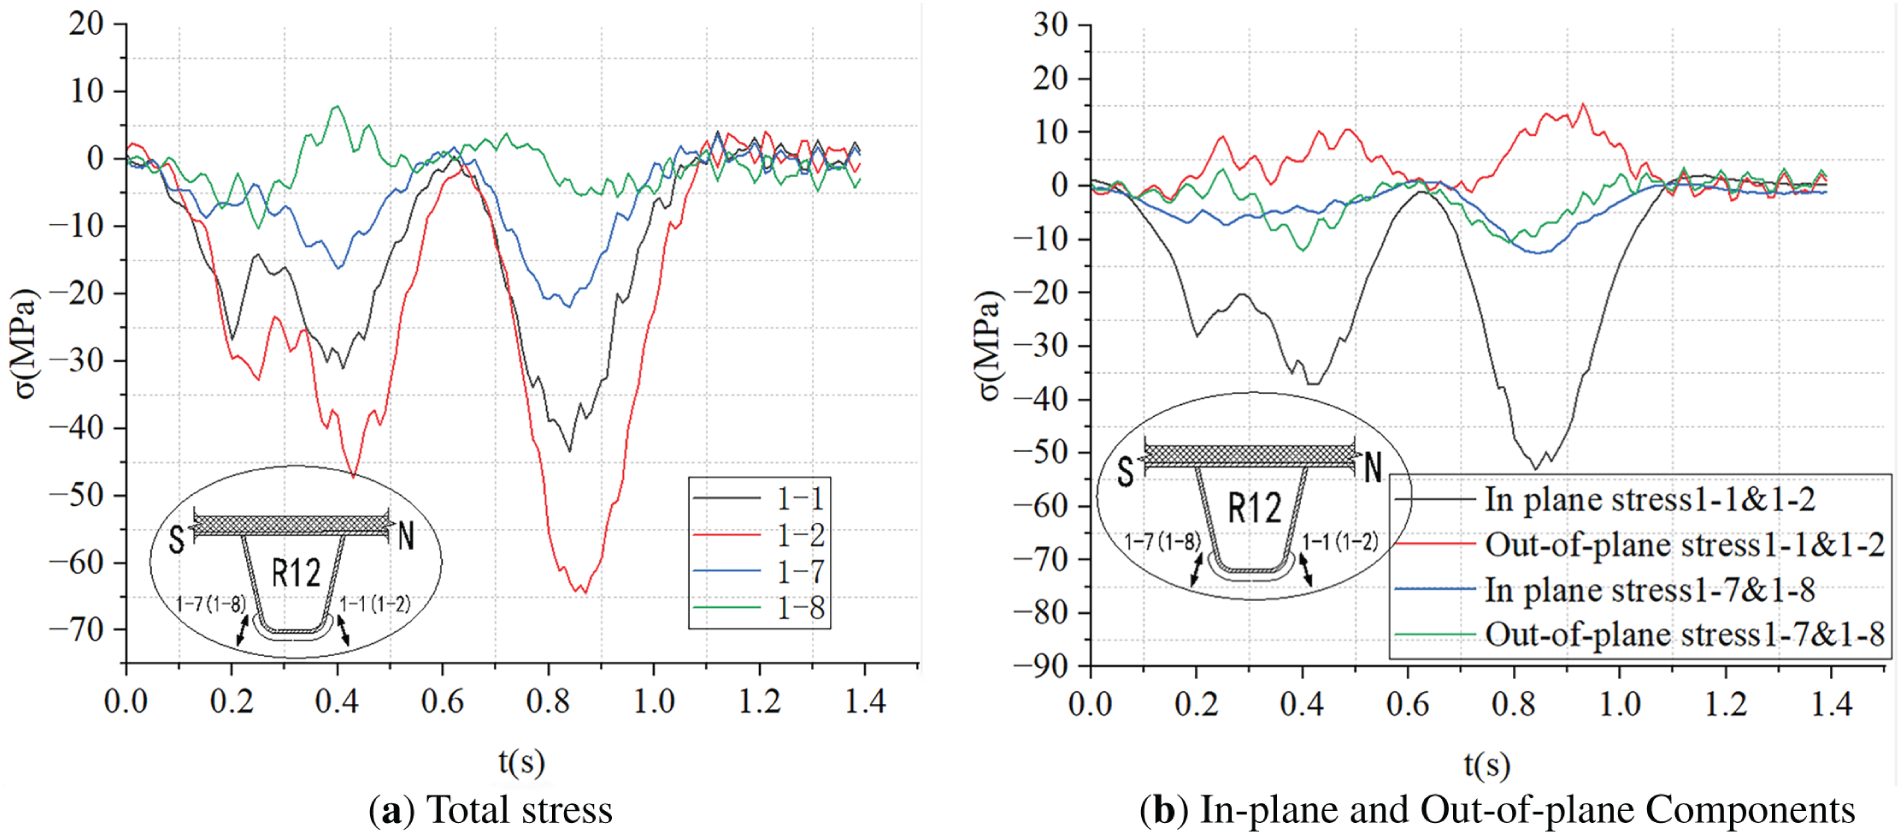
Figure 29: Short-term stress records at Cutout detail
The stress response at the Cutout detail can identify axle groups, but does not distinguish individual axles within a group. Consequently, the total number of fatigue loading cycles caused by a single truck passage at the Cutout detail corresponds to the total number of axle groups.
Traditional OSD with EAC pavement shows significant seasonal variations in deck stiffness, with higher stiffness in winter and considerably lower stiffness in summer. To evaluate the effects of seasonal temperature changes on the stress state and fatigue performance of OSD details, this study carried out seven-day continuous field measurements of OSD details during both winter and summer on a long-span cable-stayed bridge that has been in service for several years. Based on the comparison of stress responses and fatigue performance of these details under random traffic loading between winter and summer, the main conclusions of this study are summarized as follows:
(1) Across all OSD details, both stress levels and loading cycles are generally higher in summer than in winter, with the most pronounced increase observed in the RD detail, particularly on the deck plate side. Therefore, the OSD is more susceptible to fatigue damage during the summer season. For the RF and Cutout details, the stress levels are also higher in summer than in winter; however, the increase is less significant than that observed in the RD details.
(2) When the RD detail is positioned directly beneath a wheel load, each truck axle produces one complete stress cycle in the RD detail. Thus, the total number of fatigue cycles caused by a single truck passage corresponds to the total number of axles. In contrast, the RF and Cutout details cannot distinguish individual axles within an axle group; instead, each axle group generates a single stress cycle. Consequently, the number of fatigue load cycles at those details equals the total number of axle groups.
(3) Stress measurements at the RD details show that the local stress effects dominate over global effects under wheel loads, indicating that the stress response of RD details is highly localized.
(4) This study demonstrates that high summer temperatures substantially reduce the elastic modulus of the epoxy asphalt pavement, thereby diminishing the stiffness contribution of the pavement layer to the bridge deck. Therefore, the bending stiffness of the deck decreases in summer, leading to high stress levels in OSD details.
(5) Although fatigue-sensitive details of OSD show notable differences between winter and summer under random traffic loads, additional factors such as EAC aging and vehicle overloading can also cause significant variations in the fatigue stresses of structural details. Future finite-element analysis could examine each factor individually to determine the primary contributors to these discrepancies.
Acknowledgement: The authors thank the Hubei Provincial Communications Survey & Design Institute, China, for providing technical support during the field measurements.
Funding Statement: This research was supported by the National Natural Science Foundation of China (Grant No. 52278509) and the National Natural Science Foundation of Guangdong Province (Grant No. 2022A1515 010261).
Author Contributions: Tao Yuan: Primary writing; Qin Tang: Data collation and analysis; Zhiwen Zhu: Paper-structure planning and review; Jin Jiang: Field experiments; Lin Zhang: Experiment review; Gangqiao Wang: Field experiments and data consolidation. All authors reviewed the results and approved the final version of the manuscript.
Availability of Data and Materials: The data supporting the findings of this study are included within the article.
Ethics Approval: This study is limited to the structural-response monitoring and post-service inspection of an existing steel bridge. It did not involve human or animal subjects, tissues, or personal data, and therefore did not require ethics-committee approval.
Conflicts of Interest: The authors declare no conflicts of interest to report regarding the present study.
References
1. Zhu Z, Xiang Z, Li J, Carpinteri A. Fatigue damage investigation on diaphragm cutout detail on orthotropic bridge deck based on field measurement and FEM. Thin Walled Struct. 2020;157:107106. doi:10.1016/j.tws.2020.107106. [Google Scholar] [CrossRef]
2. Cui C, Zhang Q, Zhang D, Lao W, Wu L, Jiang Z. Monitoring and detection of steel bridge diseases: a review. J Traffic Transp Eng Engl Ed. 2024;11(2):188–208. doi:10.1016/j.jtte.2024.03.001. [Google Scholar] [CrossRef]
3. Tang K, Cui C, Liu JW, Ma Y, Zhang QH, Lao WL. Multiscale and multifield coupled fatigue crack initiation and propagation of orthotropic steel decks. Thin Walled Struct. 2024;199:111843. doi:10.1016/j.tws.2024.111843. [Google Scholar] [CrossRef]
4. Wang X, Miao C, Yang M, Ding Y. Fatigue performance of orthotropic steel decks in super-wide steel box girder considering transverse distribution of vehicle load. Struct Durab Health Monit. 2021;15(4):299–316. doi:10.32604/sdhm.2021.017526. [Google Scholar] [CrossRef]
5. Zhao P, Qin Y, Wu B, Chen Y, Chen X, Wen J. Impact of stiffener configuration on the structural performance of orthotropic steel bridge deck. Struct Durab Health Monit. 2025;19(5):1367–86. doi:10.32604/sdhm.2025.067558. [Google Scholar] [CrossRef]
6. Xiong S, Zhao S, Wang D, Tang Z, Lan X, Chen Q, et al. Study on fatigue parameters of high modulus asphalt pavement. Case Stud Constr Mater. 2024;21:e03491. doi:10.1016/j.cscm.2024.e03491. [Google Scholar] [CrossRef]
7. Xiang Z, Zhu Z. Fatigue behavior of orthotropic composite bridge decks without cutout at rib-to-floorbeam intersection. J Constr Steel Res. 2023;201:107596. doi:10.1016/j.jcsr.2022.107596. [Google Scholar] [CrossRef]
8. Shi L, Ding Y, Cheng B. Damage assessment in fatigue-prone connection of orthotropic steel deck based on Lamb-wave characteristic. Structures. 2025;81:110240. doi:10.1016/j.istruc.2025.110240. [Google Scholar] [CrossRef]
9. Lu Q, Bors J. Alternate uses of epoxy asphalt on bridge decks and roadways. Constr Build Mater. 2015;78:18–25. doi:10.1016/j.conbuildmat.2014.12.125. [Google Scholar] [CrossRef]
10. Abdelbaset H, Zhu Z. Behavior and fatigue life assessment of orthotropic steel decks: a state-of-the-art-review. Structures. 2024;60:105957. doi:10.1016/j.istruc.2024.105957. [Google Scholar] [CrossRef]
11. Connor R, Fisher J, Gatti W, Gopalaratnam G, Kozy B, Leshko B, et al. Manual for design, construction, and maintenance of orthotropic steel deck bridges. Washington, DC, USA: US Department of Transportation Federal Highway Administration; 2012. 291 p. Report No.: FHWA-IF-12-027. [Google Scholar]
12. Luo S, Qian Z, Yang X, Lu Q. Fatigue behavior of epoxy asphalt concrete and its moisture susceptibility from flexural stiffness and phase angle. Constr Build Mater. 2017;145:506–17. doi:10.1016/j.conbuildmat.2017.04.049. [Google Scholar] [CrossRef]
13. Maggenti R, Shatnawi S. Initial and replacement riding surface for the orthotropic San Mateo/Hayward Bridge. Bridge Struct. 2017;13(2–3):81–92. doi:10.3233/brs-170116. [Google Scholar] [CrossRef]
14. Liu J, Liu M, Ma S, Tu J. Study on in-plane double-crack propagation in the rib-to-deck welded toe of steel-bridge. J Constr Steel Res. 2023;203:107838. doi:10.1016/j.jcsr.2023.107838. [Google Scholar] [CrossRef]
15. Wang GX, Ding YL, Song YS, Wei Z. Influence of temperature action on the fatigue effect of steel deck with pavement. Eng Mech. 2016;33(5):115–23. (In Chinese). doi:10.6052/j.issn.1000-4750.2014.08.0695. [Google Scholar] [CrossRef]
16. Xiang Z, Zhu Z, Lei X. Fatigue assessment and crack propagation of floorbeam cutout in orthotropic bridge decks. Mater Des. 2023;226:111676. doi:10.1016/j.matdes.2023.111676. [Google Scholar] [CrossRef]
17. Zhu Z, Yuan T, Xiang Z, Huang Y, Zhou YE, Shao X. Behavior and fatigue performance of details in an orthotropic steel bridge with UHPC-deck plate composite system under in-service traffic flows. J Bridge Eng. 2018;23(3):04017142. doi:10.1061/(asce)be.1943-5592.0001167. [Google Scholar] [CrossRef]
18. Zhu Z, Xiang Z, Li J, Huang Y, Ruan S. Fatigue behavior of orthotropic bridge decks with two types of cutout geometry based on field monitoring and FEM analysis. Eng Struct. 2020;209:109926. doi:10.1016/j.engstruct.2019.109926. [Google Scholar] [CrossRef]
19. Wang SL, Qi FL, Ke ZT, Gao Y. Experimental study on the effect of an epoxy asphalt concrete pavement on an orthotropic steel deck. Eng Mech. 2020;37(10):145–54. (In Chinese). doi:10.6052/j.issn.1000-4750.2019.11.0690. [Google Scholar] [CrossRef]
20. Qin S, Zhong A, Zhang J, Wang K, Gao L. Hot spot stress distribution and fatigue life evaluation of steel-UHPC deck in a long-span cable-stayed bridge. J Constr Steel Res. 2024;213:108406. doi:10.1016/j.jcsr.2023.108406. [Google Scholar] [CrossRef]
21. Li J, Zhu Z. Stress behaviors at rib-to-floorbeam weld and cutout details under controlled truck loading. Appl Sci. 2022;12(6):3012. doi:10.3390/app12063012. [Google Scholar] [CrossRef]
22. Zeng G, Xu W, Huang H. Study of the strain response of asphalt pavements on orthotropic steel bridge decks through field testing and numerical simulation. J Test Eval. 2020;48(2):1615–33. doi:10.1520/jte20170692. [Google Scholar] [CrossRef]
23. Hoang VH, Nguyen QT, Tran AT, Tran TCH, Do TA. Mechanical behavior of the asphalt wearing surface on an orthotropic steel bridge deck under cyclic loading. Case Stud Constr Mater. 2022;16:e00836. doi:10.1016/j.cscm.2021.e00836. [Google Scholar] [CrossRef]
24. Yuan T. Fatigue study of steel-UHPC composite orthotropic bridge deck based on field measurements [dissertation]. Changsha, China: Hunan University; 2022. (In Chinese). doi:10.27135/d.cnki.ghudu.2022.004814. [Google Scholar] [CrossRef]
25. Wang X, Miao C, Chen R. Time-variant fatigue reliability assessment of rib-to-deck welded joints using ANN-based methods. Structures. 2022;42:244–54. doi:10.1016/j.istruc.2022.06.020. [Google Scholar] [CrossRef]
26. Wolchuk R, Ostapenko A. Secondary stresses in closed orthotropic deck ribs at floor beams. J Struct Eng. 1992;118(2):582–95. doi:10.1061/(asce)0733-9445(1992)118:. [Google Scholar] [CrossRef]
27. Zhang D, Cui C, Zhang X, Jiang Z, Zhang X, Bao Y. Monitoring fatigue cracks in rib-to-deck joints of orthotropic steel deck using ultrasonic Lamb waves. Thin Walled Struct. 2023;189:110922. doi:10.1016/j.tws.2023.110922. [Google Scholar] [CrossRef]
28. Abdelbaset H, Cheng B, Tian L, Li HT, Zhao J. Enhancing fatigue resistance of rib-to-floorbeam welded connections in orthotropic steel bridge decks by using UHPC layer: an experimental study. Structures. 2022;36:153–67. doi:10.1016/j.istruc.2021.12.008. [Google Scholar] [CrossRef]
29. Han SH, Cui C, Zheng QS, Zhang QH, Bu YZ. Effect of ultrasonic impact treatment on welding residual stress and fatigue resistance of doubly-welded rib-to-deck joints in OSD. J Constr Steel Res. 2023;211:108157. doi:10.1016/j.jcsr.2023.108157. [Google Scholar] [CrossRef]
30. Zhang QH, Ma Y, Cui C, Chai XY, Han SH. Experimental investigation and numerical simulation on welding residual stress of innovative double-side welded rib-to-deck joints of orthotropic steel decks. J Constr Steel Res. 2021;179:106544. doi:10.1016/j.jcsr.2021.106544. [Google Scholar] [CrossRef]
31. Cui C, Ma Y, Zhang QH, Da LT, Han SH. Fatigue strength and crack growth of double-side welded rib-to-deck joint in orthotropic steel decks. J Constr Steel Res. 2022;196:107444. doi:10.1016/j.jcsr.2022.107444. [Google Scholar] [CrossRef]
32. Heng J, Zheng K, Feng X, Veljkovic M, Zhou Z. Machine learning-assisted probabilistic fatigue evaluation of rib-to-deck joints in orthotropic steel decks. Eng Struct. 2022;265:114496. doi:10.1016/j.engstruct.2022.114496. [Google Scholar] [CrossRef]
33. Wang C, Feng Y. A review of fatigue research on orthotropic steel bridge decks. Steel Constr. 2009;24(9):10-13,32. (In Chinese). [Google Scholar]
34. Zhu A, Ouyang S, Chen Y, Sun Y. Fatigue test and life evaluation of rib-to-deck connections in orthotropic steel bridge decks. J Constr Steel Res. 2022;197:107442. doi:10.1016/j.jcsr.2022.107442. [Google Scholar] [CrossRef]
35. Connor RJ. Influence of cutout geometry on stresses at welded rib-to-diaphragm connections in steel orthotropic bridge decks. Transp Res Rec J Transp Res Board. 2004;1892(1):78–87. doi:10.3141/1892-09. [Google Scholar] [CrossRef]
36. American Association of State Highway and Transportation Officials. AASHTO LRFD bridge design specifications with 2010 interim revisions. 5th ed. Washington, DC, USA: American Association of State Highway and Transportation Officials; 2012. [Google Scholar]
37. Turkalj G, Lanc D, Banić D, Brnić J, Vo TP. A shear-deformable beam model for stability analysis of orthotropic composite semi-rigid frames. Compos Struct. 2018;189:648–60. doi:10.1016/j.compstruct.2018.01.105. [Google Scholar] [CrossRef]
38. EN 1993-1-9. Eurocode 3: design of steel structures—part 1-9: fatigue. Brussels, Belgium: European Committee for Standardization; 2005. [Google Scholar]
39. Connor RJ, Fisher JW. Results of field measurements on the Williamsburg Bridge orthotropic deck-final report. Bethlehem, PA, USA: Department of Civil and Environmental Engineering, Lehigh University; 2001. 176 p. ATLSS Report No:. 01-01. [Google Scholar]
40. Tsakopoulos PA, Fisher JW. Full-scale fatigue tests of steel orthotropic deck panel for the Bronx-Whitestone Bridge rehabilitation. Bridge Struct. 2005;1(1):55–66. doi:10.1080/15732480412331294704. [Google Scholar] [CrossRef]
Cite This Article
 Copyright © 2026 The Author(s). Published by Tech Science Press.
This work is licensed under a Creative Commons Attribution 4.0 International License , which permits unrestricted use, distribution, and reproduction in any medium, provided the original work is properly cited.
 Downloads
 Citation Tools