
 Submit a Paper
 Propose a Special lssue
 Open Access
ARTICLE

An Intelligent System for Pavement Health Monitoring Using Perception Sensors Aided Deep Learning Algorithms
Department of Mechanical Engineering, Faculty of Engineering, Alexandria University, Alexandria, 21544, Egypt
* Corresponding Author: Wael A. Altabey. Email:
(This article belongs to the Special Issue: Advanced Sensing, Smart Materials and Intelligent Algorithms for Structural Health Monitoring in Various Domains)
Structural Durability & Health Monitoring 2026, 20(2), 5 https://doi.org/10.32604/sdhm.2025.073949
Received 29 September 2025; Accepted 11 November 2025; Issue published 31 March 2026
 View Full Text
 Download PDF
Abstract
The study of long-term pavement performance is a fundamental topic in the field of highway engineering. Through comprehensive and in-depth research on the pavement system, the previous scattered, one-sided, superficial, and perceptual knowledge and experience are summarized and sublimated into a systematic and complete engineering theory, thereby providing powerful guidance and assistance for the practice of pavement design, construction, maintenance, operation, and management. In this research, the mentoring system deployment technology for automatic monitoring is carried out for long-term pavement performance. By burying a variety of sensors in different parts of the road surface, base, roadbed, slope, etc., a sensor monitoring network based on the Internet of Things technology is formed to achieve accurate, reliable, and continuous observation of environmental meteorology, physical state, mechanical response, structural deformation, and other indicators. The large amount of data and high real-time requirements mean that the perception data collected from sensors, including temperature, humidity, pressure, asphalt strain, and displacement, can be used to train a deep learning model based on a Convolutional Neural Network (CNN) algorithm. This model predicts multi-point pavement displacement to detect damage such as asphalt cracks and potholes. The response of the proposed CNN achieved a high accuracy rate, regression rate, and F-score equal to 87.24%, 84.12%, and 85.96%, respectively. This work highlights the potential of using a variety of sensors to aid deep learning algorithms for monitoring long-term pavement performance.Keywords
For a long time, the service life of pavement has been short, and it is difficult to reach the design life. The maintenance cycle of the pavement is short, which greatly wastes manpower, material, and financial resources.
The first step in checking on road conditions is to monitor the pavement, which helps us assess how well the roads are performing and whether they’re safe and comfortable for drivers. Several studies have looked into this, trying to figure out just how damaged the pavement might be [1,2]. There are different ways to monitor road surfaces, whether they’re paved or unpaved, to understand the type and extent of any damage. This is really important for deciding on the right maintenance approaches. When it comes to monitoring pavement conditions, you’ve got two main options: static monitoring and dynamic monitoring. The choice depends on the kind of equipment and measurement methods being used [1]. In static monitoring, you set up detection devices in specific spots for a certain amount of time. On the other hand, dynamic monitoring involves using devices attached to vehicles, collecting data as those vehicles drive along different road sections. This method gives a snapshot of the pavement’s condition across various parts of the road [2–5].
There are quite a few methods out there for checking how good our road surfaces are and how well our road networks are serving drivers. Some of these methods involve things like visual inspections, image analysis, checking vibrations, tools that measure roughness (like profilometers), and using Pavement Condition Indices (PCIs). In this paper, we focus on using data from pavement vibrations as a way to gauge the state of the road, which we capture with an accelerometer sensor while vehicles are on the move. This vibration data gives us insights into the condition of the road surface and any wear or damage. When the road is in bad shape, it can lead to more vibrations in the vehicle, making for a bumpy and uncomfortable ride [1,6,7].
Monitoring the condition of road pavement and predicting its deterioration go hand in hand when it comes to sustainable road management. The first step in assessing how well a road is holding up is to pinpoint the type, severity, and number of issues on its surface. With accurate data on pavement conditions, we can create reliable models to forecast how the pavement will degrade over time. These prediction models are crucial for transport agencies, as they help them understand how pavement behaves and how quickly it deteriorates under various traffic situations. Different techniques have been used to create prediction models, including Artificial Neural Networks (ANN), empirical methods, mechanistic-empirical approaches, and Machine Learning models [6,7].
There are a bunch of different technologies and techniques out there for accurately checking pavement conditions with minimal errors. Some of these include vision-based methods and vibration-based approaches. When it comes to vision-based methods, video cameras have become popular for monitoring pavement conditions [7,8]. They not only help in tracking pavement condition but also verify findings from vibration studies, giving us better insights into the actual state of the pavement [9–12]. For instance, Koch et al. [13] did a thorough study on using computer vision for detecting pavement distress. They highlighted the benefits of using a vision-based method for monitoring both concrete and asphalt pavement and suggested that video cameras are a reliable way to get accurate results. Hadjidemetriou et al. [14] worked on a technique for detecting patches using a vision-based approach. They employed two video cameras—a built-in smartphone camera and an external one—to assess road networks in Cyprus. These cameras captured video as vehicles moved, which was then processed into individual frames for analyzing the severity and extent of patches on the roads. Similarly, Shtayat et al. [1] recorded local road conditions in Melbourne, Australia, using a line-scan camera mounted on the rear of a sedan. This setup helped to document pavement surface issues while the car was on the move at various speeds, yielding valuable insights about the pavement’s actual condition, along with details on the type, severity, and location of any distress.
On the flip side, vibration-based methods have gained traction among researchers over the past decade for assessing pavement conditions and giving crucial insights into pavement health. These systems are great for revealing road pavement anomalies, surface smoothness, and overall comfort while riding [15]. Recently, monitoring pavement vibration data has proven to be effective in enhancing pavement management systems [16]. The effectiveness of using vibrations as a gauge for pavement conditions lies in its ability to identify how severe deformations are on road surfaces [17,18].
To gather pavement vibration data while vehicles are moving, dynamic monitoring systems make use of accelerometer sensors, smartphone apps, and wireless vibration meters [19]. For example, Li et al. [19] utilized an accelerometer to measure vibrations caused by vehicles passing over road defects at low speeds. This allowed them to dynamically assess the condition of the pavement surface based on the vibrations recorded during vehicle movement.
Sabir et al. [20] introduced a new way to monitor road conditions, focusing mainly on detecting potholes and speed bumps in Pakistan. Their method relies on specific ranges of vibration thresholds for both types of issues, utilizing crowdsourced data. When the vertical vibration readings surpass the chosen limits, the system flags those peaks as potential potholes. Their algorithm managed to accurately detect around 85% of potholes and about 90% of speed bumps. Meanwhile, Wu et al. [21] took a different approach by using a smartphone app placed on the back seat of a sedan to gather vibration data from urban roads in China. They analyzed the vibrations to identify various types of road distress using the Dynamic Time Warping (DTW) technique. They also created a reference dataset for potholes based on the vibration data they collected. Recognition was achieved by comparing the gathered information to these reference layouts, and their random forest (RF) method showed about 88.5% accuracy in detecting potholes.
There’s been a lot of work to improve detection rates using vibration data, with algorithms developed to incorporate different types of filters like high-pass filters, XZ-ratio filters, and z-peak filters to boost accuracy [21]. Each of these filters has unique characteristics that help manage and enhance the quality of the monitoring data, using specific thresholds as tuning parameters to improve detection accuracy. With these filters, the detection rate for potholes can reach around 92% after clustering and labeling [22,23].
When it comes to machine learning (ML), there are standard steps involved. It starts with selecting an appropriate filter to reduce random data and noise, then extracting relevant features that represent potential distresses from both time and frequency domains. After that, the features are classified to pinpoint the correct type of pavement distress. This stage helps researchers gauge the overall condition of the pavement, along with assessing the quantity and severity of any degradations [24]. The process of extracting features from thresholds is crucial for predicting pavement performance [25]. ML models serve as classification tools to identify both the type and severity of distress based on these thresholds and to forecast pavement conditions. For example, Seraj et al. [26] and Basavaraju et al. [27] used a smartphone app to gather pavement vibration data with the goal of developing an ML algorithm that could classify features from the vibration threshold data. They also extracted features using Fast Fourier Transform (FFT) and Discrete Wavelet Transform (DWT) from both time and frequency domains. Additionally, Altabey [28] and Li et al. [29] proposed a fresh approach for predicting the quantity and severity of potholes by extracting features from vibration thresholds using DWT.
We can follow the development of road damage detection approaches during the last decade in Fig. 1. By establishing an advanced and practical pavement health and safety monitoring system based on a deep learning model for the pavement, we can grasp the pavement operation status in real time and realize real-time safety alarms for the pavement service level; rationally allocate pavement maintenance resources; provide a scientific and technological basis for reducing pavement operation and maintenance costs; and ensure that the pavement inspection and maintenance strategy is targeted, timely and efficient.
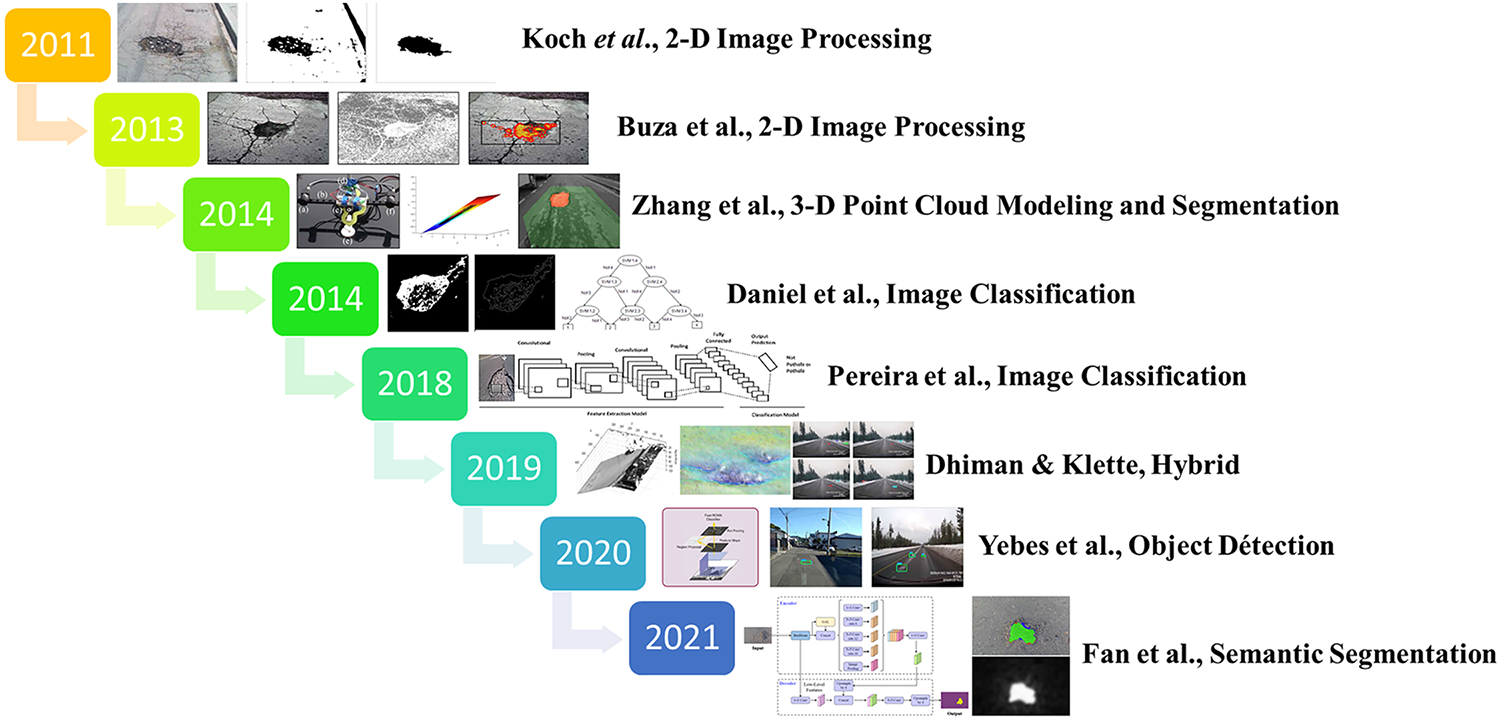
Figure 1: The development of pavement damage detection approaches during last decade
As shown in Fig. 1, the pavement pothole detection approaches include traditional 2-D image processing algorithms that handle tasks like enhancing, compressing, transforming, and segmenting road camera images or depth images, all through explicit programming. On the other hand, machine and deep learning approaches tackle the challenge of detecting potholes using methods like image classification, object recognition, or semantic segmentation, often leveraging advanced convolutional neural networks (CNNs). Then you’ve got 3-D road point cloud modelling, where algorithms match a specific geometric shape—usually a flat or curved surface—to the actual road point cloud, segmenting it by comparing the observed data with the fitted models. Lastly, hybrid methods that mix two or more of these algorithm types aim to boost overall performance in pothole detection.
2 Monitoring System Description
The schematic description of the pavement monitoring is illustrated in Fig. 2. For automatic monitoring of asphalt pavement cracks, we will use the requirements in Fig. 2 for the operation period of the pavement crack to realize the automatic acquisition of parameters such as the pavement crack and pavement pothole and to have intelligent analysis, evaluation, and critical threshold alarm for the safety status of various structures. Specifically include:
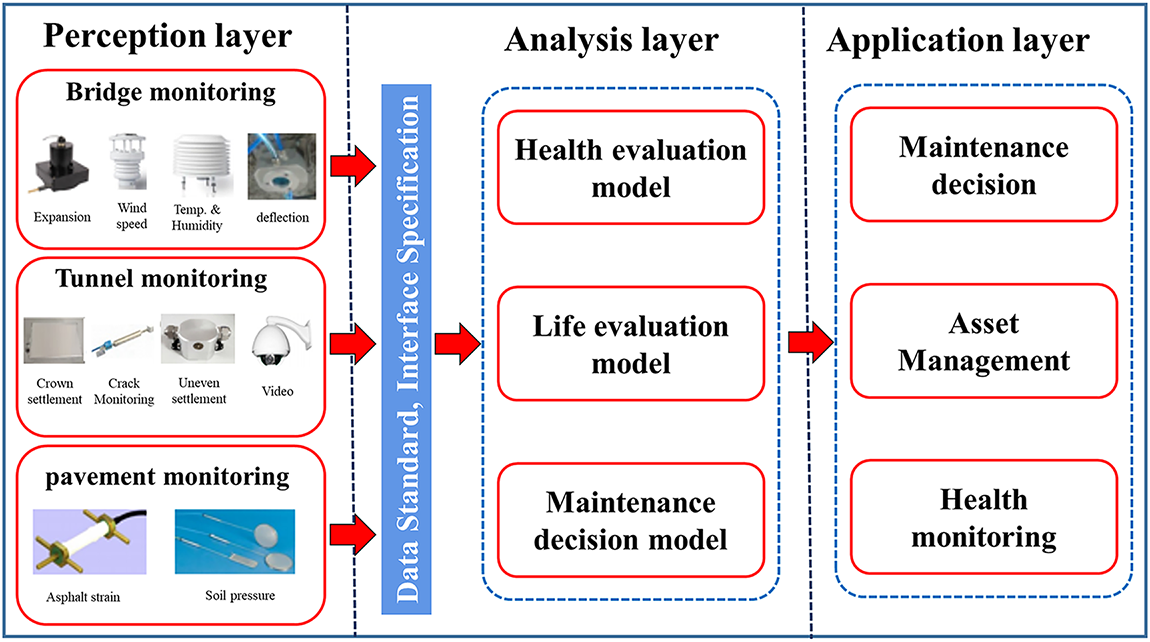
Figure 2: The schematic description of the monitoring system design
Asphalt strain monitoring: It is laid out at the bottom of the asphalt layer to obtain the dynamic bending and tensile strain data of the bottom of the asphalt mixture layer. The strain gauges are arranged horizontally, with longitudinal and transverse directions to measure the strain in the vertical direction (Fig. 3a).
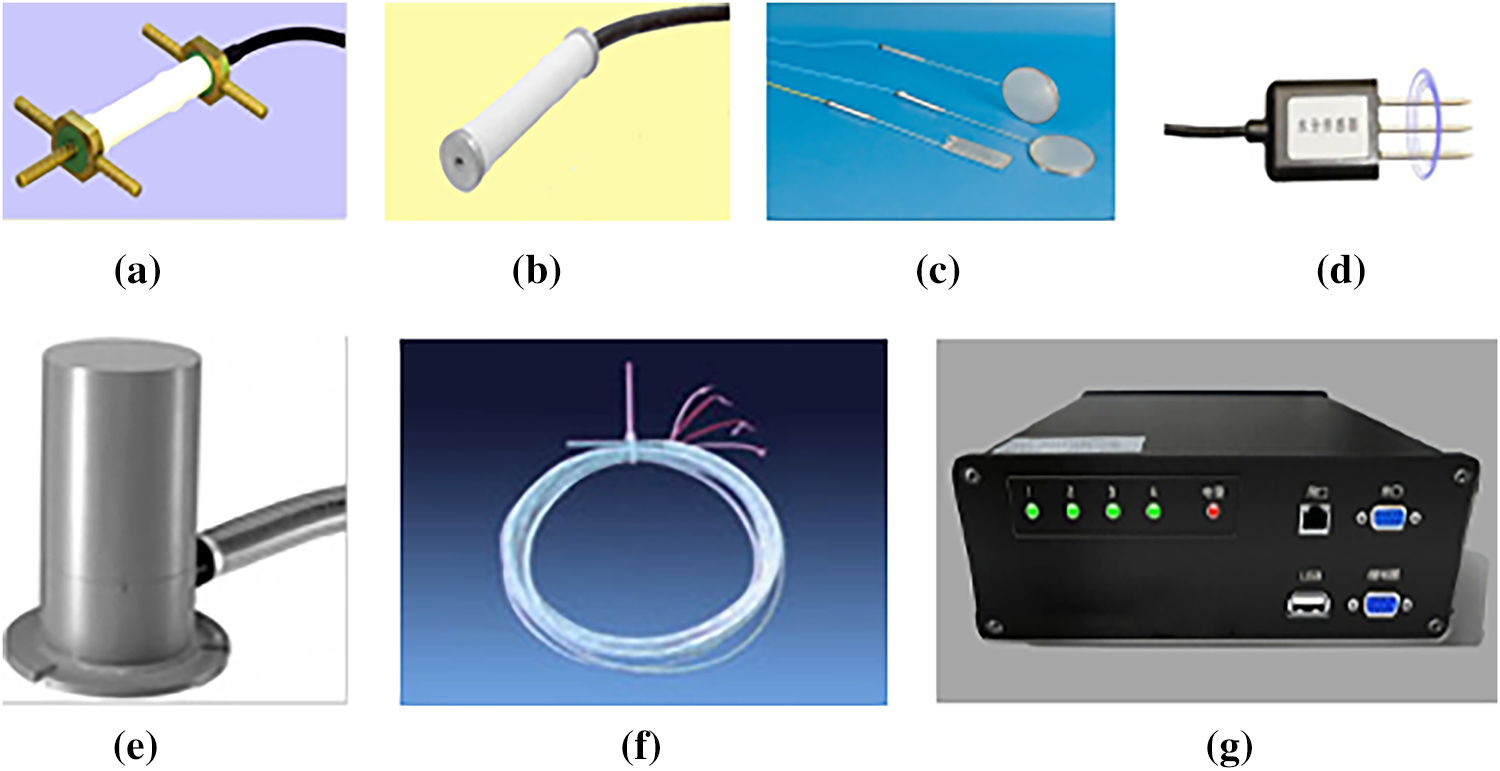
Figure 3: The monitoring system sensors
Concrete strain monitoring: The surface layer of the water-stabilizing layer below the asphalt layer is arranged corresponding to the asphalt strain test position to obtain the three-dimensional stress dynamic response data of the road base (Fig. 3b).
Earth pressure monitoring: Used to measure the vertical pressure of the roadbed layer under dynamic load. The pressure cell is arranged on the top and lower surfaces of the roadbed layer, located in the center of the inner wheel track, because it is expected that the stress generated by the wheel on the pavement structure is greatest at this position (Fig. 3c).
Soil moisture monitoring: Soil moisture sensors are placed in the soil layer of the external roadbed to measure the moisture content of the soil layer (Fig. 3d).
Multi-point displacement monitoring: Measures the settlement displacement of the water-stable layer and the roadbed layer. Multiple settlement meters are arranged on the shoulders outside the carriageway to measure the displacement changes of the base layer (Fig. 3e).
Temperature monitoring: On the hard shoulder outside the lane, measurements are taken in layers from the asphalt layer to the roadbed soil layer (Fig. 3f).
Dynamic weighing: Used to measure the size and type of load. The placement of the sensor should take into account the wheel offset and vehicle type during measurement. It can detect the axle weight, total weight, wheelbase, speed, length, and passing time of vehicles at a speed of 0 to 200 km/h, automatically capture the license plate, and automatically separate the vehicle (Fig. 3g).
Weather Information: Collects various meteorological information at the monitoring points, mainly including temperature, humidity, wind speed, wind direction, rainfall, air pressure, total radiation, illuminance, and ultraviolet intensity (Fig. 4).
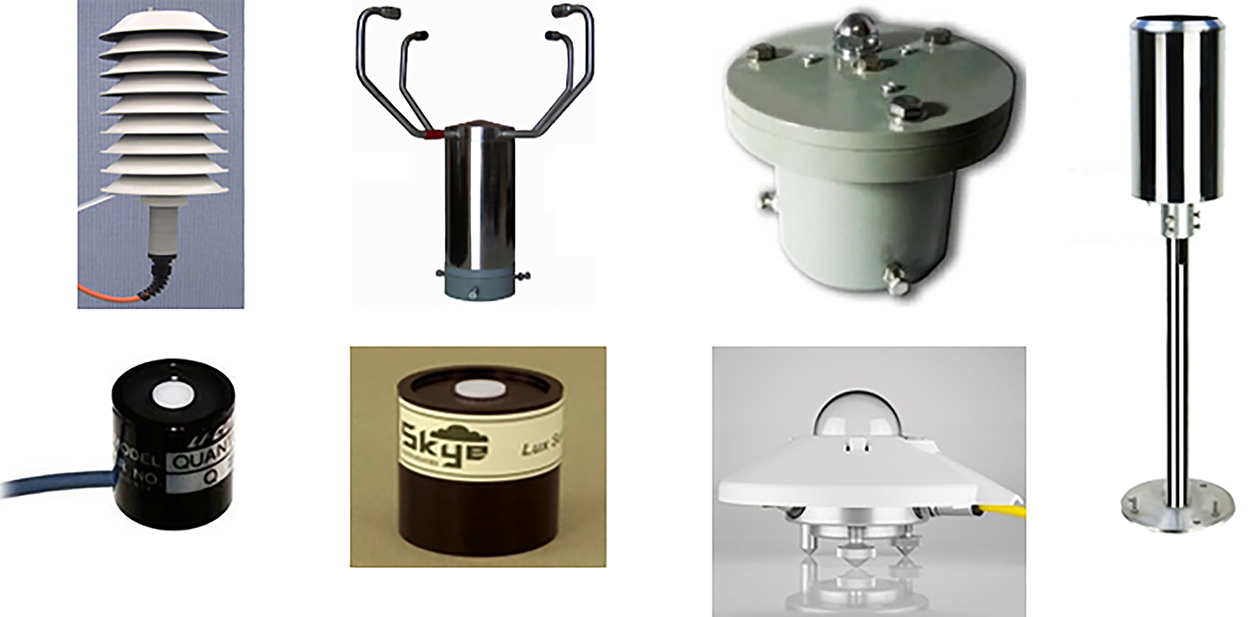
Figure 4: The weather station
3 Convolutional Neural Network (CNN)
A Convolutional Neural Network (CNN) is a type of deep learning model particularly well-suited for processing data with grid-like topology, such as images and videos. CNNs excel at automatically learning features from raw input data, eliminating the need for manual feature extraction. They are widely used in computer vision tasks like image recognition, object detection, and image segmentation, and can also be adapted for audio and other signal processing tasks [18,19].
These layers apply filters (small matrices) to the input data to detect patterns and features. The filter slides across the input, performing element-wise multiplication and summation, producing a feature map, as follows:
where
A subsampling layer, also known as a pooling layer, is a crucial component in CNNs. It reduces the spatial dimensions (height and width) of the feature maps produced by convolutional layers, which in turn reduces the number of parameters and computations in the network, helping to prevent overfitting and improve computational efficiency, as follows:
where
Selects the maximum value from a grid of input values, effectively capturing the most salient features.
Calculates the average value within a grid, providing a more smoothed representation of the feature map.
Fig. 5 presents the examples of the max and average pooling processes in the convolution operation. In this example, the input data is prepared as a
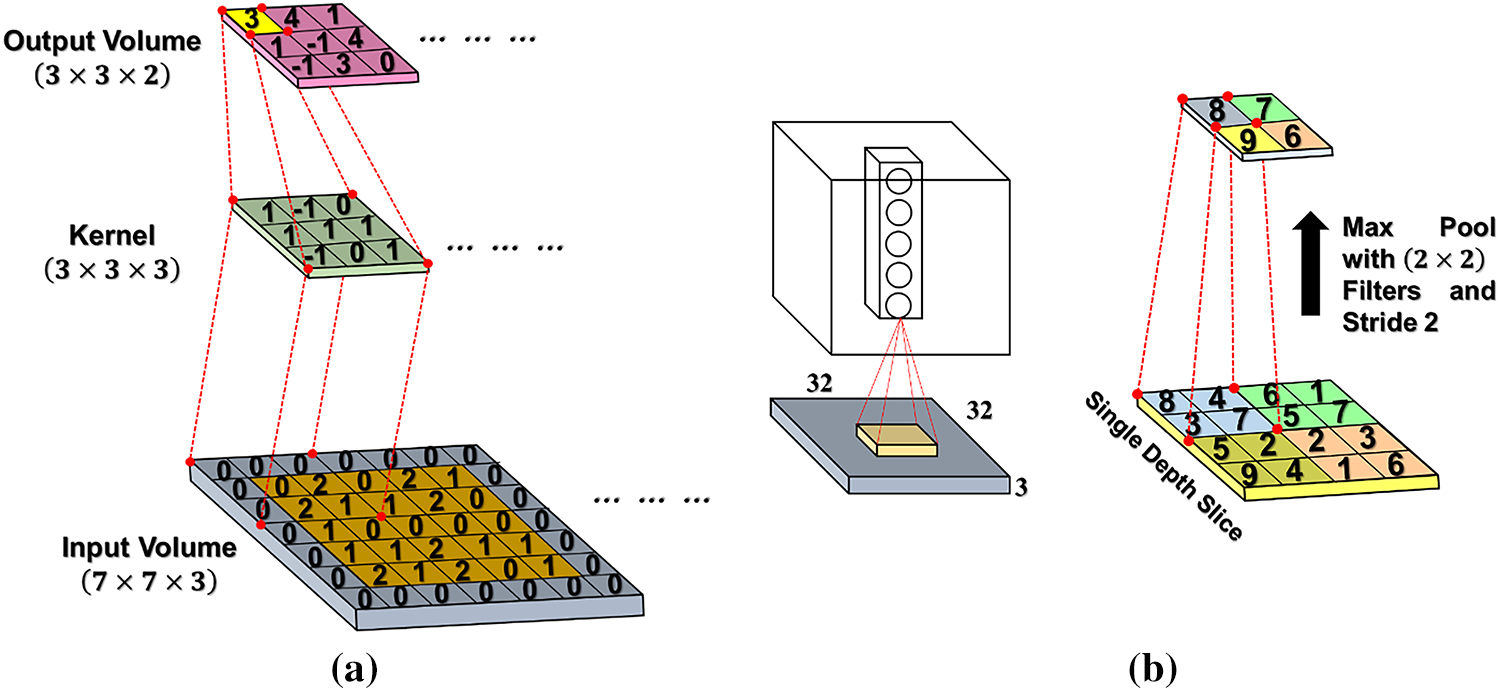
Figure 5: (a) Convolution operation and (b) Max pooling operation
A fully connected layer, also known as a dense layer, is a fundamental component in neural networks where each neuron is connected to every neuron in the preceding layer. This means that every input feature influences every output neuron in the layer. Fully connected layers are commonly used at the end of neural network architectures, particularly for tasks like classification and regression. These layers, similar to those in traditional neural networks, perform the final classification or regression task based on the features learned by the convolutional and pooling layers. The schematic diagram of the fully connected layer structure is shown in Fig. 6.
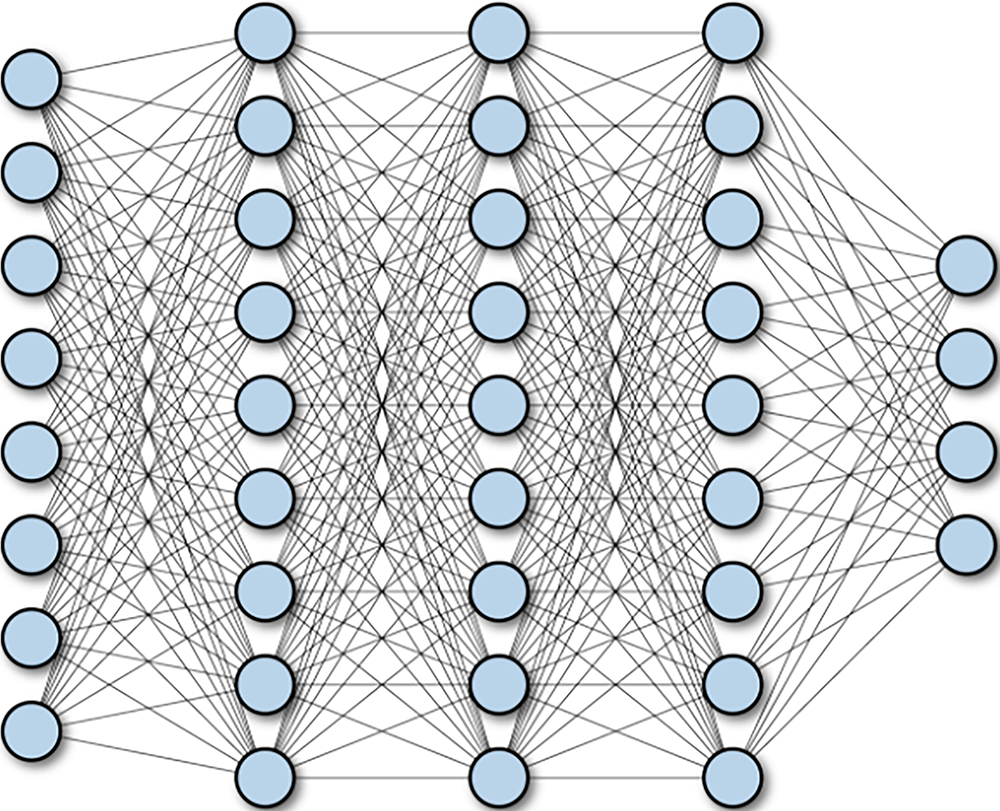
Figure 6: A fully connected layer
In this work, the pavement data was collected in the Xinjiang region. The route starts about 0.4 km west of the Tuyugou Toll Station, and ends in front of the Xiaocao Lake hub interchange. The whole highway is around 106.6 km long. For the second section covering 27.70 km.
In Structural Health Monitoring, figuring out the features is super important for spotting how structures are doing, checking their health, and catching any possible damage. We use some cool techniques to handle data from sensors that measure things like vibrations, displacements, or strains. This helps us pick out important features that show how a structure behaves over time.
To track how roads hold up over time, we can place different sensors in various spots like the road surface, base, and even the slope. This sets up a sensor network using IoT tech, which helps us keep a close eye on environmental conditions—just look at Fig. 7. For the asphalt roads in Xinjiang, we mainly focus on monitoring stuff like asphalt strain, concrete strain, soil pressure, moisture, shifts in the ground, and temperature of the soil. Plus, we keep tabs on the dynamic load weight of the pavement and weather details.
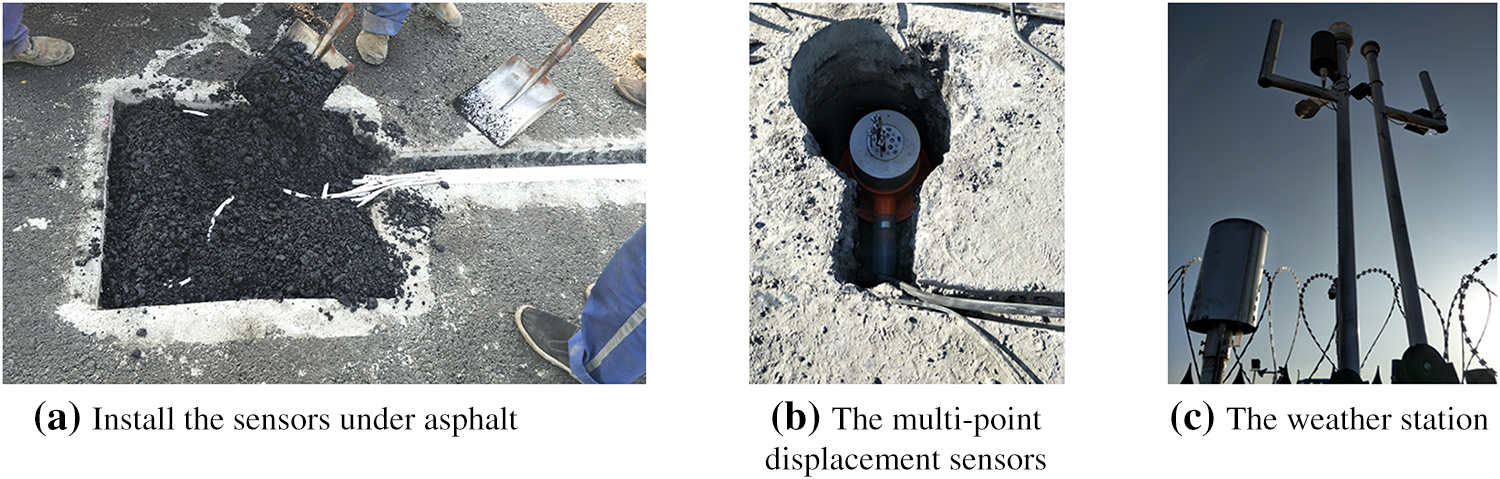
Figure 7: Sensors and equipment installation
For the road surface temperature, we use an infrared detector, and for checking road conditions, there’s a fancy infrared laser setup. The best part? We don’t have to cut into the road, which means less risk of causing damage. This non-contact method lets us do the job without closing the road, making it a lot safer and easier to install.
Fig. 8a shows how the temperature has changed over time. You can see some big swings, going from around −6°C to about 2.5°C. This kind of temperature variation can really affect how pavement materials behave, causing them to expand or contract. It’s something we definitely need to keep in mind when looking at asphalt strain. Then there’s Fig. 8b, which tells a similar story, but this time with humidity levels changing quite a bit, too.
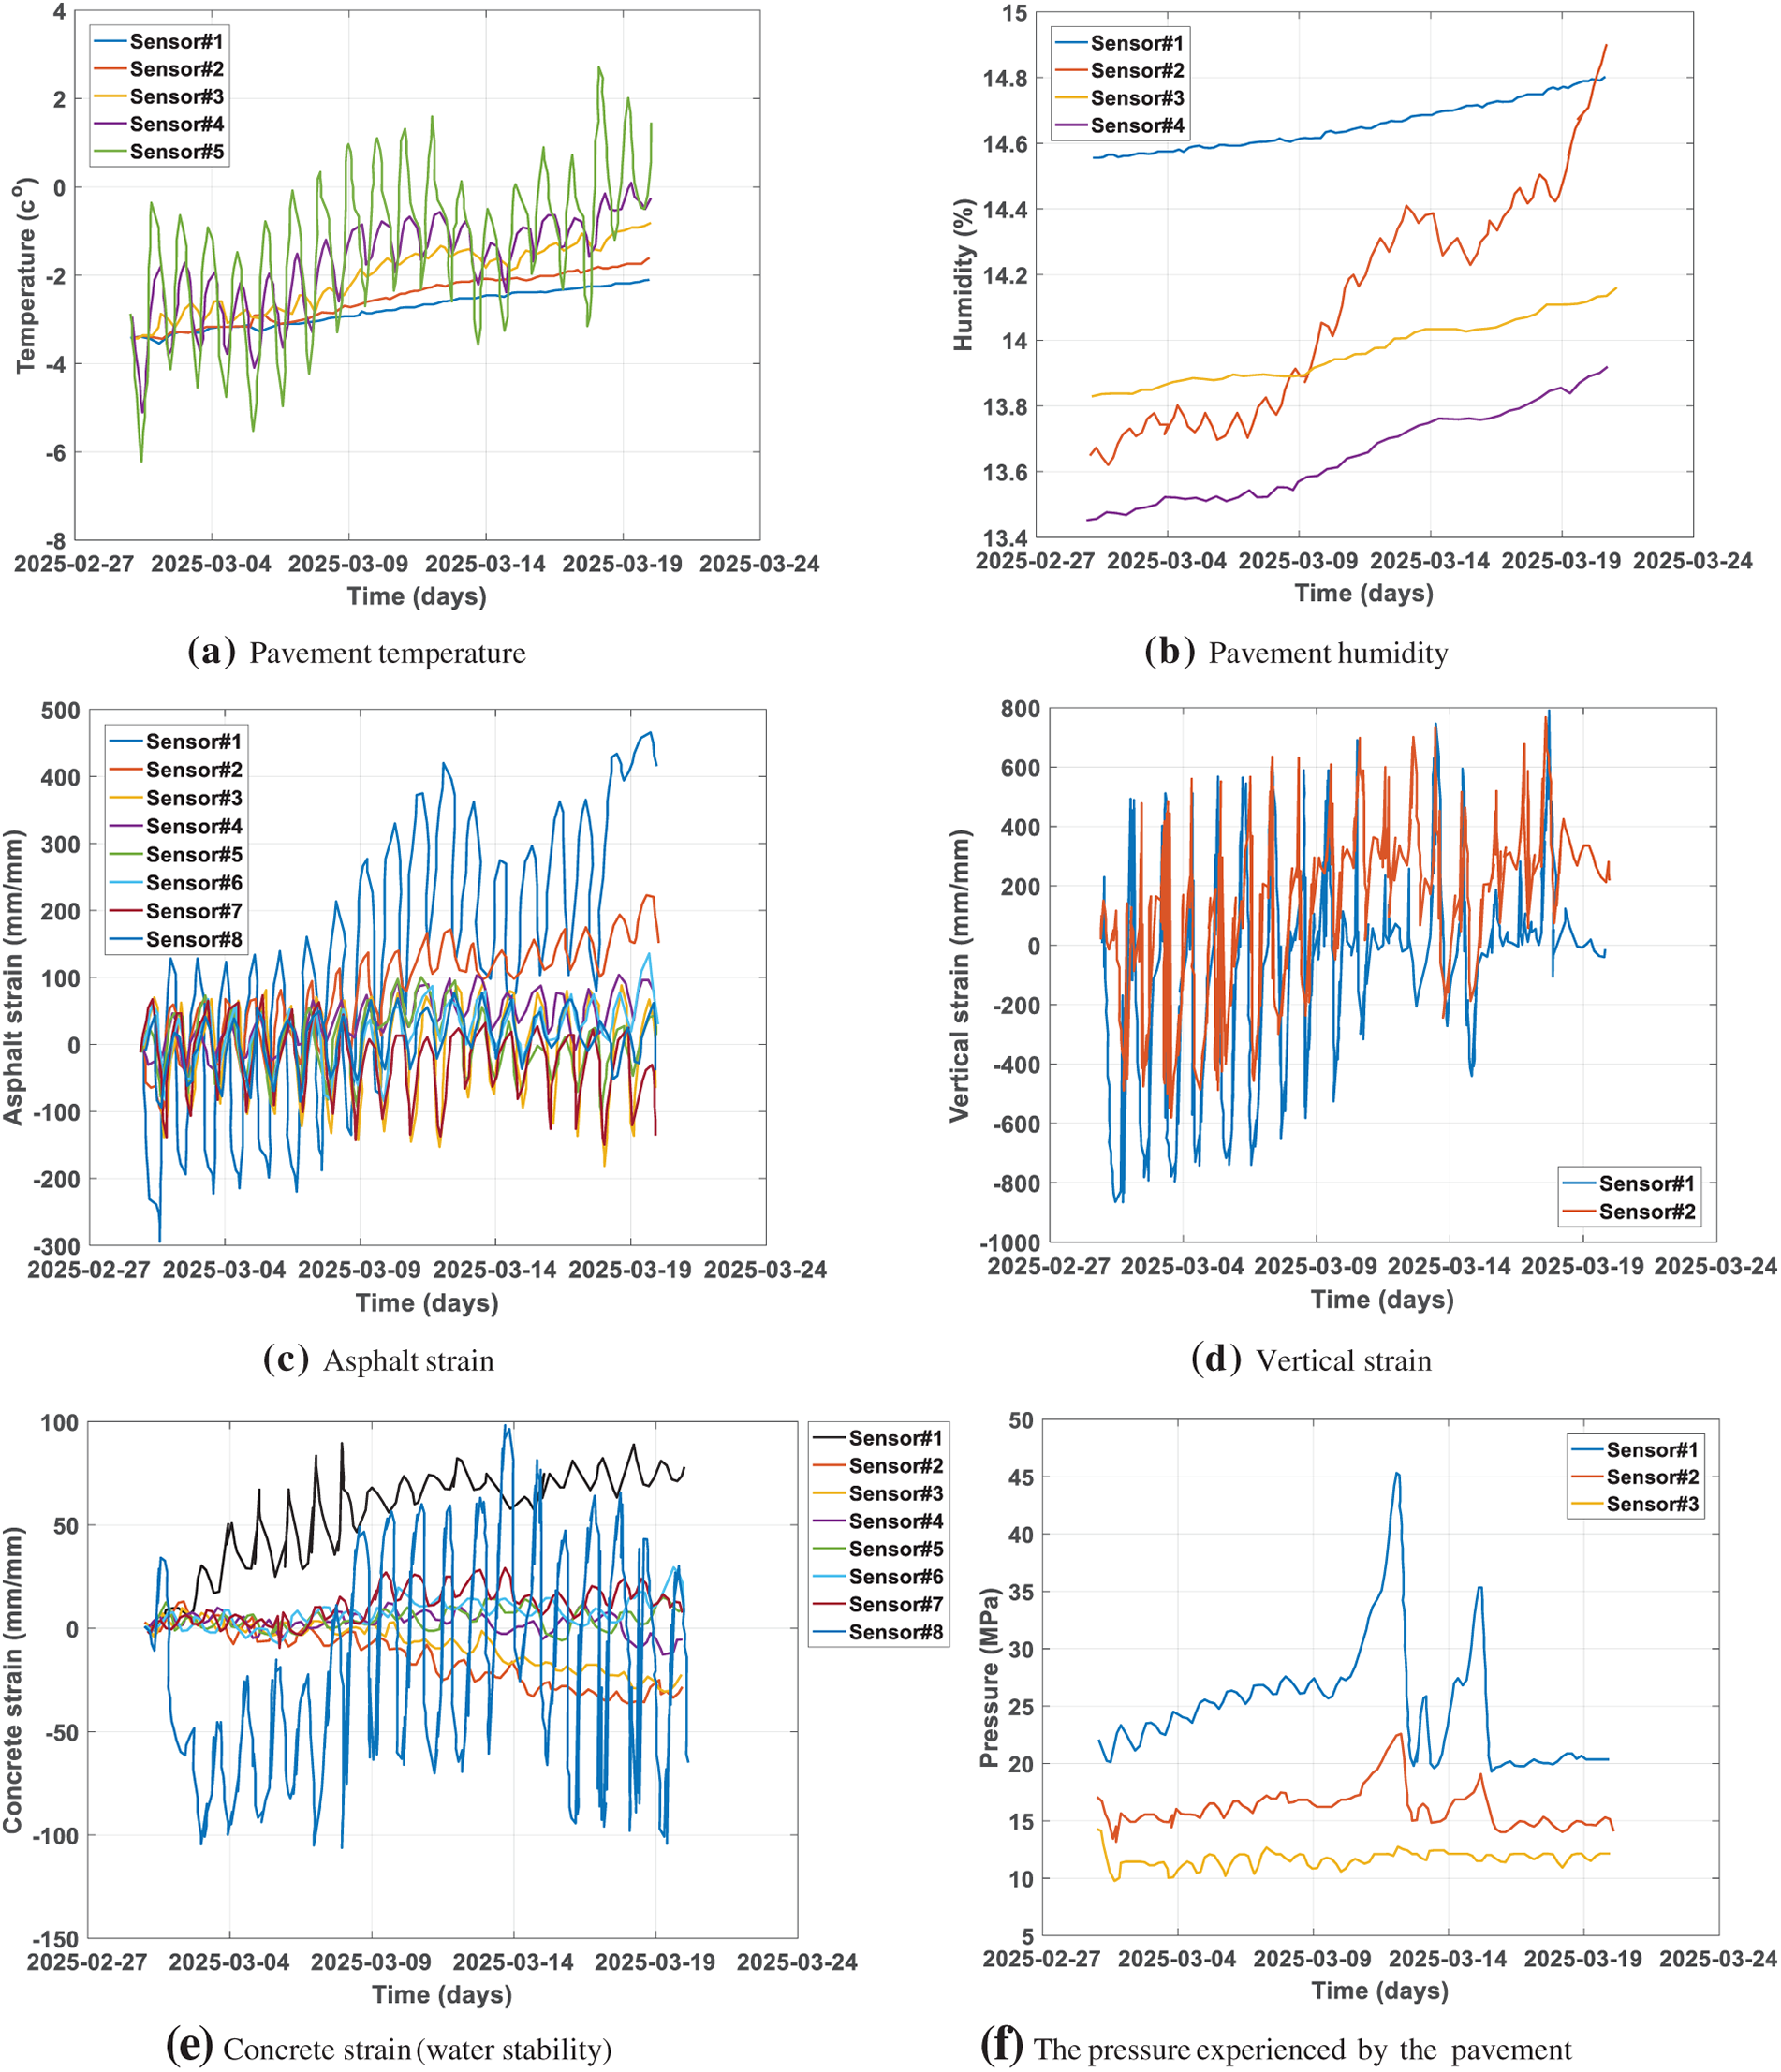
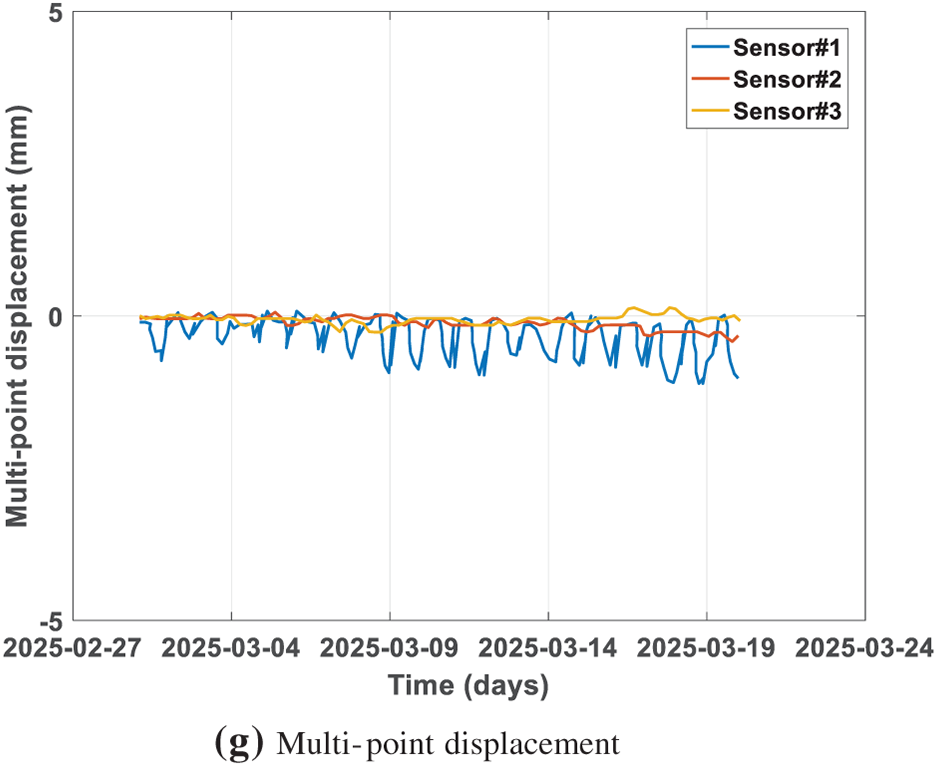
Figure 8: Sensors measurements (pavement features)
Moving on to Fig. 8c, it gives us a closer look at asphalt strain throughout the monitoring period. The x-axis shows the dates, from 2/27 to 3/19, and the y-axis shows strain values that range between −300 and 400 units. Those green lines represent what we’d typically expect for different sensors when everything’s running smoothly. Fig. 8d focuses on vertical strain during the same time, and Fig. 8e looks at the strain in concrete (like water stability) during that same stretch. By reviewing all this data, we can come up with maintenance plans to tackle any issues that might come from strain, helping keep the pavement safe and sound in the long run, and we noticed some noise in the strain data, so we’ll need to clean that up before digging deeper.
Now, Fig. 8f tracks the average pressure over time, giving us a sense of the general pressure the pavement was under during the monitoring period. Again, the x-axis shows the dates from 2/27 to 3/19, and the y-axis displays pressure values between about 10 to 40 MPa. This range shows what kind of pressure the pavement experienced on average. The green lines show what’s typical for the pressure sensors under normal circumstances.
Lastly, Fig. 8g measures how much the water-stable layer and the roadbed layer have settled. We’ve got a bunch of settlement meters set up on the shoulders outside the roadway to keep tabs on any changes in the base layer.
4.3 CNN Architecture for Pavement Displacement Prediction
A typical CNN setup includes key parts like convolutional layers, pooling layers, activation functions, and fully connected layers, just like you see in Fig. 9.
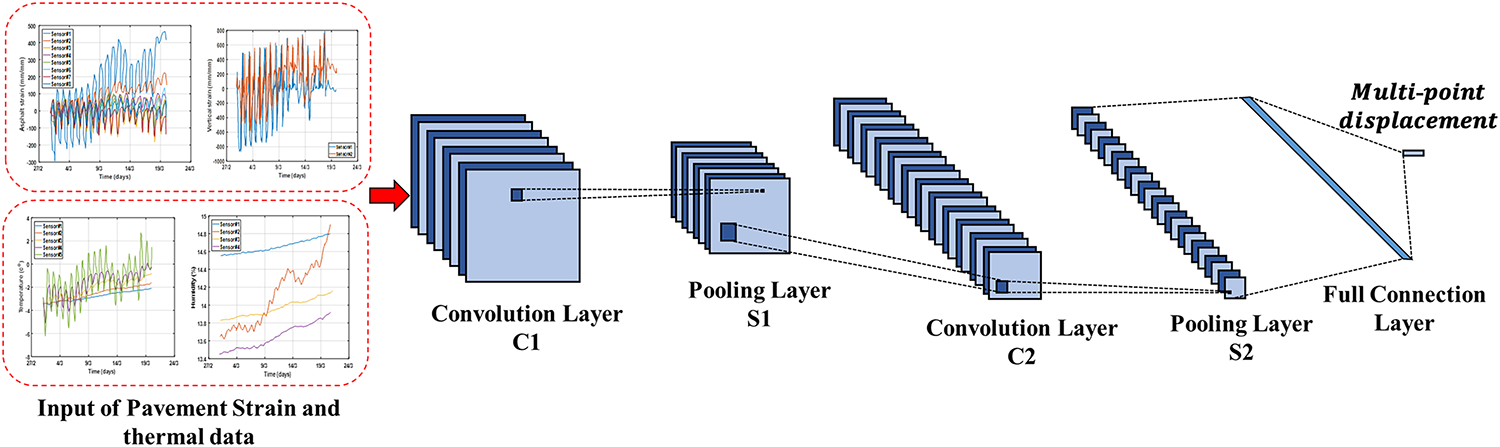
Figure 9: The architecture of a typical CNN
In the fully connected layer, every neuron connects to all the neurons in the layer before it. The activated neurons in the trained CNN help score what category the predicted image falls into. We usually use the cross-entropy loss function to figure out the training loss. Then, we update the weights using backpropagation and gradient descent. Stochastic gradient descent is pretty popular for this because lots of people use it. You can see the fully-connected layers architecture of our proposed CNN in Fig. 10.
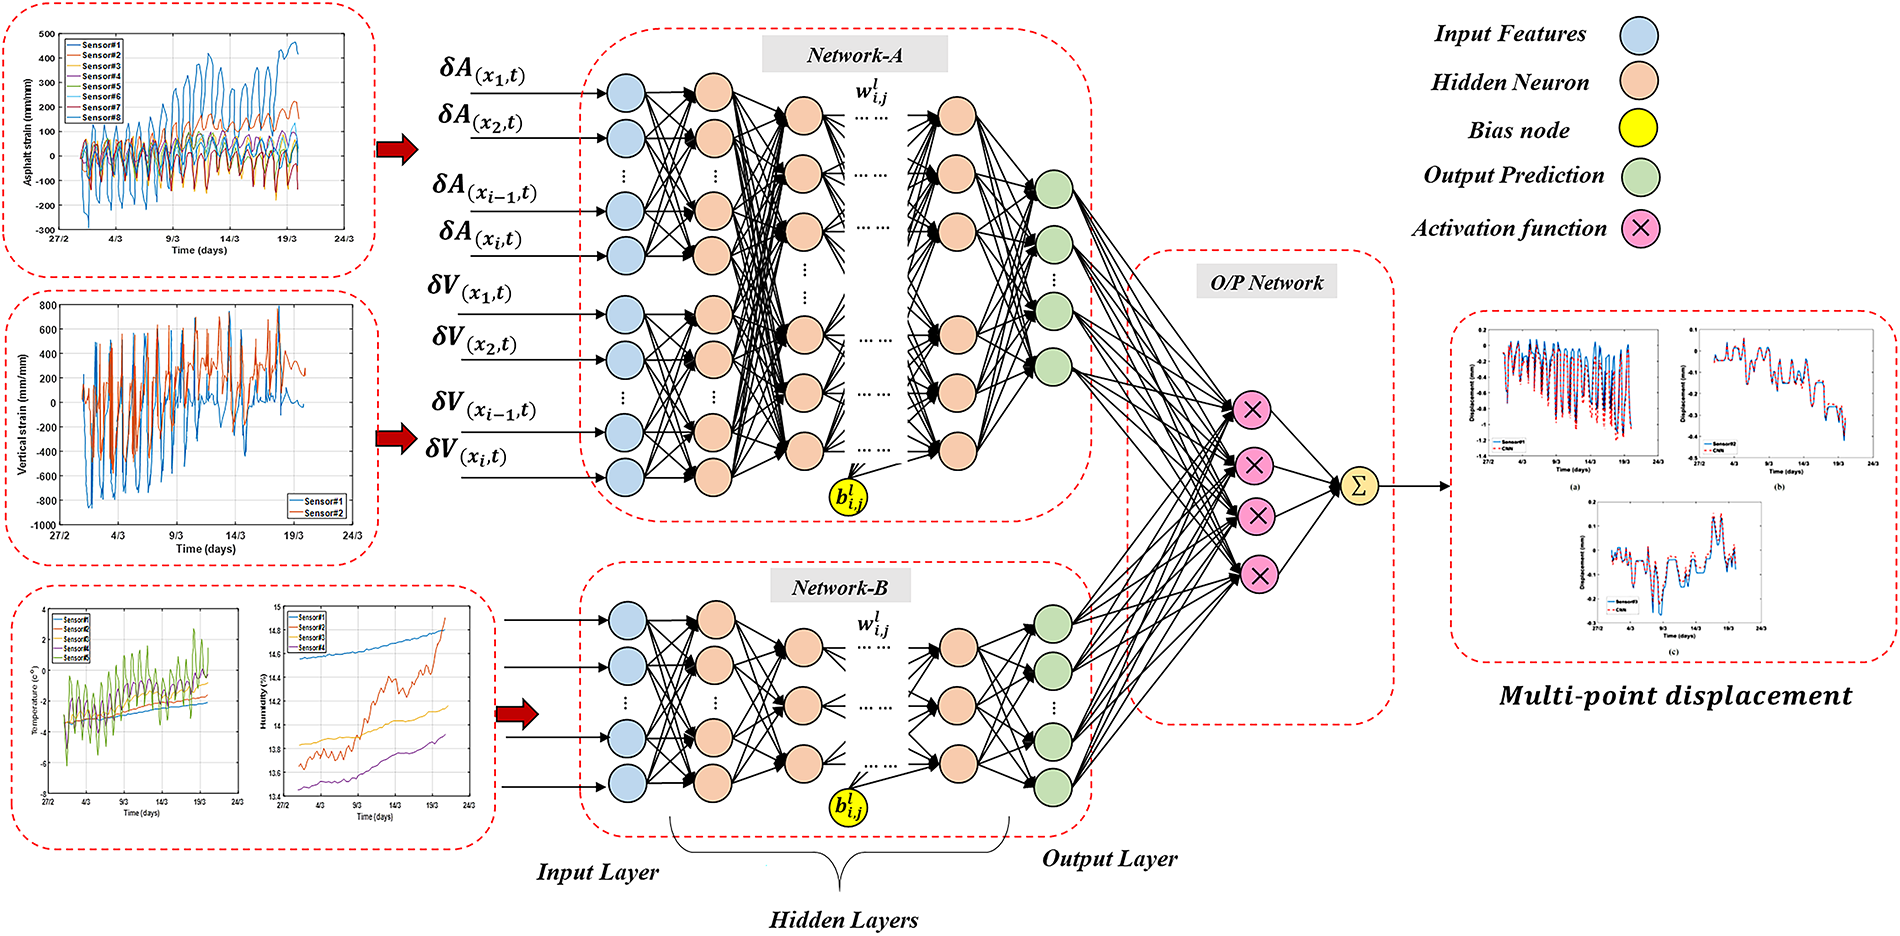
Figure 10: The fully-connected layers-type architecture of the proposed CNN
4.4 Training, Validation, and Test Sets
For this research, we chose mean square error (MSE) to optimize network parameters like weights and biases in the layers. During training, we look at cluster features at different times and positions to fine-tune the network parameters, which helps control how many hidden layers change based on the training results. After running several test iterations, we get satisfactory outputs from the network, and it stops training when the MSE stabilizes at a low value. The detailed settings for the convolution layer show the first convolutional layer
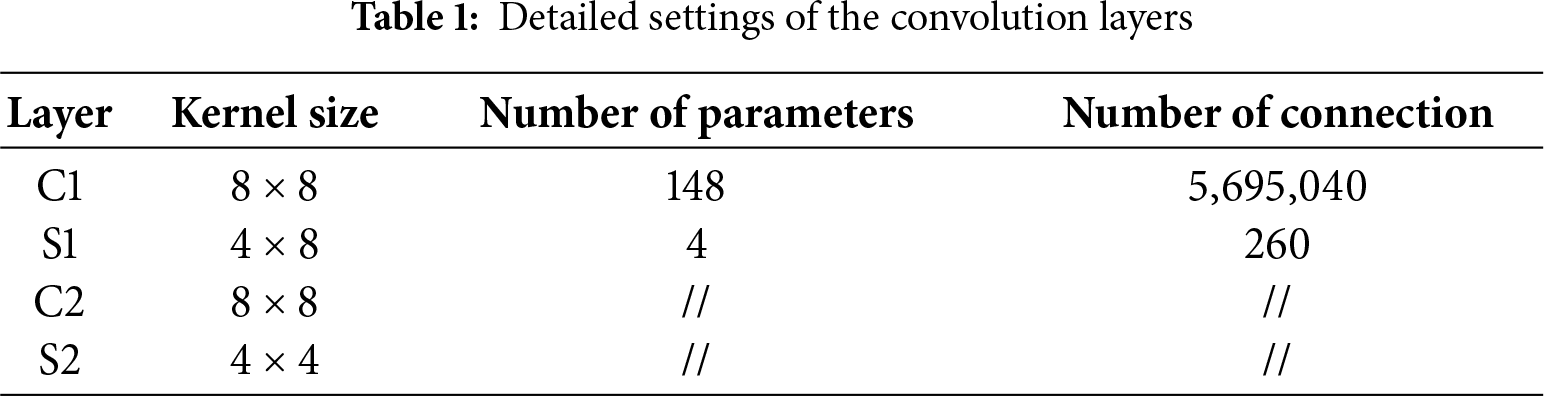
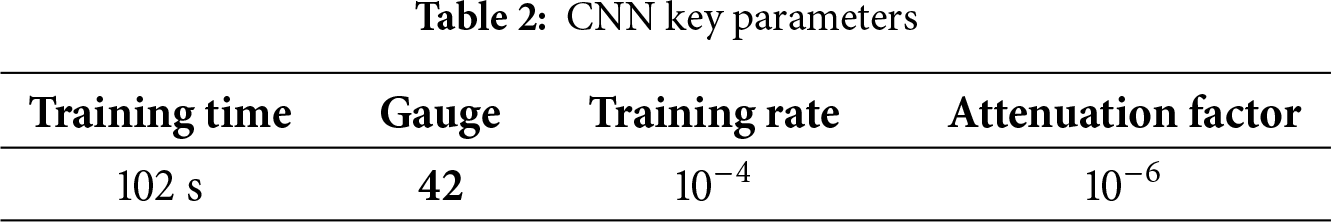
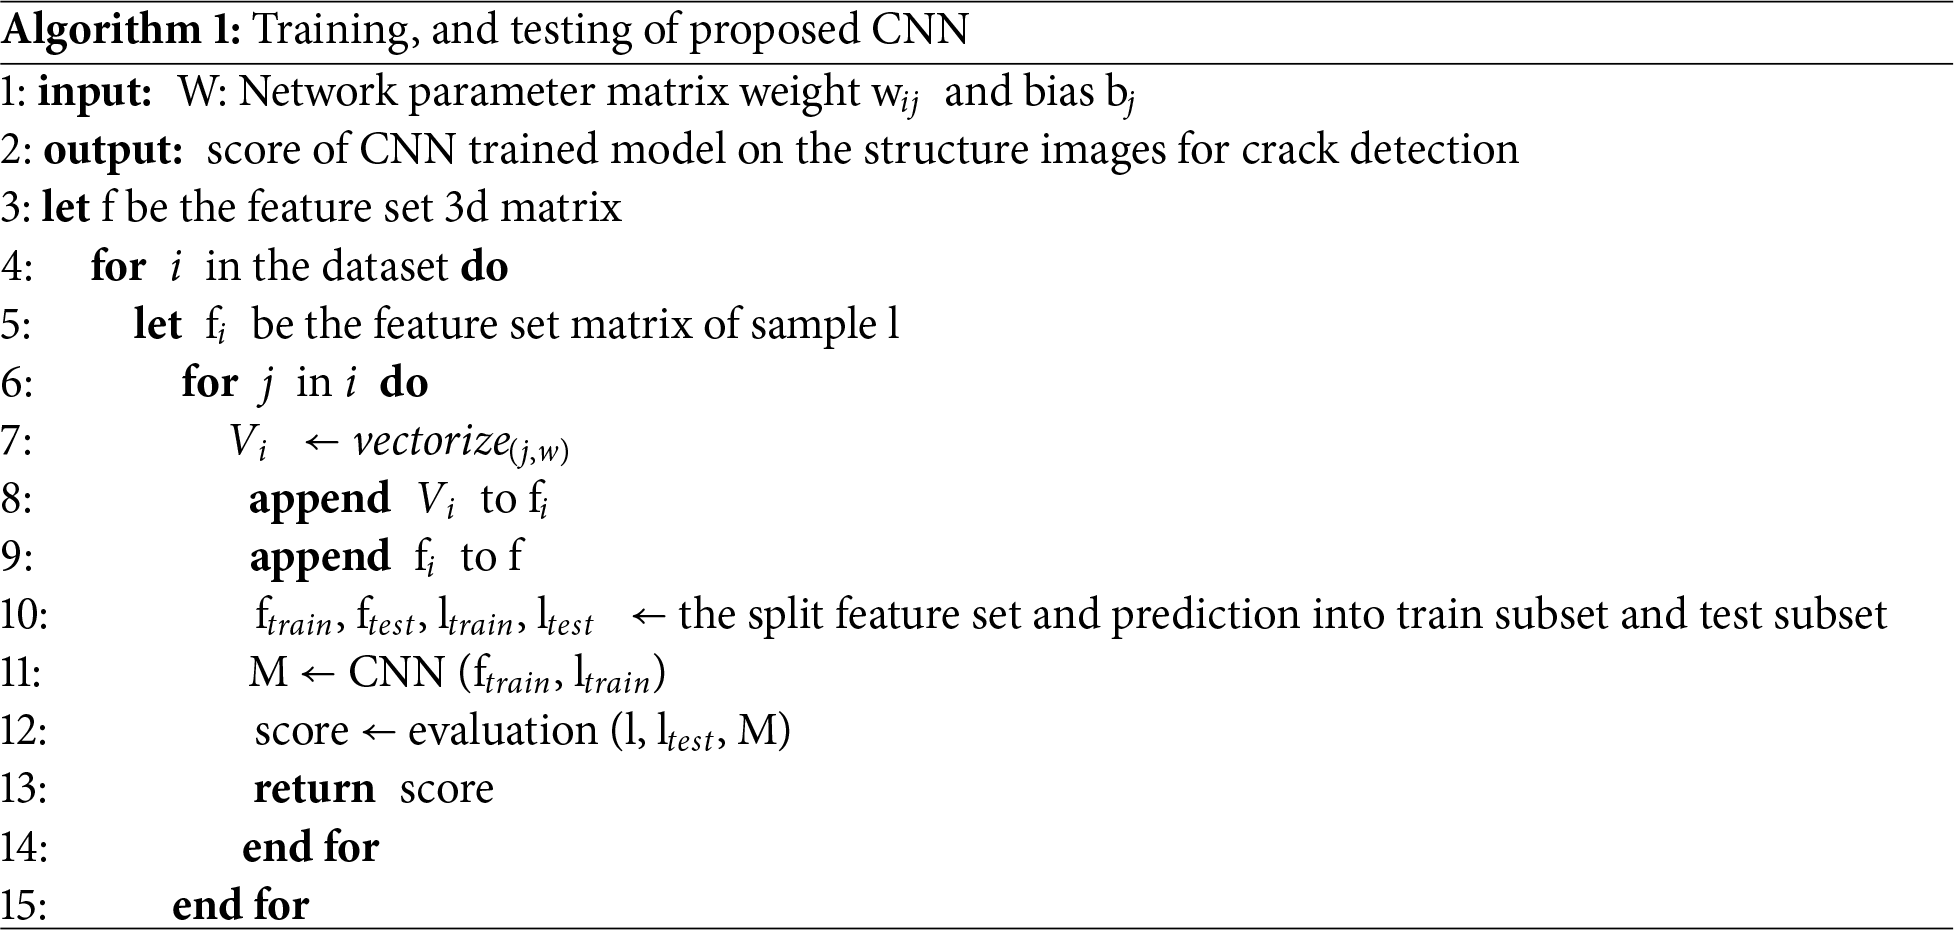
So, we’ve got this method that uses some flexible parameters and features for training and testing, and you can check it out in Fig. 11. Fig. 12 lays out how the CNN setup works, along with the training and testing models. If you look at Fig. 13, it shows how well the CNN has been performing during training. By the way, when we say ‘Epoch’, it just means one complete pass through the whole training data. You can find the key training parameters in Table 2, and the MATLAB code steps for training and evaluating the CNN are in Algorithm 1.
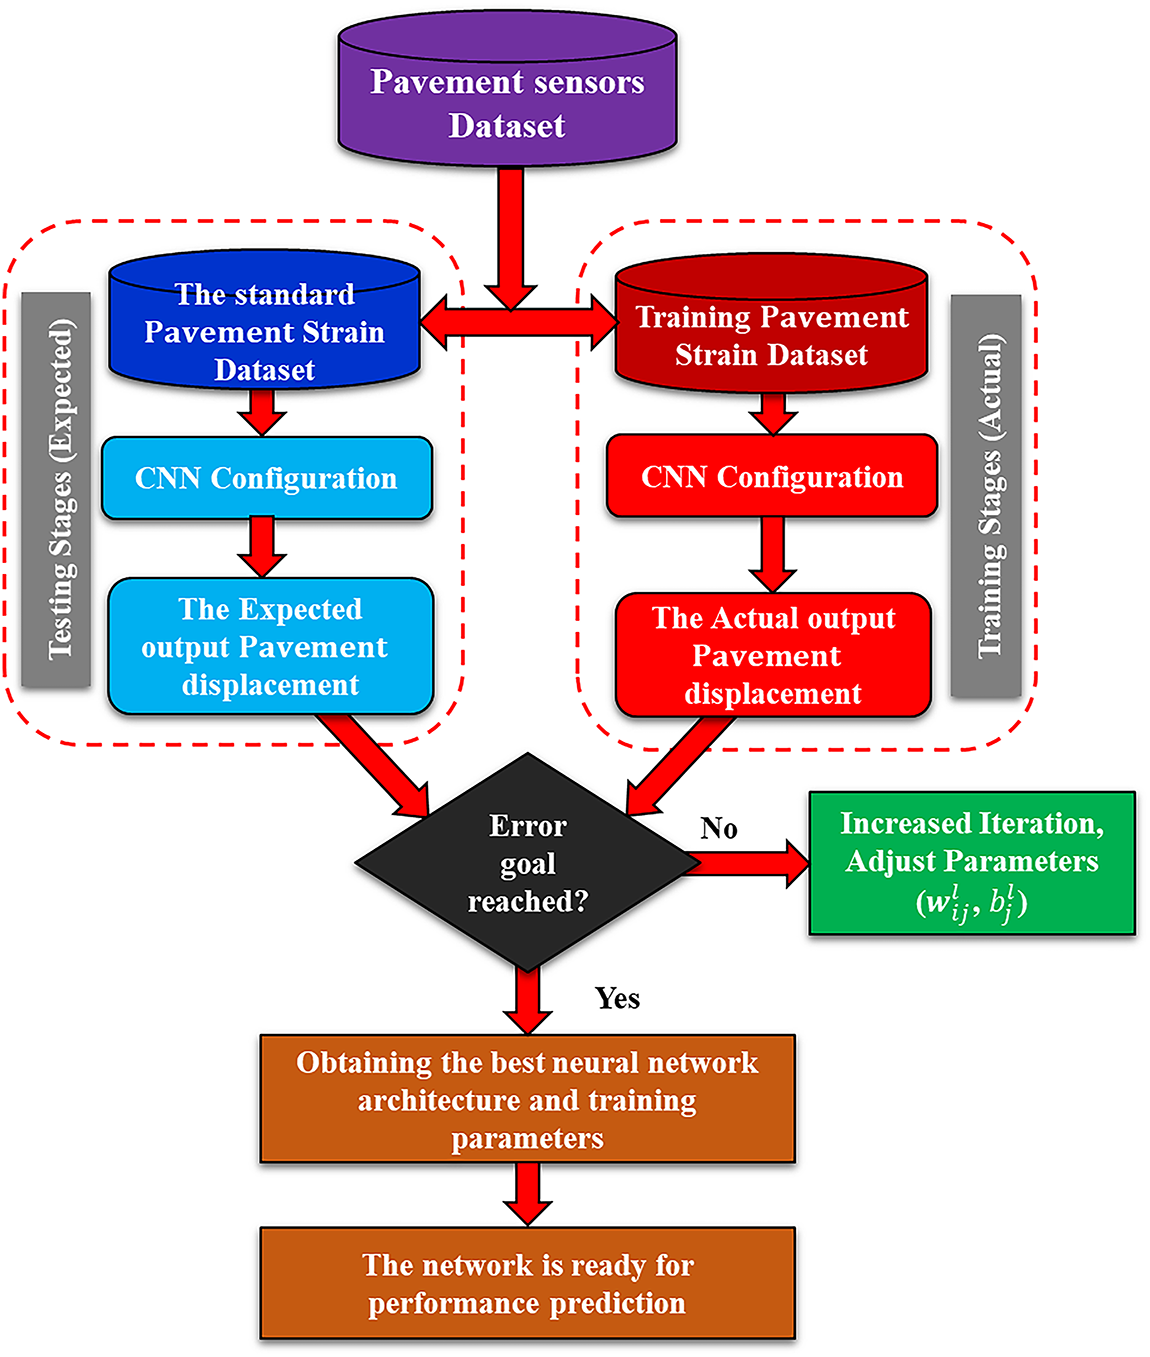
Figure 11: The architecture of the proposed CNN model for pavement displacement prediction
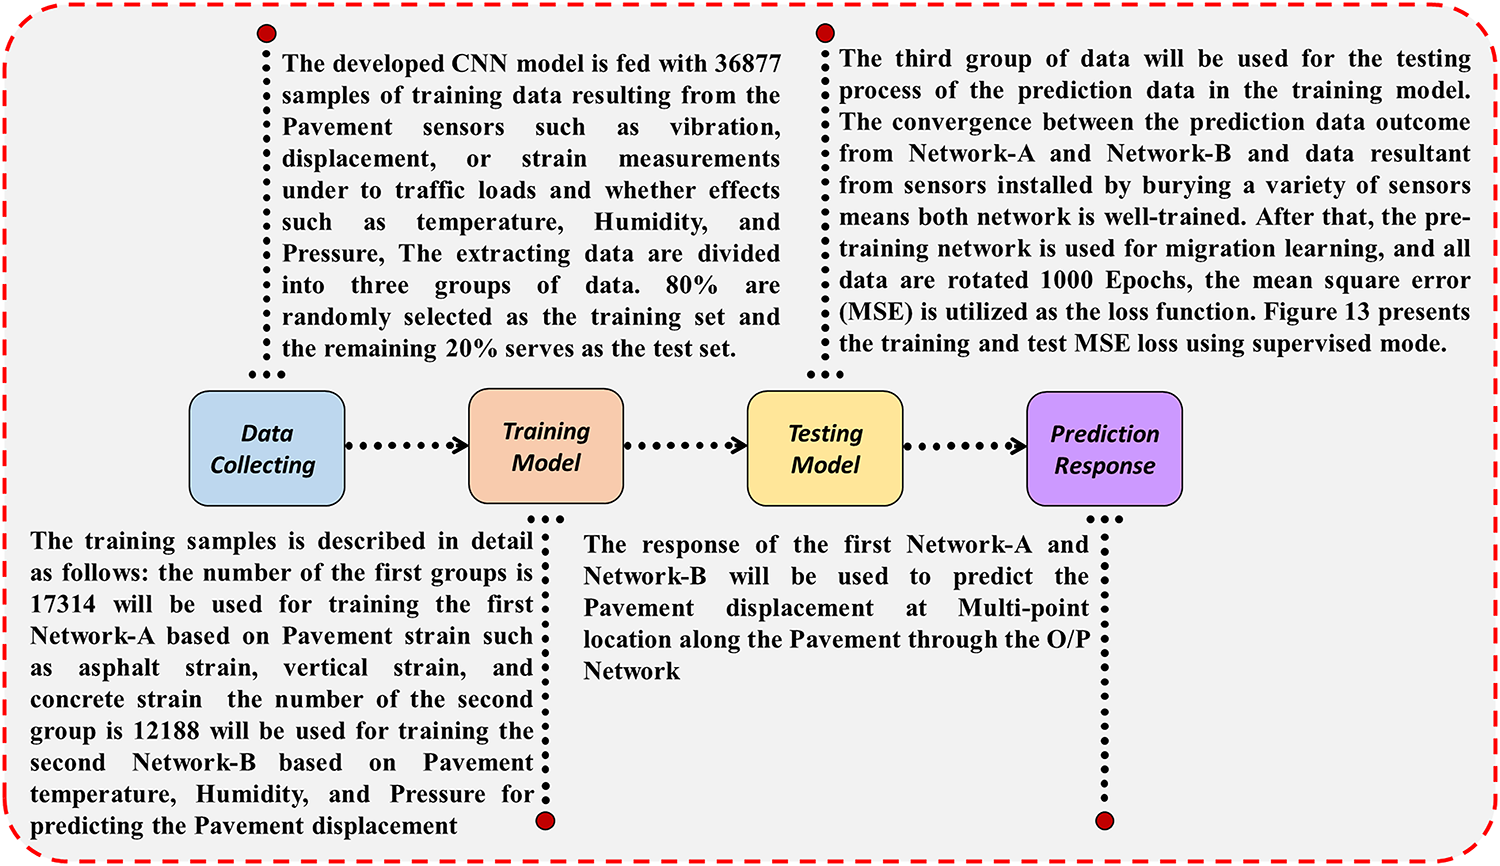
Figure 12: The steps of CNN training to estimate the pavement displacement

Figure 13: CNN training performance
Moving on to Fig. 14, it compares what the CNN predicted against the actual data from the pavement sensors at sensor #1, #2, and #3. From the figures, it’s clear the CNN does a way better job at predicting in this case study, proving it can really model how the structure behaves.
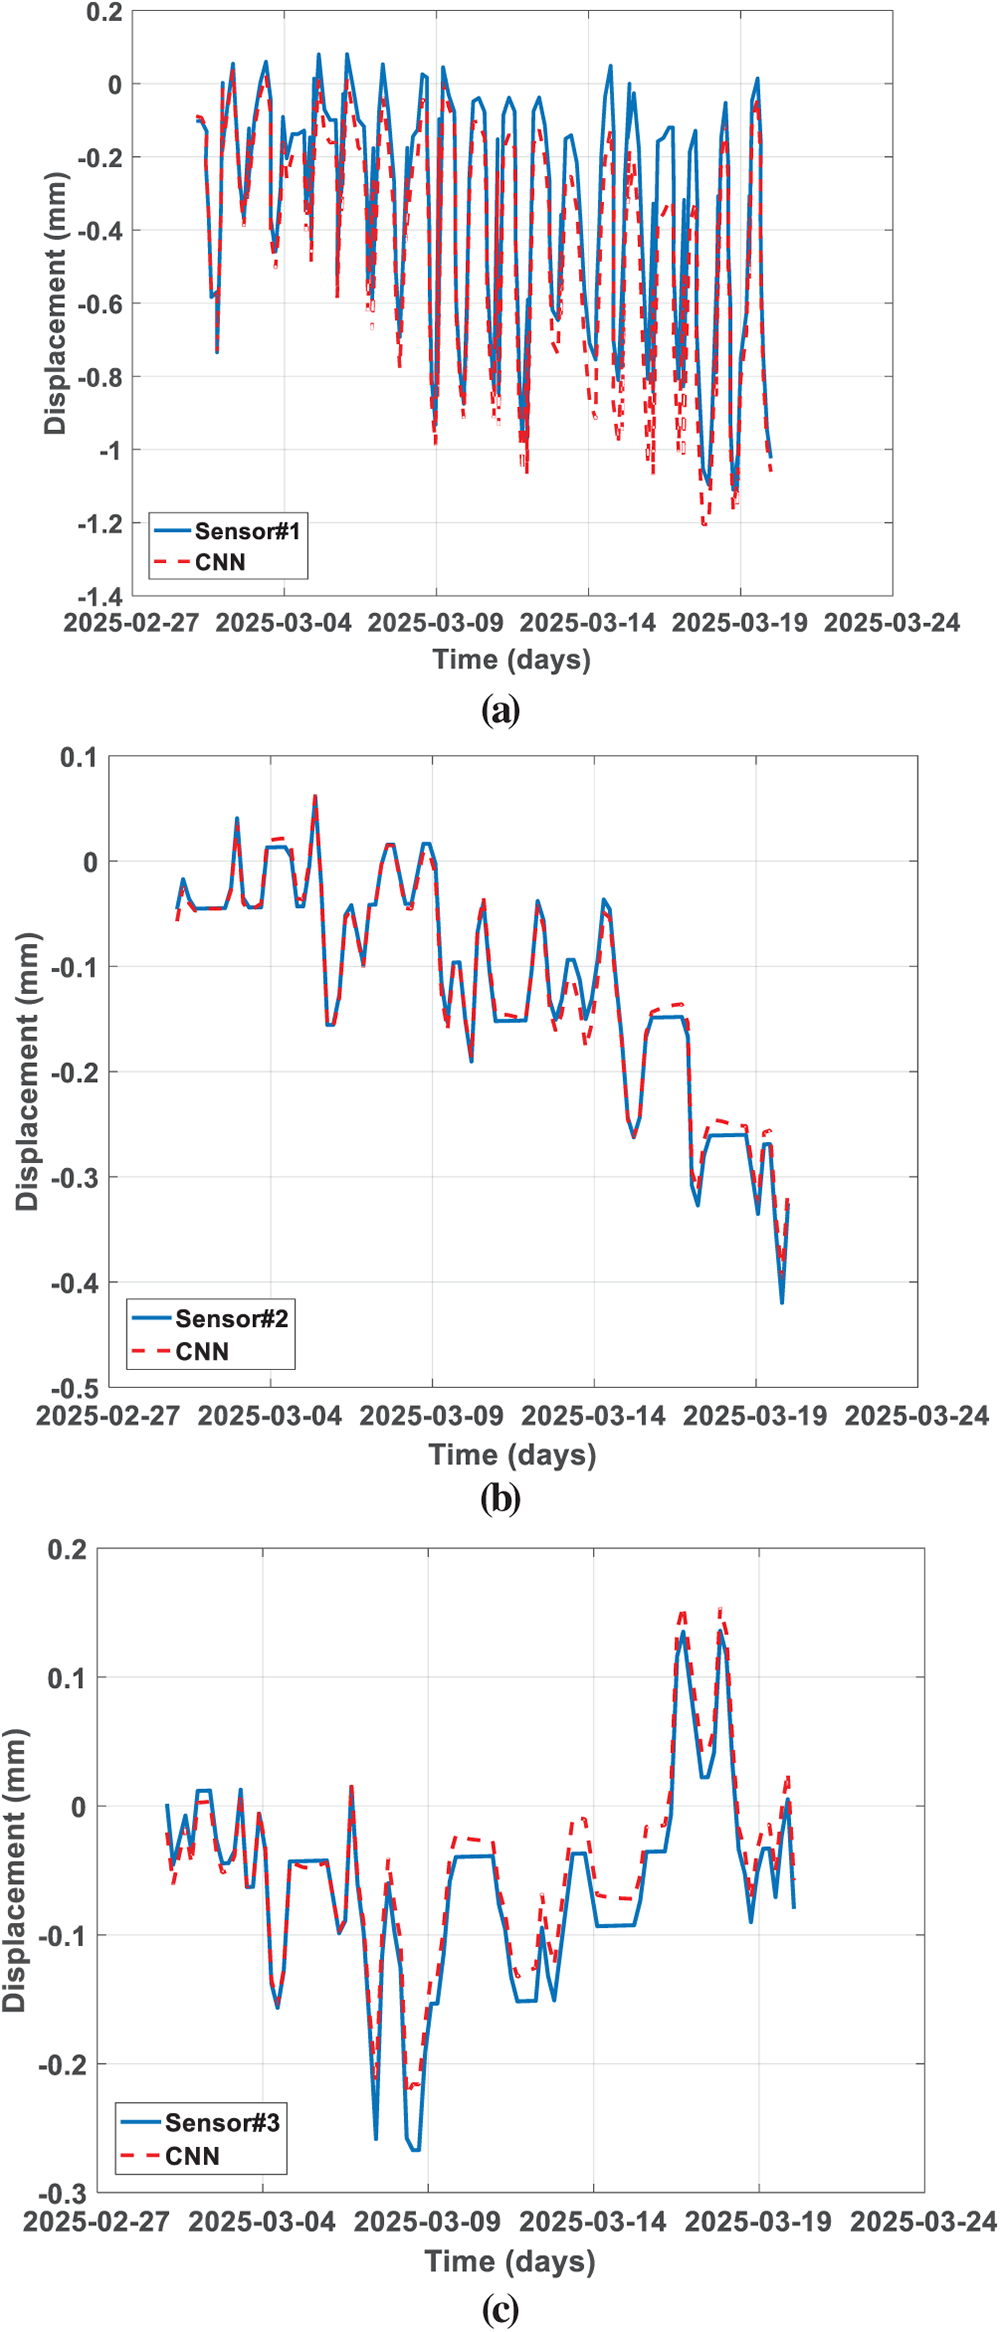
Figure 14: A comparison between CNN and Pavement Sensors experimental data of Multi-point displacement for (a) Sensor#1 (b) Sensor#2 (c) Sensor#3
4.5 Proposed Method Accuracy and Reliability Evaluation
We look at four main things to check how well the proposed method is doing: the false negative rate (FNR), false positive rate (FPR), true negative rate (TNR), and true positive rate (TPR). Here’s how we can tweak the performance based on those.
In this research, we prepared 40 datasets from pavement sensors to test things out, splitting them into 9 groups based on the output displacement in the pavement to get results for
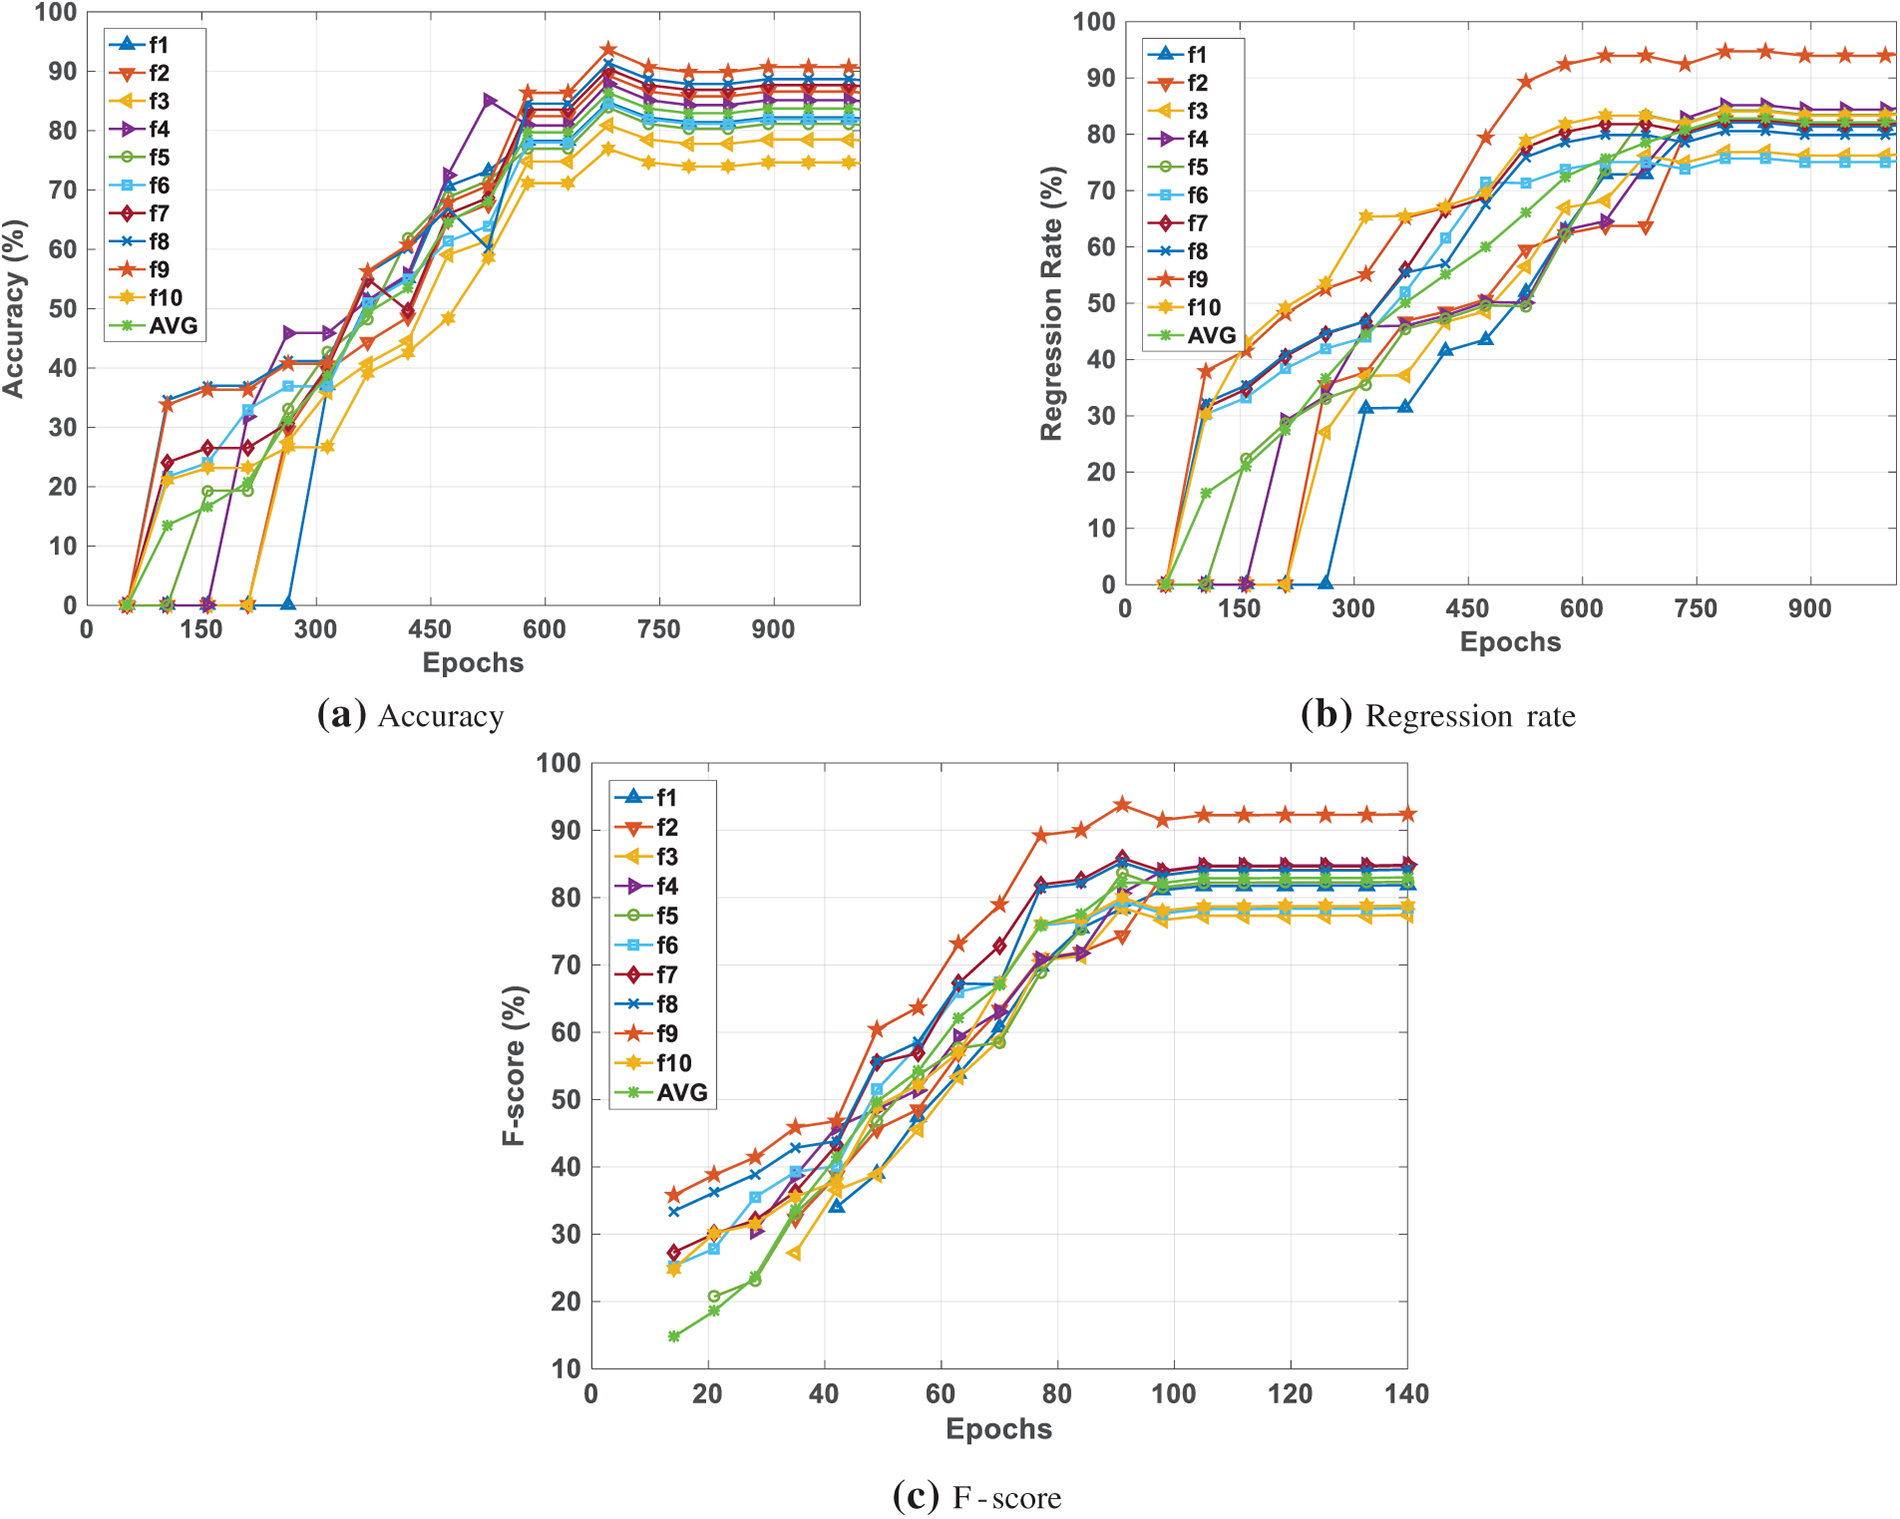
Figure 15: The training proceeded with a comparison based on the Multi-point displacement in the pavement
In Tables 3 and 4, we compare the suggested CNN with two other methods found in the literature for pavement monitoring: the artificial neural networks (ANN) developed by Haja Mohideen et al. [6], Farhadmanesh et al. [7], and the support vector machine (SVM) introduced by Seraj et al. [26], and Basavaraju et al. [27].
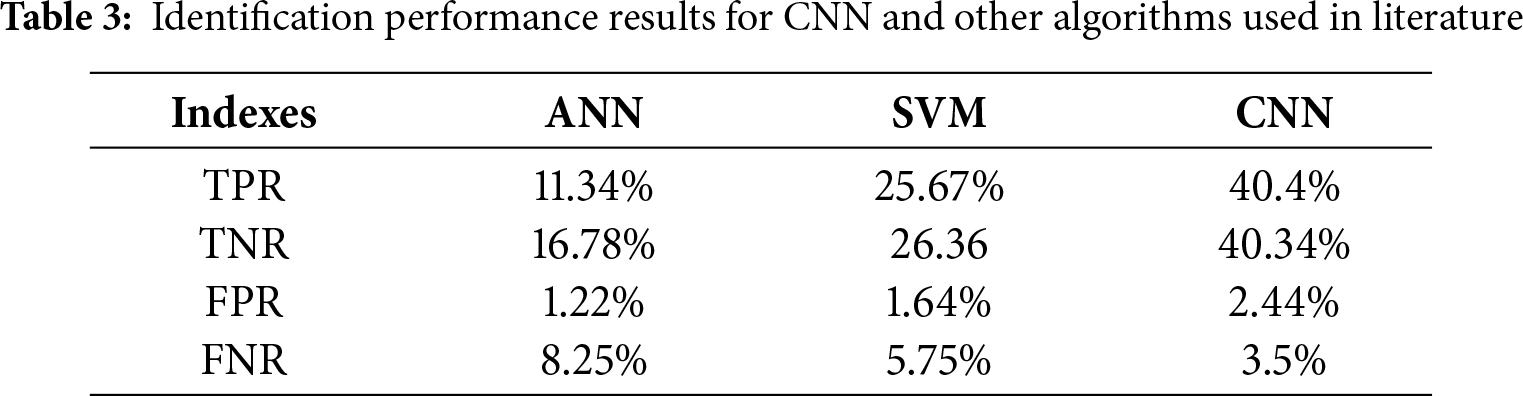
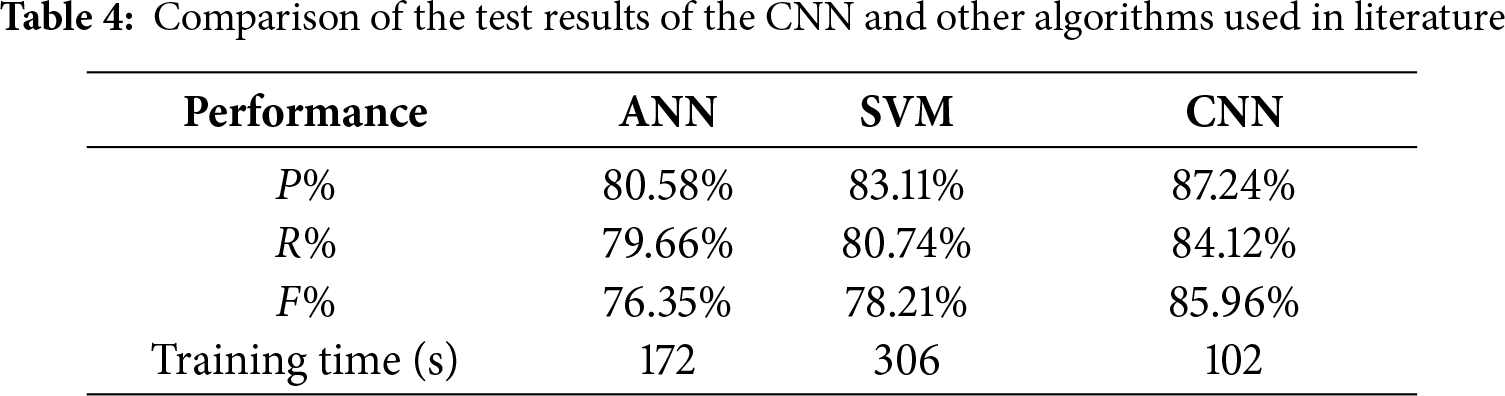
If you check out Table 4, it’s pretty evident that ANN tends to have lower average accuracy across all metrics—like precision (
Check out the confusion matrix in Fig. 16; it breaks down how effectively each model identifies various situations for the CNN. Just so you know, values below 1% are considered zero in these diagrams. Looking at Fig. 16, it’s clear that the CNN architecture is doing pretty well, showing higher average accuracy and looking like it has the upper hand in almost all 9 scenarios.
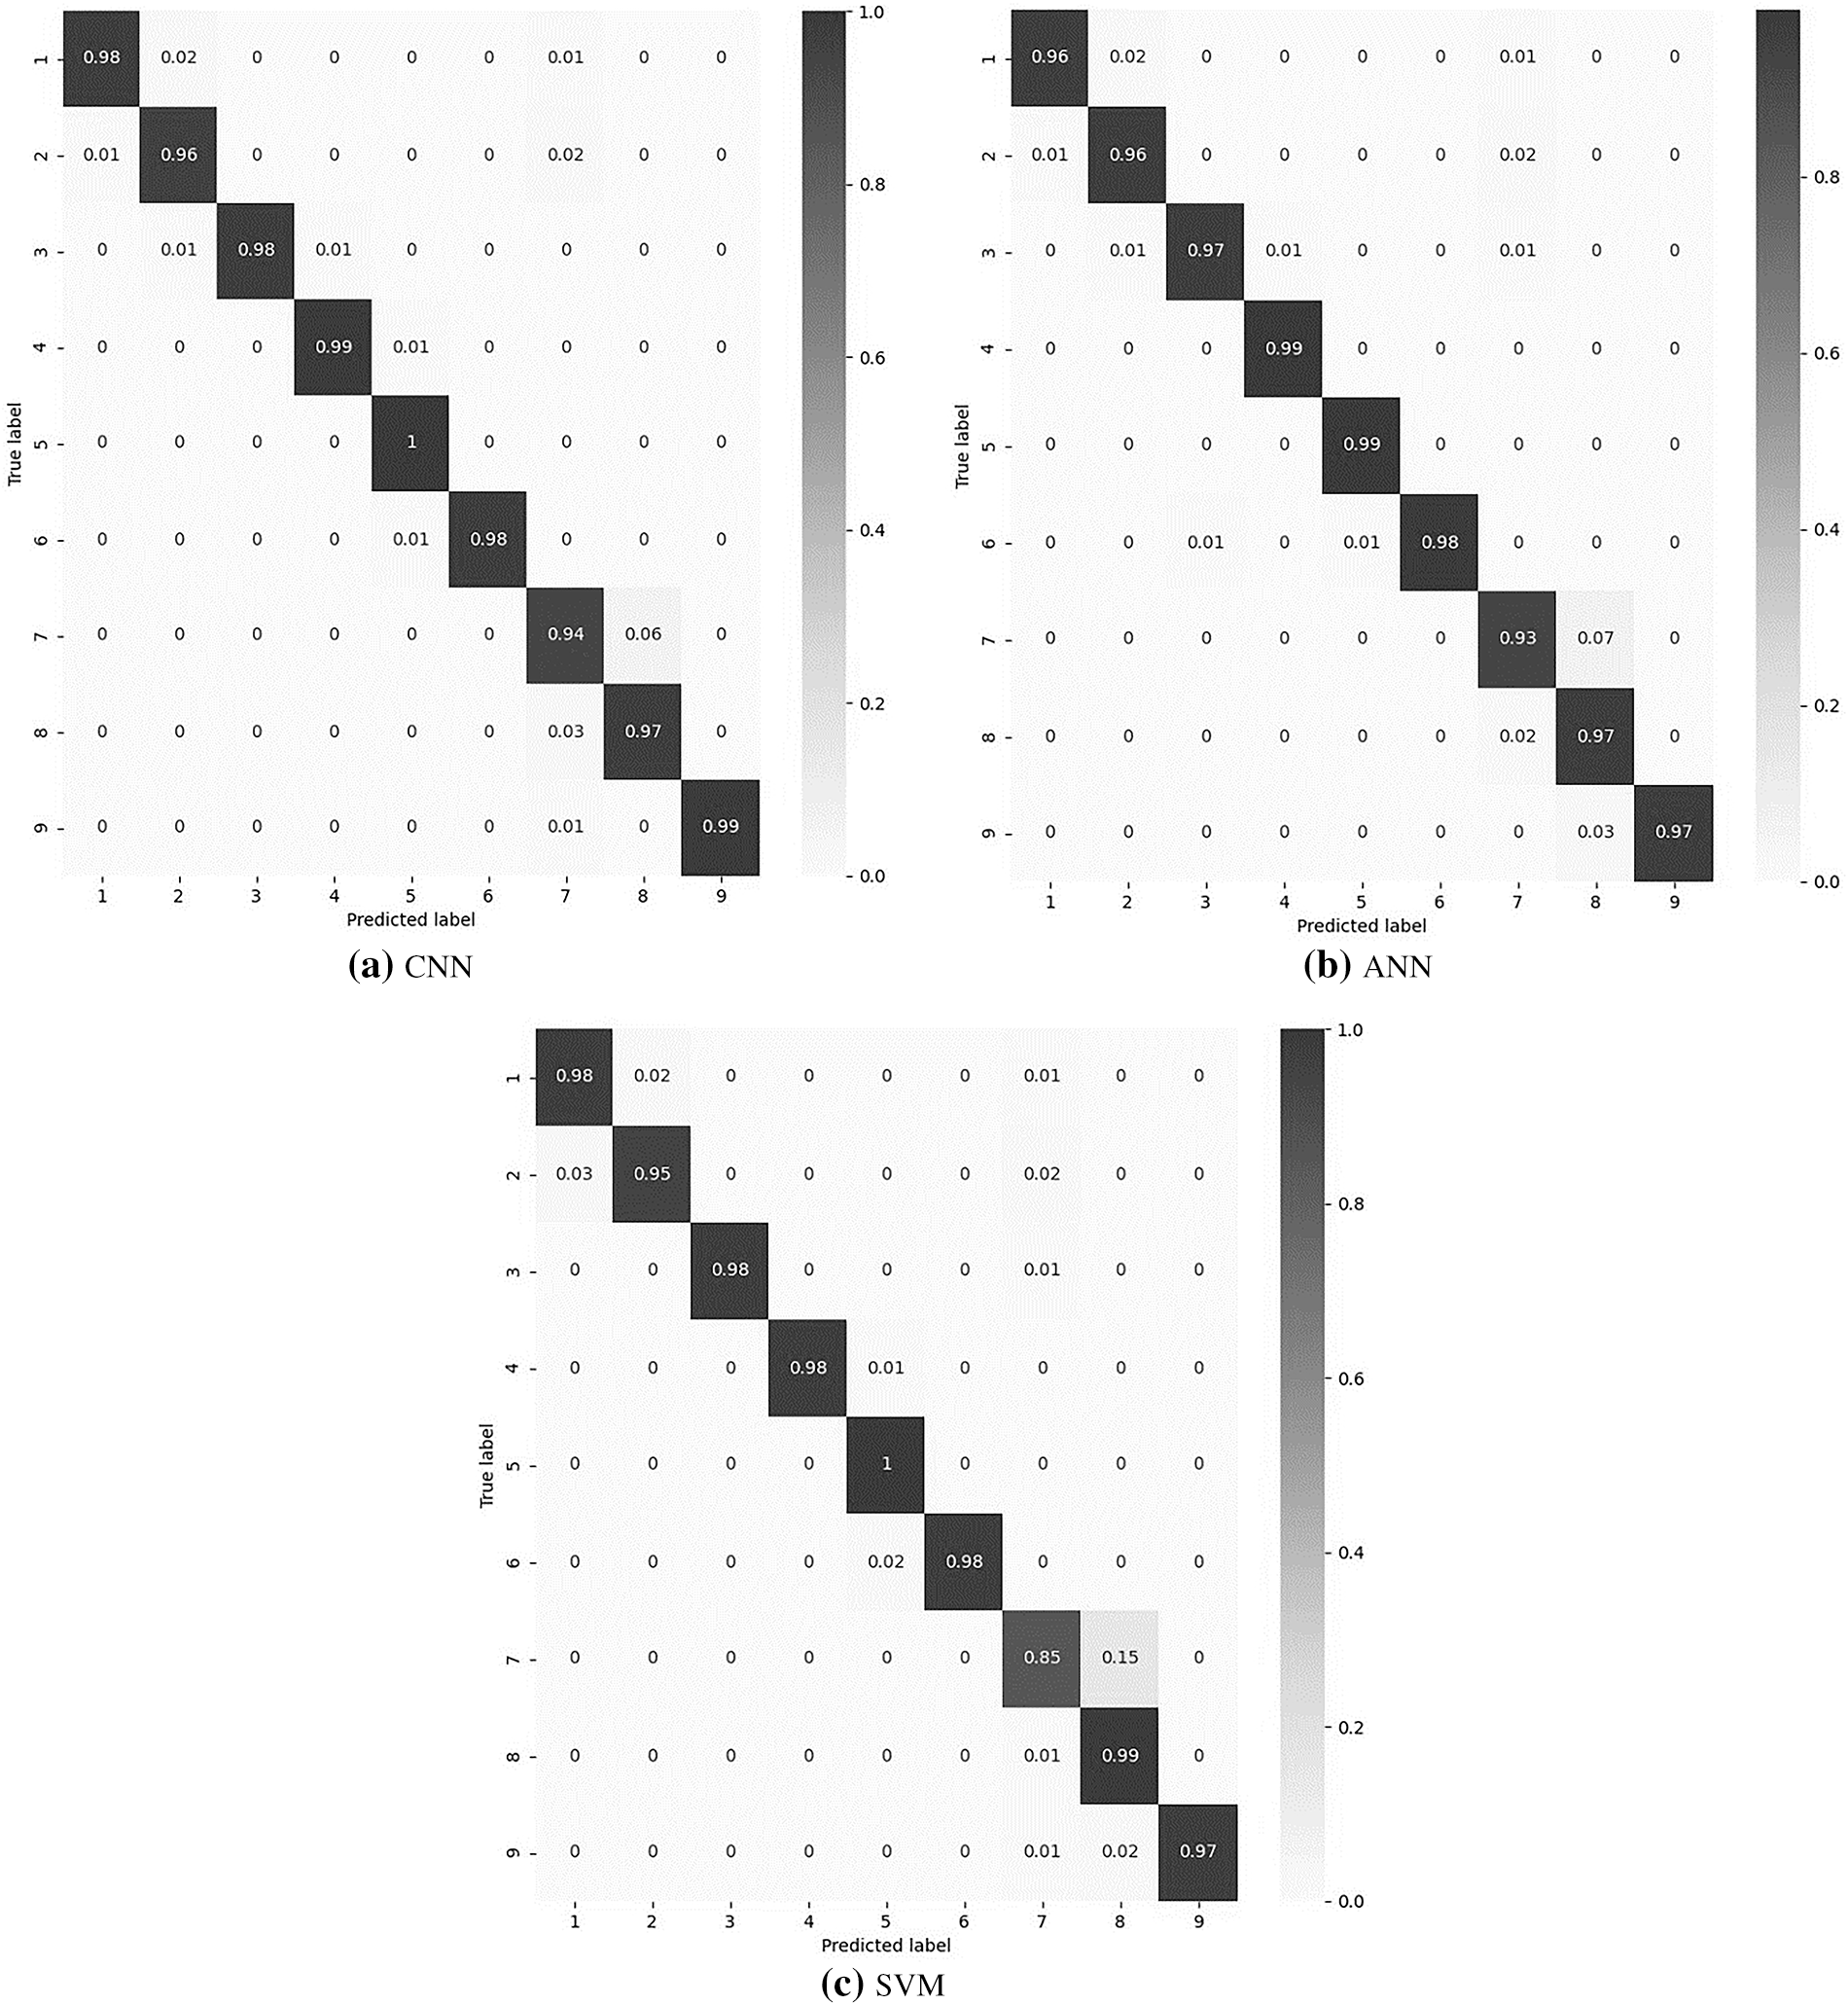
Figure 16: The confusion matrices for of the CNN and other algorithms used in literature
In this work, the mentoring system deployment technology for automatic monitoring is carried out for long-term pavement performance in the Xinjiang Autonomous Region by burying a variety of sensors in different parts of the road surface, base, roadbed, slope, etc. Aided by deep learning algorithms, a sensor monitoring network based on the Internet of Things technology is formed to achieve accurate, reliable, and continuous observation of environmental meteorology, physical state, mechanical response, structural deformation, and other indicators. Due to the large amount of data and high real-time requirements, the perception data collected from sensors such as temperature, humidity, pressure, asphalt strain, and displacement are used to train a deep learning model based on a Convolutional Neural Network (CNN) Algorithm to predict the pavement multi-point displacement to detect the pavement damage, such as asphalt cracks and asphalt potholes. Through comparison of CNN-predicted data with pavement sensors experimental data for the multi-point displacement, the CNN demonstrates significantly improved prediction quality for this case study, showing its effectiveness in accurately modeling the structural behavior. It has been found that the response of the proposed CNN achieved high rates of
Acknowledgement: None.
Funding Statement: The author received no specific funding for this study.
Availability of Data and Materials: Not applicable.
Ethics Approval: Not applicable.
Conflicts of Interest: The author declares no conflicts of interest to report regarding the present study.
References
1. Shtayat A, Moridpour S, Best B. Using e-bikes and private cars in dynamic road pavement monitoring. Int J Transp Sci Technol. 2022;11(1):132–43. doi:10.1016/j.ijtst.2021.03.004. [Google Scholar] [CrossRef]
2. Justo-Silva R, Ferreira A, Flintsch G. Review on machine learning techniques for developing pavement performance prediction models. Sustainability. 2021;13(9):5248. doi:10.3390/su13095248. [Google Scholar] [CrossRef]
3. Sabir Z, Chen G, Mao M, Hong W, Altabey WA. Lightweight monitoring technology for traffic infrastructure based on wireless low-power sensing devices. In: Proceedings of the 6th International Conference on Advances in Civil and Ecological Engineering Research; 2025 Jul 23–26; Beijing, China. Cham, Switzerland: Springer; 2025. p. 137–47. doi:10.1007/978-981-96-1627-5_12. [Google Scholar] [CrossRef]
4. Zhu R, Lai T, Hong W, Silik A, Noori M, Altabey WA. Machine vision approach of bridges crack identification based on the fusion of UAV vision and LiDAR. In: Proceedings of the 4th International Civil Engineering and Architecture Conference; 2024 Mar 14 –17; Seoul, Republic of Korea. Cham, Switzerland: Springer; 2024. p. 39–50. doi:10.1007/978-981-97-5477-9_4. [Google Scholar] [CrossRef]
5. Meng J, Hong W, Ba AF, Silik A, Noori M, Altabey WA. Intelligence approach for road crack detection based on real-world measurement. In: Proceedings of the 4th International Civil Engineering and Architecture Conference; 2024 Mar 14–17; Seoul, Republic of Korea. Cham, Switzerland: Springer; 2024. p. 83–96. doi:10.1007/978-981-97-5477-9_7. [Google Scholar] [CrossRef]
6. Haja Mohideen AJ, Rosli MF, Mohamad Hanif NHH, Mohd Zaki HF, Husman MA, Abdul Muthalif AG, et al. Pavement condition analysis via vehicle mounted accelerometer data. IIUM Eng J. 2020;21(1):73–84. doi:10.31436/iiumej.v21i1.1223. [Google Scholar] [CrossRef]
7. Farhadmanesh M, Cross C, Mashhadi AH, Rashidi A, Wempen J. Highway asset and pavement condition management using mobile photogrammetry. Transp Res Rec J Transp Res Board. 2021;2675(9):296–307. doi:10.1177/03611981211001855. [Google Scholar] [CrossRef]
8. Arezoumand S, Mahmoudzadeh A, Golroo A, Mojaradi B. Automatic pavement rutting measurement by fusing a high speed-shot camera and a linear laser. Constr Build Mater. 2021;283:122668. doi:10.1016/j.conbuildmat.2021.122668. [Google Scholar] [CrossRef]
9. Jahanshahi MR, Jazizadeh F, Masri SF, Becerik-Gerber B. Unsupervised approach for autonomous pavement-defect detection and quantification using an inexpensive depth sensor. J Comput Civil Eng. 2013;27(6):743–54. doi:10.1061/(asce)cp.1943-5487.0000245. [Google Scholar] [CrossRef]
10. Buza E, Akagic A, Omanovic S, Hasic H. Unsupervised method for detection of high severity distresses on asphalt pavements. In: Proceedings of the 2017 IEEE 14th International Scientific Conference on Informatics; 2017 Nov 14–16; Poprad, Slovakia; 2018. p. 45–50. doi:10.1109/INFORMATICS.2017.8327220. [Google Scholar] [CrossRef]
11. Lekshmipathy J, Samuel NM, Velayudhan S. Vibration vs. vision: best approach for automated pavement distress detection. Int J Pavement Res Technol. 2020;13(4):402–10. doi:10.1007/s42947-020-0302-y. [Google Scholar] [CrossRef]
12. Zhang C, Nateghinia E, Miranda-Moreno LF, Sun L. Pavement distress detection using convolutional neural network (CNNa case study in Montreal, Canada. Int J Transp Sci Technol. 2022;11(2):298–309. doi:10.1016/j.ijtst.2021.04.008. [Google Scholar] [CrossRef]
13. Koch C, Georgieva K, Kasireddy V, Akinci B, Fieguth P. A review on computer vision based defect detection and condition assessment of concrete and asphalt civil infrastructure. Adv Eng Inform. 2015;29(2):196–210. doi:10.1016/j.aei.2015.01.008. [Google Scholar] [CrossRef]
14. Hadjidemetriou GM, Vela PA, Christodoulou SE. Automated pavement patch detection and quantification using support vector machines. J Comput Civ Eng. 2018;32:04017073. doi:10.1061/(asce)cp.1943-5487.0000724. [Google Scholar] [CrossRef]
15. Cano-Ortiz S, Pascual-Muñoz P, Castro-Fresno D. Machine learning algorithms for monitoring pavement performance. Autom Constr. 2022;139:104309. doi:10.1016/j.autcon.2022.104309. [Google Scholar] [CrossRef]
16. Di Graziano A, Marchetta V, Cafiso S. Structural health monitoring of asphalt pavements using smart sensor networks: a comprehensive review. J Traffic Transp Eng Engl Ed. 2020;7(5):639–51. doi:10.1016/j.jtte.2020.08.001. [Google Scholar] [CrossRef]
17. Ranyal E, Sadhu A, Jain K. Road condition monitoring using smart sensing and artificial intelligence: a review. Sensors. 2022;22(8):3044. doi:10.3390/s22083044. [Google Scholar] [PubMed] [CrossRef]
18. Abbondati F, Biancardo SA, Veropalumbo R, Dell’Acqua G. Surface monitoring of road pavements using mobile crowdsensing technology. Measurement. 2021;171:108763. doi:10.1016/j.measurement.2020.108763. [Google Scholar] [CrossRef]
19. Li Y, Liu C, Du Y, Jiang S. A novel evaluation method for pavement distress based on impact of ride comfort. Int J Pavement Eng. 2022;23(3):638–50. doi:10.1080/10298436.2020.1765241. [Google Scholar] [CrossRef]
20. Sabir N, Ali Memon A, Shaikh FK. Threshold based efficient road monitoring system using crowdsourcing approach. Wirel Pers Commun. 2019;106(4):2407–25. doi:10.1007/s11277-019-06324-y. [Google Scholar] [CrossRef]
21. Wu C, Wang Z, Hu S, Lepine J, Na X, Ainalis D, et al. An automated machine-learning approach for road pothole detection using smartphone sensor data. Sensors. 2020;20(19):5564. doi:10.3390/s20195564. [Google Scholar] [PubMed] [CrossRef]
22. Safaei N, Smadi O, Masoud A, Safaei B. An automatic image processing algorithm based on crack pixel density for pavement crack detection and classification. Int J Pavement Res Technol. 2022;15(1):159–72. doi:10.1007/s42947-021-00006-4. [Google Scholar] [CrossRef]
23. Eriksson J, Girod L, Hull B, Newton R, Madden S, Balakrishnan H. The pothole patrol: using a mobile sensor network for road surface monitoring. In: Proceedings of the 6th International Conference on Mobile Systems, Applications, and Services; 2008 Jun 18–20; Breckenridge, CO, USA. New York, NY, USA: ACM; 2008. p. 29–39. doi:10.1145/1378600.1378605. [Google Scholar] [CrossRef]
24. Pan Y, Chen X, Sun Q, Zhang X. Monitoring asphalt pavement aging and damage conditions from low-altitude UAV imagery based on a CNN approach. Can J Remote Sens. 2021;47(3):432–49. doi:10.1080/07038992.2020.1870217. [Google Scholar] [CrossRef]
25. Jana S, Thangam S, Kishore A, Kumar VS, Vandana S. Transfer learning based deep convolutional neural network model for pavement crack detection from images. Int J Nonlinear Anal Appl. 2022;13:1209–23. [Google Scholar]
26. Seraj F, Van der Zwaag BJ, Dilo A, Luarasi T, Havinga P. RoADS: a road pavement monitoring system for anomaly detection using smart phones. In: Big data analytics in the social and ubiquitous context. Cham, Switzerland: Springer; 2016. p. 128–46. doi:10.1007/978-3-319-29009-6_7. [Google Scholar] [CrossRef]
27. Basavaraju A, Du J, Zhou F, Ji J. A machine learning approach to road surface anomaly assessment using smartphone sensors. IEEE Sens J. 2020;20(5):2635–47. doi:10.1109/JSEN.2019.2952857. [Google Scholar] [CrossRef]
28. Altabey WA. Innovative intelligent and expert system of bridges damage identification via wavelet packet energy curvature difference method integrated with artificial intelligence algorithms. Sound Vib. 2025;59(2):2372. doi:10.59400/sv2372. [Google Scholar] [CrossRef]
29. Li X, Huo D, Goldberg DW, Chu T, Yin Z, Hammond T. Embracing crowdsensing: an enhanced mobile sensing solution for road anomaly detection. ISPRS Int J Geo Inf. 2019;8(9):412. doi:10.3390/ijgi8090412. [Google Scholar] [CrossRef]
Cite This Article
 Copyright © 2026 The Author(s). Published by Tech Science Press.
This work is licensed under a Creative Commons Attribution 4.0 International License , which permits unrestricted use, distribution, and reproduction in any medium, provided the original work is properly cited.
 Downloads
 Citation Tools