
 Submit a Paper
 Propose a Special lssue
 Open Access
ARTICLE

Life-Cycle and Cost Assessment of Suspension Bridge Hangers Considering Traffic Loads and Maintenance Strategies
1 CCCC Highway Bridges National Engineering Research Centre Co., Ltd., Beijing, 100011, China
2 School of Transportation, Southeast University, Nanjing, 211189, China
3 Guangzhou Communications Investment Group Co., Ltd., Guangzhou, 510320, China
4 School of Civil Engineering and Architecture, Zhejiang Sci-Tech University, Hangzhou, 310018, China
* Corresponding Author: Yuan Ren. Email:
(This article belongs to the Special Issue: Advances in Intelligent Operation and Maintenance Applications for Bridge Structures)
Structural Durability & Health Monitoring 2026, 20(2), 13 https://doi.org/10.32604/sdhm.2025.075363
Received 30 October 2025; Accepted 29 December 2025; Issue published 31 March 2026
 View Full Text
 Download PDF
Abstract
Hangers play a crucial role in transferring loads in suspension bridges, yet their condition often deteriorates faster than expected due to corrosion and fatigue effects. Premature hanger failure poses serious risks to bridge safety and results in significant economic loss due to frequent replacement and traffic interruption. To address these challenges, this study proposes an integrated framework to evaluate the life-cycle safety and operational cost of bridge hangers. Traffic data obtained from Weigh-in-Motion (WIM) systems are used to simulate dynamic hanger responses. A wire-to-hanger deterioration model is then employed to capture the time-dependent interaction between corrosion and fatigue under varying environmental conditions. The failure probability of hangers is incorporated into a cost model that accounts for inspection, maintenance, replacement, and traffic disruptions associated with failure. A case study of the Jiangyin Yangtze River Bridge is conducted based on its WIM data and inspection records. The simulation results show that corrosion-fatigue interaction significantly accelerates hanger degradation. However, timely and effective maintenance measures including anchorage dehumidification can extend service life and reduce total operational costs. The proposed framework provides a practical tool for designing cost-effective maintenance strategies and improving the long-term performance of suspension bridge hangers.Keywords
Large-span bridges, such as suspension and cable-stayed bridges, serve as vital links in transportation networks and play a key role in regional economic growth. In recent years, the global demand for such structures has continued to rise, driven by the pursuit of larger spans. For example, China has constructed more than ten ultra-long suspension bridges with main spans of over 1000 m in the past two decades [1]. However, the increasing span and complexity of such structures pose greater challenges to the performance and service life of cable systems, which are subjected to heavier traffic loads, wider stress ranges, and harsher environmental conditions.
Bridge hangers (suspenders) are critical components in suspension bridges that link the main cable and bridge deck. Existing inspection and replacement records show that many hangers well before than their intended design life due to corrosion–fatigue effects. Hanger failures have drawn public concern and caused severe economic losses, highlighting the need for long-term management of cable systems [2]. Frequent replacements, often triggered by inadequate maintenance, not only disrupt traffic but also increase operational costs [3,4]. For instance, several hangers of the Jiangyin Yangtze River Bridge in Jiangsu, China, which suffered cable corrosion and sheath damage, were replaced less than 16 years after opening [5]. These replacements caused significant repair expenses and lane closures, affecting both bridge operation and toll income. However, existing evaluation standards mainly focus on visible defects and rely solely on manual inspections, which cannot provide an early or reliable prediction of hanger performance. Therefore, a practical and comprehensive framework is needed to evaluate hanger performance from both structural and economic perspectives.
Studies show that corrosion–fatigue damage induced by environmental exposure and cyclic loading is the main cause of hanger premature failures. Current evaluation of in-service hangers mainly focuses on life prediction and reliability assessment [6], using S–N based damage analysis [7,8], continuum damage mechanics (CDM) [9–11], and fracture mechanics approaches [12–15]. Paris-law-based fracture-mechanics models are widely used to describe corrosion-fatigue crack growth in steel wires, which generally follows a pit-to-crack initiation and crack propagation process. Existing studies mainly examine how loading conditions and corrosion severity influence wire degradation. For example, Yu et al. [7] established a fatigue-probability model coupling stress range, mean stress, and corrosion induced weight loss rate. Through Monte Carlo simulation, the results revealed that cable life is controlled by a few weak wires, and stress redistribution accelerates inner wire failure under heavy traffic. The corrosion variance among wire layers also plays a key role, with outer layers showing faster crack propagation and quicker reliability loss [16].
Although many analytical and probabilistic models exist regarding the corrosion–fatigue failure associated with wires and cables, the long-term evaluation and maintenance of cable structures remain inadequately studied. Three major challenges remain to be addressed:
(1) Most previous studies have focused on the detrimental effects of corrosion and fatigue but have rarely considered the mitigating effects of maintenance actions. In practice, maintenance can significantly slow down the deterioration process, yet its timing and effectiveness are often simplified or ignored in existing analyses [17]. As a result, the protective benefits of long-term interventions have not been properly quantified.
(2) The corrosion rate of steel wires varies over time depending on environmental conditions and maintenance measures. Among them, anchorage dehumidification has proven to be one of the most effective methods for suppressing corrosion by controlling the relative humidity (RH). Studies have shown that when RH falls below a critical level (typically 40%–60%), corrosion progression can be significantly suppressed [18–20]. However, this effect has rarely been incorporated into cable life prediction models, which are essential for developing rational and effective cable maintenance strategies.
(3) Although bridge maintenance is widely recognized as essential, maintenance actions are not always feasible due to untimely inspections or financial constraints. The effects of maintenance on transportation and operational costs are often neglected in existing evaluations [21]. For instance, hanger replacement across an entire suspension bridge may require a full closure of all lanes in one direction for several months, leading to substantial toll revenue losses and major detours for both commuter and freight traffic. In contrast, repair actions typically occupy only one lane, while routine inspections cause minimal disruption. These facts further underscore the need for more accurate cable condition evaluation to support cost-effective and practical maintenance strategies.
In response to these issues, this paper presents a comprehensive methodology for assessing safety and maintenance costs of suspension bridge hangers subjected to coupled corrosion–fatigue degradation and traffic loading. First, the time-varying cable forces are simulated using a dynamic finite element model (FEM) calibrated with Weigh-in-Motion (WIM) data. Second, a corrosion–fatigue degradation model is developed for hanger wires, incorporating the effects of environmental variations and maintenance actions such as dehumidification. Finally, a maintenance cost model is formulated to quantify the costs associated with inspection, dehumidification, replacement, and failure-induced losses. The proposed framework is applied to a representative hanger of the Jiangyin Yangtze River Bridge to evaluate different dehumidification scenarios and determine the optimal maintenance timing in terms of life-cycle performance and cost efficiency.
The primary contributions of this research are highlighted below: (1) A time-variant corrosion–fatigue model is developed to simulate hanger degradation under realistic traffic loads and varying humidity conditions. (2) A life-cycle cost framework is proposed that integrates service life estimation with maintenance strategies, with an emphasis on anchorage dehumidification. (3) The results provide guidance for cost-effective maintenance planning, demonstrating that long-term dehumidification can significantly extend hanger service life while minimizing traffic disruptions and overall costs.
This section presents the framework for evaluating the time-dependent degradation and maintenance costs of bridge hangers under combined corrosion-fatigue effects and random traffic loading. The methodology consists of three main steps, as shown in Fig. 1: (1) Traffic load simulation using WIM data and dynamic finite element models; (2) Corrosion–fatigue modeling of steel wires and cable systems; (3) Life-cycle cost assessment.
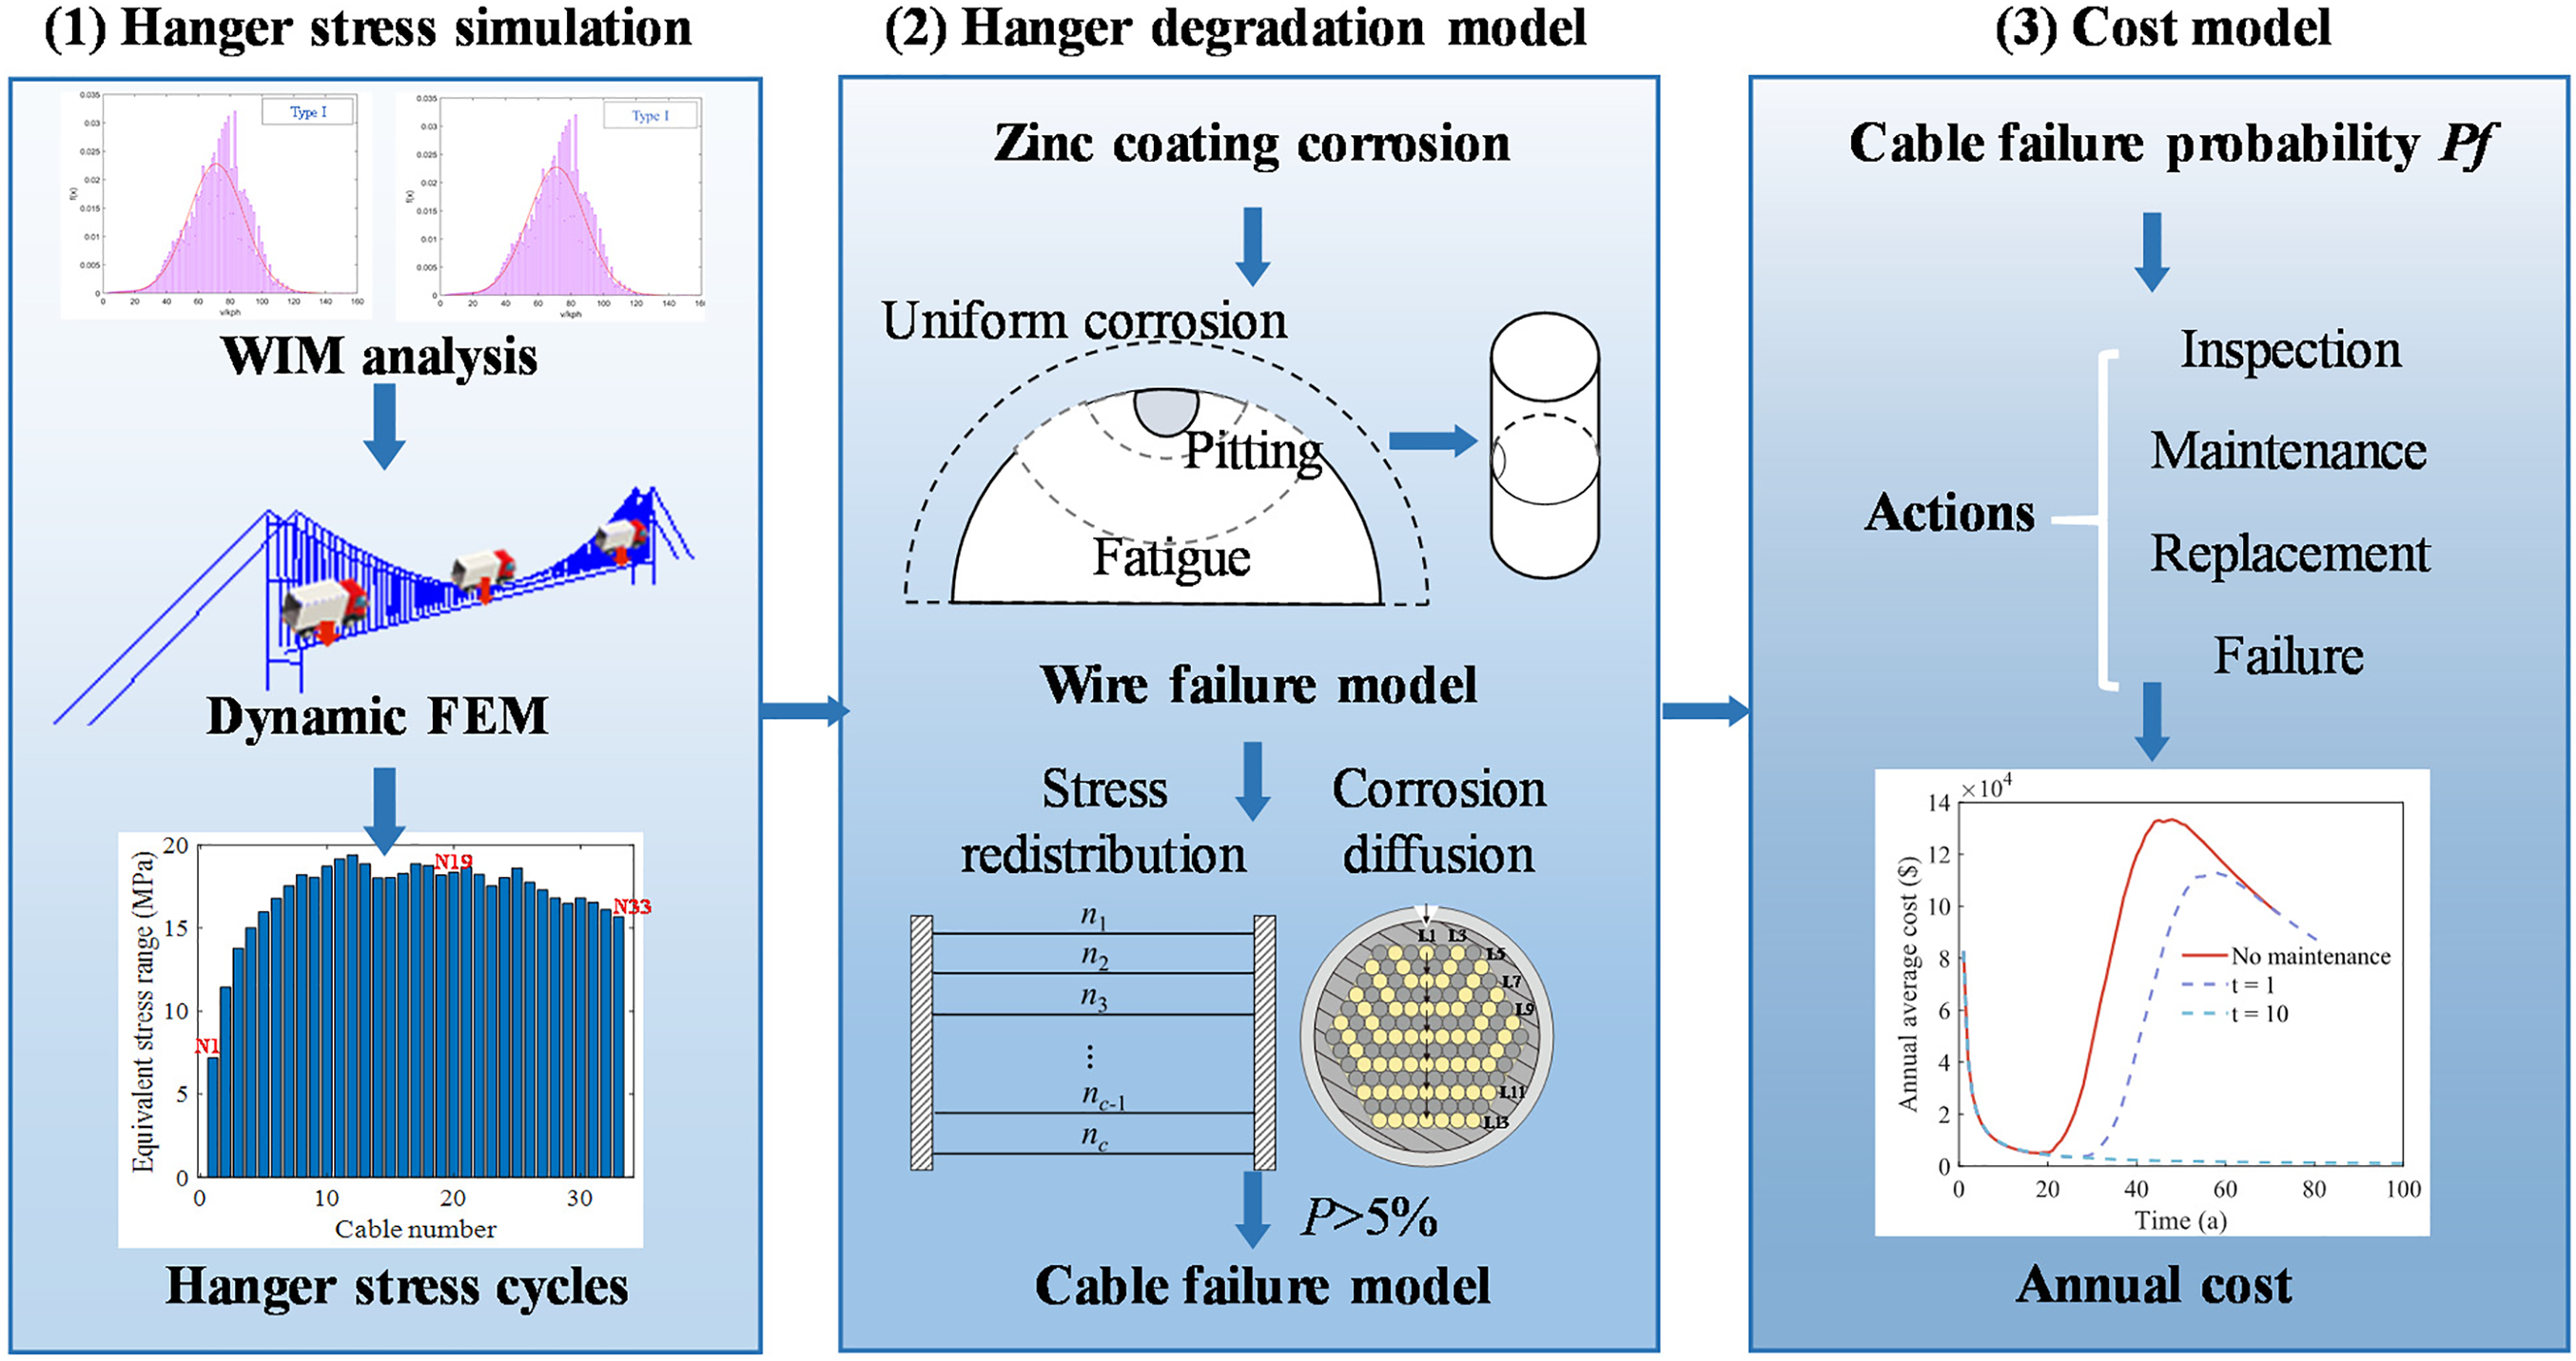
Figure 1: Framework of hanger evaluation
Based on the traffic data collected by WIM systems from real bridges, a comprehensive analysis framework is developed to model the hanger responses under realistic traffic conditions, as illustrated in Fig. 2. The raw WIM records are first resampled and statistically fitted to establish a traffic parameter database, including traffic volume, vehicle types, vehicle weights, initial speeds, and lane distributions.
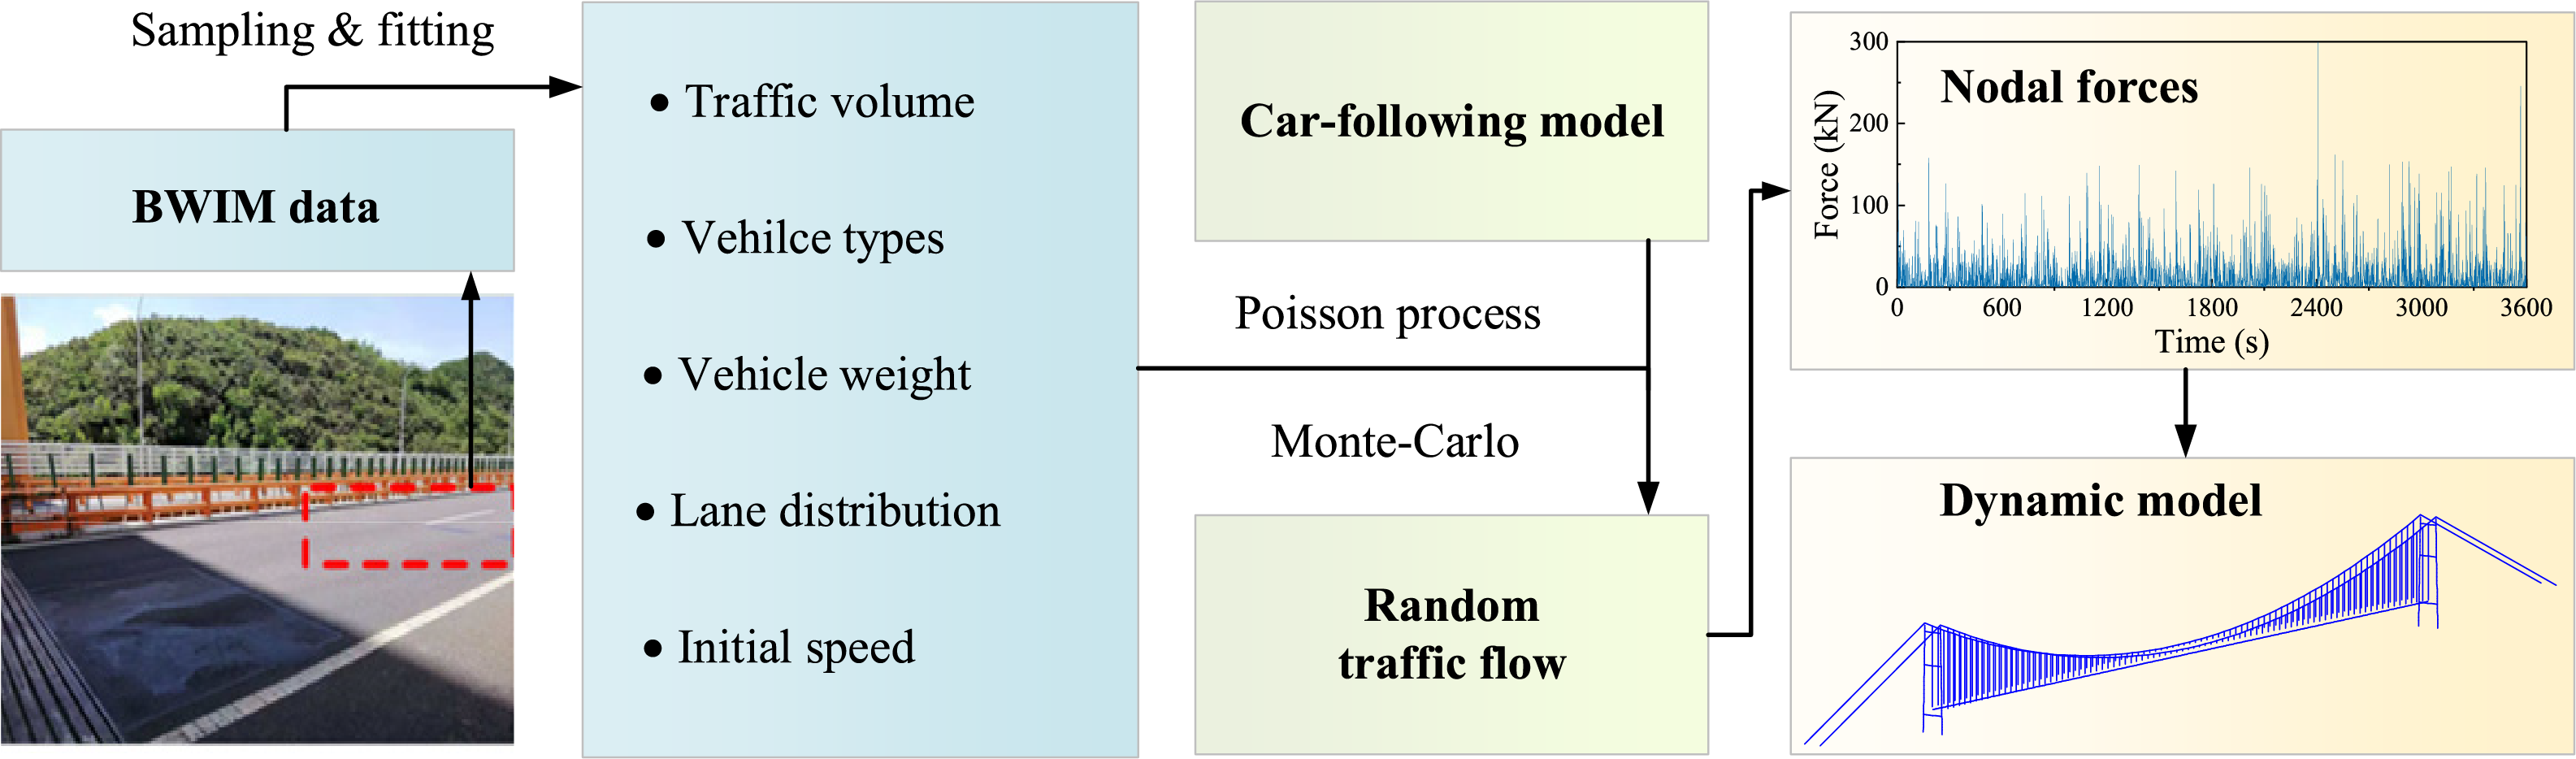
Figure 2: Flowchart for random traffic load simulation
Using these parameters, a Monte Carlo (MC) simulation is conducted to model stochastic traffic flow, combining a Poisson arrival process with a car-following model. Vehicle arrivals on the bridge are assumed to follow a Poisson process with rate λ, defined as the reciprocal of the mean inter-arrival time μ (μ = 3600 s):
where Qh is the average hourly traffic volume.
The car-following model is used to simulate the vehicle dynamics, including acceleration, deceleration and cruising. According to existing research [21], the leading vehicle in a fleet typically accelerates to its maximum speed and then maintains a constant speed. The driving state of a following vehicle depends on space gap Sgap and the relative speeds vL, vF of two vehicles, as described by Eqs. (2) and (3).
where
Each vehicle in the simulated traffic flow is modeled as a moving concentrated load acting on the bridge deck, thereby generating dynamic nodal forces. These time-dependent loads are applied to the bridge FEM to calculate structural responses and corresponding hanger forces under random traffic excitation. A simplified practical method is employed to simulate vehicle-induced dynamic responses, as shown in Fig. 2. Utilizing the nodal influence line method, vehicle-induced load histories for all girder nodes are generated at discrete time steps and integrated into the FEM.
As illustrated in Fig. 3, the total vehicle load W(t) for node N3 is expressed as W(t) = W1 × x1 + W2 × x2. Through this procedure, the traffic information derived from WIM data is embedded into the FEM, allowing accurate simulation of vehicle-induced loads over any selected time period. The finite element platform Midas Civil is used to construct the bridge model, and the generated random traffic flow is applied as time-history loads to each girder node, forming the final dynamic FEM for subsequent analysis.
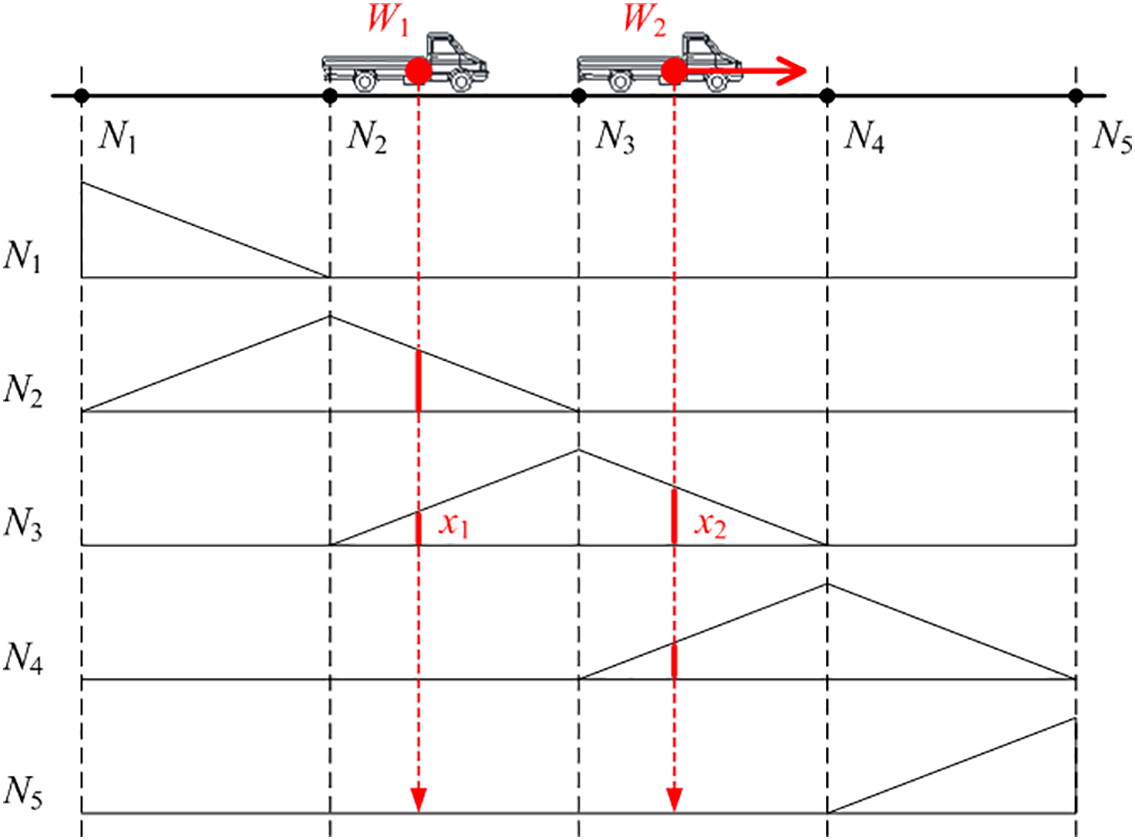
Figure 3: Illustration of nodal vehicle load influence line for girder
2.2 Time-Varying Degradation Model of Hangers
As illustrated in Fig. 1, the assessment of bridge hangers includes three steps. First, the stress responses of hangers are simulated using bridge WIM data and a dynamic FEM. Then a multi-scale failure model integrating wire and cable levels is developed, accounting for wire corrosion–fatigue damage and inter-wire correlations. Wire failure and cable failure are determined by the crack depth and the percentage of failed wires, respectively. Hanger deterioration is simulated via Monte Carlo (MC) methods to predict the remaining service life. Finally, the average cost considering operation and replacement is calculated based on the cable failure probability.
2.2.1 Corrosion–Fatigue Model of High-Strength Wires
The corrosion of cable wires generally involves three stages: depletion of the protective coating, typically a Zn or Zn–Al (Galfan) layer, followed by uniform corrosion and pitting. Pitting develops together with uniform corrosion, and the deeper pits often become crack initiation sites. The coating depletion time and the uniform corrosion depth of the steel wire can be calculated using Eqs. (4) and (5) [22]:
where t1 is depletion time of the wire coating (year); hz and hu are the uniform corrosion depth of coating and steel (μm), respectively; ψ1 and γ1 are the corrosion rate and tendency of coating; and ψ2 and γ2 are corrosion rate and tendency of steel substrate, respectively [23].
To consider the influence of maintenance actions such as cable anchorage dehumidification, α1 and α2 vary with different relative humidity (RH). For zinc coating under high RH, ψ1 can be determined as a constant value of 5.96 [22]. When considering anchorage dehumidification, it can be estimated to be 0.7 [24].
For uniform steel corrosion, α2 ranges from 0.5 to 80, representing conditions from low to high corrosion rates [25]. The pitting depth hp is dependent on the uniform corrosion depth using the pitting factor [22,26]:
where ϕ follows a Gumbel distribution:
where f(·), ω, κ are the function of cumulative probability density, location parameter, and scale parameter, respectively. The scale parameter is calculated by:
where l and D are length and diameter (mm) of the wires, respectively.
Under repetitive loads, fatigue cracks tend to initiate from the corrosion pits and grow on the hanger wires [27]. As the crack grows, it approximately forms a semi-circle on the steel cross-section [27,28], as shown in Fig. 4. Fracture mechanics is one of the most widely used criteria for describing cable wire fatigue process, where the crack growth process is described using Paris law [29]:
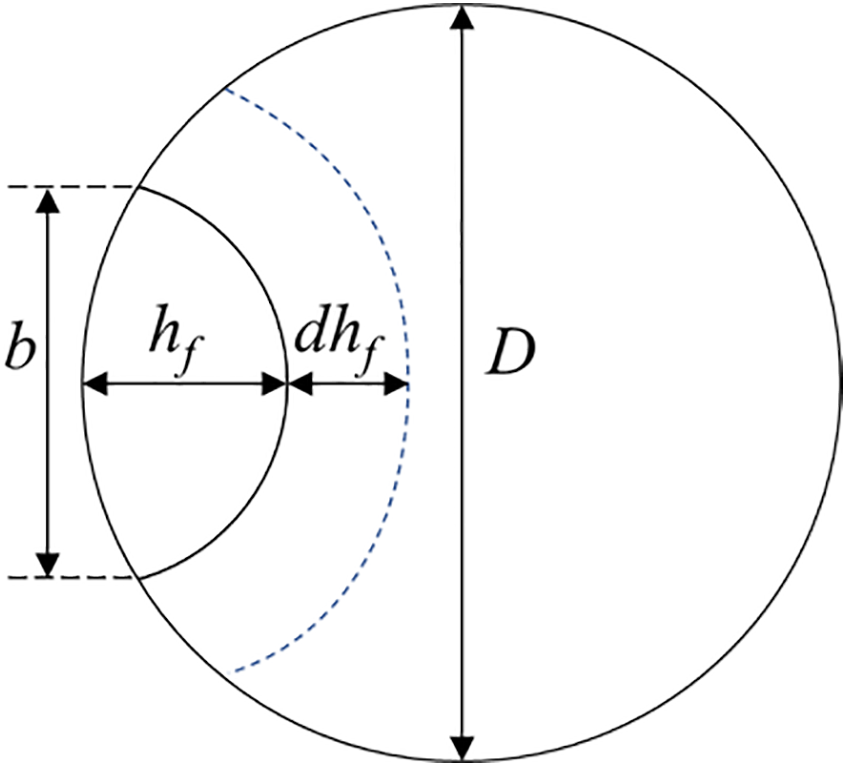
Figure 4: Fatigue crack growth of wires
where hf, dhf/dN and N are the fatigue crack depth (m), crack propagation rate and the number of stress cycles; C and m are coefficient and exponent of the Paris law. C follows a lognormal distribution, with the mean and coefficient of variation (COV) being 5.5 × 10⁻¹² and 0.1, respectively, while m is taken as 3.9 [30]; ΔKeq is equivalent stress intensity factor range (MPa·m1/2) which is determined by equivalent stress range and crack depth, written as [23]:
where Δσeq is the equivalent stress range (MPa); h is the crack depth caused by corrosion–fatigue coupling effect; Y is the dimensionless stress intensity factor determined by the crack geometry, written as [31]:
The fatigue crack depth of year t can subsequently be calculated by Eqs. (12) and (13) [32]:
where hf,t and Δhf,t are fatigue crack depth and its increment of ith year, respectively; N is the daily stress cycle number of year t; and hf,0 is initial defect of steel wire, following a lognormal distribution [33].
To determine the dominant degradation mechanism, a multi-factor rate competition model is used, which identifies the governing process at each time interval. This approach effectively uncouples corrosion–fatigue crack propagation, enabling the determination of the governing effect at any specific time, which can be expressed as [23]:
where h and h0 are the coupling and initial crack depth, i.e., hf,0, respectively; Δhj is the crack increment due to single factor, with j being fatigue and pitting corrosion. When the coupling crack exceeds a critical value, the wire is assumed to break or fail. The relative value of critical crack depth hc/D follows a lognormal distribution with the mean value of 0.390 and coefficient of variation of 0.414 [34].
2.2.2 Failure Model of Bridge Hangers
Hanger anchorages are prone to high internal RH due to water accumulation and sheath cracks. The corrosion environment varies within the cable anchorage sections, resulting in the different corrosion degrees among wires. Based on an analysis of a hanger replaced at the Shimen Bridge in Chongqing, China, Xu and Chen [35] observed that corrosion severity declines radially from the exterior sheath towards the center. Fig. 5 illustrates a representative corrosion distribution within a 127-wire hanger. This distribution pattern is correlated with the wire layering and can be expressed as:
where hu,k is the corrosion depth of the wires at the k-th first layer; Rk is the corrosion diffusion ratio of wire at the kth layer, which follows a normal distribution with the mean value of 0.844k−1 and the standard deviation of 0.427.
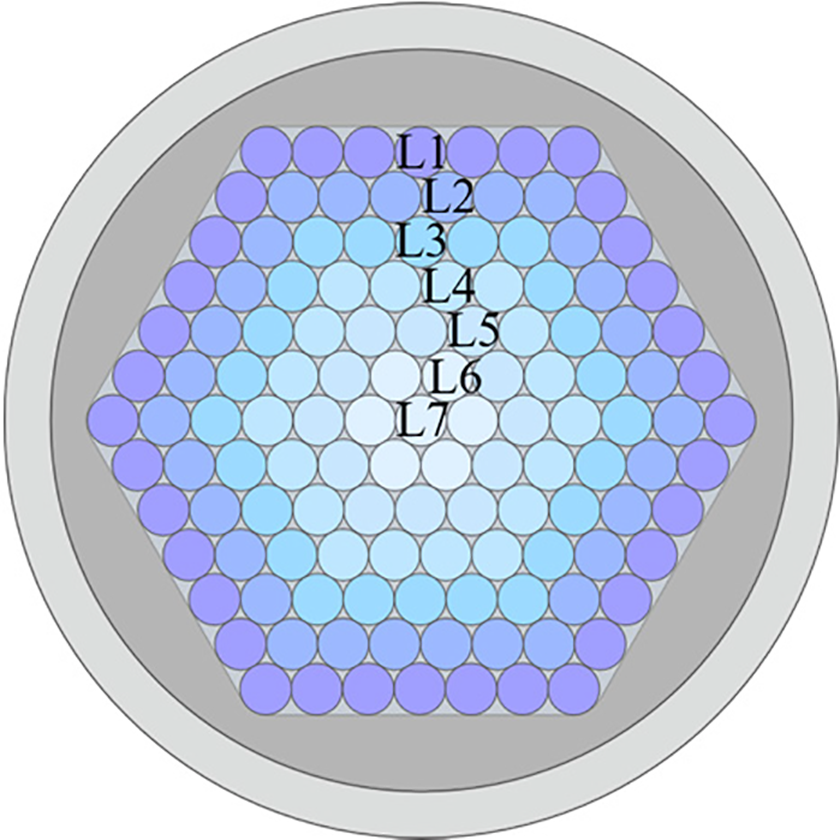
Figure 5: Corrosion diffusion in hanger anchorages
To represent parallel-wire hangers, the parallel system model is frequently employed, as shown in Fig. 6. As individual wires fracture sequentially, the stress range is redistributed among the remaining intact wires. Meanwhile, the stress in an individual wire increases as its effective cross-sectional area decreases. Consequently, the equivalent stress range for the surviving wires is described as follows:
where Δσeq,0 is the initial equivalent stress range with no broken wires, calculated by rainflow counting method [21,36]; A0 is the initial wire area (m2), i.e., πD2/4; and nc and nb are the number of total wires and broken wires.
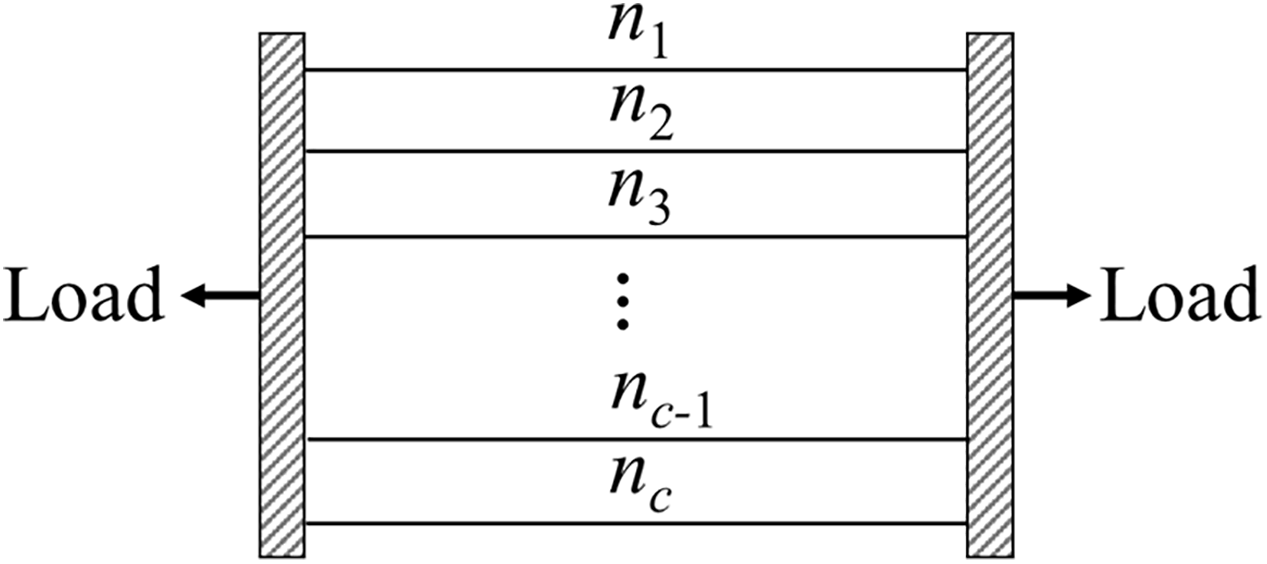
Figure 6: Parallel wire system of hangers
According to the standard Specifications for maintenance of highway bridges and culverts (JTG 5120-2021) [37], suspension bridge hangers must be replaced when either the proportion of broken wires or the corrosion level exceeds 5%. When the proportion of broken wires (P) reaches the critical limit of 5%, the simulation of hanger deterioration is terminated. Consequently, the failure probability of the hanger, Pf, is calculated as the ratio of simulations in which failure occurs to the total number of simulations.
2.2.3 Cost Model of Hanger Operation and Maintenance
To evaluate the economic implications of inspection, maintenance, and replacement throughout the hanger’s life cycle, a cost model is developed. The model identifies the optimal maintenance timing and strategy by minimizing the expected annual average cost CA, expressed as [3]:
where CI, CM, CR and CF are cumulative inspection, maintenance, replacement, and failure costs, respectively, seen in Table 1.
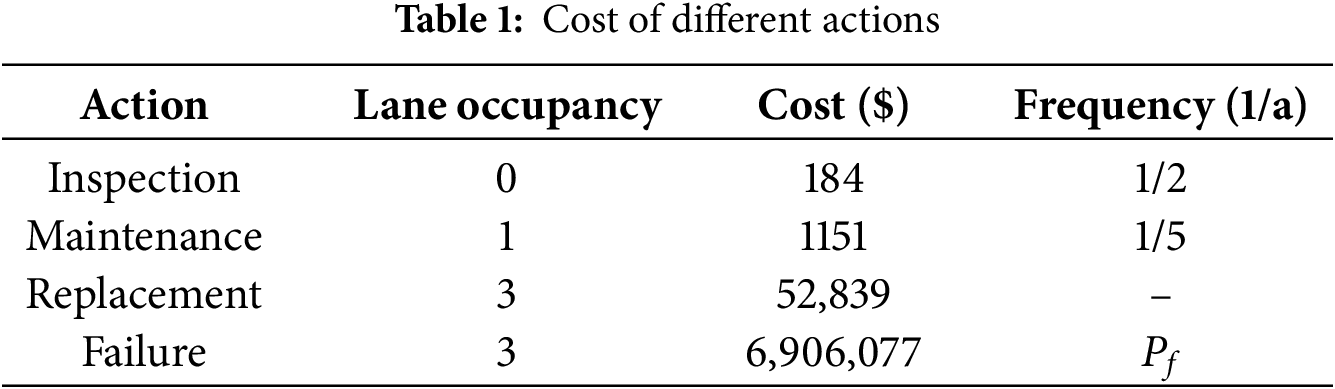
Maintenance measures, which include anchorage dehumidification and hanger replacement, are shown in Fig. 7. The cost includes both direct dehumidification expenses and indirect economic losses due to traffic disruption, specifically toll revenue losses resulting from lane closures. Given the directional daily traffic volume of approximately 50,000 vehicles and an average toll rate of roughly $4 per vehicle, lane closures may lead to significant economic impacts. As summarized in Table 1, lane occupancy and durations differ significantly among measures: inspections have minimal impact, routine maintenance occupies one lane for around 7 days every 5 years, and hanger replacement requires closure of all three lanes in one direction. Considering the severe socio-economic impact of abrupt hanger failure, an unexpected failure can lead to extremely high costs, potentially more than 100 times that of planned replacement. This highlights the importance of proactive and timely maintenance interventions to avoid costly emergency replacements and repeated traffic disruptions.
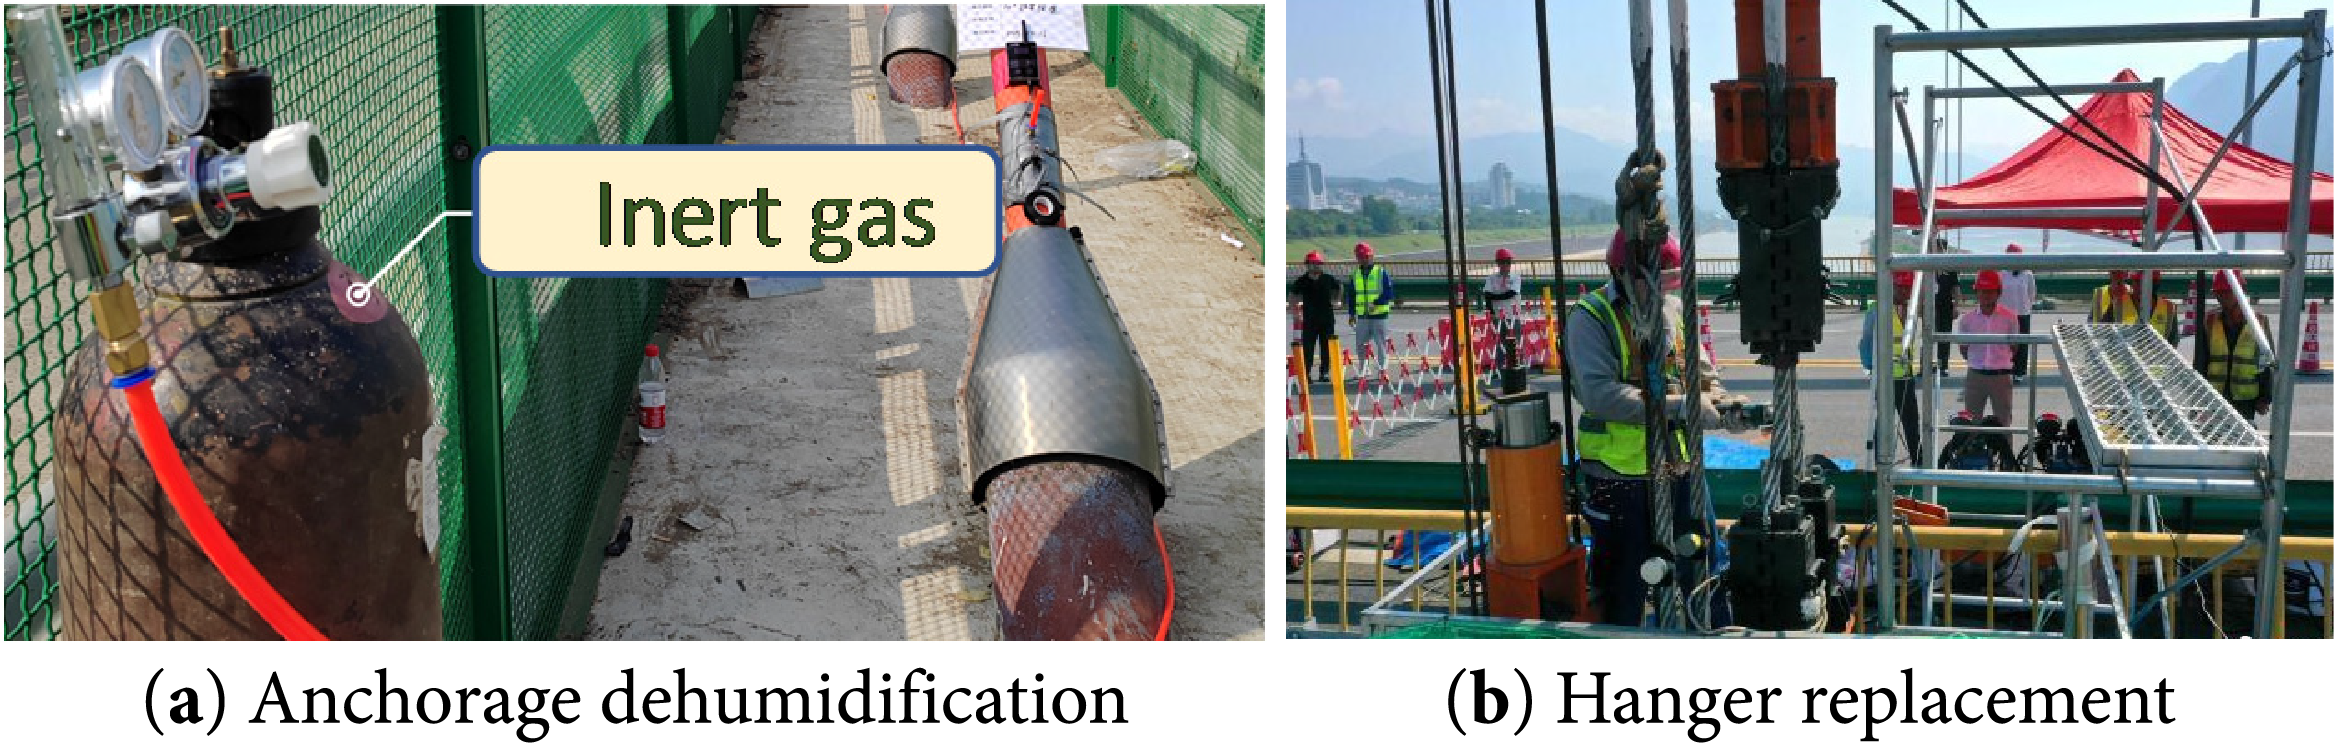
Figure 7: Cable maintenance actions
The Jiangyin Yangtze River Bridge, a large-span suspension bridge, is chosen as the case study. The main span of the bridge is 1385 m, as shown in Fig. 8. The bridge was built in 1999, and the hangers were gradually replaced between 2010 and 2018 following field inspections that revealed surface rust, water accumulation, and other defects, indicating progressive deterioration of their service condition. The downstream hanger N19 was replaced and was subsequently tested in the laboratory to evaluate its corrosion level. Therefore, it was selected as one of the representative hangers. Short hangers are currently not considered in this study because of their complex loading patterns and corrosion environments.
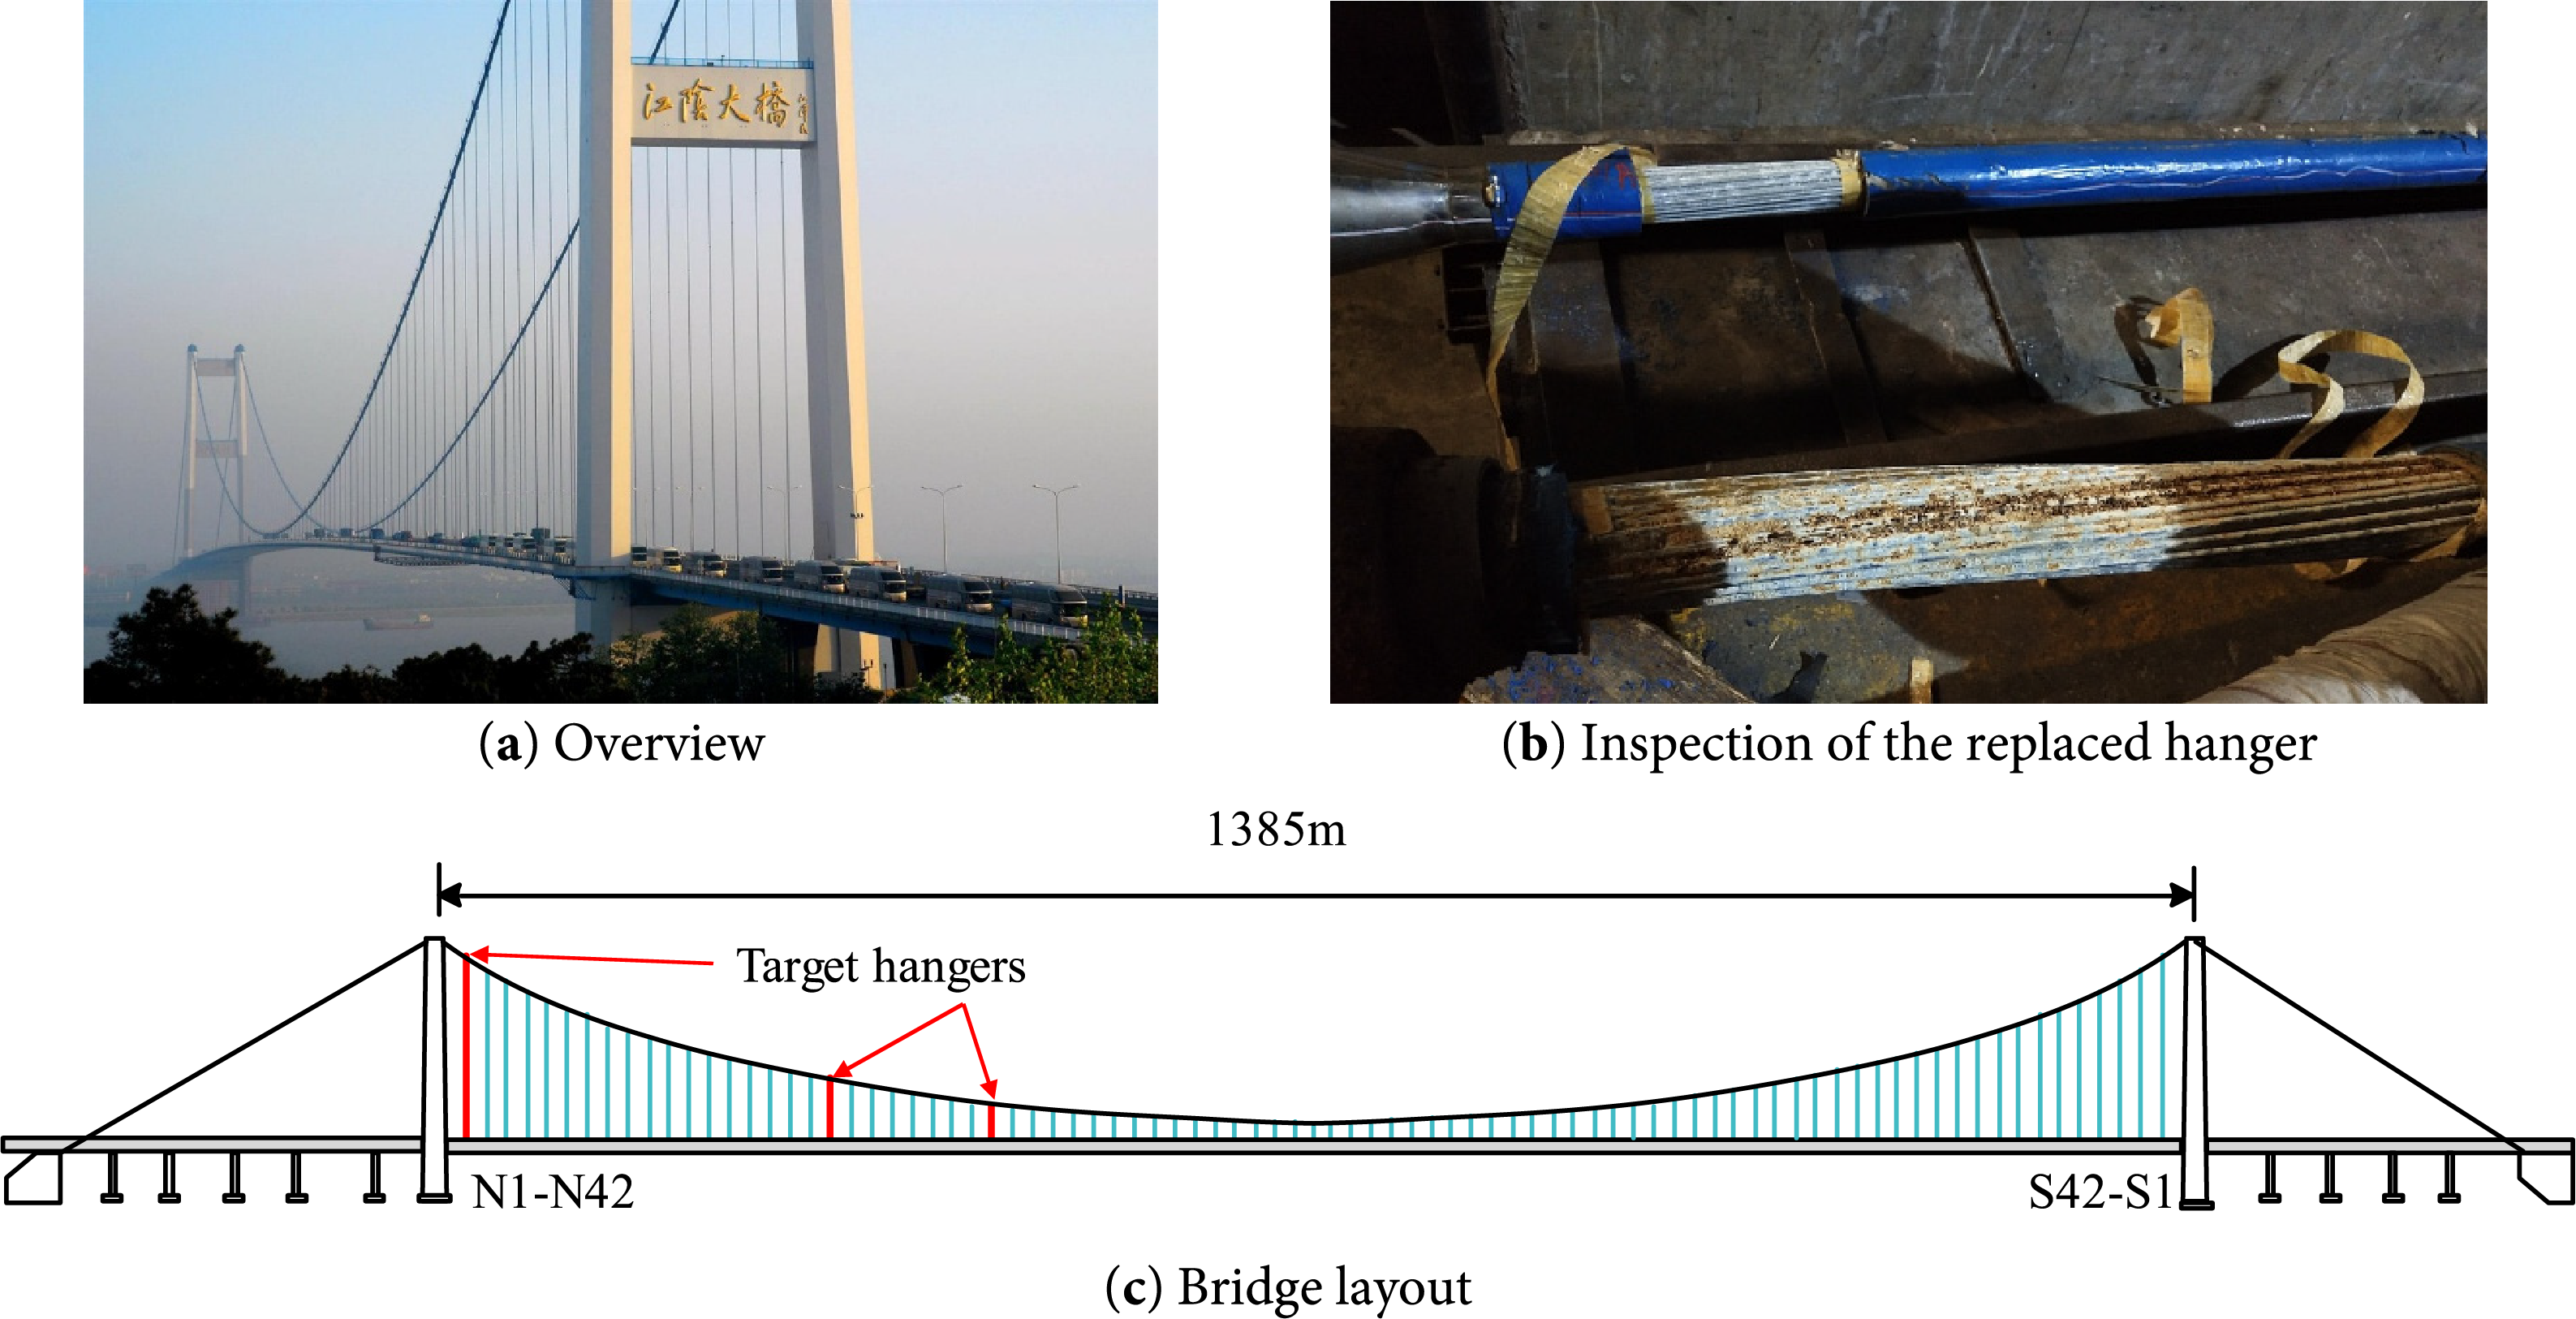
Figure 8: Layout of the suspension bridge
WIM data collected from the Jiangyin Yangtze River Bridge between November 2020 and August 2022 were analysed to generate stochastic traffic load. First, vehicles were classified into eight representative types based on their axle configurations, as shown in Table 2. These types collectively account for approximately 100% of all vehicles with a total of 31,476,056. In the axle-group notation, the numeric values denote the number of tires per axle: types 2 and 4 represent single axles with single and dual tires per side, respectively; type 8 corresponds to tandem axles with dual tires on each side; and type 12 represents tridem axles, also equipped with dual tires per side.
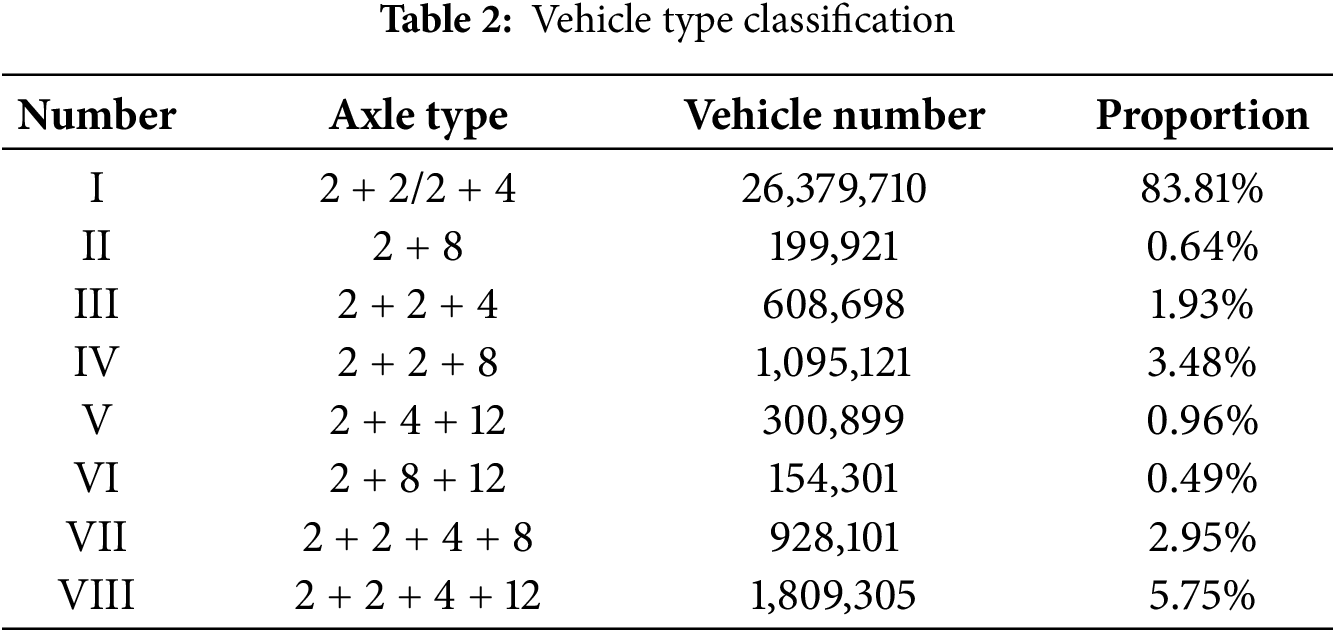
Statistical results show that Type I vehicles (passenger cars) are the dominant vehicle category, accounting for over 83% of the traffic. Among heavy freight vehicles, Type VIII trucks are the most common, accounting for 5.75% of the total volume. Based on this classification, mixture lognormal distribution models were used to fit the weight distribution of each vehicle type. The number of components in each mixture was determined using the Bayesian Information Criterion (BIC), ensuring model parsimony while preserving fitting accuracy. The resulting probability density functions were validated using the Kolmogorov–Smirnov (K–S) test to confirm the goodness of fit. The fitted weight distributions for the eight vehicle types are shown in Fig. 9.
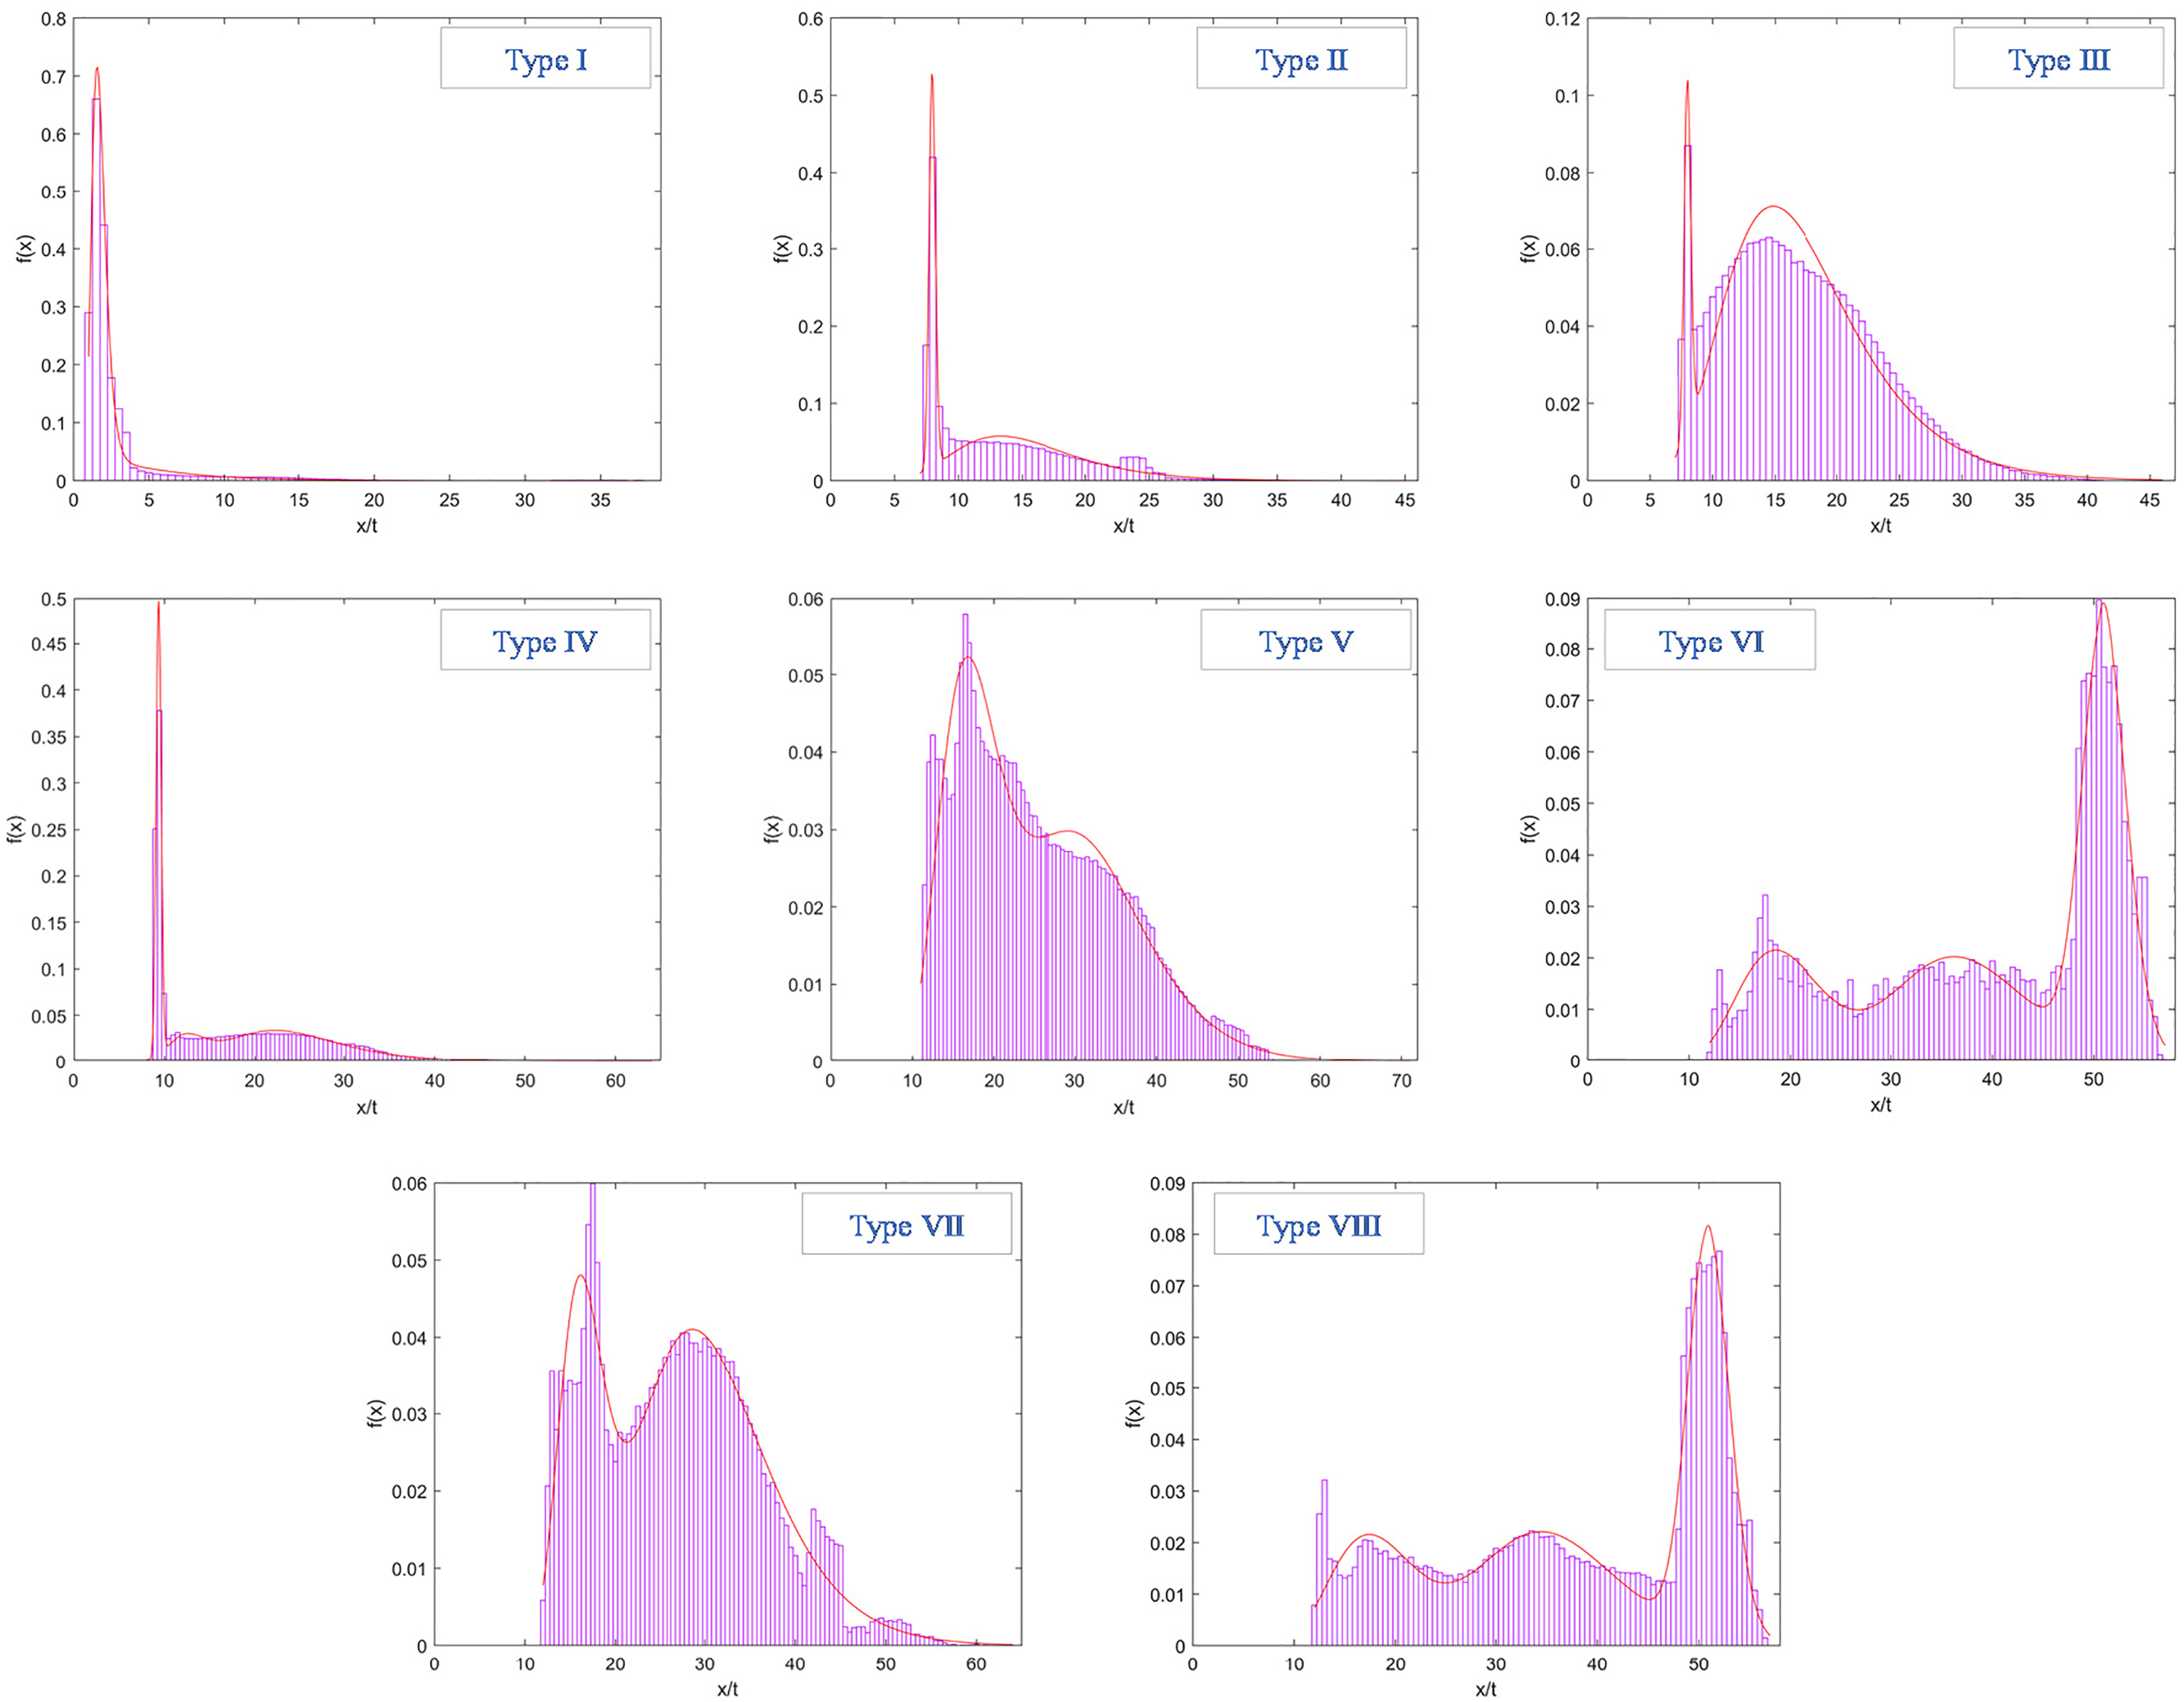
Figure 9: Distributions of vehicle weight
In addition to vehicle weights, the initial speed at which vehicles enter the bridge is also a critical parameter for load simulation. A Student’s t-distribution was used to fit the initial speed of each vehicle category, as it captures the heavier tails observed in real traffic data. The fitted speed distributions of two typical vehicle types are shown in Fig. 10.
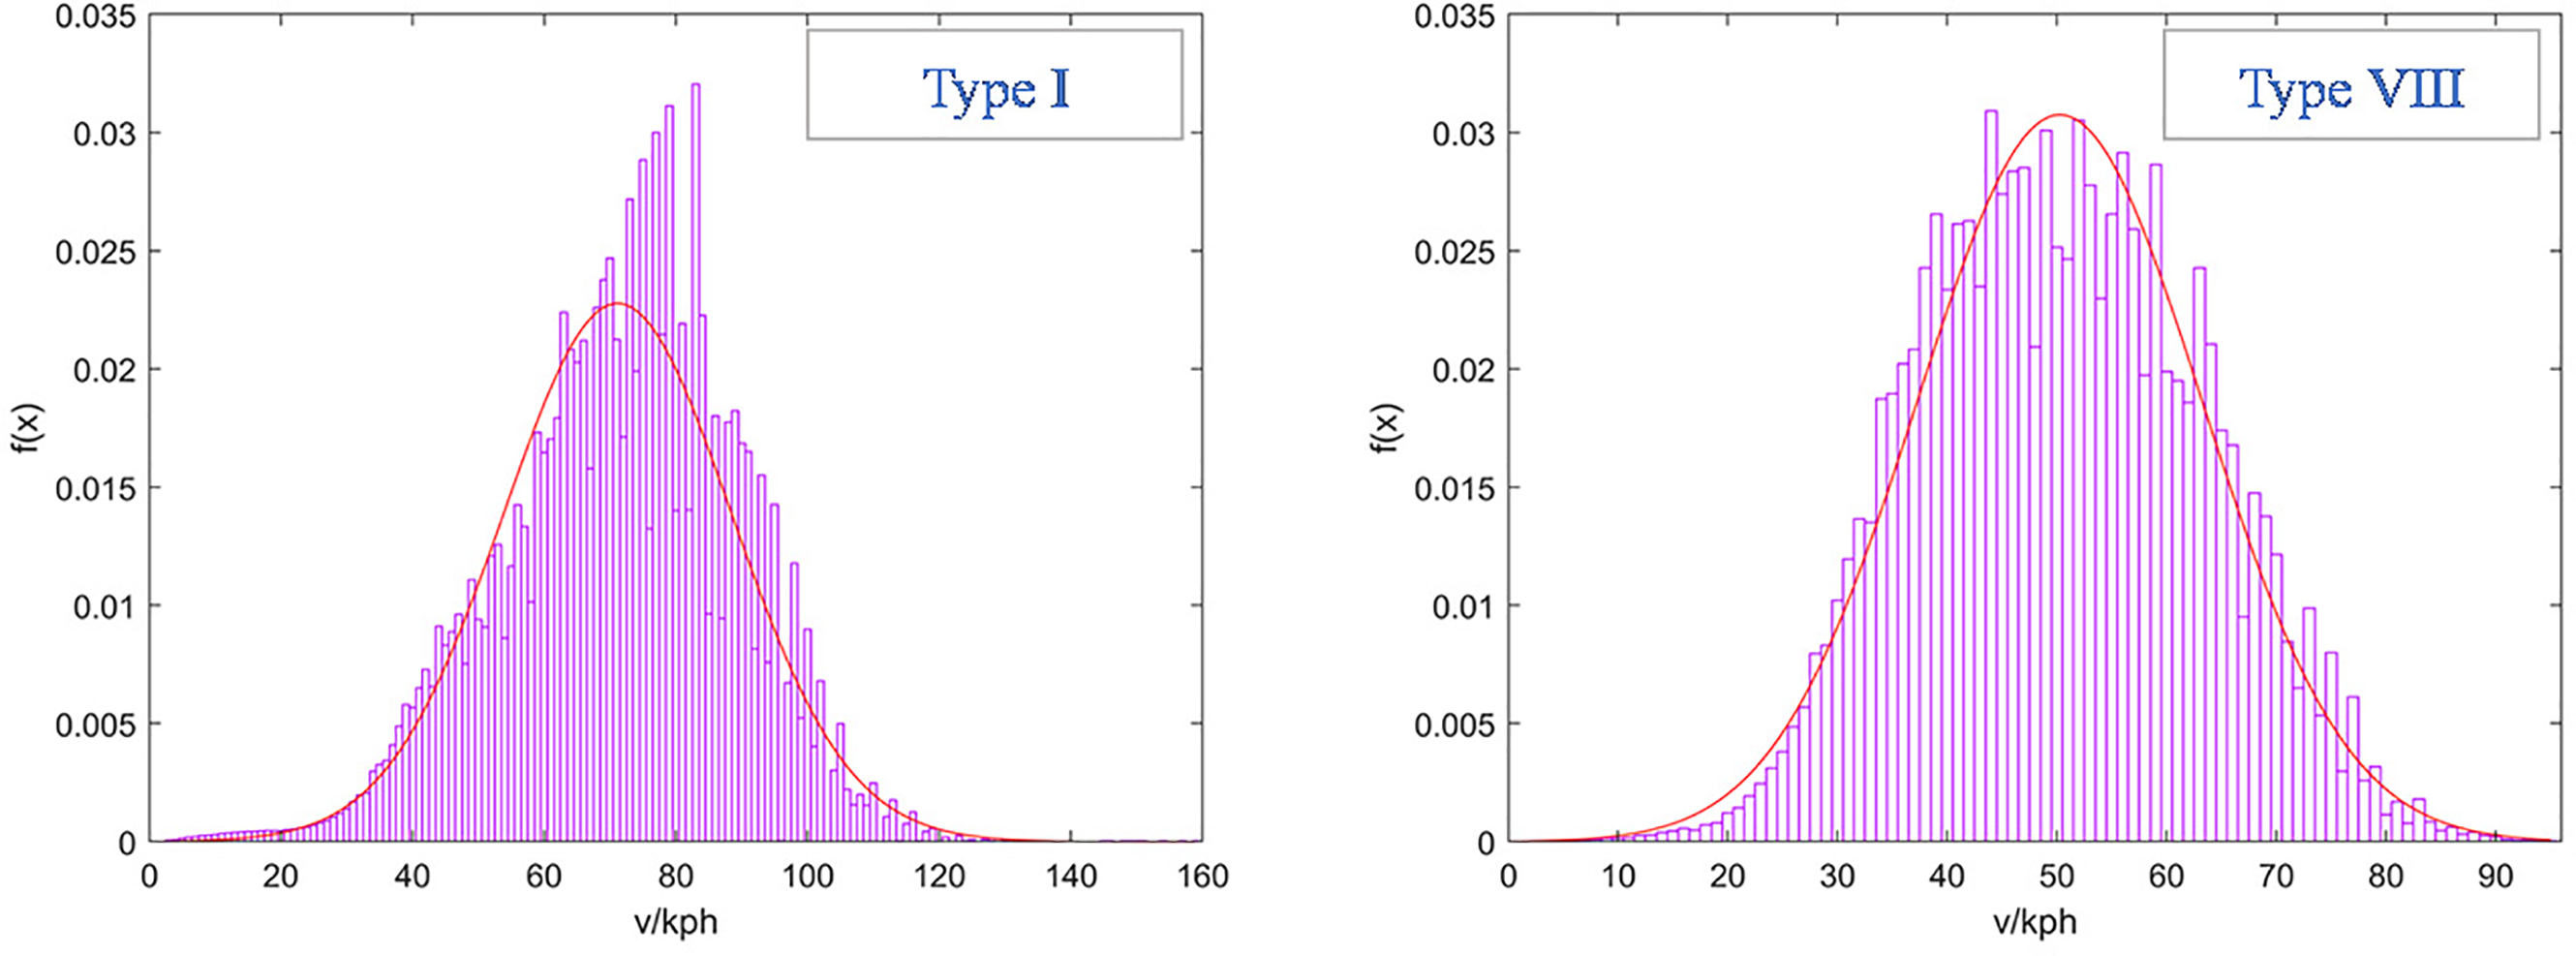
Figure 10: Distributions of initial speed
A time-dependent traffic growth model is introduced to account for the increase in traffic volume over time. The annual average daily traffic (AADT) shows a clear upward trend over the 20-year service period, as illustrated in Fig. 11. The data show an approximately linear or piecewise-linear growth, increasing from around 20,000 to nearly 100,000 vehicles per day. After year 20, the traffic volume remains stable at an average of approximately 100,000 vehicles per day, reflecting saturation in demand or infrastructure capacity limits. Accordingly, the number of stress cycles N(t) in year t before the 20th year is estimated by:
where ADC is the average daily number of stress cycles and α is the annual traffic growth rate.
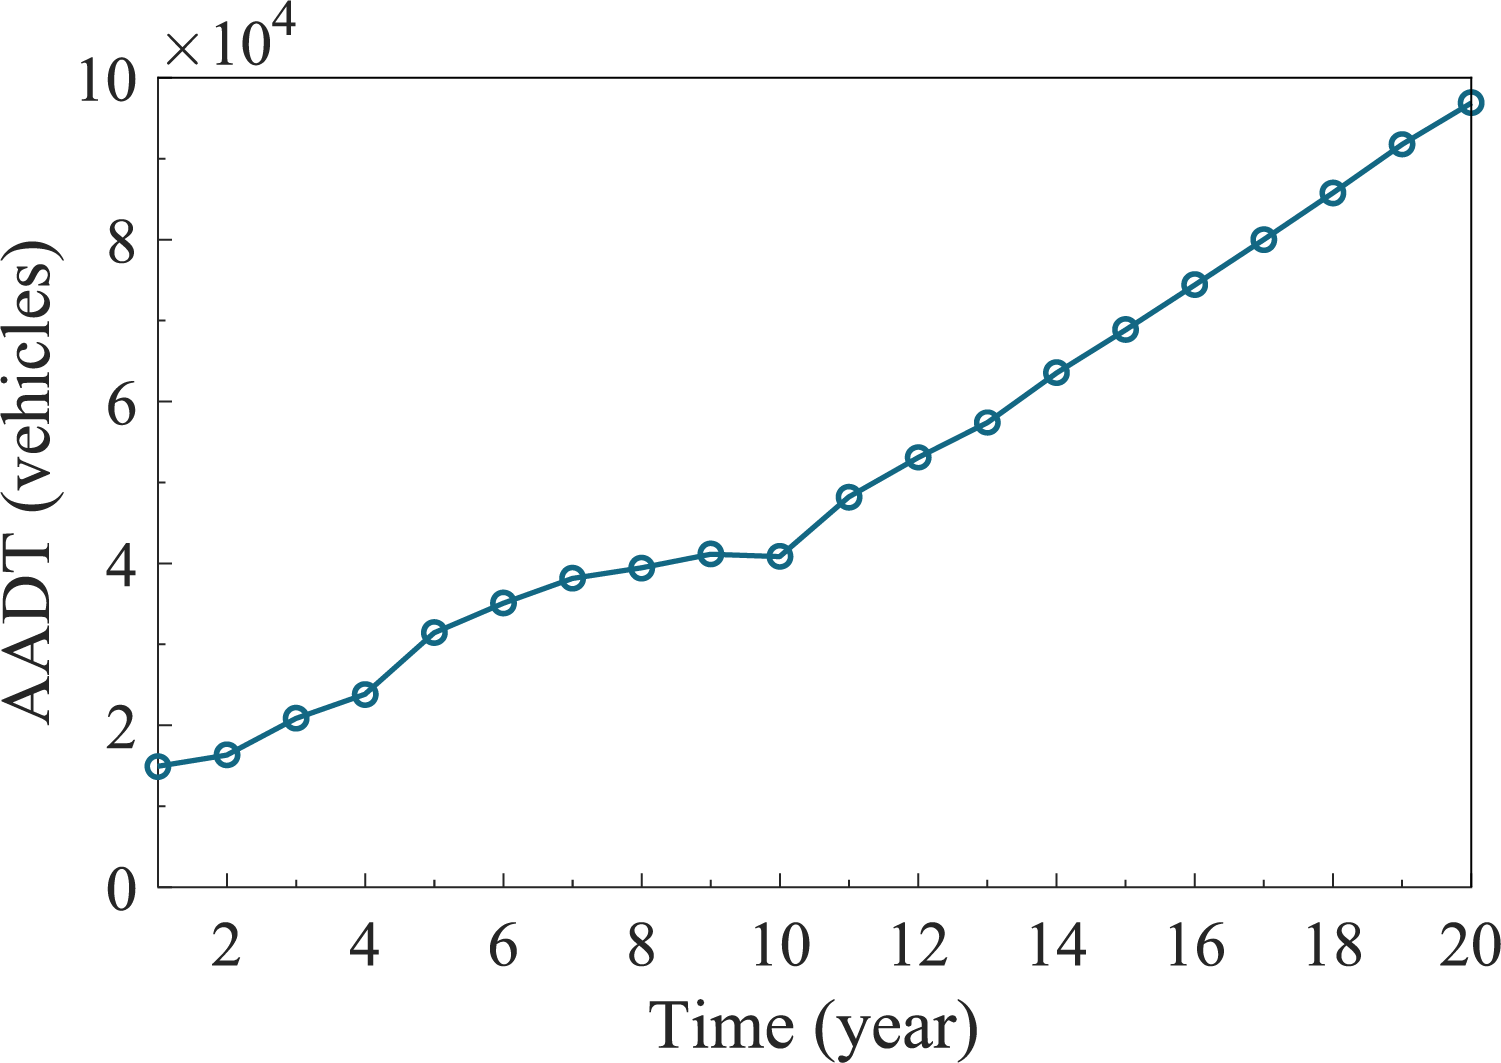
Figure 11: Traffic volume within 20 years
Vehicle lane distributions on the bridge also follow certain patterns due to traffic regulations and safe driving practices. The lane distribution of different vehicle types is shown in Fig. 12, where Lane 1, 2, and 3 represent the fast, middle, and slow lanes, respectively. The results show that passenger cars and light trucks are mainly distributed in the inner lanes (Lanes 1 and 2), while heavy trucks, especially those with large gross weights, are concentrated in the outer lane (Lane 3). This observed behavior is incorporated into the traffic load simulation to reflect realistic lane-wise load effects.
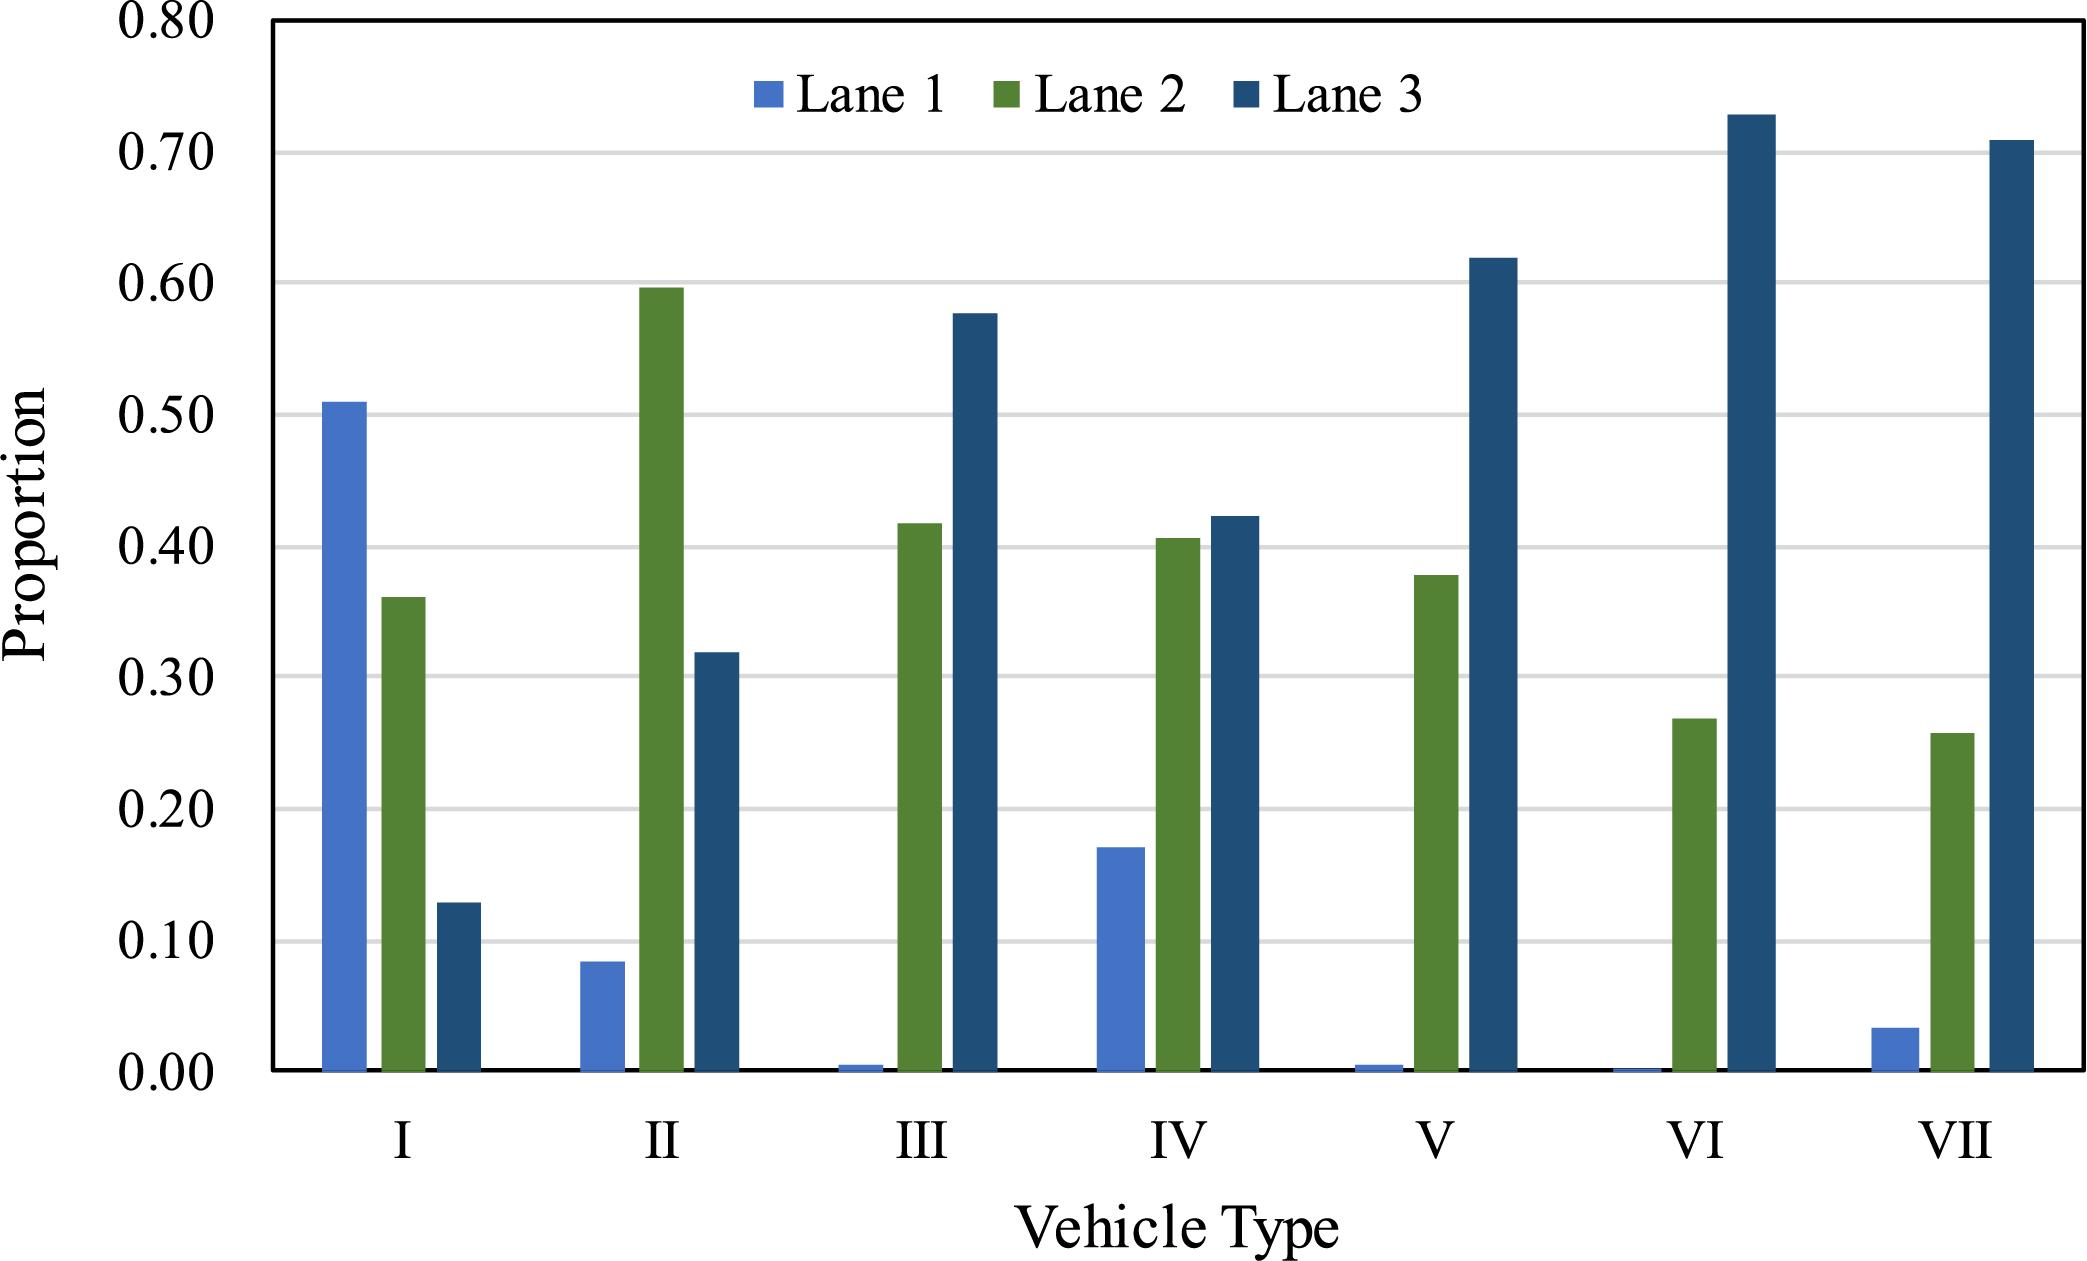
Figure 12: Lane distribution
3.2 Dynamic Load Effect Simulation
A three-dimensional finite element model (FEM) was developed based on the MIDAS/Civil platform. The model consists of 955 nodes and 943 elements. Beam elements were employed to model the main girder and towers, cable elements were used for the main cables, and tension-only truss elements were adopted to represent the hangers. Boundary conditions were modified and supplemented to better reflect the actual structural constraints, which affect the movement of the girder and hangers. The vertical bearings in the static model were replaced with hysteretic bearing systems, and viscous dampers were added at the beam ends to simulate the overall bridge damping behavior more accurately.
Based on the influence lines of girder nodes and the stochastic traffic load model, time-history load functions were generated for the corresponding nodes and applied to the bridge FEM to establish the dynamic model, as shown in Fig. 13. To validate the model, the simulated girder-end displacement was compared with the measured displacement responses induced by traffic loads, as shown in Fig. 14. The results reveal a strong correlation between simulated and observed displacements.
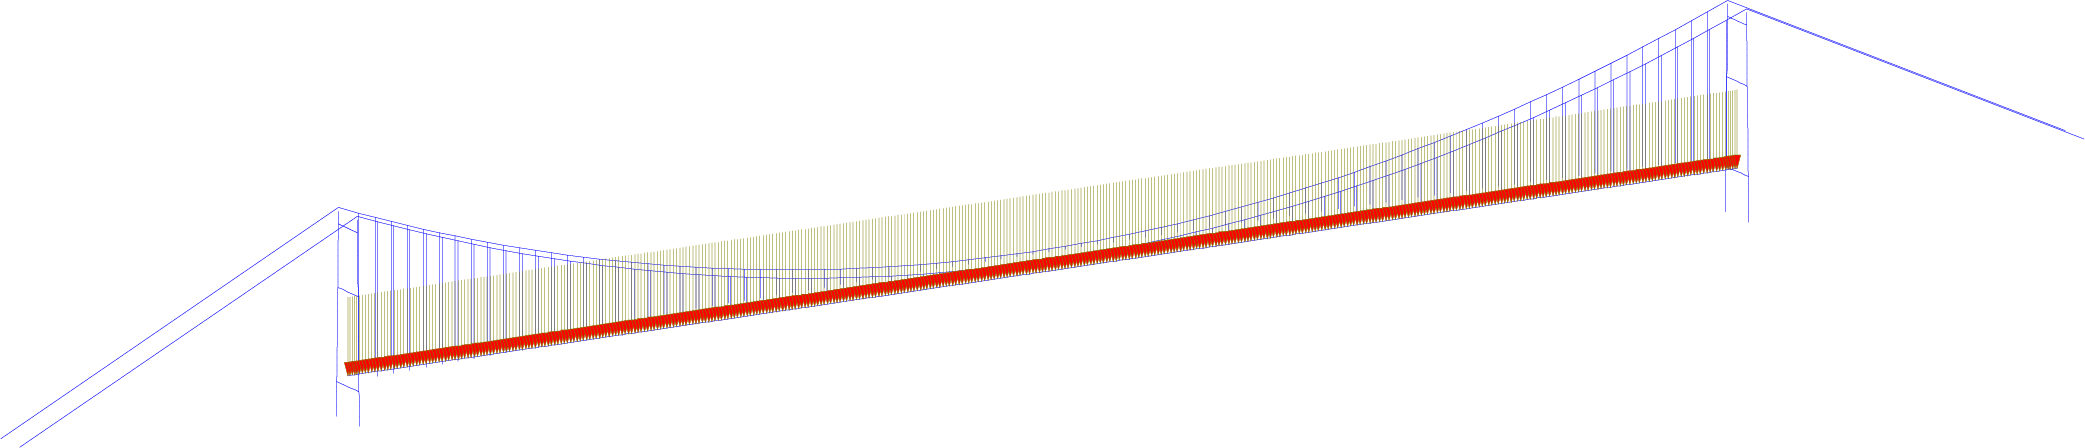
Figure 13: Dynamic FE model of the suspension bridge
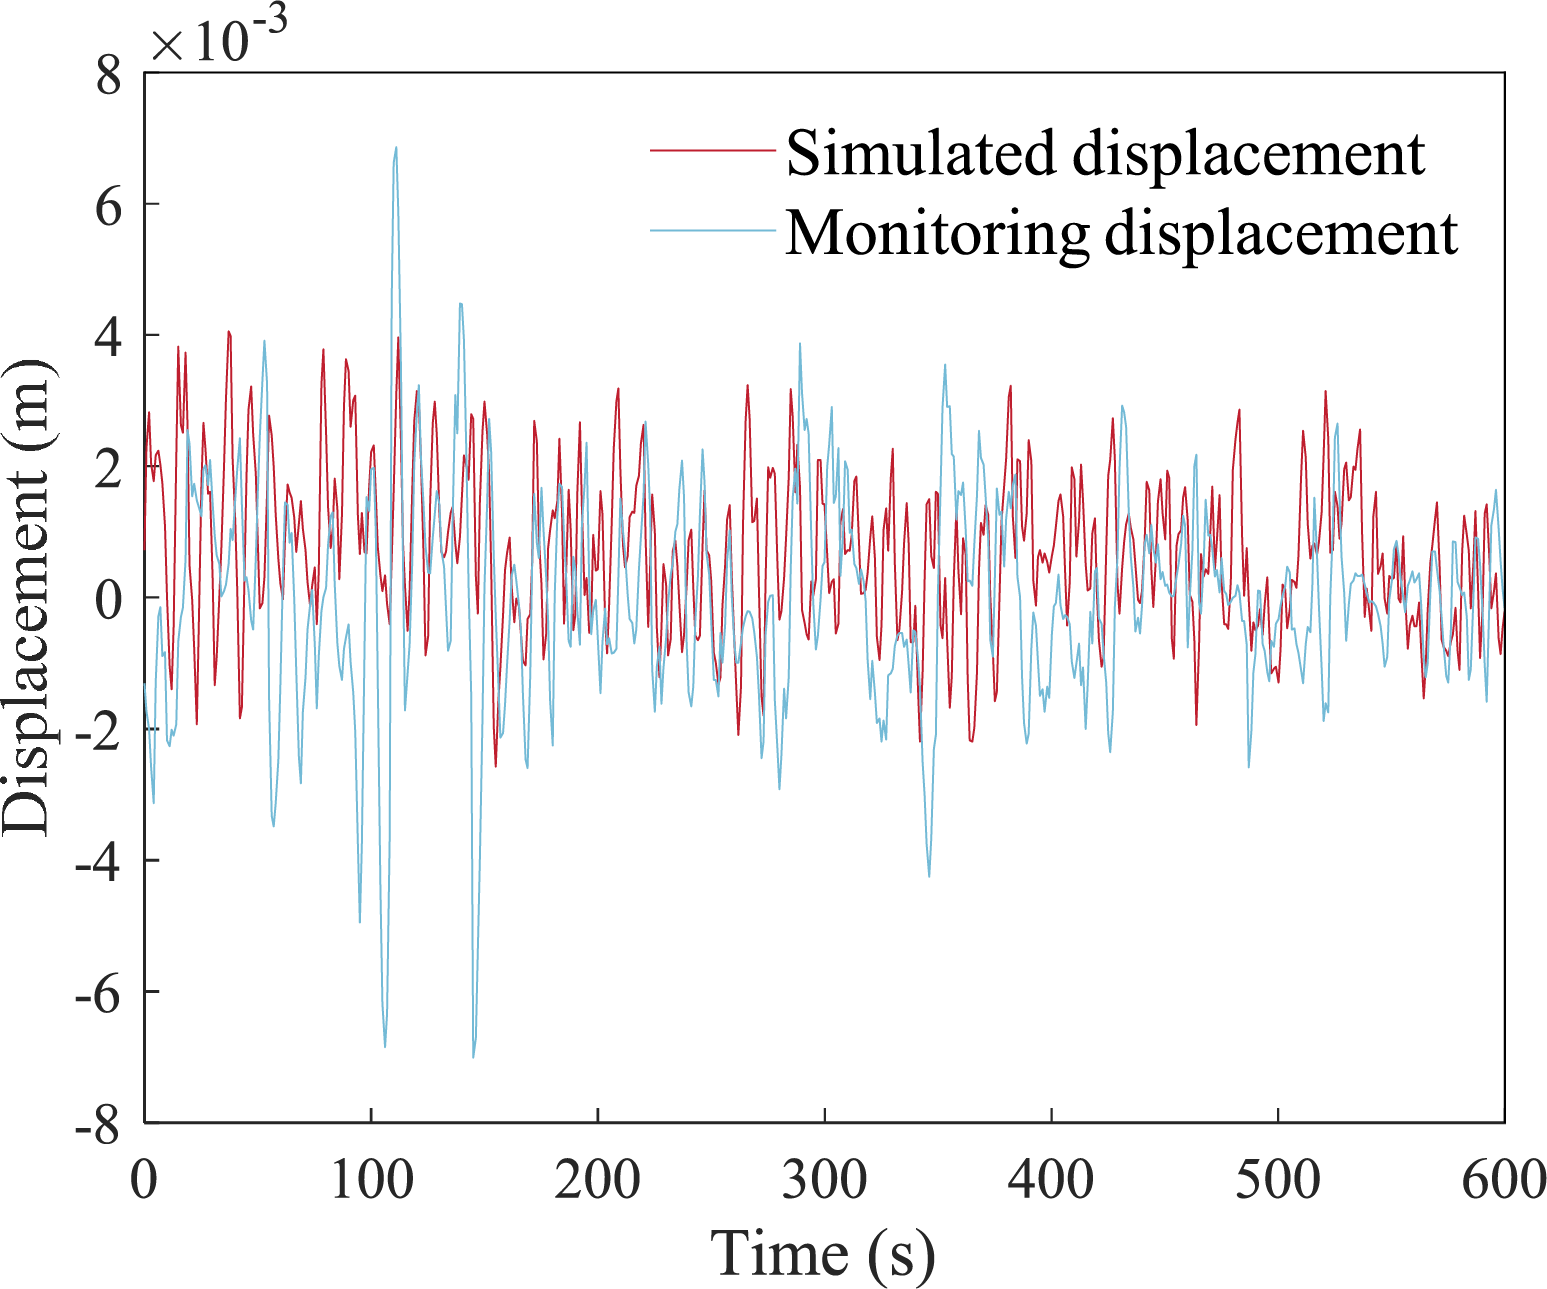
Figure 14: Comparison of traffic induced displacement and simulated displacement
The time-variant hanger forces during 3600 s with the AADT of 100,000 are then derived. The equivalent stress ranges of the 33 north span hangers are shown in Fig. 15. The stress range increases from the longest hanger toward the mid-length hangers, and then gradually decreases toward the short hangers. Besides hanger N19, which has documented replacement and inspection records, hangers N1 and N33 with the largest and smallest stress ranges, respectively, are also analysed for comparison.
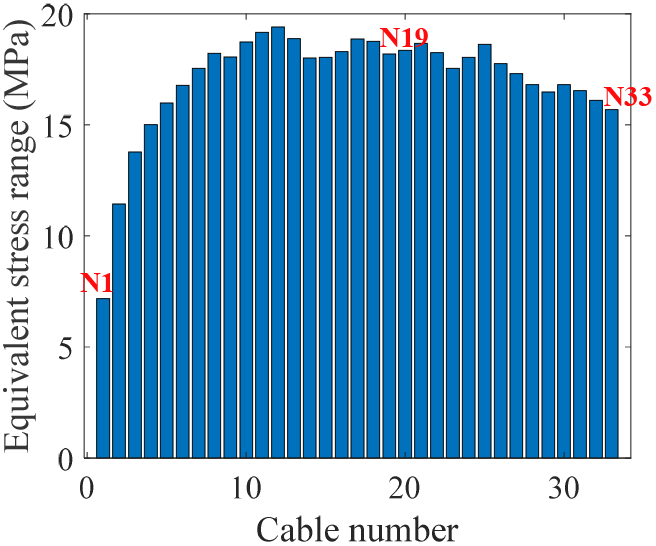
Figure 15: Hanger equivalent stress range distribution
The stress responses of these representative hangers are shown in Fig. 16. As seen in Fig. 16a, hanger N1 exhibits a higher mean stress with relatively small fluctuations, whereas N19 and N33 show lower mean stresses but greater dynamic variations. The stress spectra in Fig. 16b indicate that N1 is dominated by small stress ranges, while N19 and N33 present broader distributions, implying greater fatigue demand. For these two hangers, the stress-range distribution is mainly concentrated between 0 and 15 MPa.
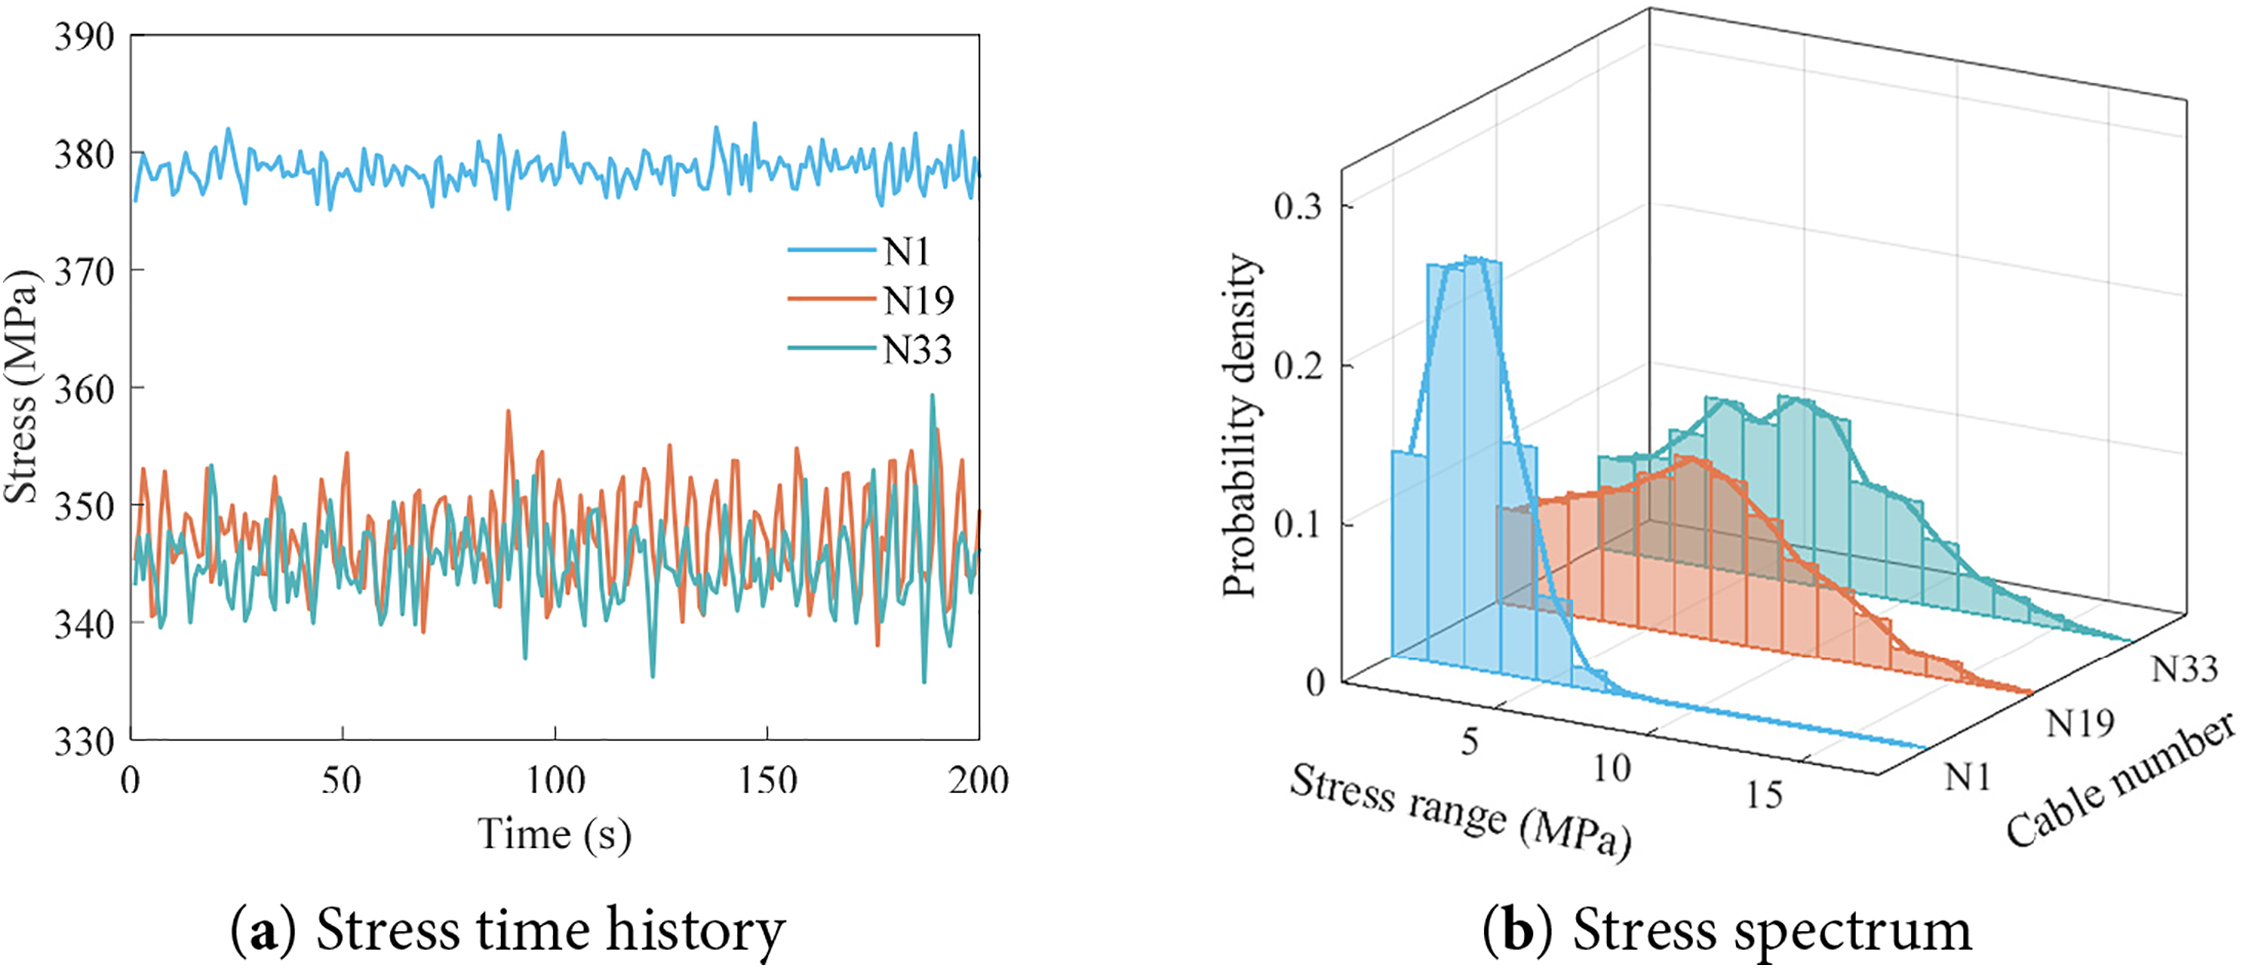
Figure 16: Vehicle-induced hanger force and stress range distribution
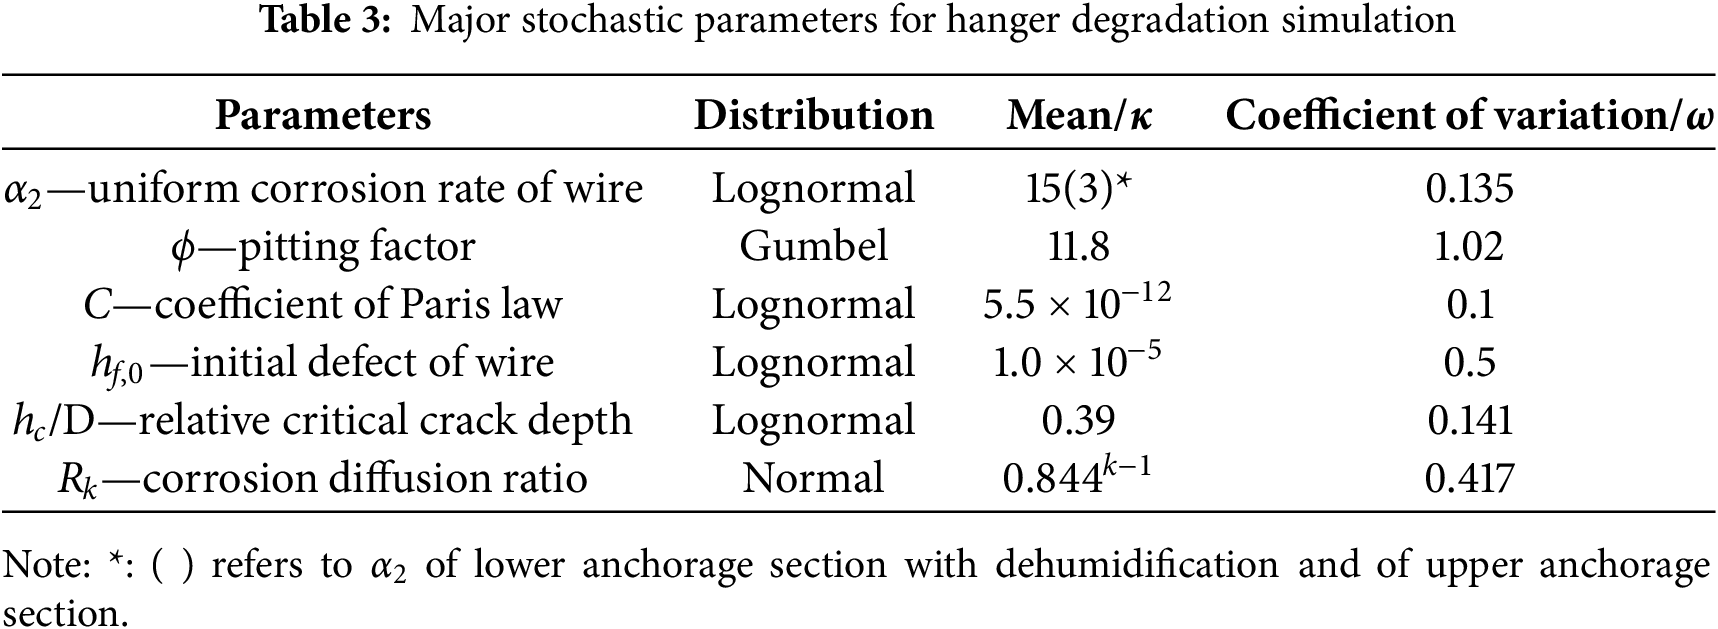
In this section, the service life and failure probability of the target hanger are anaylsed using the proposed framework, with key stochastic variables listed in Table 3. The sections near the lower and upper anchorages are both analysed considering different corrosion rates.
To reveal the coupling effect of corrosion and fatigue, a wire in the hanger is randomly chosen for crack depth demonstration, as shown in Fig. 17. In the first five years when the wires are protected from corrosion by the zinc coating, the pitting corrosion depth is zero. Meanwhile, due to the small number of stress cycles, the fatigue damage is marginal. After that, the corrosion depth increases gradually and is then surpassed by fatigue cracks, which means that the coupling crack is dominated first by corrosion and then by corrosion–fatigue.
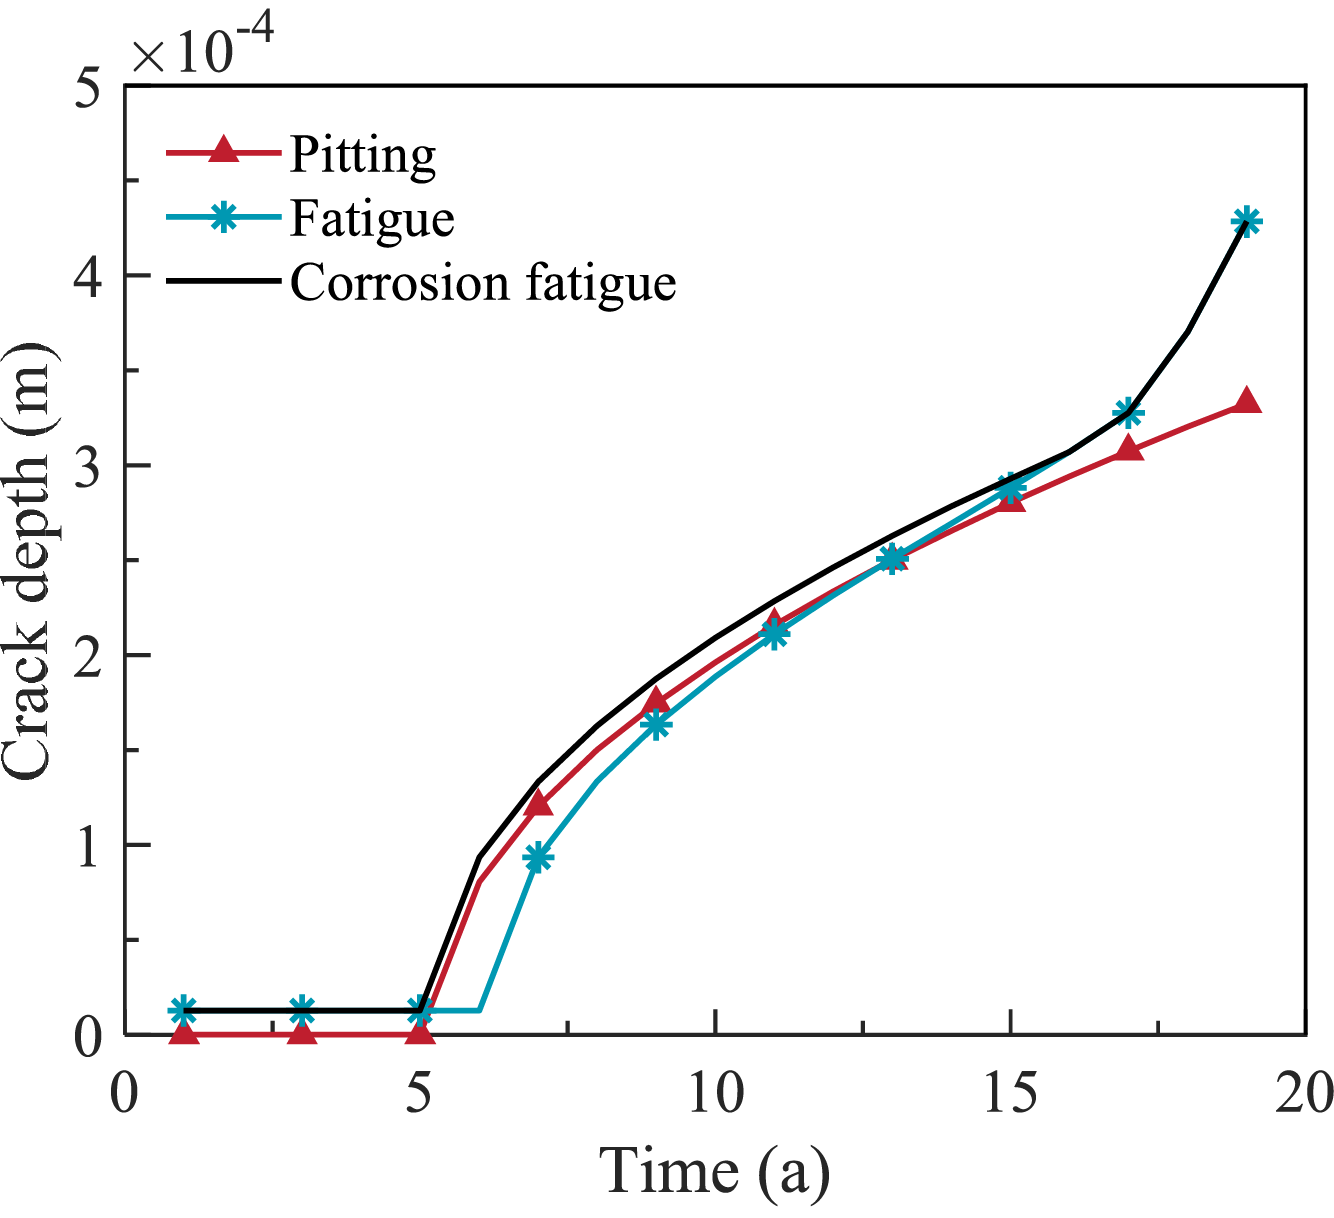
Figure 17: Crack propagation of a wire
The life distributions were obtained from the simulations of all samples, as shown in Fig. 18. Under the expected loading and environmental conditions, the hanger lifespans without maintenance actions approximately follow lognormal distributions. The mean life of the lower anchorage section is about 18 years, whereas the upper anchorage section shows a considerably longer mean life of about 44 years due to its lower wire corrosion rates. The failure probability (Pf) of the lower section increases sharply after around 15 years, reaching close to 1 within a short period, while the upper section shows a much slower increase, with a significant rise after 30 years. These results indicate that the fatigue resistance of the upper anchorage zone is substantially higher than that of the lower zone because of different corrosion environment. The predicted failure time of the lower section agrees well with the actual hanger replacement time, validating the accuracy and effectiveness of the proposed evaluation approach.
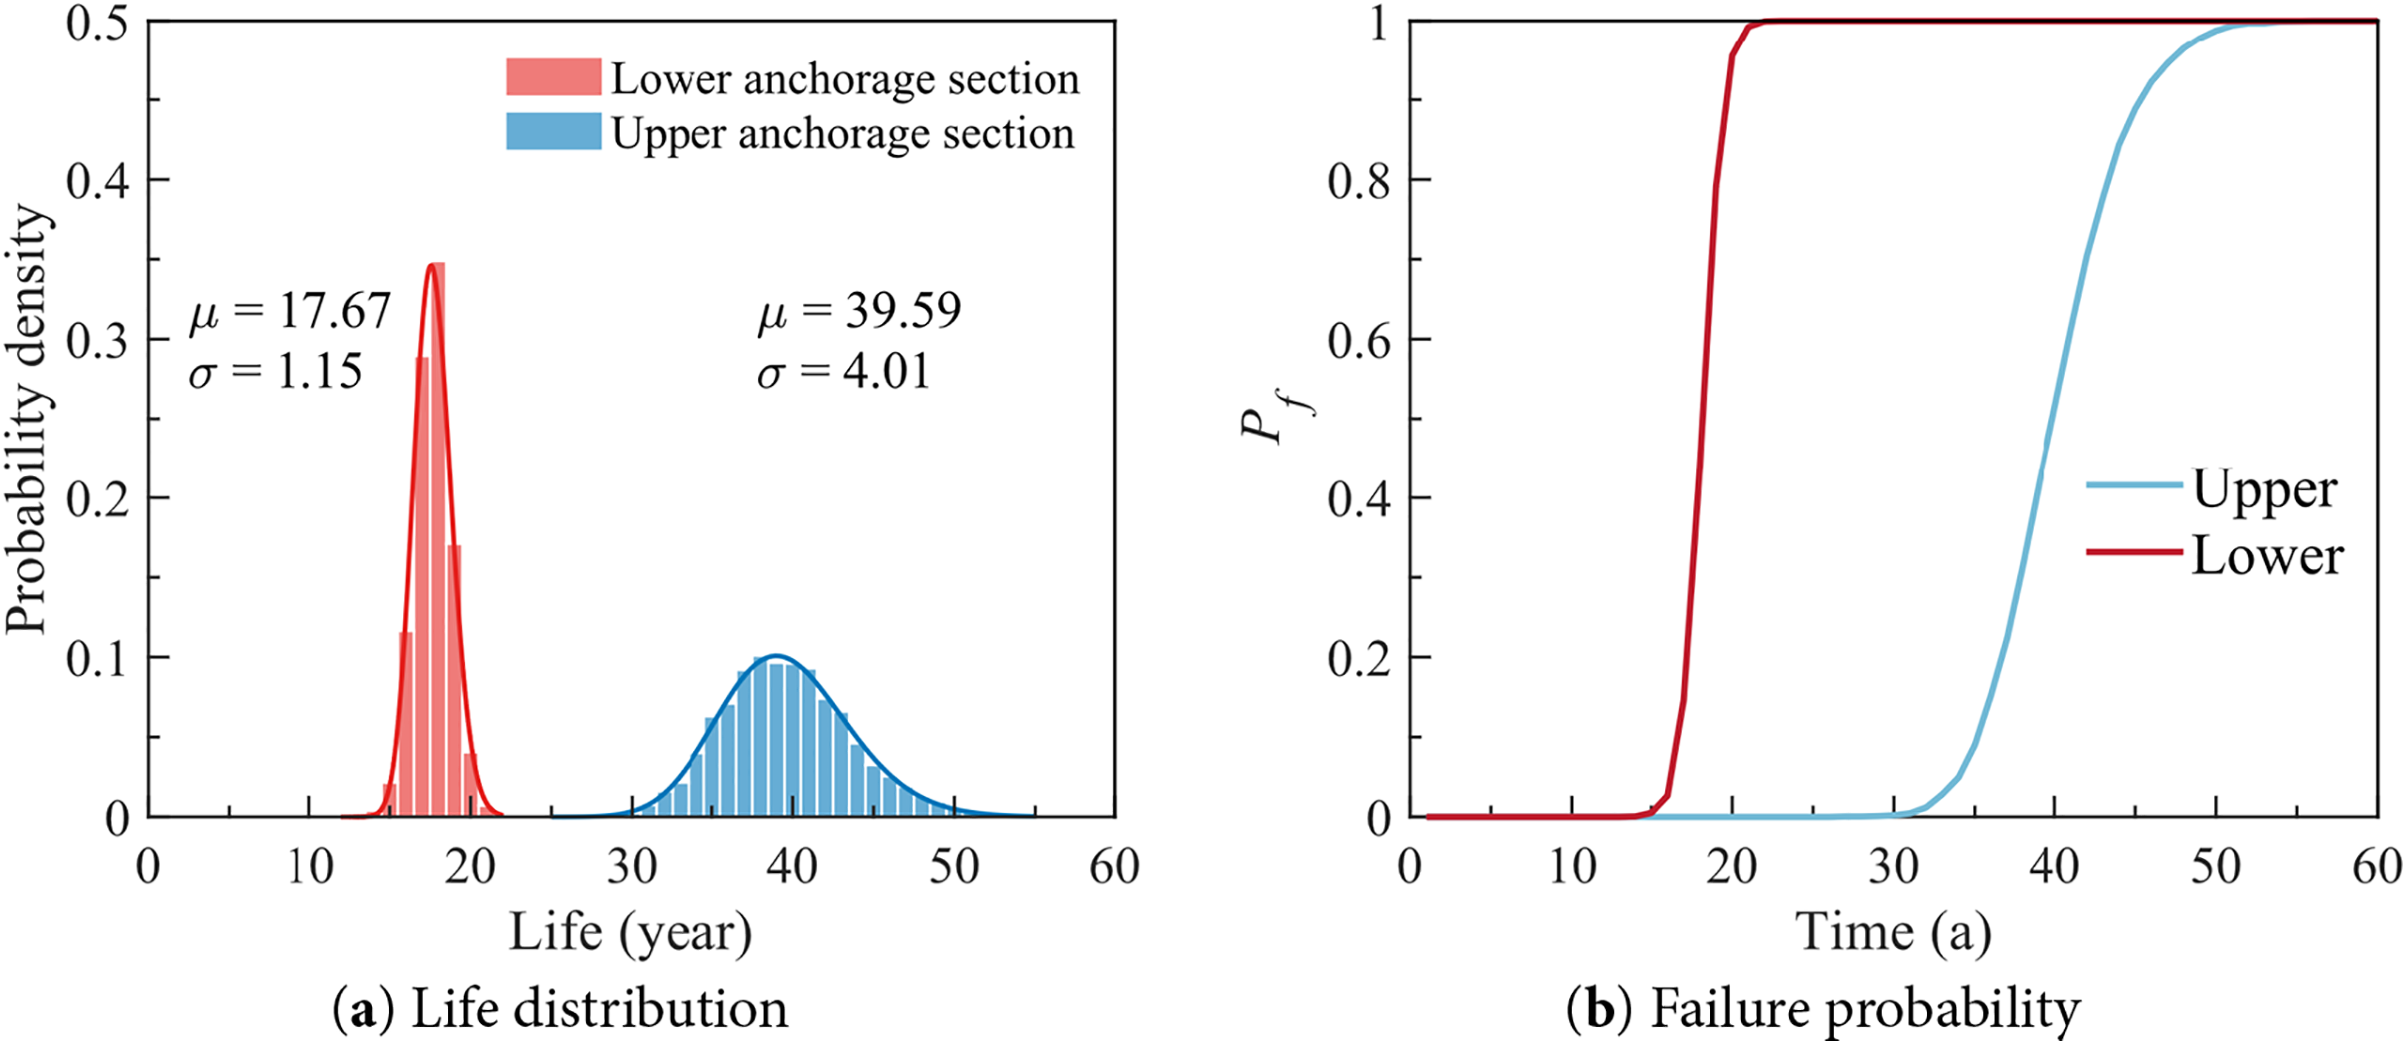
Figure 18: Lifespan and failure probability of the hanger without maintenance
Cable dehumidification can significantly extend the service life of hangers, particularly for lower anchorages, which are more exposed to high humidity and corrosion. In this study, two dehumidification scenarios were analysed: one with dehumidification initiated from the first year of service, and the other starting from the tenth year. As shown in Fig. 19a, a longer duration of dehumidification leads to a greater mean lifespan and higher variability in fatigue life. When dehumidification begins in the first year, the mean hanger life increases to approximately 68 years. However, when the process starts in the tenth year, the improvement is marginal, extending the mean life by only about four years.
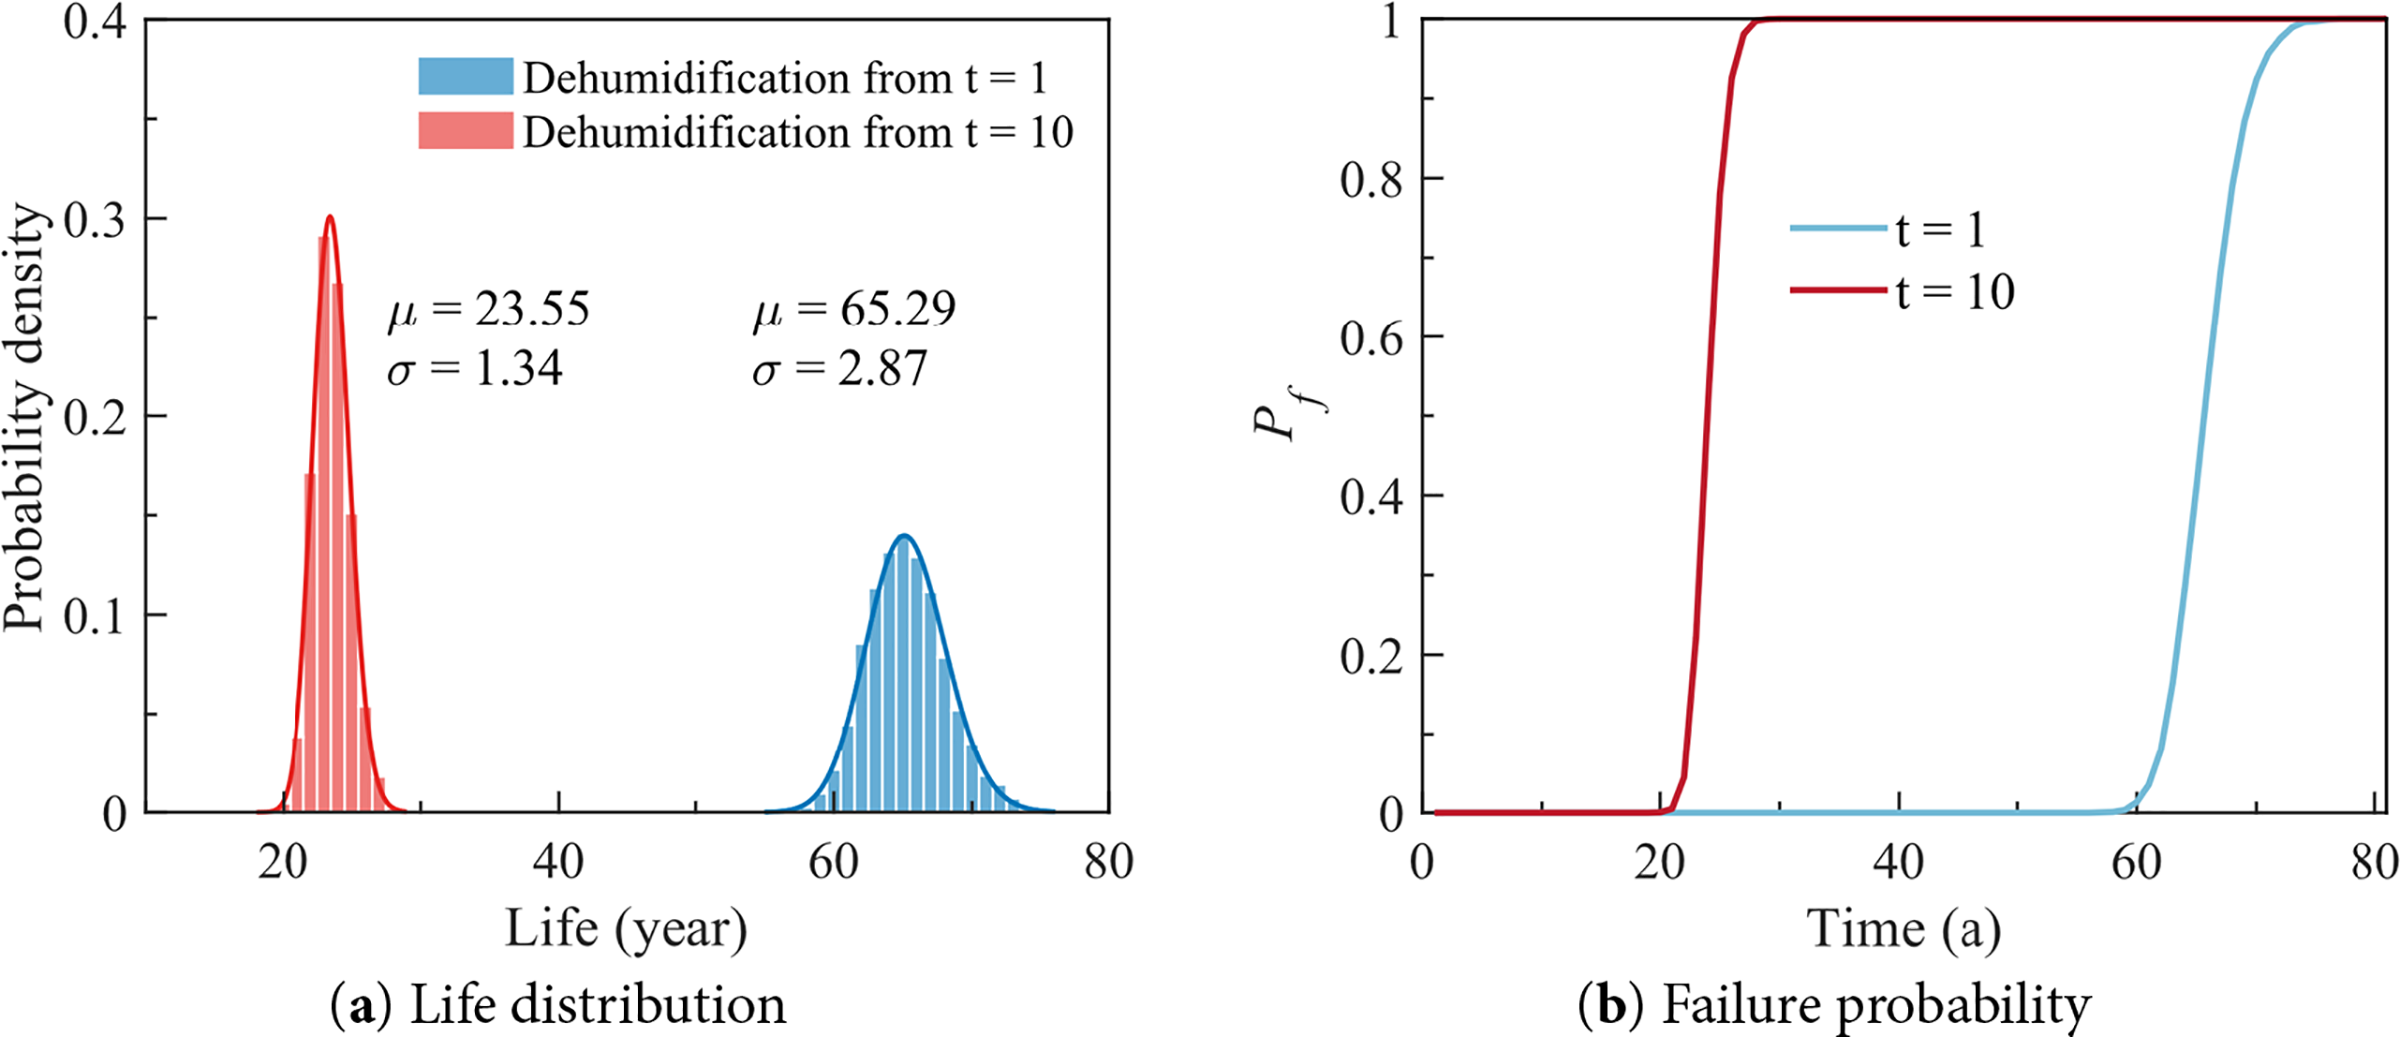
Figure 19: Lifespan and failure probability of the hanger considering anchorage dehumidification
This contrast is further reflected in the failure probability curves in Fig. 19b. Early dehumidification effectively delays fatigue failure, whereas delayed dehumidification leads to a significant rise in the risk of failure exceeding 50% after around 22 years. These findings highlight the importance of implementing dehumidification measures early in the service life to ensure long-term hanger durability and reliability.
Fig. 20 presents the probabilistic lifespan distributions of representative hangers with different lengths under normal atmospheric conditions and dehumidification. Under normal conditions, the deterioration of hangers is dominated by corrosion, and clear positional differences can be observed. The short hanger N1 located in the side span exhibits the shortest mean life due to its complex loading state, including bending and local tribological effects, which accelerate wire corrosion. The mid-length hanger N19 near the quarter span shows a slightly longer life, as it experiences moderate stress fluctuations but remains strongly affected by corrosion. In contrast, the long hanger N33 near the midspan demonstrates a substantially longer lifespan because of its lower stress ranges and more uniform force transfer, resulting in slower corrosion progression.
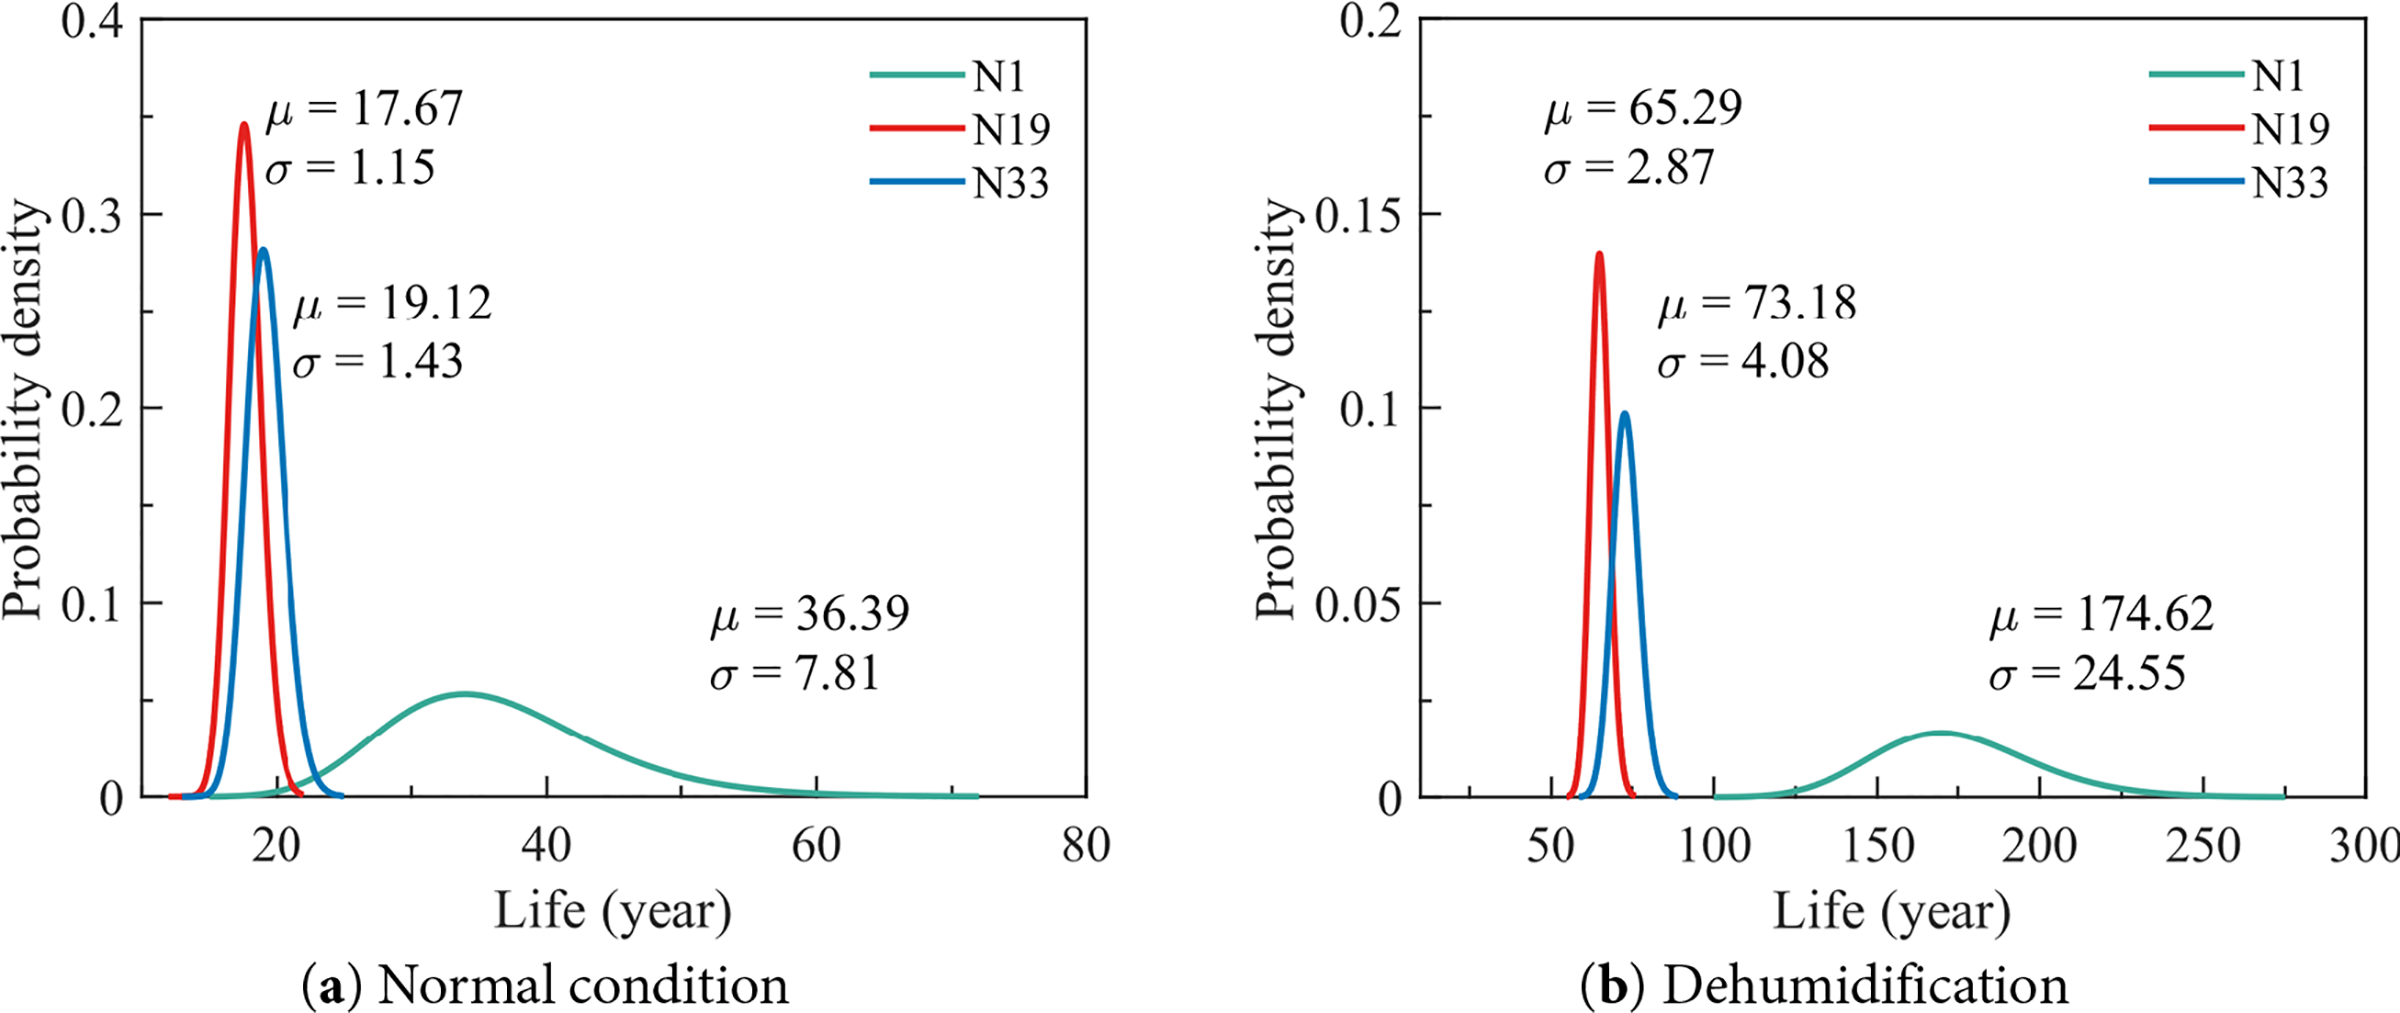
Figure 20: Lifespan of hangers with different length
When dehumidification is applied, the lifespan of all hangers is significantly extended, though to different extents. The mean life of the short and mid-length hangers (N1 and N19) increases markedly due to the effective suppression of corrosion, which previously governed their deterioration. For the long hanger N33, the expected lifespan is extended by more than four times, as the reduced humidity greatly limits corrosion while its inherently low stress range produces only minor fatigue damage. Consequently, the deterioration of long hangers becomes predominantly stress-controlled rather than corrosion controlled. These results highlight that hanger durability is jointly governed by corrosion severity and stress-range characteristics, and that dehumidification is particularly effective for long hangers located near the midspan.
Since maintenance measures such as cable anchorage dehumidification can effectively extend the service life of hangers, it is necessary to evaluate the lifecycle cost associated with different maintenance strategies. The annual average costs considering annual inspections, failure-induced traffic disruption, hanger replacement, and various maintenance durations are illustrated in Fig. 21.
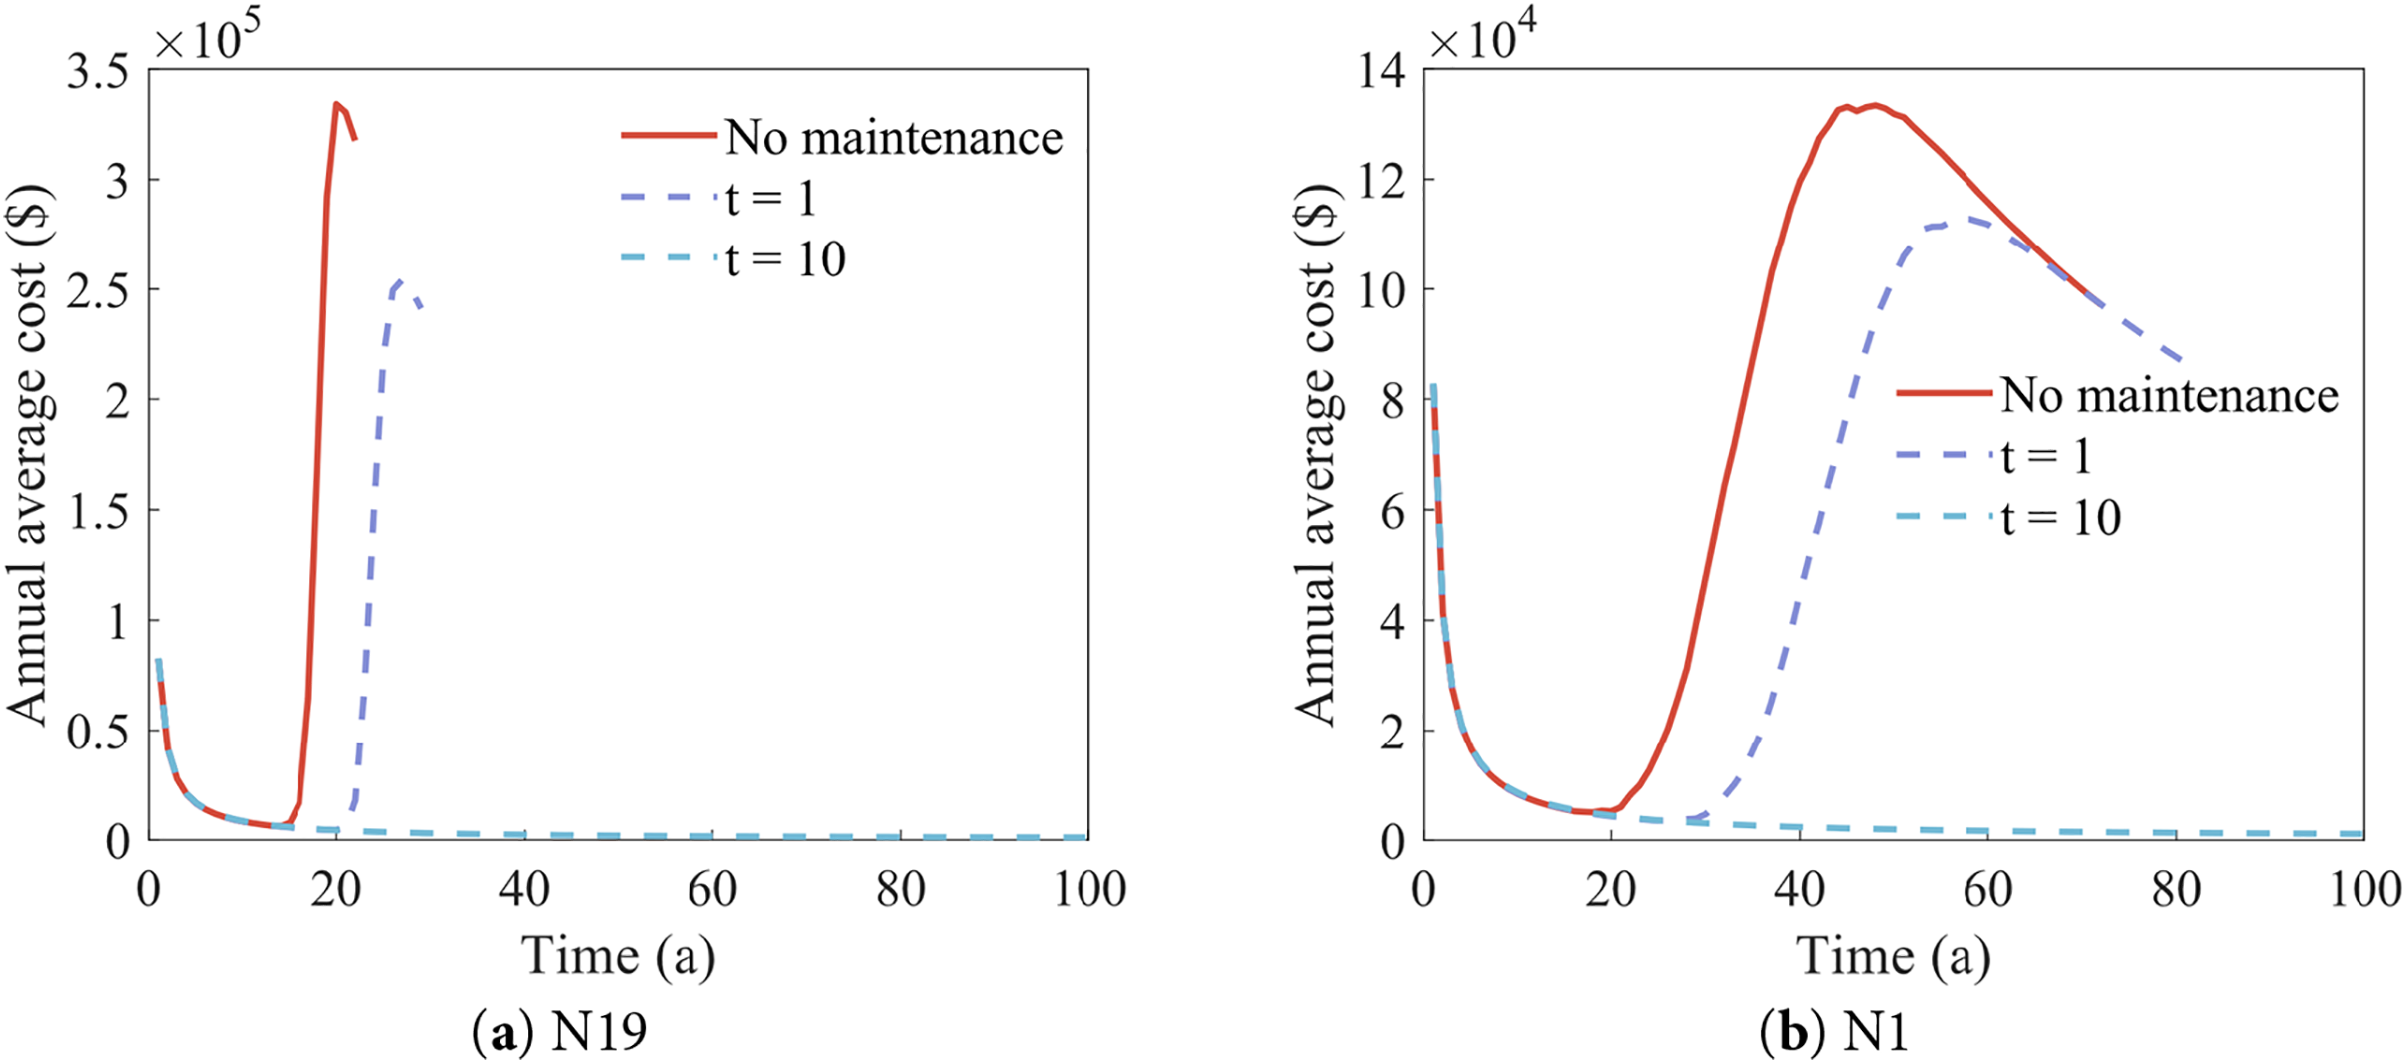
Figure 21: Lifetime annual average cost with different maintenance strategies
For the mid-length hanger N19, if no maintenance is performed during operation, the annual average cost remains low initially but rises sharply to over 30,000 USD once unexpected failure occurs at around 20 years. When insufficient maintenance is initiated several years after operation (dehumidification starting from the 10th year), the minimum annual average cost decreases, yet failure still triggers a rapid increase to approximately 25,000 USD at around 30 years. In contrast, long-term maintenance (dehumidification starting from the first year) reduces the annual cost to below 1150 USD for nearly the entire bridge service life, as failures are effectively prevented.
For the longest hanger N1 located in the side span, a similar trend is observed, although the overall cost level is much lower due to its longer inherent service life. Without maintenance, the annual average cost increases to more than 13,000 USD after about 40 years, corresponding to emergency replacement after unexpected failure. When maintenance begins in the 10th year, the cost peak is delayed to roughly 55 years, reaching around 11,000 USD. Long-term maintenance starting from the first year provides the best performance, maintaining a very low annual average cost throughout the 100-year period and preventing failure completely. These results show that timely and consistent maintenance can significantly reduce lifecycle costs and enhance hanger durability, which is particularly important for shorter hangers that deteriorate more quickly.
This study proposes a time-variant probabilistic method for evaluating hanger service life and cost, considering the coupled effects of corrosion and fatigue. By extracting key vehicle parameters from WIM data and bridge FEM, the study simulates the time-variant force of the target hanger of the case suspension bridge. Based on fracture mechanics and competition model, degradation models for the steel wires are established. The economic benefits of inspection, maintenance, and replacement are quantified concerning their implementing time.
The results indicate that the combined effects of corrosion and fatigue significantly impact the degradation of the hanger. However, maintenance measures, especially the cable dehumidification, play a crucial role in extending its service life. Long-term maintenance measures can significantly extend the life of the hanger and reduce the average annual cost, providing quantitative support for developing effective bridge maintenance strategies. Future work will focus on three directions: (1) clarifying the damage mechanisms of short suspenders by considering bending and tribological effects, (2) investigating the fatigue responses of hangers considering random wind loading and vehicle-bridge interaction using field monitoring and simulation data, (3) further incorporating the time-dependent effectiveness of maintenance measures to improve the damage model.
Acknowledgement: Not applicable.
Funding Statement: This research was supported by the Academician Project Foundation of CCCC (YSZX-01-2022-01-B, YSZX-03-2025-02-B).
Author Contributions: The authors confirm contribution to the paper as follows: study conception and design: Chao Guo and Yuan Ren; data collection: Chao Guo, Chao Deng, and Ziyuan Fan; analysis and interpretation of results: Chao Guo, Chao Deng, Xing Bai and Jintao Li; draft manuscript preparation: Chao Guo and Chao Deng; writing—review and editing: Chao Deng, Yuan Ren and Jintao Li. All authors reviewed the results and approved the final version of the manuscript.
Availability of Data and Materials: The data supporting the results reported in the paper can be accessed from the first author or the corresponding author.
Ethics Approval: Not applicable.
Conflicts of Interest: The authors declared no potential conflicts of interest with respect to the research, authorship, and/or publication of this article.
References
1. Yan B, Huang J. Recent developments of long-span highway bridges in China. In: Advances in environmental vibration and transportation geodynamics. Singapore: Springer; 2020. p. 969–86. doi:10.1007/978-981-15-2349-6_66. [Google Scholar] [CrossRef]
2. Zhang B, Badar J, Chen W, Xu J, Pan Y, Cai S. Failure analysis of the suspender fracture in a railway self-anchored suspension bridge: damage identification, fatigue mechanism and remaining life prediction. Eng Struct. 2024;311(2):118160. doi:10.1016/j.engstruct.2024.118160. [Google Scholar] [CrossRef]
3. Fan Z, Ye Q, Xu X, Ren Y, Huang Q, Li W. Fatigue reliability-based replacement strategy for bridge stay cables: a case study in China. Structures. 2022;39(3):1176–88. doi:10.1016/j.istruc.2022.03.093. [Google Scholar] [CrossRef]
4. Heng J, Dong Y, Lai L, Zhou Z, Frangopol DM. Digital twins-boosted intelligent maintenance of ageing bridge hangers exposed to coupled corrosion-fatigue deterioration. Autom Constr. 2024;167(2):105697. doi:10.1016/j.autcon.2024.105697. [Google Scholar] [CrossRef]
5. Xue S, Shen R. Research on fatigue failure and structural measures of suspenders in the Jinsha River railway suspension bridge. Eng Fail Anal. 2024;162:108359. doi:10.1016/j.engfailanal.2024.108359. [Google Scholar] [CrossRef]
6. Jie Z, Zhang Z, Susmel L, Zhang L, Lu W. Corrosion fatigue mechanisms and evaluation methods of high-strength steel wires: a state-of-the-art review. Fatigue Fract Eng Mat Struct. 2024;47(7):2287–318. doi:10.1111/ffe.14311. [Google Scholar] [CrossRef]
7. Yu S, Yan C, Liu C, Ou J. Fatigue life evaluation of parallel steel-wire cables under the combined actions of corrosion and traffic load. Struct Control Health Monit. 2023;2023(5):5806751. doi:10.1155/2023/5806751. [Google Scholar] [CrossRef]
8. Lan C, Xu Y, Liu C, Li H, Spencer BF. Fatigue life prediction for parallel-wire stay cables considering corrosion effects. Int J Fatigue. 2018;114(2):81–91. doi:10.1016/j.ijfatigue.2018.05.020. [Google Scholar] [CrossRef]
9. Xue S, Su T, Shen R, Zong Z, Zhao X. Analysis of corrosion fatigue coupling effect of high-strength steel wire based on multi-stage competition assisting theory. Eng Fract Mech. 2024;298:109958. doi:10.1016/j.engfracmech.2024.109958. [Google Scholar] [CrossRef]
10. Li H, Yan H, Wang X, Li L. Corrosion fatigue evaluation of suspender cables in railway bridges considering the effect of train-induced flexural vibration. J Bridge Eng. 2024;29(12):04024089. doi:10.1061/jbenf2.beeng-6952. [Google Scholar] [CrossRef]
11. Fan C, Li Z, Wang Y. A multi-scale corrosion fatigue damage model of high-strength bridge wires. Int J Damage Mech. 2020;29(6):887–901. doi:10.1177/1056789519890064. [Google Scholar] [CrossRef]
12. Liu X, Han W, Guo X, Yuan Y, Chen S. Fatigue lifespan assessment of stay cables by a refined joint probability density model of wind speed and direction. Eng Struct. 2022;252(5):113608. doi:10.1016/j.engstruct.2021.113608. [Google Scholar] [CrossRef]
13. Guo J, Zhang X. Coupled effect of corrosion and fatigue on the service life of steel cables. Eng Fract Mech. 2025;314(1):110698. doi:10.1016/j.engfracmech.2024.110698. [Google Scholar] [CrossRef]
14. Yuan Z, Wang H, Li R, Invernizzi S, Mao J. Enhanced corrosion fatigue analytical framework for suspenders: integrating bending effect and fracture process of wire bundle. Eng Fail Anal. 2025;181(1):109939. doi:10.1016/j.engfailanal.2025.109939. [Google Scholar] [CrossRef]
15. Jiang C, Wu C, Cai CS, Jiang X, Xiong W. Corrosion fatigue analysis of stay cables under combined loads of random traffic and wind. Eng Struct. 2020;206(9):110153. doi:10.1016/j.engstruct.2019.110153. [Google Scholar] [CrossRef]
16. Wang D, Zhao Y, Guo X, Yuan Y, Li X. Reliability assessment of parallel wire suspender components considering interlayer corrosion variance. Structures. 2023;47(5):81–92. doi:10.1016/j.istruc.2022.11.050. [Google Scholar] [CrossRef]
17. Deng C, Ren Y, Xu X, Fan Z, Huang Q. Real cable force based time-varying degradation and maintenance strategy analysis of stay cables. Eng Struct. 2025;328(9):119730. doi:10.1016/j.engstruct.2025.119730. [Google Scholar] [CrossRef]
18. Deeble Sloane MJ, Betti R, Marconi G, Hong AL, Khazem D. Experimental analysis of a nondestructive corrosion monitoring system for main cables of suspension bridges. J Bridge Eng. 2013;18(7):653–62. doi:10.1061/(asce)be.1943-5592.0000399. [Google Scholar] [CrossRef]
19. Chen W, Shen R, Que M, Gong M, Miao R. New dehumidification system design and dehumidification test for the main cable of suspension bridge. J Civ Struct Health Monit. 2021;11(5):1321–35. doi:10.1007/s13349-021-00513-9. [Google Scholar] [CrossRef]
20. Guo Z, Sui W, Guan H, Peng P, Liu Q, Shi J. Parameter selection for the dehumidification system of the main cable of suspension bridge based on ventilation experiments. Buildings. 2023;13(6):1386. doi:10.3390/buildings13061386. [Google Scholar] [CrossRef]
21. Fan Z, Xu X, Ren Y, Chang W, Deng C, Huang Q. Fatigue reliability analysis for suspenders of a long-span suspension bridge considering random traffic load and corrosion. Structures. 2023;56(3):104981. doi:10.1016/j.istruc.2023.104981. [Google Scholar] [CrossRef]
22. Li S, Xu Y, Li H, Guan X. Uniform and pitting corrosion modeling for high-strength bridge wires. J Bridge Eng. 2014;19(7):04014025. doi:10.1061/(asce)be.1943-5592.0000598. [Google Scholar] [CrossRef]
23. Liu Z, Guo T, Ren H, Correia J, Liu J, Feng MQ. Corrosion-fretting fatigue analysis of bridge cables based on multifactor competition model and time-dependent reliability. J Bridge Eng. 2024;29(1):04023106. doi:10.1061/jbenf2.beeng-6409. [Google Scholar] [CrossRef]
24. De La Fuente D, Castaño JG, Morcillo M. Long-term atmospheric corrosion of zinc. Corros Sci. 2007;49(3):1420–36. doi:10.1016/j.corsci.2006.08.003. [Google Scholar] [CrossRef]
25. Ji H, Tian Y, Fu C, Ye H. Transfer learning enables prediction of steel corrosion in concrete under natural environments. Cem Concr Compos. 2024;148(1):105488. doi:10.1016/j.cemconcomp.2024.105488. [Google Scholar] [CrossRef]
26. Valor A, Caleyo F, Rivas D, Hallen JM. Stochastic approach to pitting-corrosion-extreme modelling in low-carbon steel. Corros Sci. 2010;52(3):910–5. doi:10.1016/j.corsci.2009.11.011. [Google Scholar] [CrossRef]
27. Ma Y, He Y, Wang G, Wang L, Zhang J, Lee D. Corrosion fatigue crack growth prediction of bridge suspender wires using Bayesian Gaussian process. Int J Fatigue. 2023;168(3):107377. doi:10.1016/j.ijfatigue.2022.107377. [Google Scholar] [CrossRef]
28. Toribio J, Matos JC, González B. Micro- and macro-approach to the fatigue crack growth in progressively drawn pearlitic steels at different R-ratios. Int J Fatigue. 2009;31(11–12):2014–21. doi:10.1016/j.ijfatigue.2009.02.005. [Google Scholar] [CrossRef]
29. Paris P, Erdogan F. A critical analysis of crack propagation laws. J Basic Eng. 1963;85(4):528–33. doi:10.1115/1.3656900. [Google Scholar] [CrossRef]
30. Huneau B, Mendez J. Evaluation of environmental effects on fatigue crack growth behaviour of a high strength steel in a saline solution with cathodic protection. Int J Fatigue. 2006;28(2):124–31. doi:10.1016/j.ijfatigue.2005.04.011. [Google Scholar] [CrossRef]
31. Forman RG, Shivakumar V. Growth behavior of surface cracks in the circumferential plane of solid and hollow cylinders. In: Fracture mechanics: seventeenth volume. West Conshohocken, PA, USA: ASTM International; 1986. p. 59–74. doi:10.1520/stp17388s. [Google Scholar] [CrossRef]
32. Li G, Han W, Zhang Y, Weng G. Fatigue life evaluation on wire rope suspenders of the suspension bridge based on a time-varying degradation process. Adv Struct Eng. 2023;26(10):1818–34. doi:10.1177/13694332231175401. [Google Scholar] [CrossRef]
33. Shi P, Mahadevan S. Damage tolerance approach for probabilistic pitting corrosion fatigue life prediction. Eng Fract Mech. 2001;68(13):1493–507. doi:10.1016/S0013-7944(01)00041-8. [Google Scholar] [CrossRef]
34. Mayrbaurl RM, Camo S. Cracking and fracture of suspension bridge wire. J Bridge Eng. 2001;6(6):645–50. doi:10.1061/(asce)1084-0702(2001)6:6(645). [Google Scholar] [CrossRef]
35. Xu J, Chen W. Behavior of wires in parallel wire stayed cable under general corrosion effects. J Constr Steel Res. 2013;85(2):40–7. doi:10.1016/j.jcsr.2013.02.010. [Google Scholar] [CrossRef]
36. McInnes CH, Meehan PA. Equivalence of four-point and three-point rainflow cycle counting algorithms. Int J Fatigue. 2008;30(3):547–59. doi:10.1016/j.ijfatigue.2007.03.006. [Google Scholar] [CrossRef]
37. JTG 5120-2021. Specifications for maintenance of highway bridges and culverts. Beijing, China: People’s Communications Publishing House Co., Ltd.; 2021. (In Chinese). [Google Scholar]
Cite This Article
 Copyright © 2026 The Author(s). Published by Tech Science Press.
This work is licensed under a Creative Commons Attribution 4.0 International License , which permits unrestricted use, distribution, and reproduction in any medium, provided the original work is properly cited.
 Downloads
 Citation Tools