
 Submit a Paper
 Propose a Special lssue
 Open Access
ARTICLE

Bi2S3 Nanorod–Carbon Fiber Hybrid Electrode for Sensitive Electrochemical Detection of Zearalenone in Cereal Samples
1 Taizhou Vocational & Technical College, Taizhou, China
2 Chongqing City Vocational College, Chongqing, China
3 ZheJiang Hope Instrument Co., Ltd., Taizhou, China
4 College of Digital Technology and Engineering, Ningbo University of Finance and Economics, Ningbo, China
* Corresponding Author: Chuansheng Tang. Email:
Chalcogenide Letters 2026, 23(2), 6 https://doi.org/10.32604/cl.2026.076718
Received 25 November 2025; Accepted 19 January 2026; Issue published 28 February 2026
 View Full Text
 Download PDF
Abstract
Zearalenone (ZEA) contamination in cereal-based food products represents a significant threat to global food safety and public health. As a potent non-steroidal estrogenic mycotoxin, ZEA mimics 17β-estradiol and acts as an endocrine disruptor, leading to severe reproductive toxicity and pathologies such as hepatotoxicity and immunotoxicity. Its prevalence in staple crops like maize and wheat results in substantial economic losses and necessitates adherence to stringent regulatory limits (e.g., 50 μg/kg set by EFSA) to protect consumers from chronic low-dose exposure. This work reports the development of a novel electrochemical sensor based on a bismuth sulfide nanorod–carbon fiber (Bi2S3-CF) hybrid electrode, fabricated for the first time via a facile, one-pot, in-situ hydrothermal method. This approach was designed to overcome the poor adhesion and high contact resistance associated with conventional drop-casting methods. This fabrication strategy yielded a 3D hierarchical, mesoporous architecture with a specific surface area (SSA) of 120.5 m2/g, as determined by BET analysis, which was 7.9-fold higher than the bare CF substrate. Electrochemical characterization via cyclic voltammetry (CV) and electrochemical impedance spectroscopy (EIS) demonstrated the profound electronic synergy of the hybrid, which exhibited a 35-fold reduction in charge transfer resistance (Rct = 75 Ω) and a 4.4-fold increase in electrochemically active surface area (ECSA) compared to the bare electrode. When applied as a sensor for ZEA using differential pulse voltammetry (DPV), the Bi2S3-CF hybrid electrode displayed outstanding analytical performance, including an ultralow limit of detection (LOD) of 0.003 ng/mL (3 pg/mL) and a wide linear dynamic range from 0.01 ng/mL to 200 ng/mL. The sensor demonstrated high selectivity against other common mycotoxins and was successfully validated in corn flour, wheat flour, and oat flake samples with excellent recovery rates (97.2%–103.4%). This work establishes the Bi2S3-CF hybrid as a robust, low-cost, and highly sensitive platform for practical food safety diagnostics.Keywords
Cereal grains and their derived products, such as bread, pasta, and breakfast cereals, constitute staple food sources for a vast majority of the global population [1]. However, these commodities are highly susceptible to fungal contamination, particularly by species of the genus Fusarium. These toxigenic molds produce a class of toxic secondary metabolites known as mycotoxins, which pose a severe and persistent threat to food safety and public health. Among these, Zearalenone (ZEA), a non-steroidal estrogenic mycotoxin, is of paramount concern. ZEA contamination is prevalent in essential crops including maize, wheat, barley, oats, and rye, and its presence can lead to significant quality deterioration and economic losses, impacting international trade and food security [2].
The primary danger of ZEA lies in its potent and multifaceted toxicity. Structurally, ZEA mimics the endogenous hormone 17β-estradiol, allowing it to bind to estrogen receptors and function as a powerful endocrine disruptor. This estrogen-like activity is linked to severe reproductive toxicity, including impaired fertility, inhibited follicle maturation, and altered hormone secretion. Beyond its reproductive effects, ZEA exposure has been associated with a spectrum of other pathologies, including hepatotoxicity (liver damage), immunotoxicity (impaired immune function), and genotoxicity. Of particular concern is the potential for adverse health effects arising from chronic, long-term, low-dose exposure, which is a realistic scenario given the prevalence of ZEA in processed foods like breakfast cereals [3]. In response to these health risks, regulatory bodies such as the European Food Safety Authority (EFSA) have established stringent maximum levels (MLs) for ZEA in foodstuffs, with limits as low as 50 μg/kg for certain breakfast cereals, a level that approaches the tolerable daily intake (TDI) under worst-case consumption scenarios [4].
The enforcement of these low-level regulatory limits necessitates the availability of reliable, sensitive, and accurate analytical methods. The gold-standard techniques for ZEA quantification are laboratory-based chromatographic methods, primarily high-performance liquid chromatography (HPLC) with fluorescence detection (FLD) or tandem mass spectrometry (LC-MS/MS) [5]. While these methods offer exceptional accuracy and specificity, they are severely limited in their applicability for widespread screening. They are inherently expensive, time-consuming, require extensive and costly sample preparation (e.g., immunoaffinity column clean-up), and must be operated by highly trained technicians in centralized laboratories. Alternative rapid screening methods, such as the enzyme-linked immunosorbent assay (ELISA), have been developed. Although ELISA is inexpensive and suitable for high-throughput analysis [6], it is susceptible to significant matrix interference from complex food samples and may suffer from cross-reactivity with structurally related ZEA metabolites, leading to false-positive or false-negative results [7].
Consequently, there is an urgent and unmet demand for a detection platform that bridges the gap between the accuracy of HPLC and the speed of ELISA. Electrochemical sensors represent an ideal alternative, offering a compelling combination of high sensitivity, rapid response, low instrumentation cost, portability for on-site analysis, and operational simplicity [8]. Recent examples illustrate how electrode nanostructuring can boost ZEA electroanalysis. Zaman et al. [9] used a carnation flower-like Tb3+/Co3O4 nanocomposite on a screen-printed electrode, reporting a 0.34 nM detection limit and a broad 0.001–500 μM range, while Zhao et al. [10] implanted 5–10 nm Au nanoparticles onto screen-printed electrodes to catalyze ZEA oxidation in grains, achieving quantification from 10 ng/kg to 10 mg/kg with a 1.1 ng/kg detection limit. These advances motivate robust, low-cost, binder-free hybrid electrodes with low interfacial resistance for cereal matrices. The analytical performance of an electrochemical sensor is fundamentally dictated by the properties of the working electrode material [11,12]. An ideal material must possess high electrical conductivity to facilitate signal transduction and a high density of electrocatalytic active sites to promote the specific oxidation or reduction of the target analyte (ZEA), which possesses an electroactive phenolic moiety. Recent electrochemical ZEA assays have mainly evolved along two high-sensitivity routes: (i) recognition-layer strategies, especially aptamer-based architectures, and (ii) molecularly imprinted polymer (MIP) interfaces that mimic antibody-like selectivity while improving robustness. For example, Rehman et al. [13] developed an MIP-based electrochemical sensor integrating graphitic carbon nitride nanosheets with BSA@MnO2 (g-C3N4NS/BSA@MnO2), achieving linearity from 1.0 to 10.0 ng L−1 with an LOD of 0.25 ng L−1 for ZEA in rice samples (converted to 0.001–0.01 ng mL−1 and 2.5 × 10⁻⁴ ng mL−1, respectively). In parallel, recent aptasensors have reported ultra-trace detection in complex matrices using EIS/DPV transduction and nanostructured MOF platforms; for instance, a Cu/Bi-MOF aptasensor achieved fg mL−1-level LODs with wide working ranges [14]. While these approaches can reach extremely low LODs, they often rely on multistep probe immobilization and biorecognition-element stability, which can complicate fabrication, storage, and field deployment. Therefore, there remains a practical need for robust, low-cost electrodes that deliver high sensitivity with simplified preparation and strong interfacial charge transfer.
This study focuses on the rational design and synthesis of a novel hybrid electrode material to meet these demands. We have selected carbon fiber (CF) as the foundational substrate. CF is not merely a passive support; it is an active electrode component offering excellent electrical conductivity, high mechanical robustness, chemical stability, and a large, inherently three-dimensional (3D) surface area that can be readily functionalized. In electrochemical (bio)sensing, CF has increasingly been adopted as a versatile one-dimensional conductive scaffold that can be configured as flexible threads or microelectrodes, supporting efficient electron transport, rapid mass transfer, and comparatively low background currents, which together benefit signal-to-noise in trace analysis. Importantly, the graphitic CF surface can robustly anchor or enable in situ growth of functional nanomaterials and selective recognition layers, yielding hybrid electrodes with enlarged electrochemically active surface area and accelerated interfacial kinetics. For example, MnCO3 nanostructures incorporated into carbon fibers and combined with a molecularly imprinted polymer were used to quantify the mycotoxin ochratoxin A in apple juice, achieving a linear range of 1.0 × 10⁻¹¹–1.0 × 10⁻⁹ mol L−1 and an LOD of 2.0 × 10⁻¹² mol L−1, underscoring the suitability of CF-based hybrids for mycotoxin sensing in complex food matrices [15]. To impart catalytic activity, we turn to bismuth sulfide (Bi2S3), a prominent member of the chalcogenide semiconductor family. Bi2S3 nanostructures, particularly nanorods, have garnered significant attention in sensing applications due to their high surface-to-volume ratio, unique electronic properties, and demonstrated electrocatalytic activity [16]. Recent studies have highlighted the potential of Bi2S3-carbon composites for various electrochemical applications, including the detection of other mycotoxins and analytes.
The central hypothesis of this work is that the method of integration between Bi2S3 and CF is critical. A simple physical mixture or drop-casting of pre-synthesized Bi2S3 nanorods onto a CF surface will result in a suboptimal electrode, plagued by poor adhesion, non-uniform coverage, and high interfacial contact resistance. We propose that a one-pot, in-situ hydrothermal synthesis, wherein Bi2S3 nanorods are nucleated and grown directly on the surface of the activated CF, will create a chemically-bonded, synergistic hybrid. This in-situ approach is hypothesized to generate a 3D hierarchical, mesoporous nanostructure with (1) a vastly maximized electrochemically active surface area (ECSA) and (2) a seamless, low-resistance electron transport pathway between the catalytic Bi2S3 sites and the conductive CF backbone [17]. This paper presents the facile synthesis, exhaustive material characterization (including FTIR, XRD, SEM, TEM, XPS, UV-vis, and BET), and comprehensive electrochemical evaluation of this Bi2S3-CF hybrid electrode. We demonstrate its superior performance in the sensitive and selective detection of ZEA and validate its practical application in real-world cereal samples.
2.1 Pretreatment of Carbon Fiber (CF) Electrode
A bundle of carbon fiber tow (approx. 1 cm length, 0.5 cm width) was sonicated sequentially in acetone, ethanol, and DI water for 15 min each to remove surface contaminants. To activate the surface and introduce oxygen-containing functional groups, the cleaned CF was immersed in 6.0 M HNO3 at 80°C for 6 h [18]. The acid-treated CF was then washed thoroughly with DI water until the pH was neutral and dried in an oven at 60°C. Prior to use or modification, the activated CF was further electrochemically cleaned by cyclic voltammetry (CV) in 0.5 M H2SO4, sweeping the potential between −0.5 V and +1.5 V at 100 mV/s until a stable voltammogram was achieved. This electrode is designated as Bare CF.
2.2 Synthesis of Bi2S3 Nanorods (Bi2S3-NRs) Powder
For comparative purposes, Bi2S3 nanorod powder was synthesized via a solvothermal method [19]. In a typical procedure, 1.0 mmol of Bi(NO3)3·5H2O and 3.0 mmol of thiourea were dissolved in 40 mL of ethylene glycol (EG) under vigorous stirring. The homogeneous solution was transferred into a 50 mL Teflon-lined stainless-steel autoclave, sealed, and maintained at 180°C for 12 h. After cooling, the black precipitate was collected by centrifugation, washed alternately with absolute ethanol and DI water three times, and finally dried at 60°C overnight. This powder is designated as Bi2S3-NRs.
2.3 Fabrication of Control and Hybrid Electrodes
Bi2S3/CF (Drop-cast Control) Electrode: A stable catalyst ink was prepared by dispersing 5.0 mg of the synthesized Bi2S3-NRs powder into 1.0 mL of a solution containing 950 μL of ethanol and 50 μL of 5 wt% Nafion solution. The mixture was ultrasonicated for 30 min to form a homogeneous black suspension. The Bi2S3/CF control electrode was fabricated by drop-casting 10 μL of this ink onto the surface of the Bare CF electrode and allowing it to dry at room temperature.
Bi2S3-CF (In-situ Hybrid) Electrode: The proposed hybrid electrode was fabricated using a one-pot, in-situ hydrothermal growth method [20]. A piece of the pretreated Bare CF (approx. 3 cm in length) was fixed in a 50 mL Teflon-lined stainless-steel autoclave. In this process, 1.0 mmol of Bi(NO3)3·5H2O and 3.0 mmol of thiourea were dissolved in 40 mL of DI water (not EG) under stirring. The Bare CF was fully immersed in this precursor solution. The autoclave was sealed and heated in an oven at 160°C for 10 h. During this process, the thiourea decomposes to provide S2− ions, which react with Bi3+ ions, allowing Bi2S3 nanorods to nucleate and grow directly on the activated sites of the CF surface. After cooling, the Bi2S3-CF hybrid electrode was removed, rinsed thoroughly with DI water, and dried at 60°C.
2.4 Electrochemical Measurement Protocols
The electrochemical properties of the electrode-electrolyte interface were characterized using CV and Electrochemical Impedance Spectroscopy (EIS) in a 0.1 M KCl solution containing 5.0 mM [Fe(CN)6]3−/4− as a redox probe [21]. CVs were typically recorded from −0.2 V to +0.6 V at a scan rate of 50 mV/s. EIS measurements were performed at the formal potential of the probe (+0.18 V) with a sinusoidal amplitude of 5 mV over a frequency range from 100 kHz to 0.1 Hz.
The electrochemical detection of ZEA was performed using Differential Pulse Voltammetry (DPV) [22]. The supporting electrolyte for all ZEA measurements was 0.1 M phosphate-buffered saline (PBS). Experimental parameters were optimized, including the pH of the PBS (from 4.0 to 8.0) and the accumulation time (from 0 s to 300 s) under open-circuit potential. The standard DPV parameters used were: modulation amplitude 0.05 V, modulation time 0.05 s, and step potential 0.005 V. All experiments were conducted at room temperature. For LOD estimation, the blank was defined as 0.1 M PBS (pH 6.0) containing 0 ng/mL ZEA and measured under identical accumulation and DPV conditions; σ was calculated as the standard deviation of the baseline-corrected blank current recorded at the ZEA peak potential from repeated blank measurements, and the LOD was obtained using LOD = 3σ/slope in accordance with common analytical-chemistry practice.
2.5 Real Sample Preparation and Analysis
Cereal samples (corn flour, wheat flour, and oat flakes) were purchased from a local supermarket. The absence of ZEA in these samples was first confirmed by a standard HPLC-MS/MS method. For spike-and-recovery tests, ZEA extraction was performed based on established protocols. Briefly, 5.0 g of homogenized cereal sample was accurately weighed and mixed with 20 mL of an acetonitrile-water solution (80:20, v/v). The mixture was vortexed for 30 min and then centrifuged at 5000 rpm for 10 min. The supernatant was collected, and 1.0 mL was transferred to a new tube and evaporated to dryness under a gentle N2 stream. The residue was then redissolved in 1.0 mL of 0.1 M PBS (pH 6.0) to create the final sample extract. Quantification in all cereal extracts was performed by the standard addition method to compensate for matrix effects, as recommended for calibration in complex matrices where matrix-matched standards are not readily available. Briefly, an aliquot of the sample extract was placed in the electrochemical cell and the DPV peak current (I) of the extract was first recorded (unspiked). Subsequently, small aliquots of ZEA working standard were added stepwise to the same extract, and DPV was recorded after each addition under identical conditions. A standard addition plot was constructed by linear regression of I versus the added ZEA concentration (Cadd). The ZEA concentration in the original extract (Csample) was determined from the x-intercept of the regression (Csample = −intercept/slope). All standard-addition determinations were performed in triplicate to obtain mean values and RSD.
3.1 Synthesis Strategy and Morphological Characterization
The core objective of this study was to fabricate a hybrid electrode where the catalyst (Bi2S3) and the conductive substrate (CF) are seamlessly integrated. This was achieved via an in-situ hydrothermal growth strategy, designed to leverage the activated functional groups on the CF surface as nucleation anchors for the Bi2S3 nanorods. To validate this approach, the morphology of the in-situ Bi2S3-CF hybrid was meticulously compared against control samples: the Bare CF substrate and the Bi2S3/CF electrode (fabricated by drop-casting pre-synthesized Bi2S3-NRs powder).
Fig. 1 presents the SEM morphological analysis of the materials. Fig. 1a shows the Bare CF substrate, revealing bundles of smooth, cylindrical fibers, each with a diameter of approximately 7 μm. After acid and electrochemical activation (Fig. 1b), the fiber surfaces appear visibly roughened and etched, a process known to increase the physical surface area and expose reactive C–O and C=O functional groups. Fig. 1c displays the morphology of the control Bi2S3/CF electrode. As hypothesized, the drop-casting method results in a highly non-uniform and poorly structured surface. Large, irregular agglomerates of the Bi2S3 powder are seen physically resting on the CF surface, held in place by the Nafion binder. Large areas of the CF substrate remain exposed, while other areas are masked by thick, insulating clumps, which would invariably lead to poor catalytic efficiency and high contact resistance.
In stark contrast, Fig. 1d reveals the morphology of the Bi2S3-CF hybrid. The in-situ growth method has produced a radically different structure. The carbon fibers are completely and uniformly coated with a dense, 3D hierarchical array of interpenetrating nanorods [23]. These nanorods grow radially outwards from the CF surface, creating a “bristle-brush” or “nanorod-on-fiber” architecture that is highly ordered and porous. This structure prevents the agglomeration seen in the control sample and creates a vastly more extensive and accessible surface. This 3D architecture is anticipated to significantly enhance mass transport of the ZEA analyte to the active sites and provide a multitude of accessible catalytic surfaces [24].
To investigate the individual nanorods in more detail, TEM analysis was performed on the Bi2S3 material scraped from the hybrid electrode (Fig. 2). Fig. 2a (TEM) confirms the material is composed of discrete nanorods with uniform dimensions, averaging 20–30 nm in diameter and 150–200 nm in length. The HRTEM image in Fig. 2b provides a high-magnification view of a single nanorod, revealing highly crystalline, continuous, and clear lattice fringes. The measured inter-planar spacing of 0.39 nm can be indexed to the (220) plane of orthorhombic Bi2S3, confirming the high crystallinity of the nanorods along this growth axis. The corresponding SAED pattern (Fig. 2c) displays a set of bright, concentric, and dotted rings. These rings can be indexed to the (130), (220), (211), and (002) crystal planes of the orthorhombic Bi2S3 phase. The dotted-ring pattern confirms the nanocrystalline nature of the material, consistent with its formation from an assembly of nanorods. This high-quality, crystalline nanostructure is essential for efficient electrocatalysis.
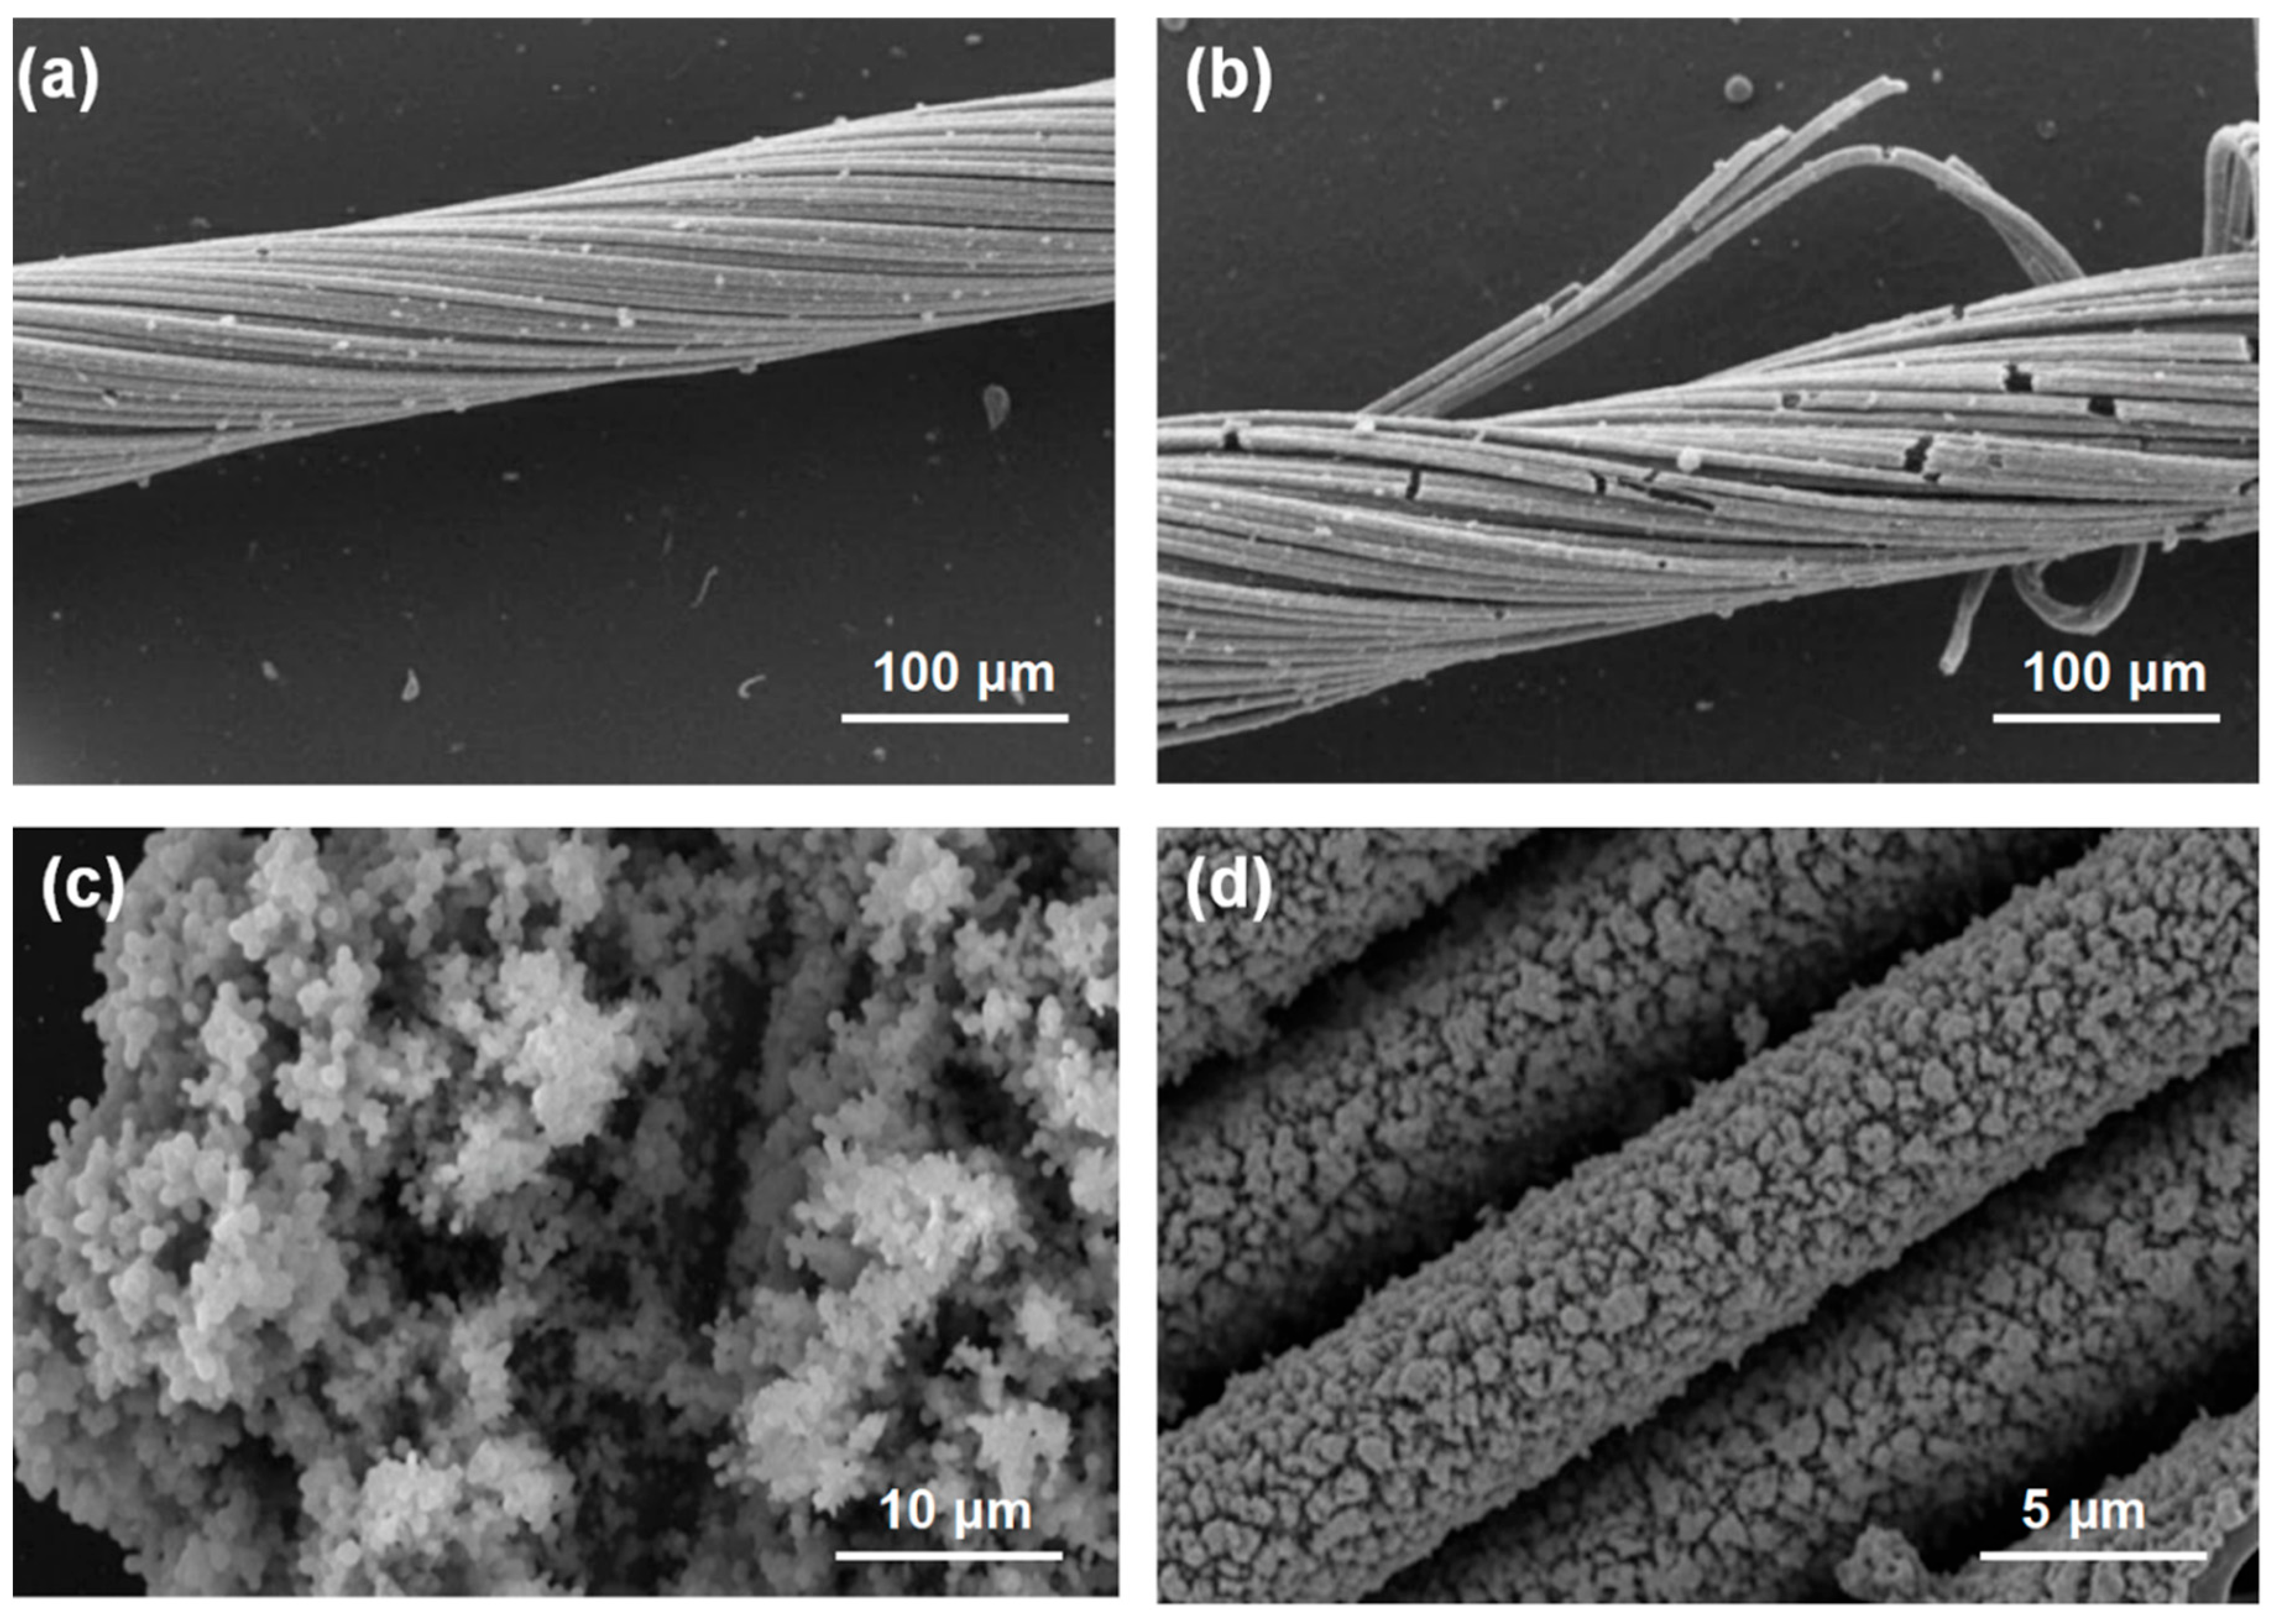
Figure 1: Comparative SEM morphological analysis of electrode materials, illustrating the fabrication strategy. (a) Bare CF substrate. (b) Acid and electrochemically-activated Bare CF. (c) Bi2S3/CF control electrode, fabricated by drop-casting. (d) Bi2S3-CF hybrid electrode, fabricated by the one-pot, in-situ hydrothermal growth method.
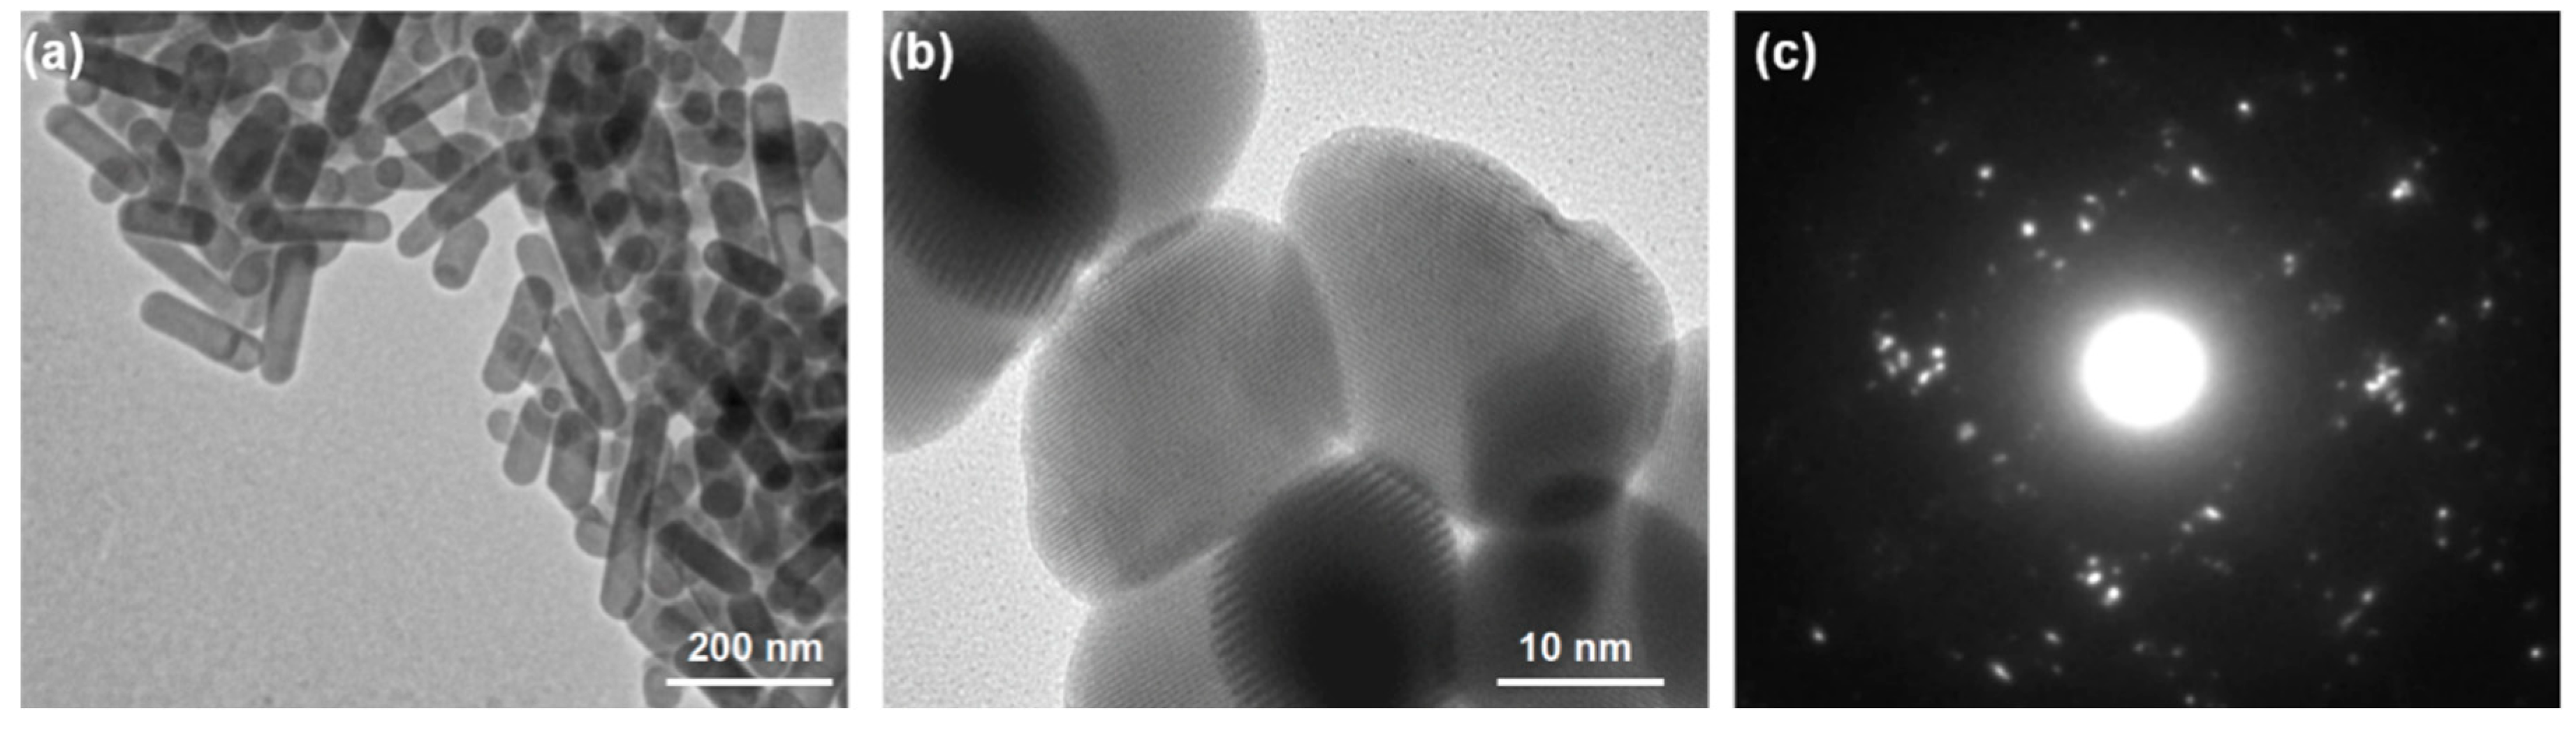
Figure 2: TEM and HRTEM characterization of the Bi2S3 nanorods scraped from the in-situ Bi2S3-CF hybrid electrode. (a) Low-magnification TEM image. (b) HRTEM image of a single nanorod. (c) SAED pattern.
3.2 Structural and Phase Characterization
The crystal phase and structural integrity of the synthesized materials were investigated using XRD and Raman spectroscopy. Fig. 3a shows the XRD patterns for the Bare CF, the Bi2S3-NRs powder, and the Bi2S3-CF hybrid. The diffractogram for Bare CF exhibits a single, broad diffraction peak centered at a 2θ value of approximately 25.5°, which is characteristic of the (002) plane of amorphous or graphitic carbon [23]. The Bi2S3-NRs powder displays a series of sharp, well-defined diffraction peaks at 2θ values of 22.4°, 24.9°, 28.7°, 31.8°, and 45.4°. These peaks are perfectly indexed to the (130), (211), (221), (131), and (431) planes, respectively, of the orthorhombic bismuthinite phase of Bi2S3 (JCPDS Card No. 17-0320) [25]. The absence of any other peaks confirms the high phase purity of the solvothermally synthesized nanorods. The broadening of the peaks, when analyzed with the Scherrer equation, indicates an average crystallite size of approximately 25 nm, which is in excellent agreement with the TEM observations. The XRD pattern for the Bi2S3-CF hybrid shows the characteristic sharp peaks of orthorhombic Bi2S3 superimposed on the broad (002) carbon peak. This co-existence definitively proves that the Bi2S3 nanorods were successfully synthesized and anchored onto the carbon fiber substrate in-situ and that the hydrothermal process did not alter the crystal phase of either component.
Raman spectroscopy was employed to provide complementary structural information, particularly concerning the carbon-chalcogenide interface (Fig. 3b). The Bare CF spectrum displays the two characteristic peaks for carbonaceous materials: the D-band at ∼1333 cm−1, which corresponds to disordered carbon and structural defects, and the G-band at ∼1560 cm−1, attributed to the in-plane sp2 vibrations of graphitic carbon [26]. The Bi2S3-NRs powder shows several characteristic low-frequency phonon modes, including Ag modes at ∼186 cm−1 and ∼239 cm−1, and a B1g mode at ∼266 cm−1, which are in good agreement with literature values for Bi2S3 nanostructures [17]. The spectrum for the Bi2S3-CF hybrid clearly shows both sets of peaks: the D and G bands from the CF substrate and the characteristic Bi2S3 phonon modes. The intensity ratio of the D and G bands (ID/IG) provides insight into the defect density of the carbon material. The ID/IG ratio for the Bi2S3-CF hybrid was calculated to be 1.15, which is noticeably higher than that of the Bare CF (1.02). This increase suggests that the high-temperature, high-pressure hydrothermal process introduced additional defects or functional groups onto the CF surface. It is precisely these defects that are believed to act as the preferential nucleation sites for the Bi2S3 nanorod growth, supporting the proposed in-situ mechanism.
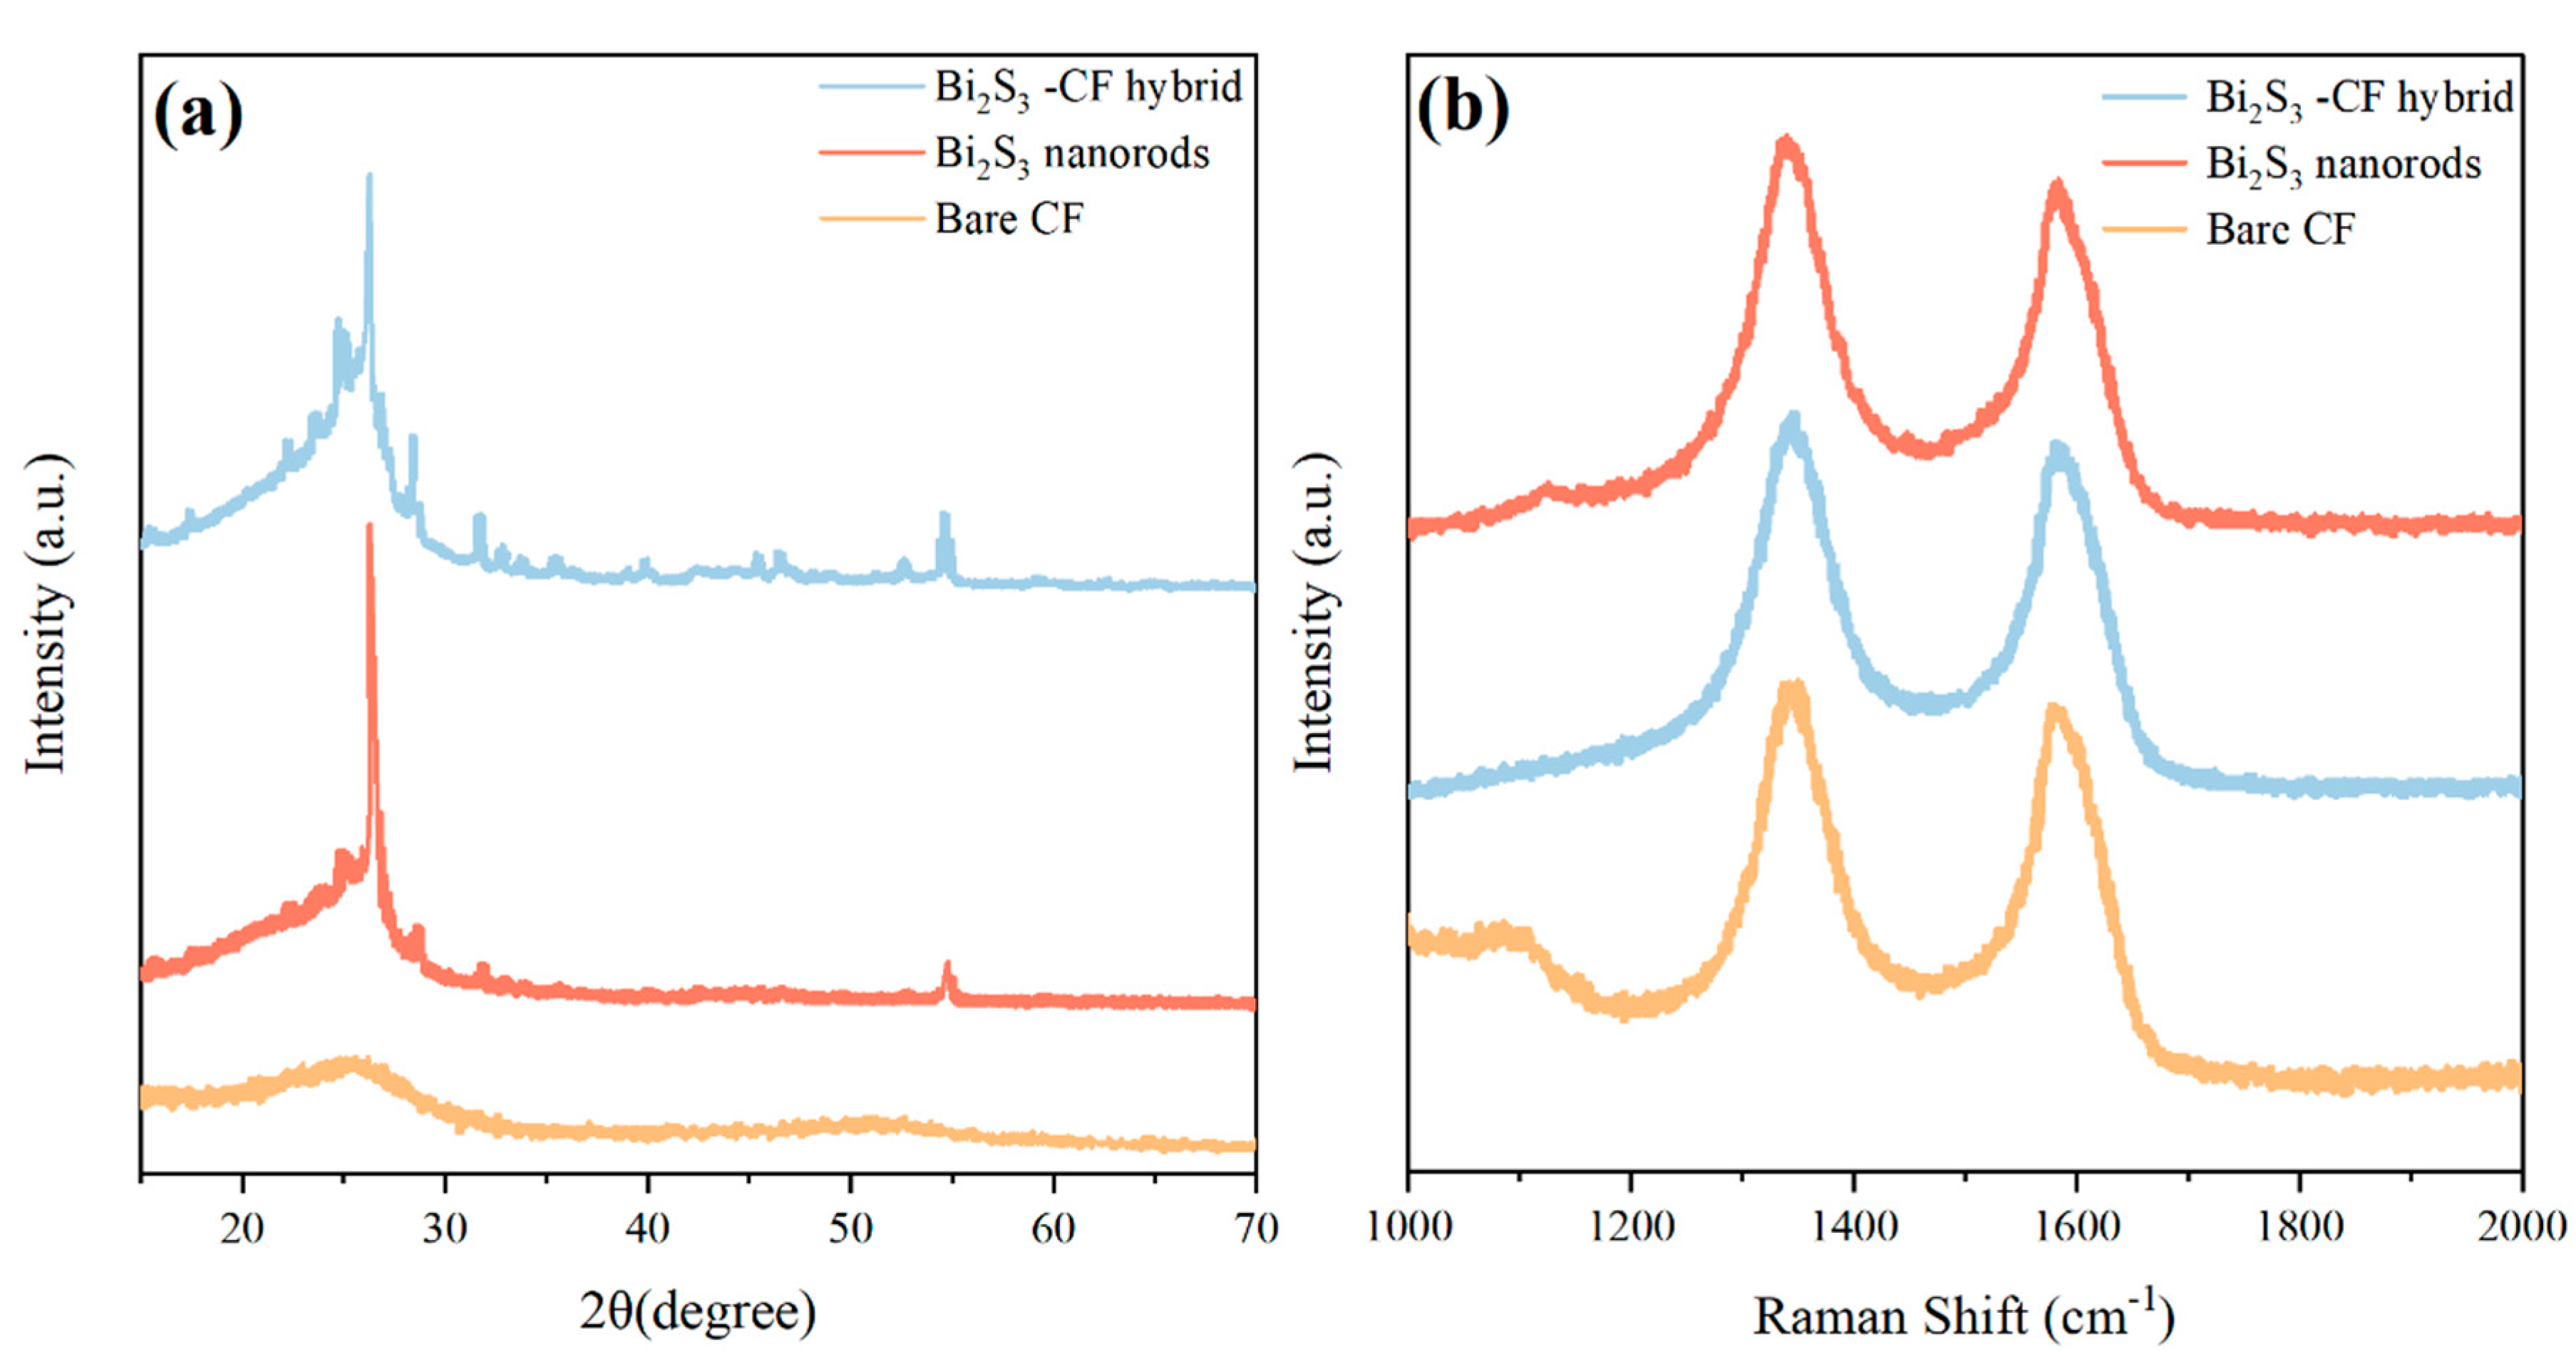
Figure 3: (a) XRD patterns and (b) Raman spectra of the Bare CF, the Bi2S3 nanorods powder, and the Bi2S3-CF hybrid.
3.3 Chemical Composition and Surface Analysis
XPS analysis was conducted to verify the surface elemental composition and chemical valence states of the Bi2S3-CF hybrid material (Fig. 4). The survey spectrum (Fig. 4a) confirmed the presence of Bi, S, C, and O, with no other elemental impurities detected. The high-resolution Bi 4f spectrum (Fig. 4b) was deconvoluted into two sharp, symmetric peaks at binding energies of and ∼158.5 eV (Bi 4f7/2) [27]. The spin-orbit splitting of 5.3 eV is a characteristic signature of the Bi3+ oxidation state. The high-resolution S 2p spectrum (Fig. 4b) was deconvoluted into a primary doublet with peaks at ∼160.9 eV (S 2p3/2) and ∼162.1 eV (S 2p1/2), which are characteristic of the S2− (sulfide) state in metal sulfides. A minor peak at a higher binding energy of ∼168.8 eV can be attributed to a small amount of surface oxidation (S-O bonds), which is common for nanoscale sulfides exposed to air. The high-resolution C 1s spectrum (Fig. 4c) provided critical evidence for the hybrid’s interfacial chemistry. The spectrum was deconvoluted into three main components: a strong peak at ∼284.6 eV corresponding to C-C/C=C bonds from the graphitic fiber backbone, a peak at ∼286.0 eV (C-O, alcohols/ethers), and a peak at ∼288.5 eV (O-C=O, carboxylic acids). The presence of these oxygen-containing functional groups, introduced during the HNO3 activation step, confirms the existence of chemical anchors on the CF surface. These groups facilitate the in-situ nucleation and growth of the Bi2S3 nanorods, leading to the strong, chemically-bonded interface hypothesized.
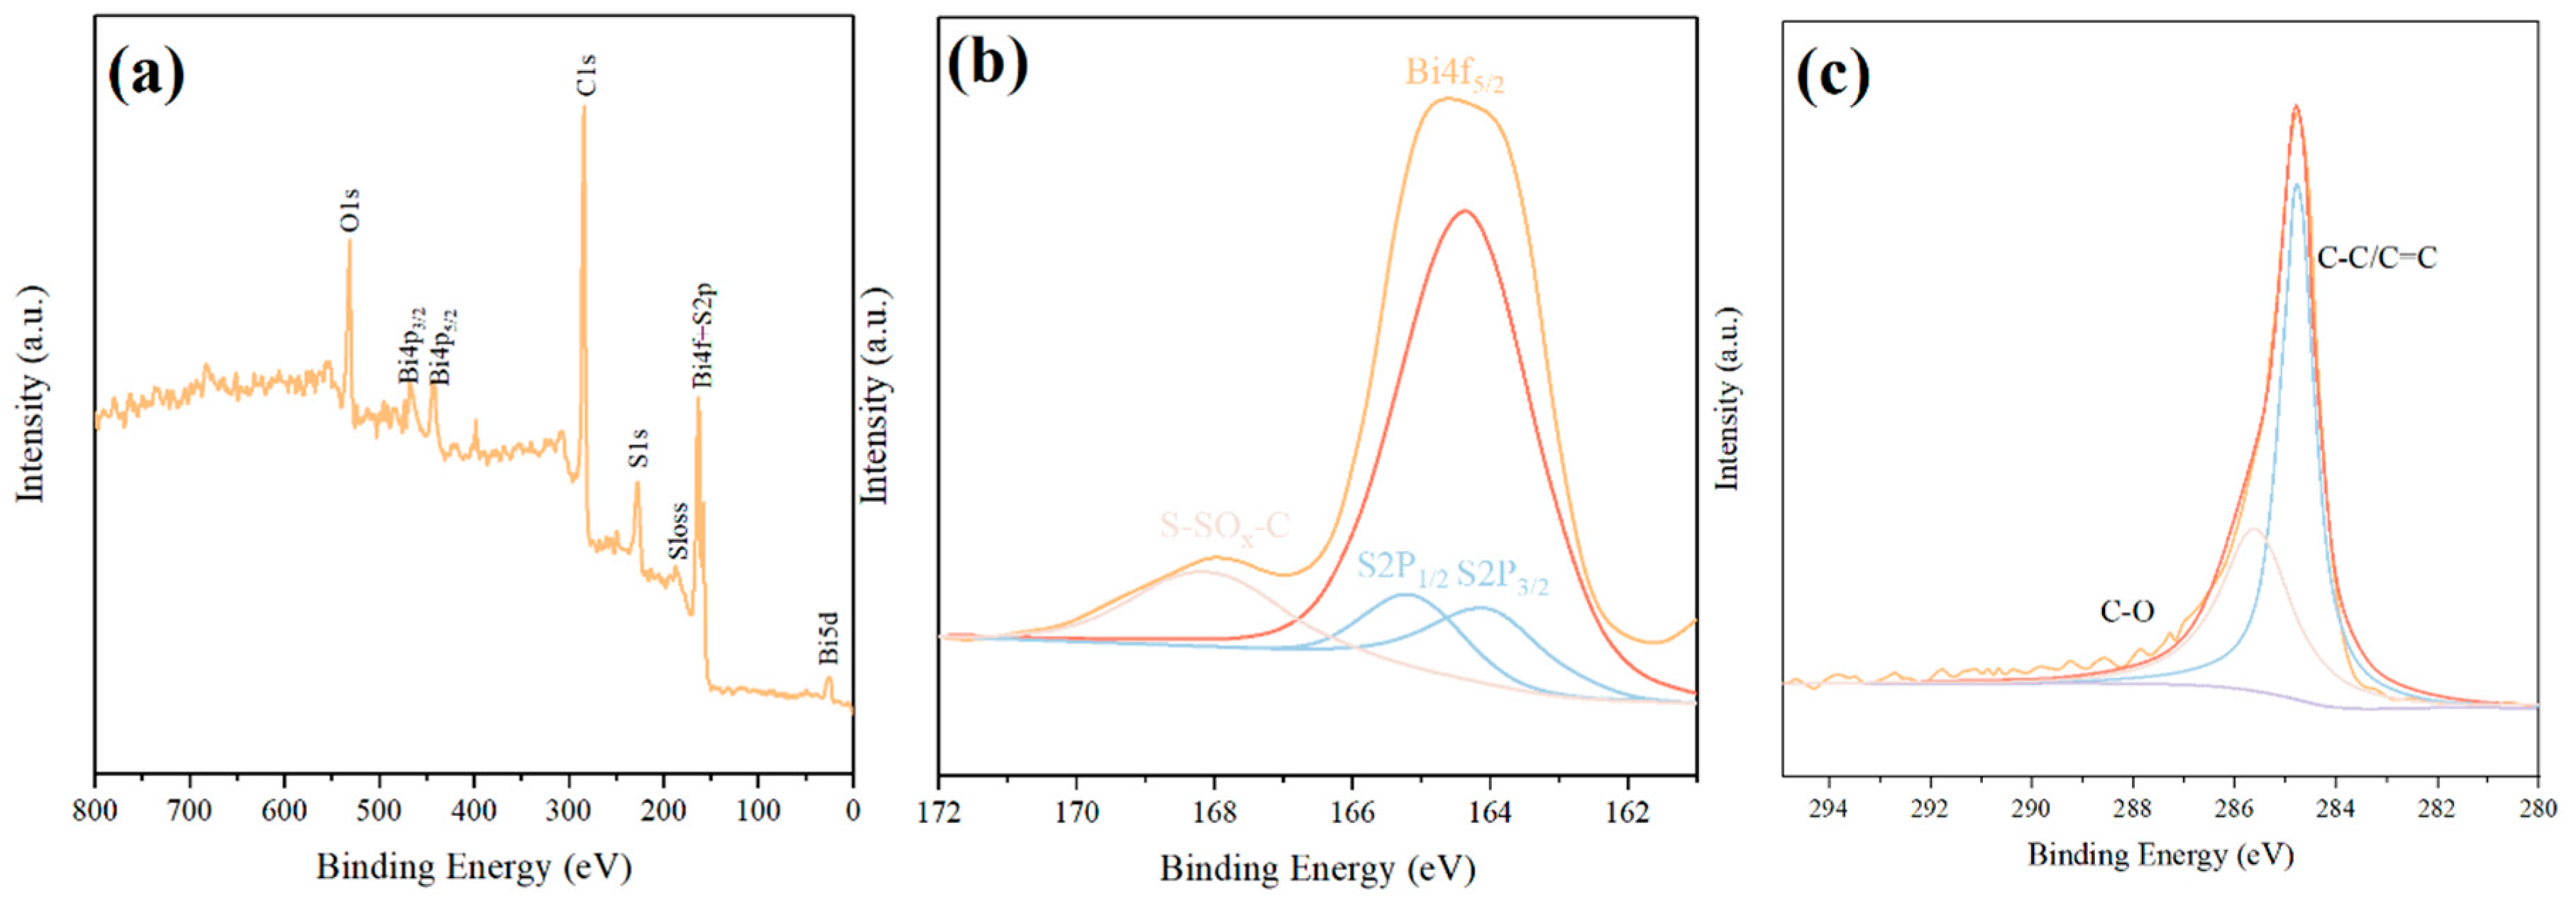
Figure 4: XPS analysis of the Bi2S3-CF hybrid material. (a) Full survey spectrum confirming the presence of Bi, S, C, and O without detectable impurities. (b) High-resolution Bi 4f spectrum and S 2p spectrum. (c) High-resolution C 1s spectrum.
The physical surface properties, which are critical for sensing, were quantified using N2 adsorption-desorption analysis. Table 1 provides the quantitative summary of these surface properties and provides the first definitive proof of the “Structural Synergy.” The Bare CF possesses a low BET specific surface area (SSA) of 15.2 m2/g. The pre-synthesized Bi2S3-NRs powder has a moderate SSA of 45.8 m2/g. Notably, the drop-cast Bi2S3/CF control electrode has an even lower SSA (28.3 m2/g) than the powder alone. This is attributed to the Nafion binder and the particle agglomeration, which blocks pores and reduces the accessible surface. The most significant finding is the SSA of the Bi2S3-CF hybrid: 120.5 m2/g. This value is 7.9-fold higher than the Bare CF and 2.6-fold higher than the Bi2S3 powder. This demonstrates a powerful structural synergy, where the CF acts as a 3D scaffold that prevents the nanorod agglomeration, and the in-situ grown nanorods, in turn, create a high-surface-area, porous network. This massive increase in SSA is a primary contributor to the enhanced sensing performance [28].
Table 1: Summary of BET surface area and porosity properties.
| Material | BET Specific Surface Area (m2/g) | Avg. Pore Diameter (nm) | Total Pore Volume (cm3/g) |
|---|---|---|---|
| Bare CF | 15.2 ± 1.41 | - (non-porous) | 0.03 ± 0.01 |
| Bi2S3-NRs (powder) | 45.8 ± 4.33 | 12.5 ± 1.22 | 0.14 ± 0.02 |
| Bi2S3/CF (drop-cast) | 28.3 ± 2.51 | 14.1 ± 1.41 | 0.10 ± 0.02 |
| Bi2S3-CF (Hybrid) | 120.5 ± 10.56 | 18.2 ± 1.78 | 0.55 ± 0.06 |
3.4 Electrochemical Interface Characterization
To test the hypothesis of “Electronic Synergy,” the electron transfer capabilities of the different electrodes were evaluated. This was done using the [Fe(CN)6]3−/4− redox probe, which provides a standard measure of interfacial kinetics. Fig. 5a presents the comparative CVs. The Bare CF electrode exhibits broad, sluggish redox peaks with a large peak-to-peak separation (ΔEp) of ∼248 mV, indicating very poor electron transfer kinetics. The drop-cast Bi2S3/CF control shows a slight improvement, with higher peak currents (Ip) but a still-large ΔEp of ∼172 mV. In dramatic contrast, the Bi2S3-CF hybrid displays a pair of sharp, well-defined, and quasi-reversible redox peaks. The peak currents are significantly larger, and the ΔEp is only ∼65 mV. This value is very close to the theoretical value of 59 mV for an ideal one-electron reversible process, proving that the in-situ hybrid possesses vastly superior electron transfer kinetics [29].
EIS was used to quantify this kinetic difference by measuring the charge transfer resistance (Rct), which is represented by the diameter of the semicircle in the Nyquist plot (Fig. 5b). The Bare CF shows a massive semicircle, with a calculated Rct of ∼2610 Ω, confirming its high resistance to electron transfer. The Bi2S3/CF control shows a smaller semicircle, with Rct ≈ 940 Ω. The high resistance is likely due to the poor physical contact between the agglomerated powder and the CF, as well as the insulating properties of the Nafion binder. The Bi2S3-CF hybrid exhibits a negligible semicircle that is almost a straight line, corresponding to an exceptionally low Rct ∼75 Ω. This 35-fold decrease in Rct compared to Bare CF, and 12-fold decrease compared to the drop-cast control, is unequivocal quantitative proof of the electronic synergy. The in-situ growth creates an intimate, chemically-bonded, and low-resistance electronic interface that allows for rapid electron shuttling between the CF substrate and the Bi2S3 catalytic sites. This low Rct is a direct prerequisite for a highly sensitive sensor [30].
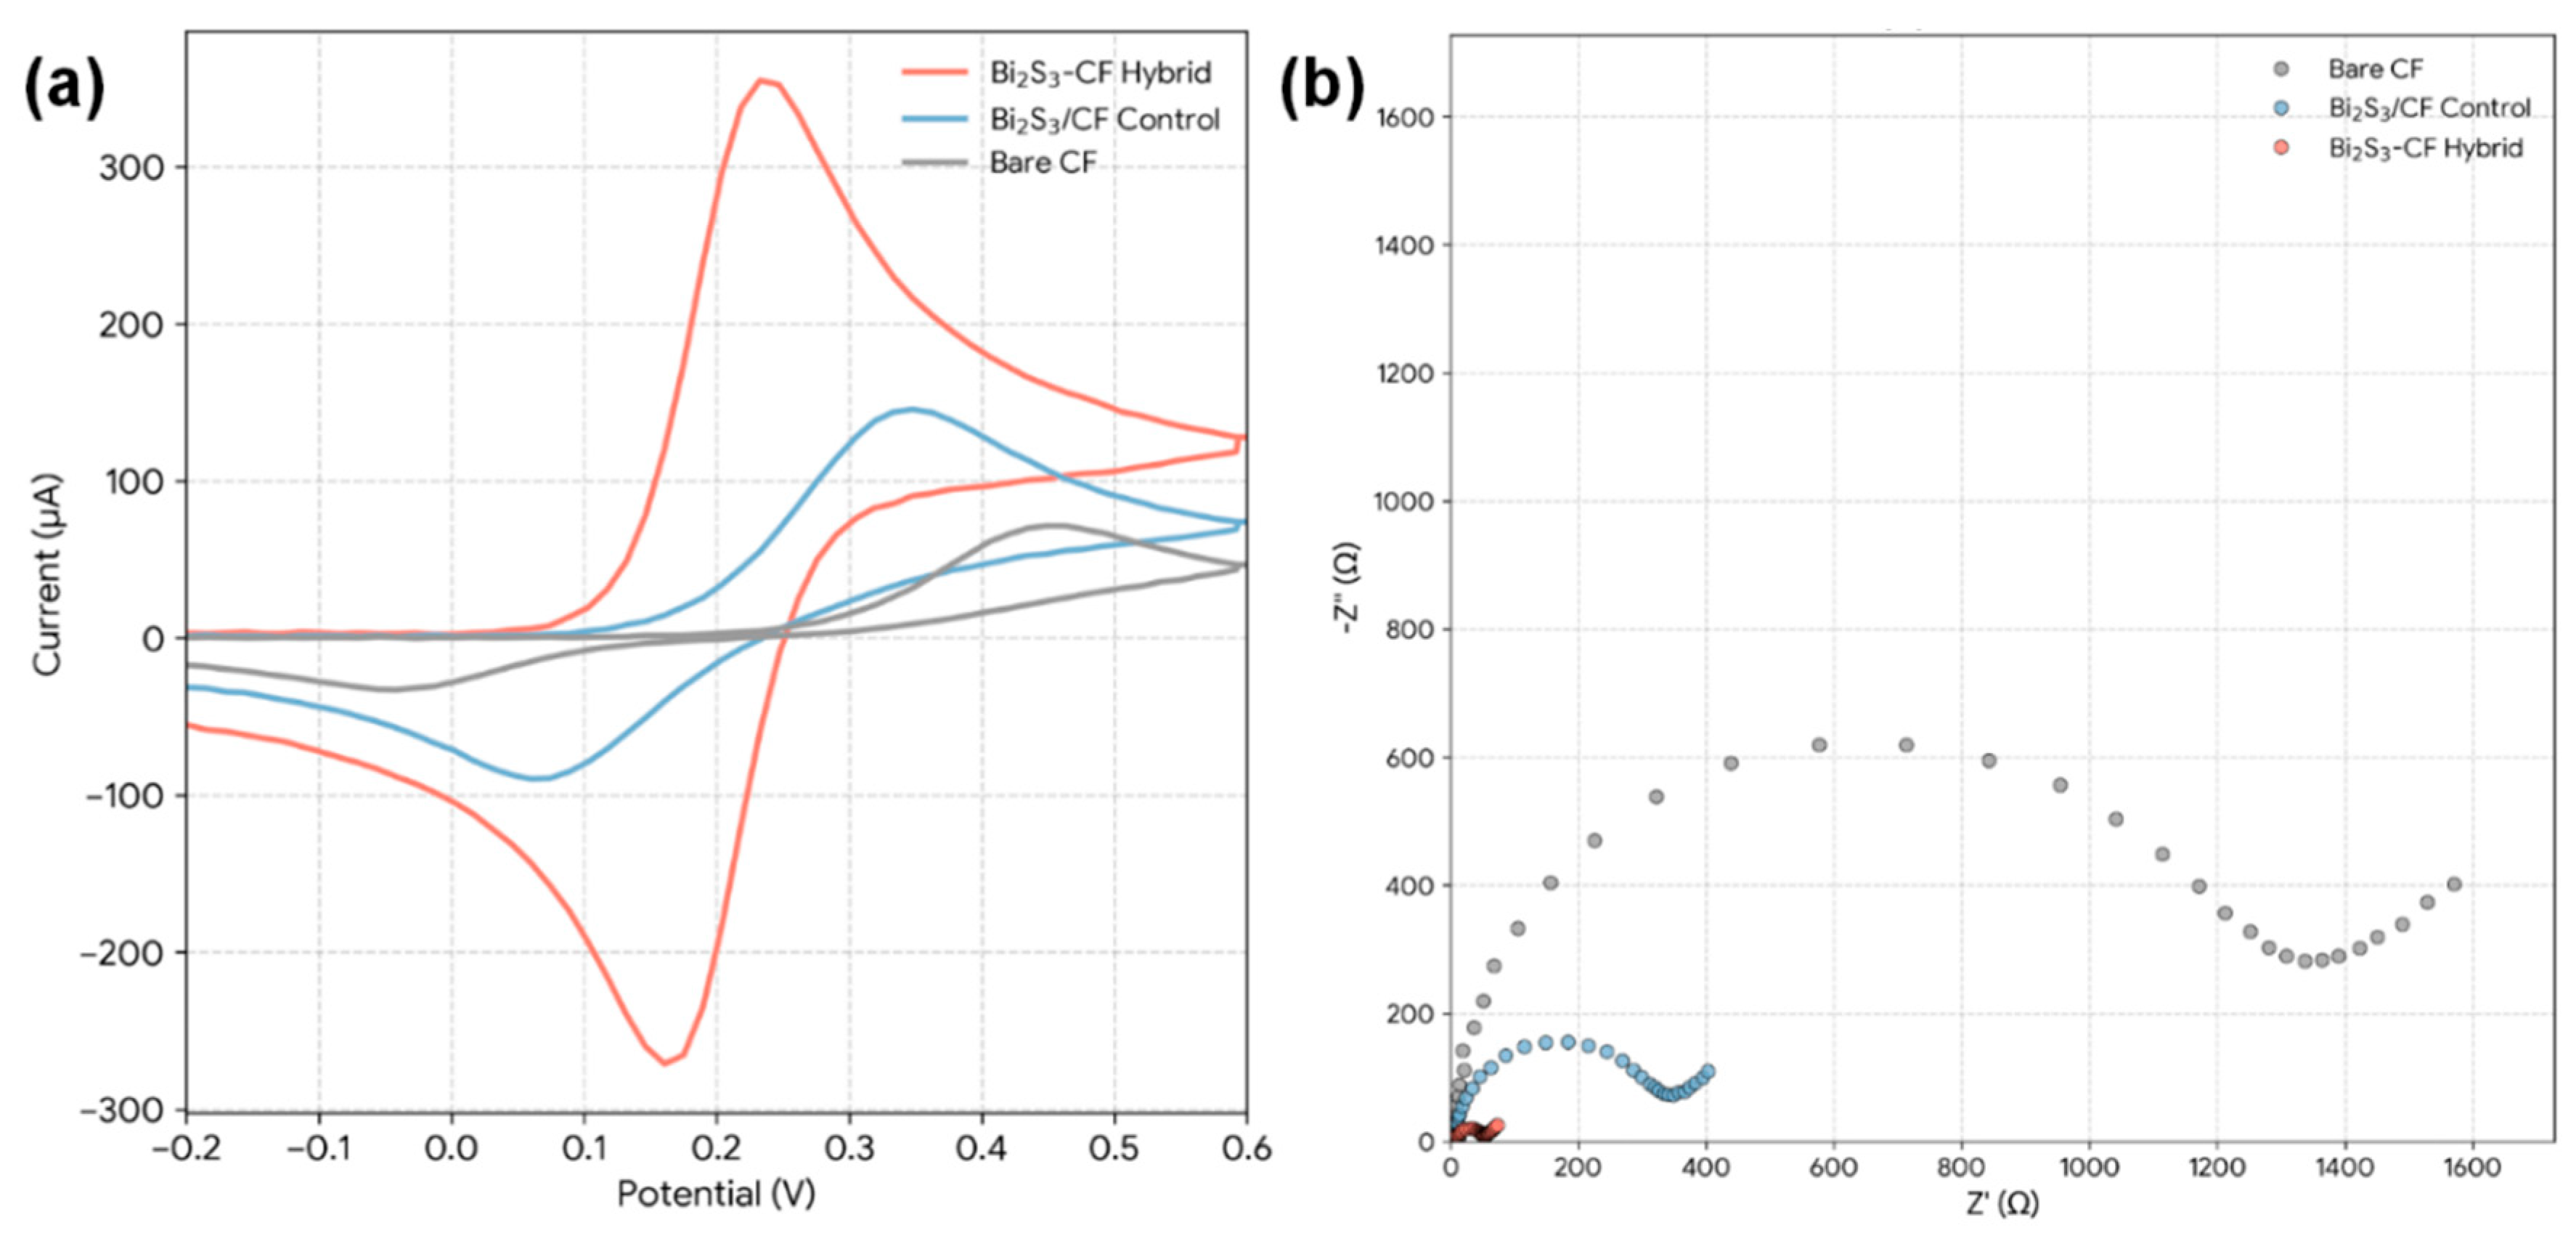
Figure 5: (a) CVs of Bare CF, drop-cast Bi2S3/CF control electrode, and in-situ Bi2S3-CF hybrid electrode recorded in 5.0 mM [Fe(CN)6]3−/4− containing 0.1 M KCl. (b) Nyquist plots obtained by EIS under the same electrolyte conditions.
3.5 Optimization of ZEA Detection Parameters
With the superior material properties of the Bi2S3-CF hybrid established, we proceeded to optimize its electrochemical response to ZEA. ZEA contains a phenolic hydroxyl group, which can be electrochemically oxidized. First, the effect of the supporting electrolyte pH on the DPV signal was investigated for 100 ng/mL ZEA (Fig. 6a). As shown in the plot of peak current versus pH (Fig. 6b), the oxidation peak current increases from pH 4.0 to 6.0, and then decreases as the solution becomes more basic. This bell-shaped curve is typical for phenolic compounds. At low pH, the phenolic group is fully protonated and more difficult to oxidize. As pH increases, deprotonation is facilitated, leading to an easier oxidation. However, at pH > 6.0, the ZEA molecule (and potentially the sensor surface) may become negatively charged, causing electrostatic repulsion and a decrease in signal. Therefore, a pH of 6.0 was selected as the optimal condition for all subsequent experiments.
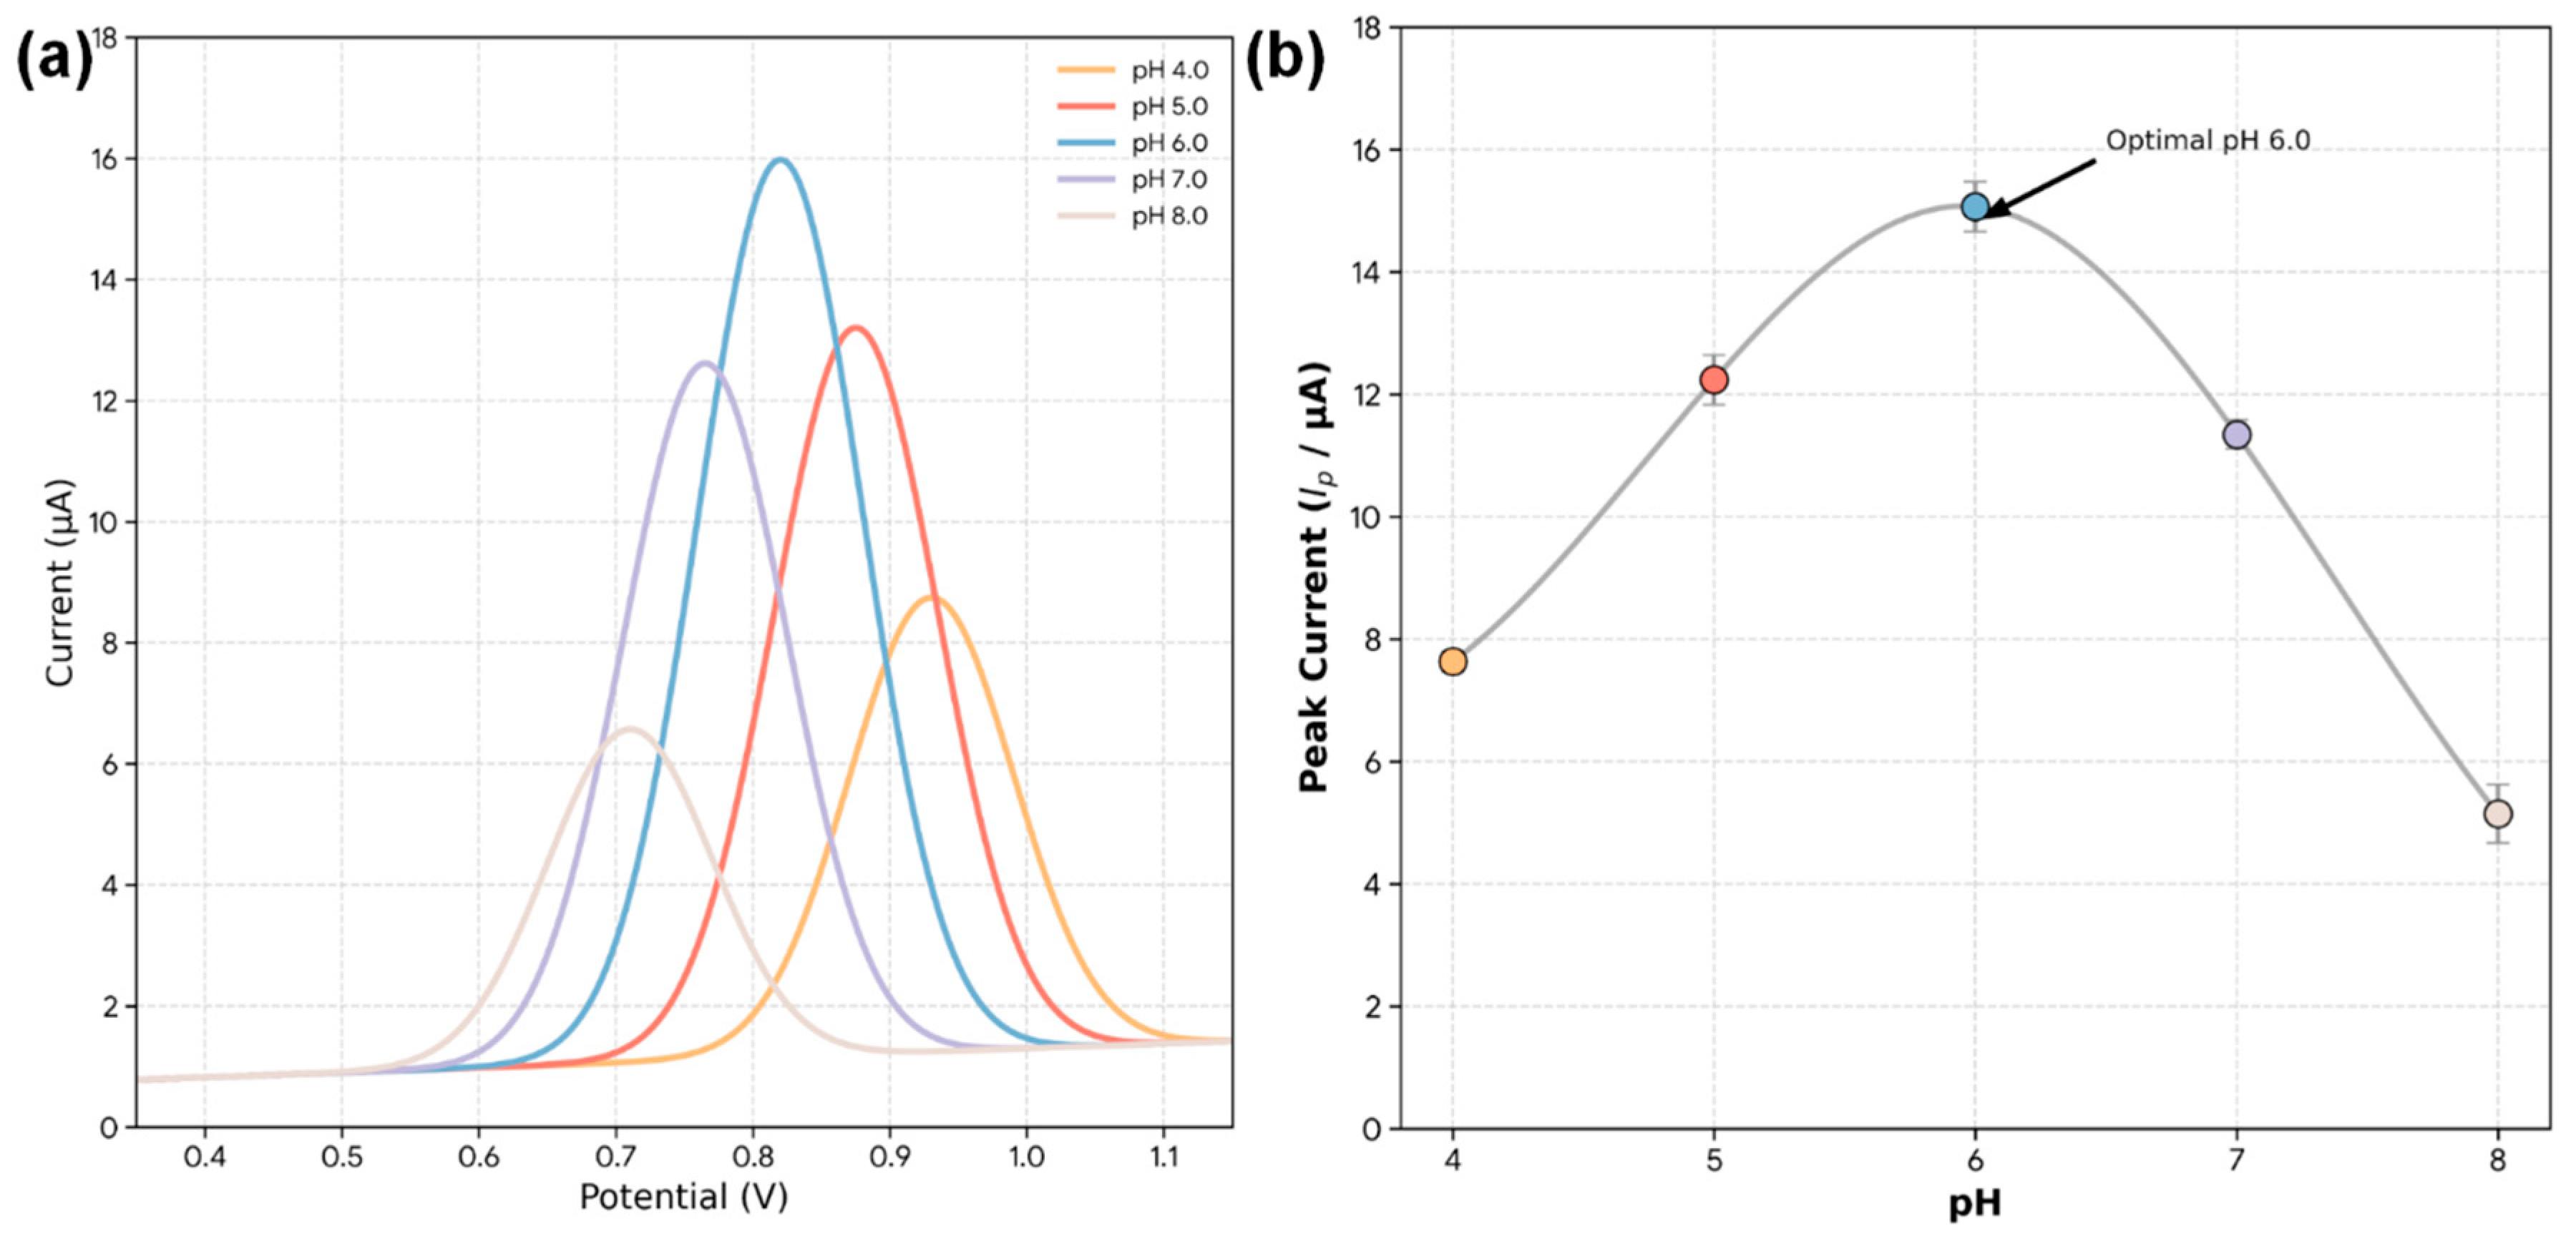
Figure 6: Effect of pH on the electrochemical oxidation of ZEA at the Bi2S3-CF hybrid electrode. (a) DPV curves obtained in 0.1 M PBS of different pH values (4.0–8.0) containing 100 ng/mL ZEA. (b) Corresponding plot of oxidation peak current versus pH, showing a maximum response at pH 6.0.
Next, the effect of accumulation time was optimized (Fig. 7a). This pre-concentration step allows the high-surface-area, mesoporous electrode to adsorb ZEA from the solution prior to the DPV scan, thereby amplifying the signal. The plot of peak current versus time (Fig. 7b) shows that the DPV signal increases rapidly as more ZEA accumulates on the electrode surface, and then begins to plateau after approximately 180 s as the active sites approach saturation. An accumulation time of 180 s was thus chosen as the optimal balance between high sensitivity and rapid analysis time.
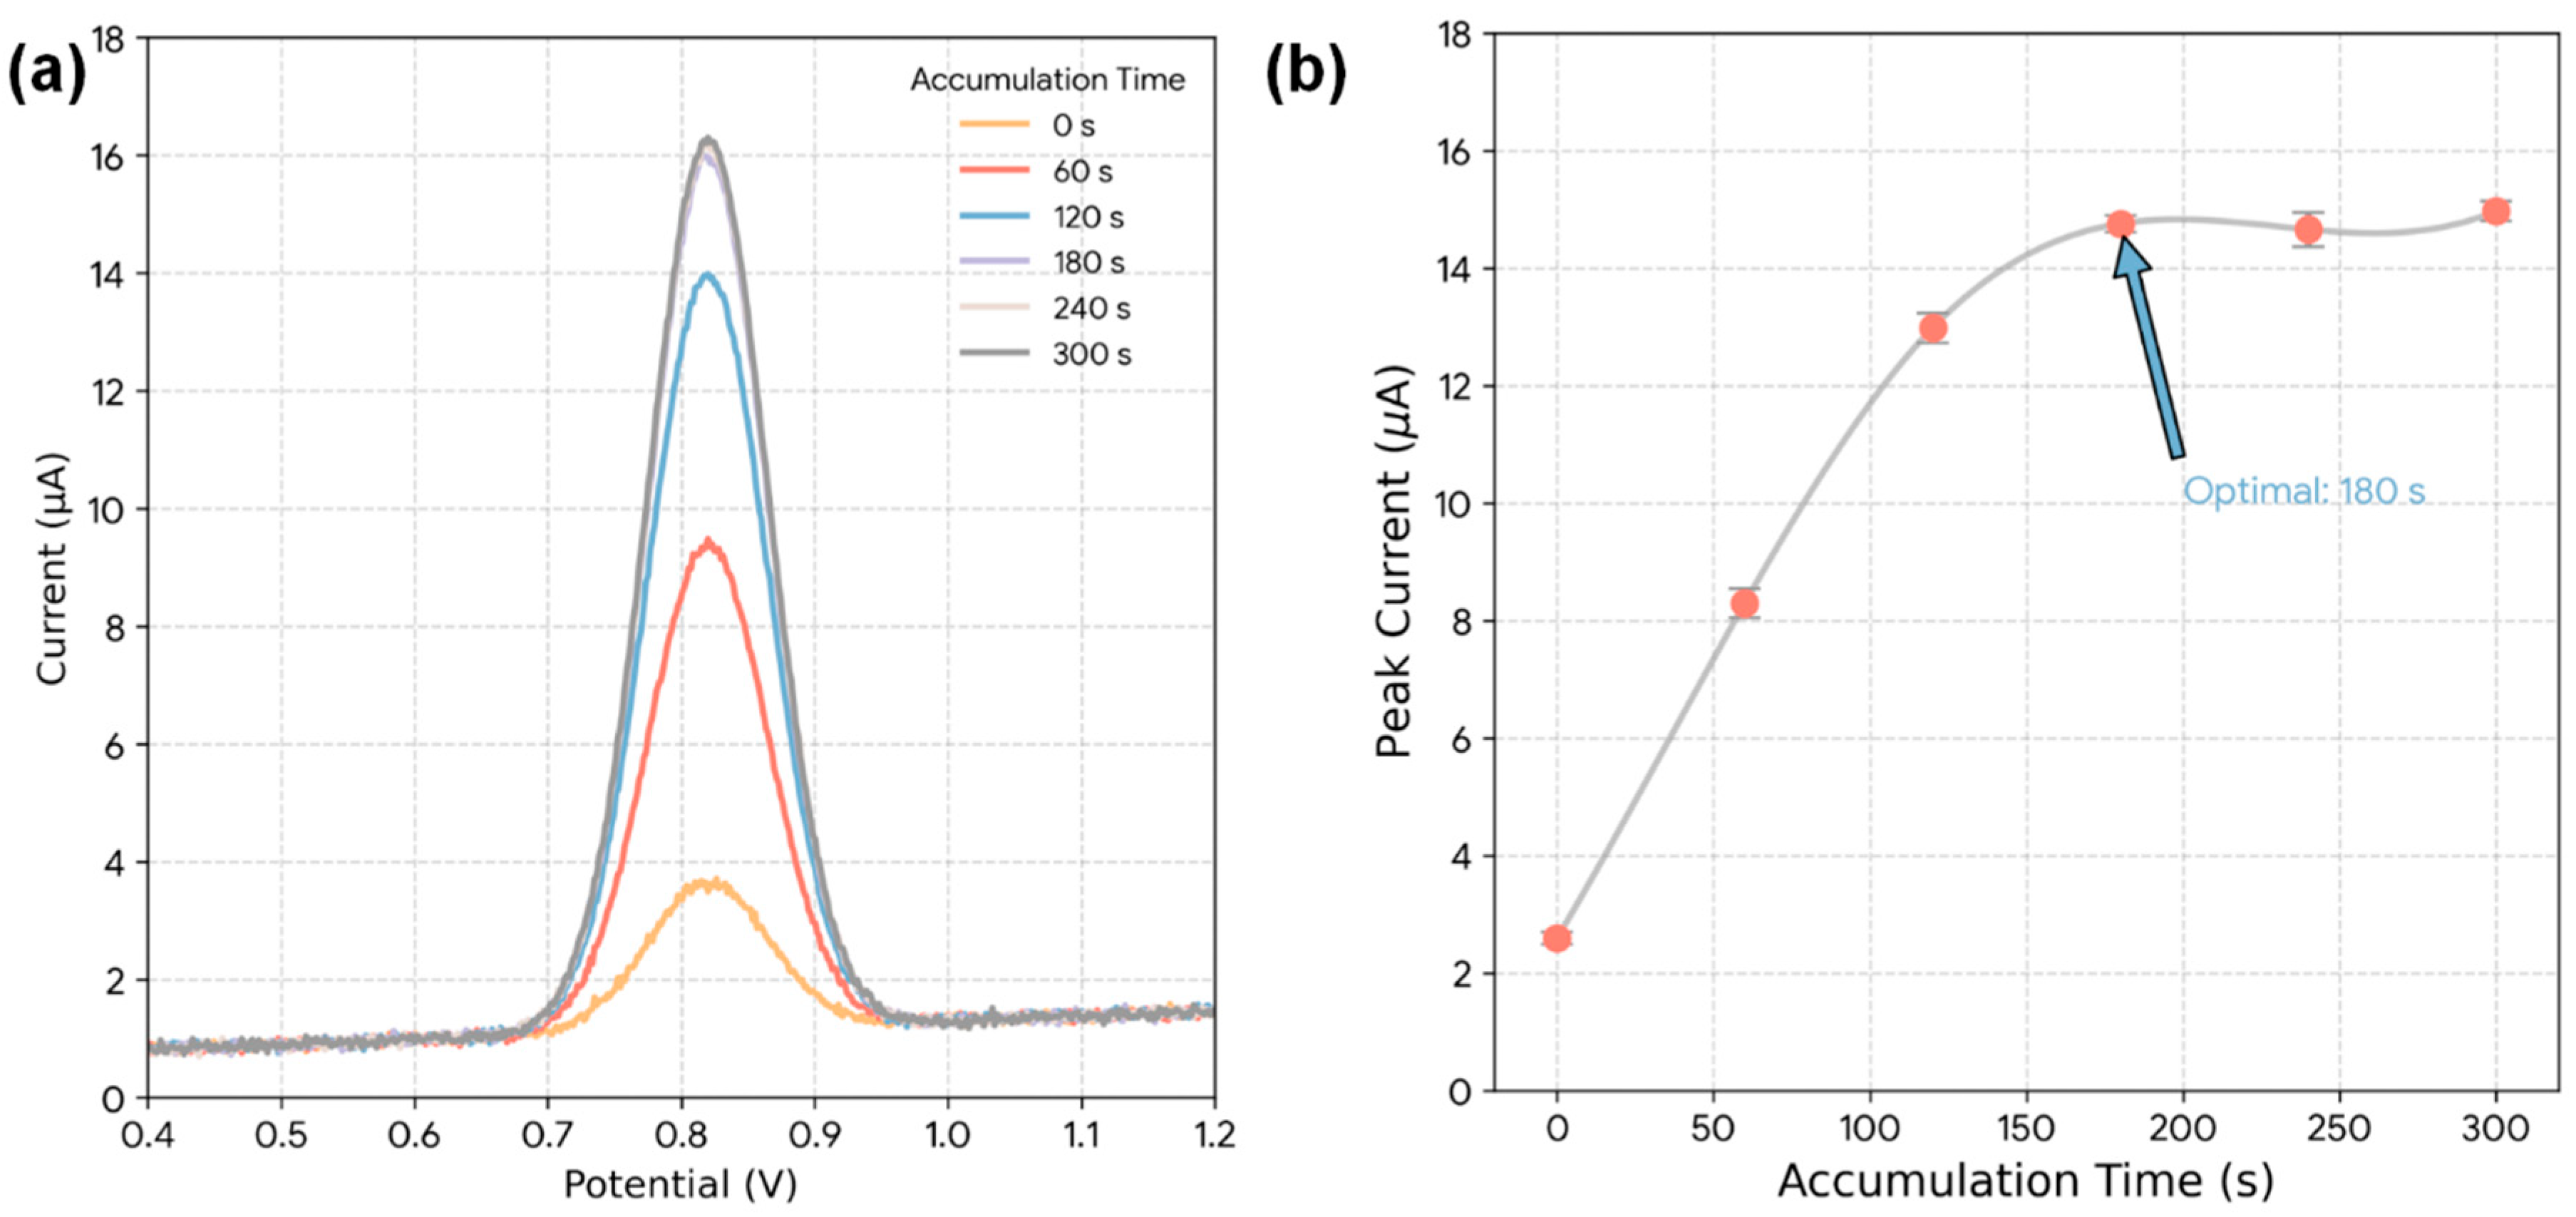
Figure 7: Effect of accumulation time on the DPV response of ZEA at the Bi2S3-CF hybrid electrode. (a) DPV curves recorded for 100 ng/mL ZEA after different accumulation times (0–300 s). (b) Plot of peak current versus accumulation time.
3.6 Analytical Performance for ZEA Detection
The analytical performance of the optimized Bi2S3-CF hybrid was benchmarked against the control electrodes (Fig. 8). In the presence of 100 ng/mL ZEA, the Bare CF electrode shows no discernible oxidation peak, demonstrating that it has no catalytic activity towards ZEA [22]. The drop-cast Bi2S3/CF control exhibits only a very weak and broad oxidation peak, with a current of ∼1.5 μA. This poor response is a direct result of its low ECSA, high Rct, and non-uniform surface. In stark contrast, the Bi2S3-CF hybrid produces a strong, sharp, and well-defined oxidation peak at ∼+0.82 V, with a peak current of ∼14.8 μA. This represents a 10-fold signal amplification compared to the drop-cast control. This figure is the ultimate “payoff” of the study: it proves that both components are required in a synergistic configuration. The superior performance of the hybrid is a direct and quantifiable consequence of the high ECSA, low Rct, and mesoporous structure created by the in-situ fabrication method [31].
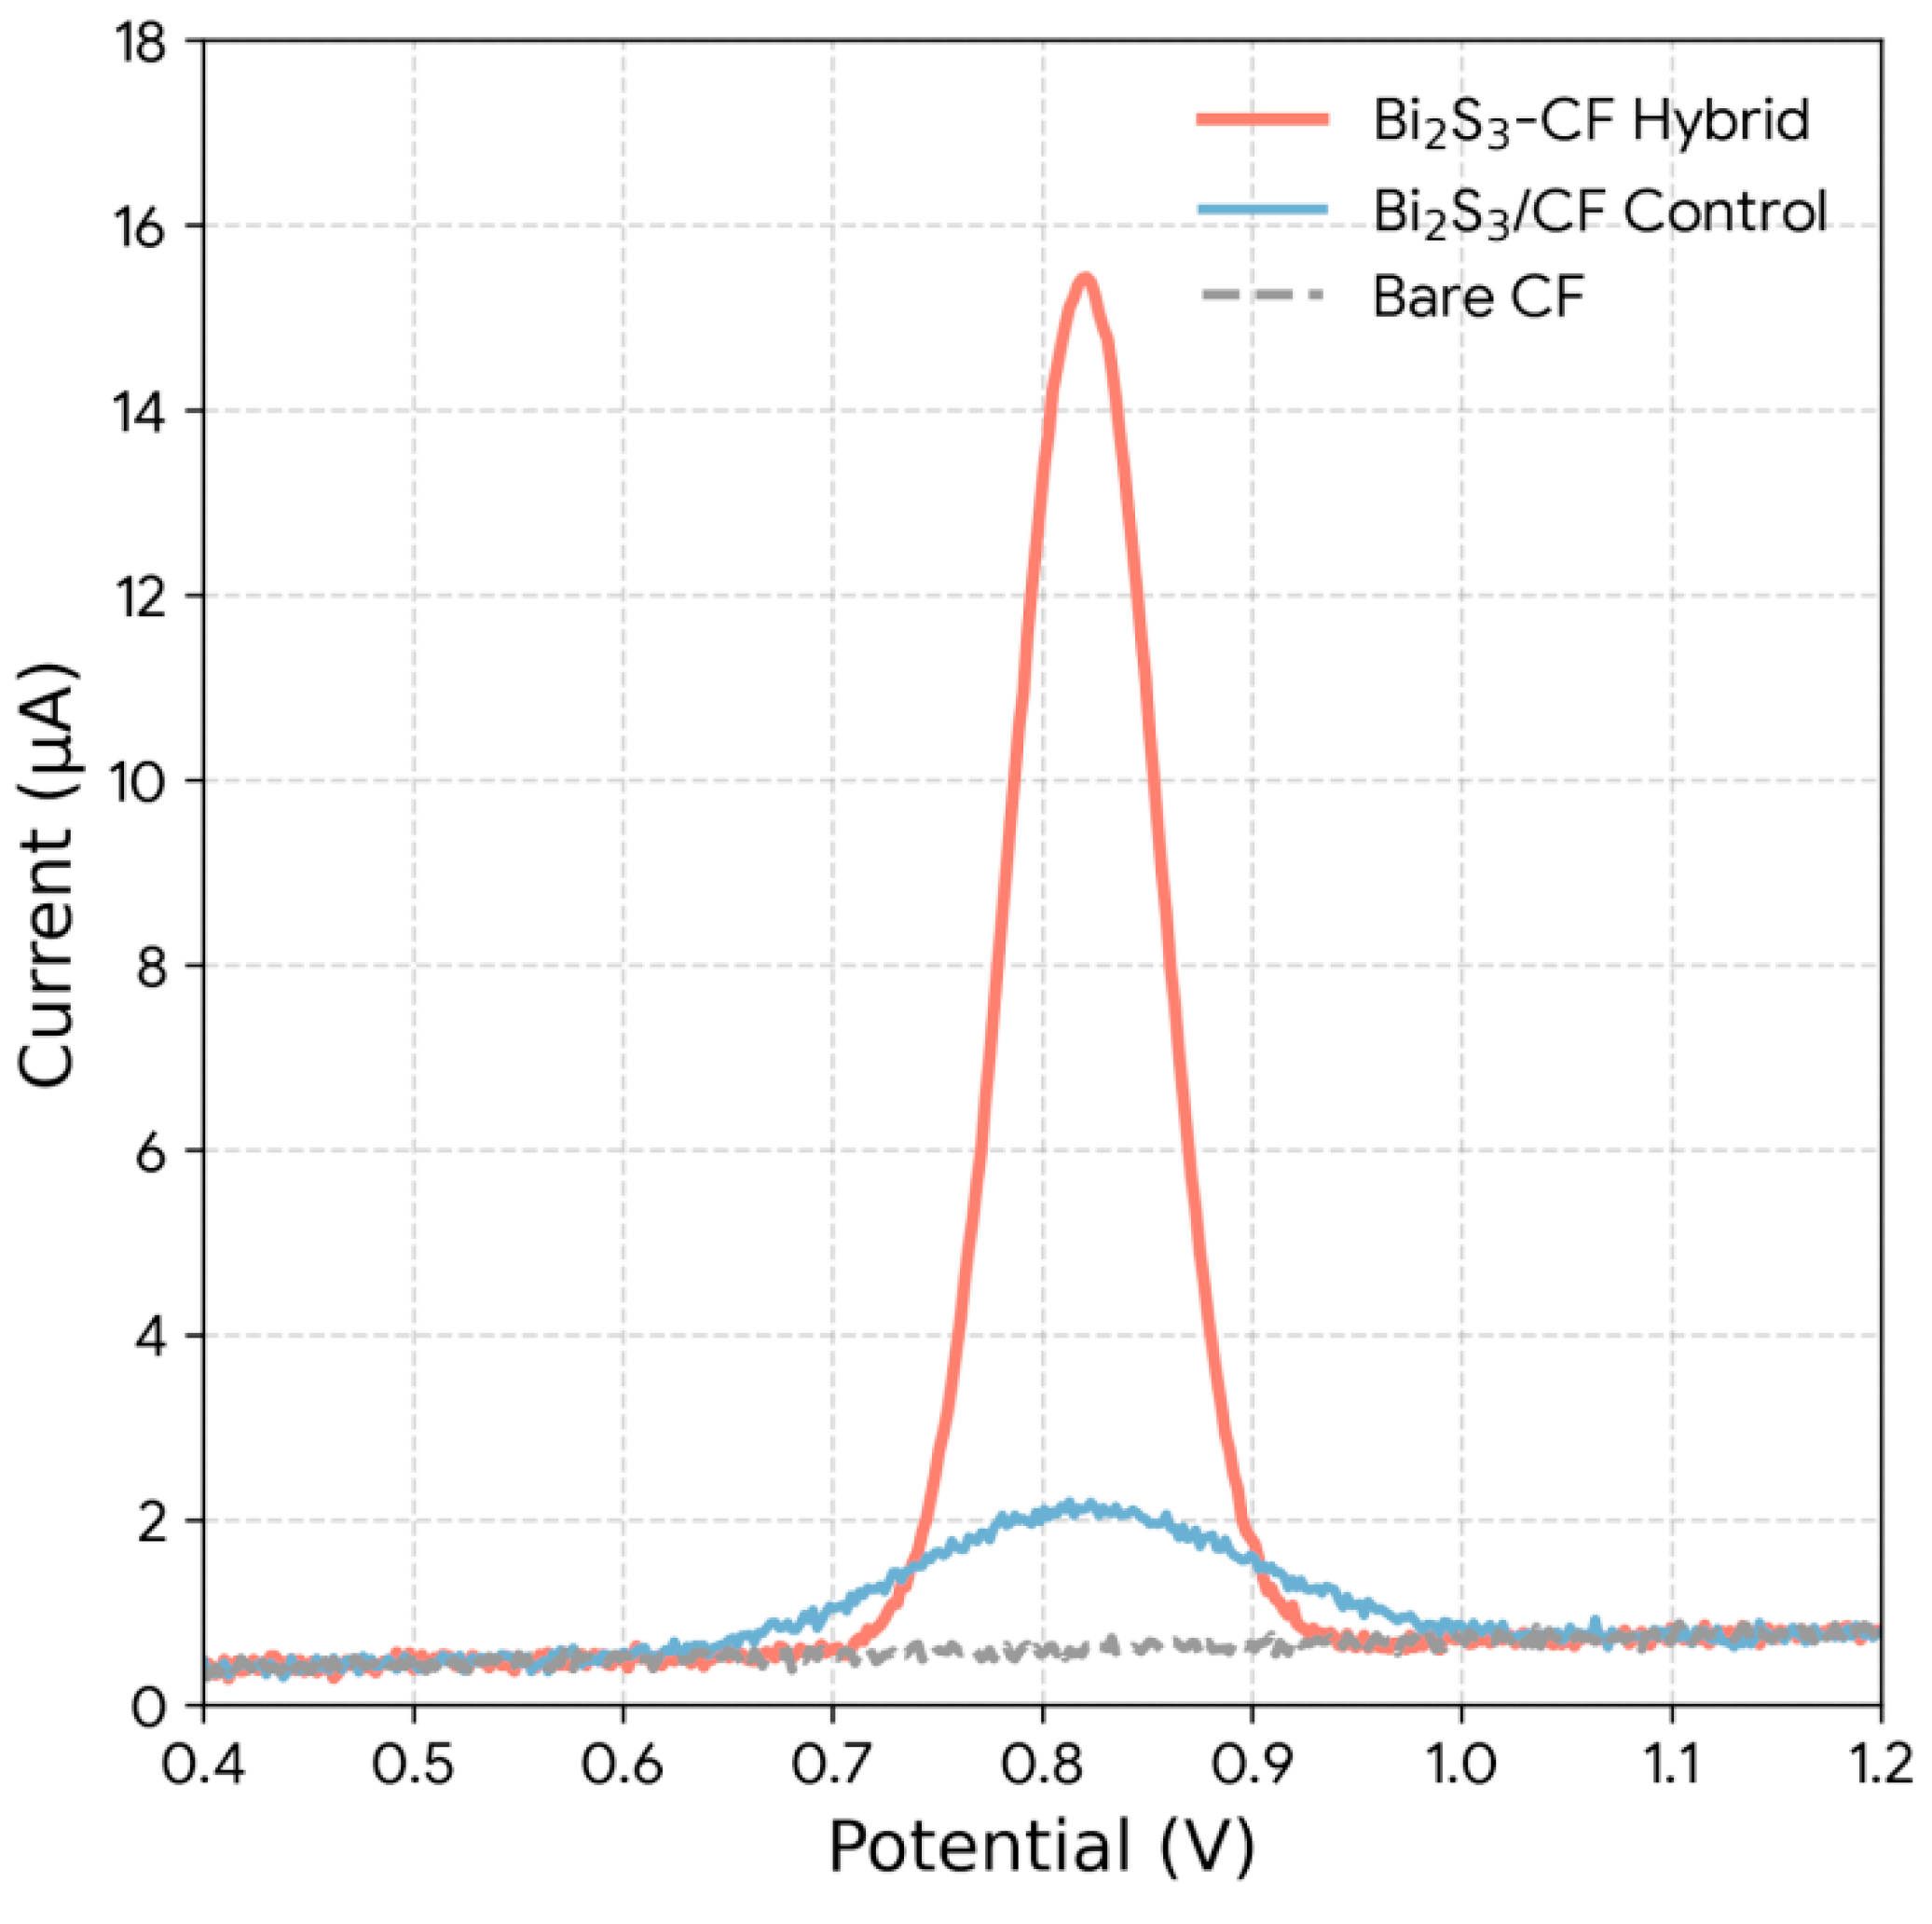
Figure 8: Comparative DPV responses of Bare CF, drop-cast Bi2S3/CF control, and the in-situ Bi2S3-CF hybrid electrode toward 100 ng/mL ZEA under optimized conditions (pH 6.0, accumulation time 180 s).
The sensitivity of the Bi2S3-CF sensor was then evaluated by recording DPV responses for increasing concentrations of ZEA under optimal conditions (Fig. 9a). The oxidation peak current at +0.82 V clearly increases in a dose-dependent manner. Fig. 9b shows the resulting calibration plot, where the peak current is plotted against the logarithm of the ZEA concentration. The plot is highly linear, with a linear regression equation of Ip (μA) = 1.8 + 5.5 × log[ZEA (ng/mL)] and an excellent correlation coefficient (R2) of 0.999. The linear dynamic range was determined to be from 0.01 ng/mL to 200 ng/mL. The limit of detection (LOD) was calculated using the 3σ/slope approach, where σ represents the standard deviation of the blank response obtained from repeated DPV measurements in 0.1 M PBS (pH 6.0) containing 0 ng/mL ZEA under the same accumulation and scan conditions. The blank trace shows only a non-faradaic background current without a discernible oxidation peak at ~+0.82 V; therefore, σ was computed from the baseline-corrected current at the ZEA peak potential (i.e., the analytical readout used for calibration). The LOD was found to be 0.003 ng/mL (3 pg/mL) [22]. This ultralow detection limit is several orders of magnitude lower than the stringent regulatory limits set by the EFSA (e.g., 50 μg/kg = 50 ng/mL), confirming the sensor is exceptionally well-suited for food safety screening.
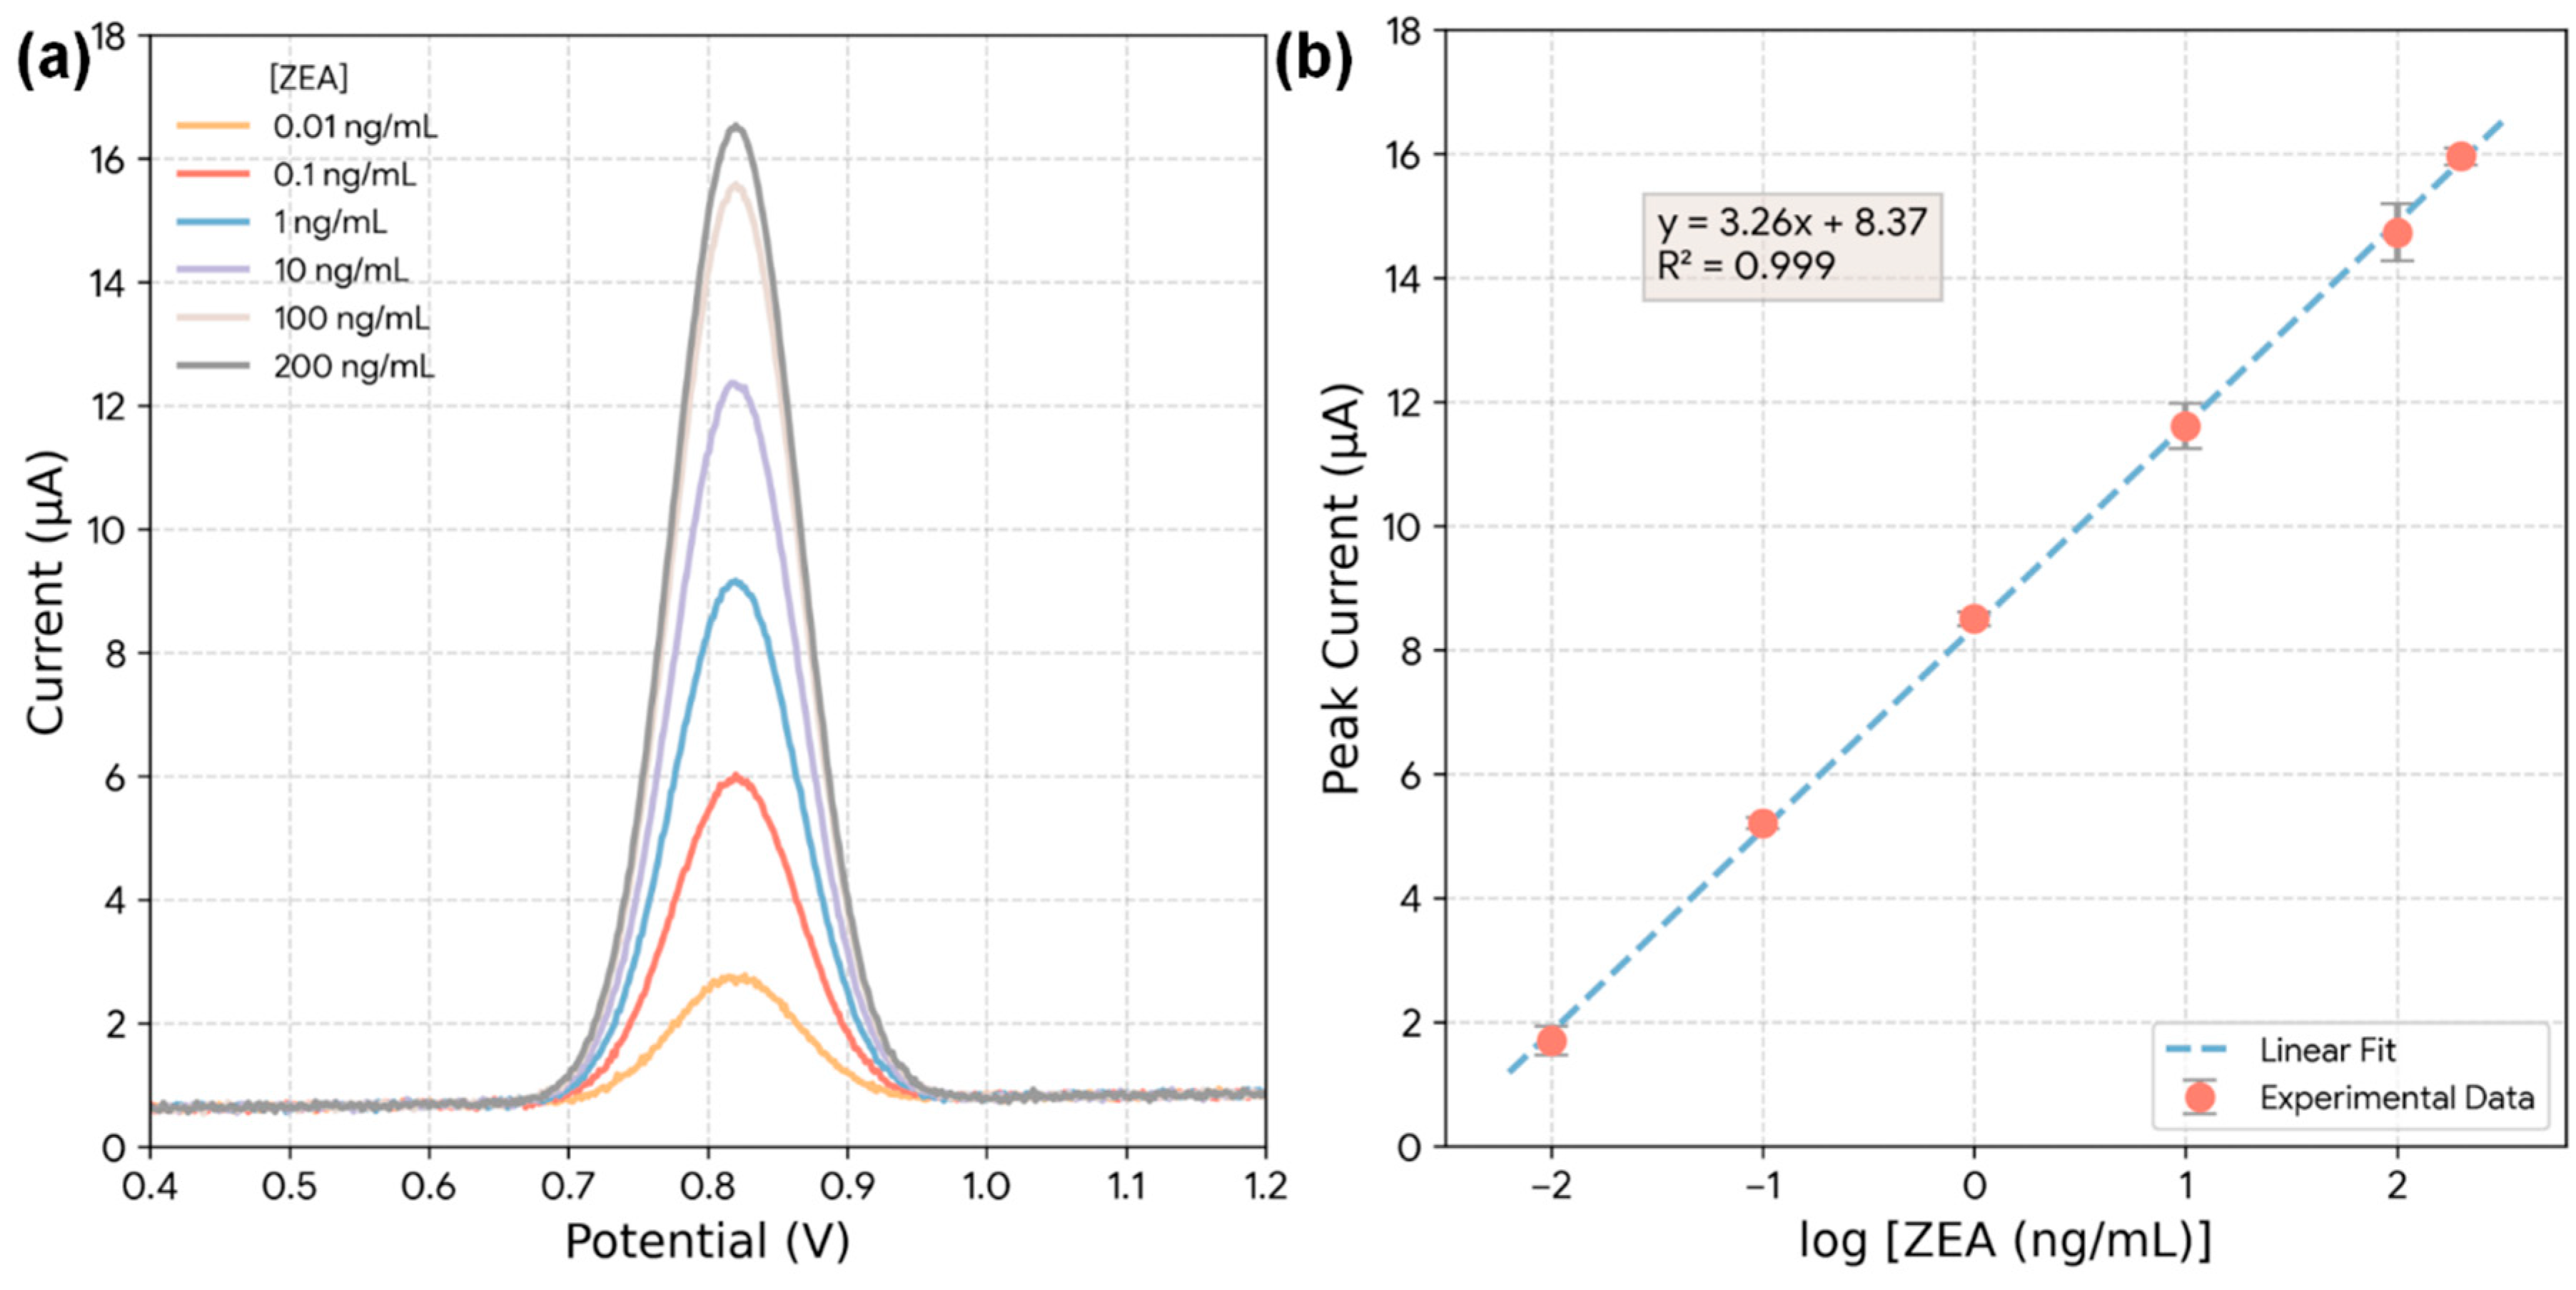
Figure 9: (a) DPV curves of the Bi2S3-CF hybrid electrode recorded at increasing ZEA concentrations (0.01–200 ng/mL) under optimized conditions (pH 6.0, 180 s accumulation). (b) Calibration plot of peak current versus log (ZEA concentration).
To contextualize this performance, the Bi2S3-CF sensor was compared with other electrochemical sensors for ZEA reported in the literature (Table 2). Our sensor demonstrates a linear range and LOD that is highly competitive with, or superior to, other state-of-the-art sensors, many of which require complex fabrication steps or biological recognition elements like aptamers [31]. It vastly outperforms simple, unmodified electrodes [32]. This comparison validates our in-situ hybrid material as a top-tier sensing platform.
Table 2: Comparison of the analytical performance of various ZEA electrochemical sensors.
| Electrode Material | Method | Linear Range (ng/mL) | LOD (ng/mL) | Reference |
|---|---|---|---|---|
| Bi2S3-CF (This Work) | DPV | 0.01–200 | 0.003 | This work |
| PdNP/polymeric ionic liquid nanocomposite on GCE (PdVC-PIL/GCE) | SWV | 0.03–35 | 0.01 | [33] |
| Homogeneous electrochemical aptasensor (DNA assembly, RecJf Exo) | DPV | 5.0 × 10⁻⁶–50 | 5.1 × 10⁻⁷ | [34] |
| Single-use pencil graphite electrode (PGE, ZentoSens) | DPV | — | 29.47 | [35] |
| Exo I & branched HCR electrochemical aptasensor | DPV | 0.0032–318 | 9.9 × 10⁻⁴ | [36] |
3.7 Sensor Validation: Selectivity, Reproducibility, and Stability
A practical sensor must not only be sensitive but also selective, reproducible, and stable. The selectivity of the Bi2S3-CF sensor was evaluated by measuring its DPV response to 100 ng/mL ZEA in the presence of a 100-fold excess (10,000 ng/mL) of potential interfering species commonly found in food. These included other mycotoxins (Aflatoxin B1, Ochratoxin A, Fumonisin B1) and other electroactive molecules (ascorbic acid, glucose) [37]. The quantitative data in Table 3 show that none of these interferents produced a significant signal, with all relative responses being less than 5% of the ZEA signal. This demonstrates the high selectivity of the sensor, which is likely due to a specific electrocatalytic affinity of the Bi2S3 nanorod surface for the ZEA molecule’s phenolic structure.
Table 3: Selectivity study of the Bi2S3-CF sensor.
| Interfering Species | Concentration (ng/mL) | DPV Signal (μA) | Relative Response (%) |
|---|---|---|---|
| ZEA (Target) | 100 | 14.82 | 100 |
| Aflatoxin B1 (AFB1) | 10,000 | 0.45 | 3.0 |
| Ochratoxin A (OTA) | 10,000 | 0.61 | 4.1 |
| Fumonisin B1 (FB1) | 10,000 | 0.28 | 1.9 |
| Ascorbic Acid | 10,000 | 0.52 | 3.5 |
| Glucose | 10,000 | 0.19 | 1.3 |
The reproducibility of the sensor was assessed through intra-assay and inter-assay precision tests. The intra-assay relative standard deviation (RSD) for 10 consecutive measurements on a single electrode was found to be 1.94% (Fig. 10a). The inter-assay RSD, determined by measuring the same ZEA concentration on ten independently fabricated Bi2S3-CF electrodes (Fig. 10b), was 3.1% [38]. These low RSD values (<5%) confirm that the in-situ hydrothermal fabrication process is highly reliable and produces electrodes with consistent performance. The long-term stability of the sensor was monitored over 30 days, with the electrode stored at 4°C when not in use. As shown in Fig. 10c, the sensor retained over 95% of its initial DPV signal after 30 days. This excellent stability is attributed to the robust, chemically-bonded nature of the in-situ hybrid, which prevents the catalytic Bi2S3 material from delaminating or leaching from the CF substrate [38].
Finally, the practical applicability of the sensor was validated in real cereal matrices using a standard addition quantification protocol, which is widely adopted to minimize matrix effects in food analysis. In each matrix extract, ZEA was quantified from the standard-addition regression (x-intercept approach), and the same procedure was applied to spiked extracts to calculate recoveries (Table 4). A representative standard addition plot obtained in corn flour extract is shown in Fig. 10d, demonstrating linear response in the matrix and enabling accurate back-calculation of ZEA concentration. ZEA-free extracts from corn flour, wheat flour, and oat flakes were spiked with known concentrations of ZEA. Fig. 10d shows a representative standard addition plot for a corn flour extract, where the linear increase in DPV signal allows for accurate quantification of the spiked amount. The complete recovery data is summarized in Table 4. The recovery values for all samples ranged from 97.2% to 103.4%, with RSDs below 3.2% [5]. These excellent results demonstrate that the complex matrix of real cereal extracts does not interfere with the sensor’s accuracy. This validation confirms that the Bi2S3-CF hybrid electrode is a robust and reliable tool for the practical, on-site screening of ZEA in food.
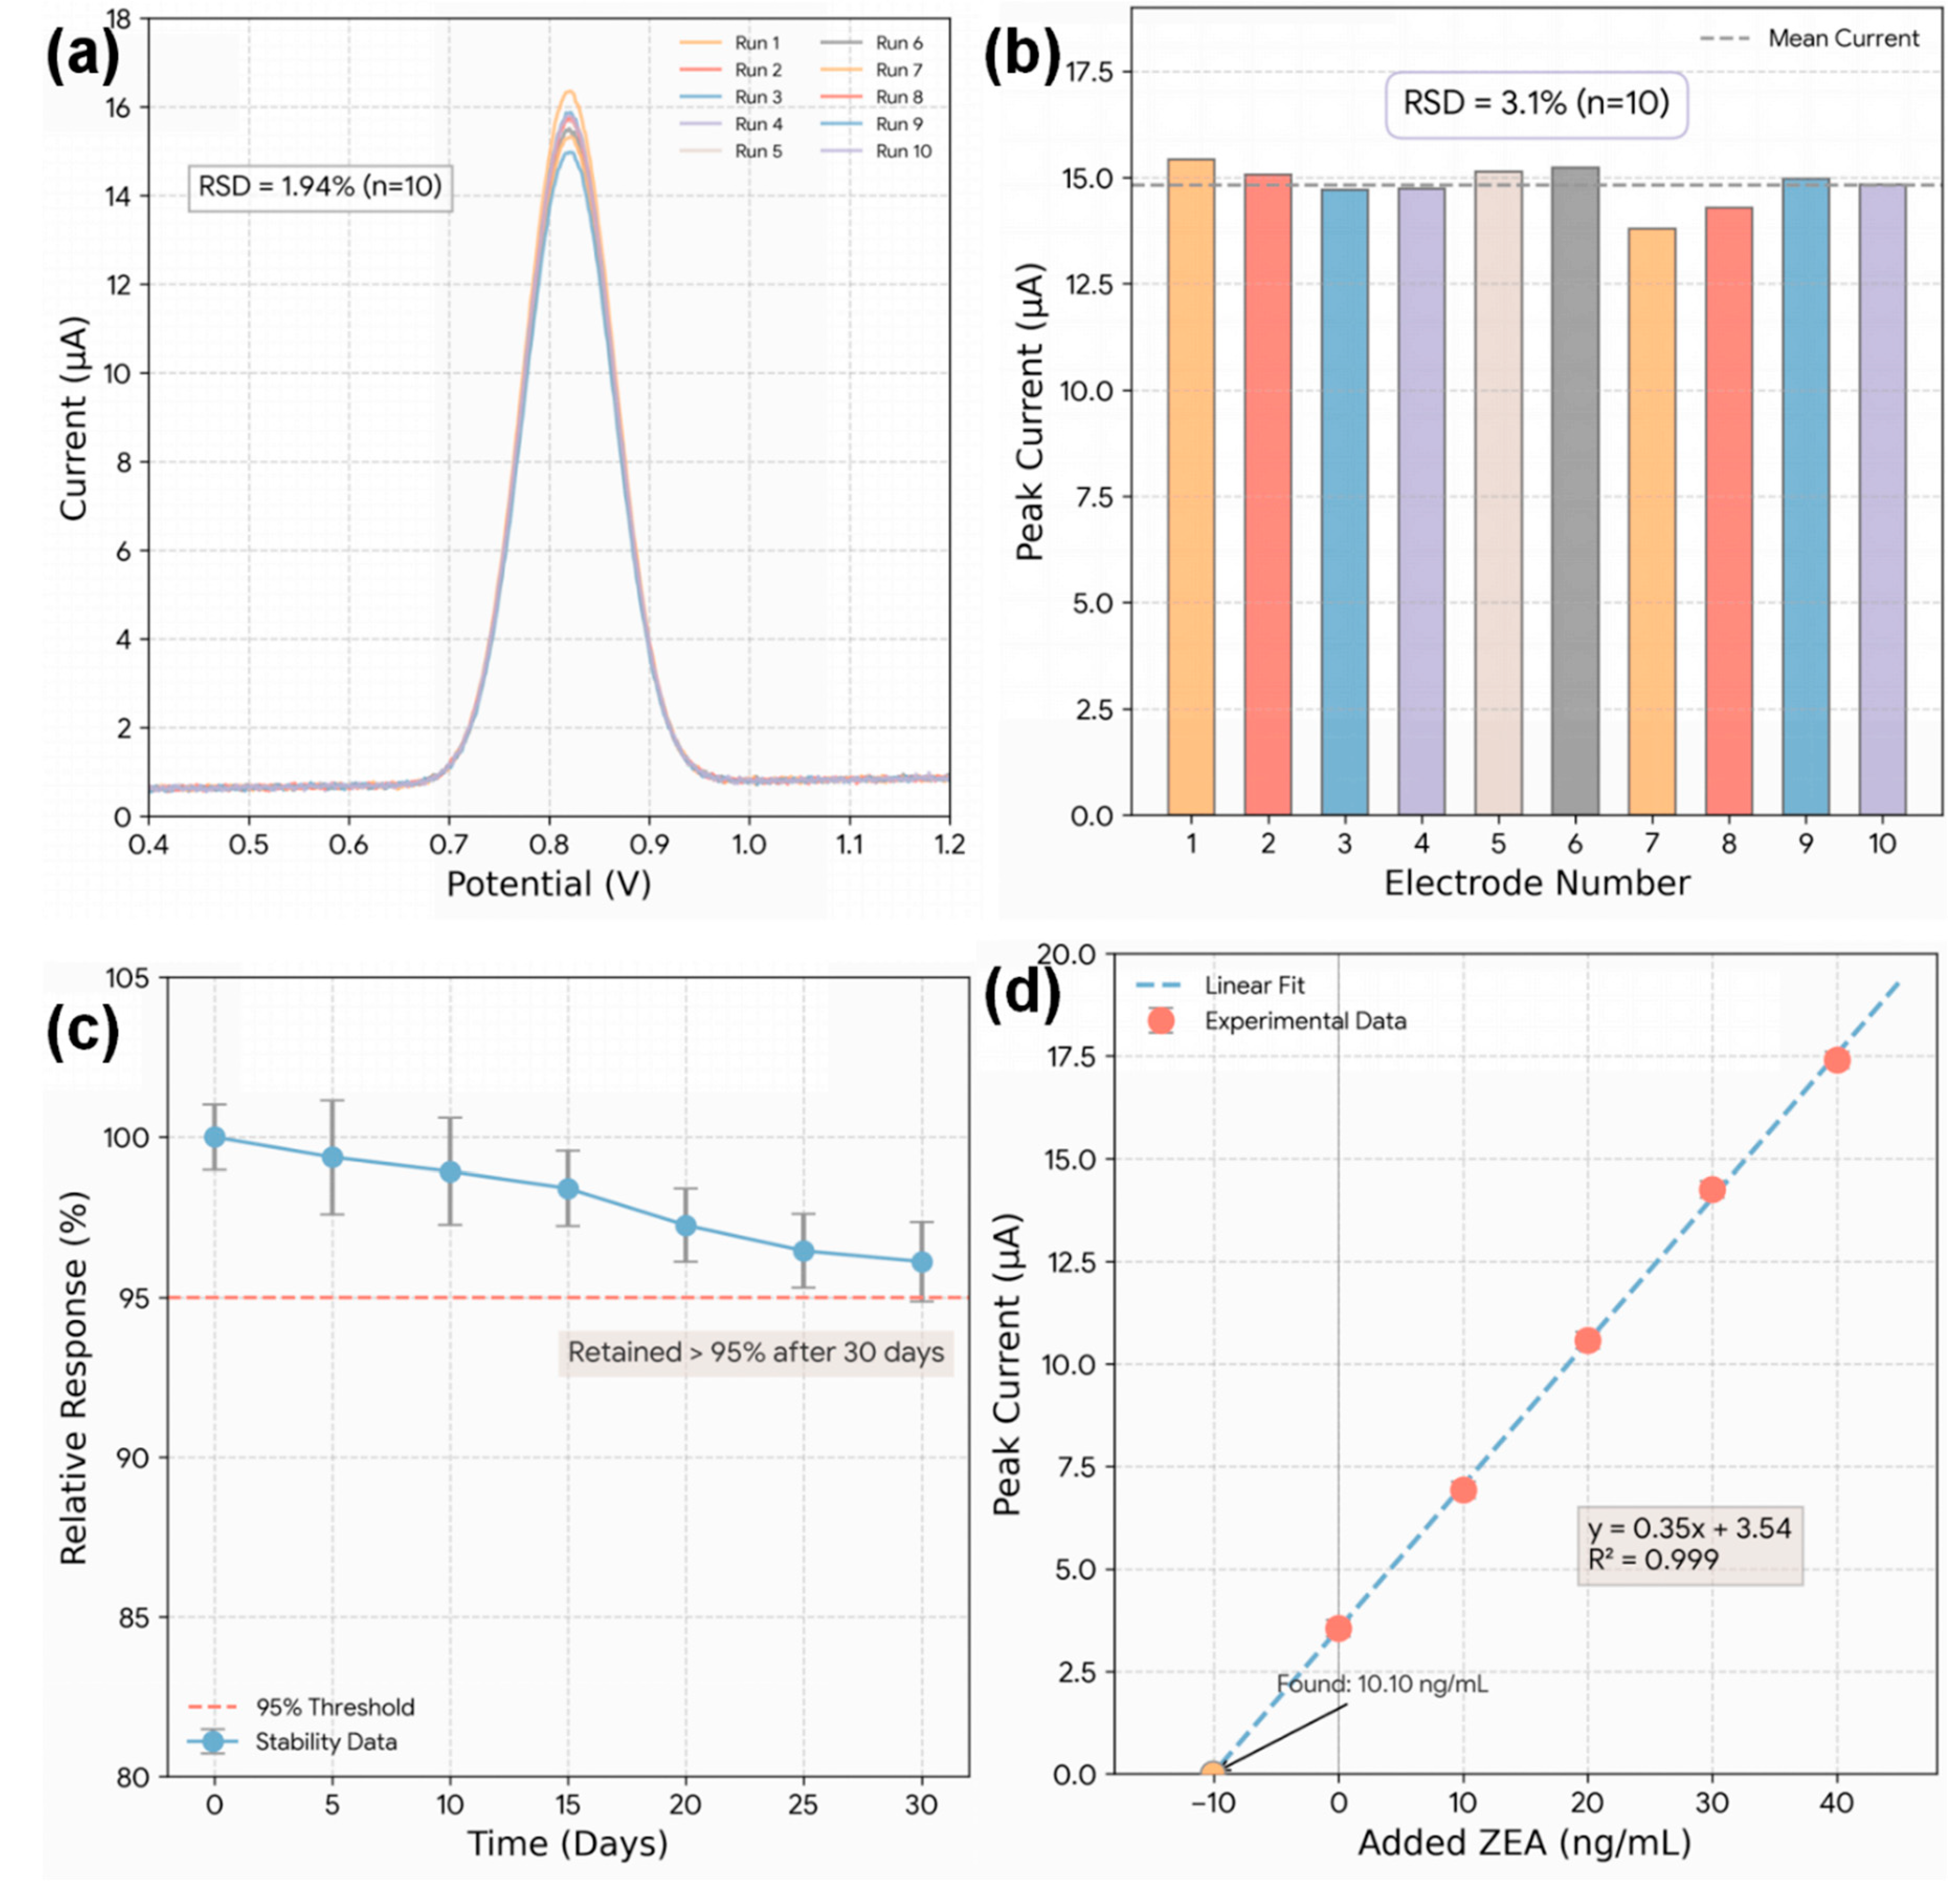
Figure 10: (a) Intra-assay reproducibility test showing DPV responses from 10 consecutive measurements using a single Bi2S3-CF electrode. (b) Inter-assay reproducibility assessment using ten independently fabricated Bi2S3-CF electrodes. (c) Long-term stability evaluation indicating that more than 95% of the initial signal is retained after 30 days of storage at 4°C. (d) Representative standard addition plot obtained from corn flour extract, demonstrating accurate quantitative recovery of spiked ZEA in real cereal matrices.
Table 4: Spike and recovery validation of ZEA in cereal samples (n = 3).
| Sample | ZEA Added (ng/mL) | ZEA Found (ng/mL) | Recovery (%) | RSD (%) |
|---|---|---|---|---|
| Corn Flour | 10.0 | 9.87 | 98.7 | 2.9 |
| 50.0 | 51.15 | 102.3 | 2.1 | |
| 100.0 | 103.4 | 103.4 | 2.4 | |
| Wheat Flour | 10.0 | 10.12 | 101.2 | 3.1 |
| 50.0 | 48.60 | 97.2 | 2.7 | |
| 100.0 | 99.10 | 99.1 | 2.3 | |
| Oat Flakes | 50.0 | 50.85 | 101.7 | 2.5 |
| 100.0 | 102.80 | 102.8 | 2.8 |
In summary, this research successfully demonstrated the fabrication of a novel Bi2S3 nanorod–carbon fiber (Bi2S3-CF) hybrid electrode via a facile, one-pot, in-situ hydrothermal method. This fabrication strategy was shown to be decisively superior to conventional drop-casting, creating a seamlessly integrated, 3D hierarchical electrode. Exhaustive material characterization confirmed the uniform growth of phase-pure, orthorhombic Bi2S3 nanorods directly onto the activated CF substrate. The key finding of this work was the powerful structural and electronic synergy of this hybrid. These superior material properties translated directly to outstanding analytical performance for the electrochemical detection of Zearalenone. The Bi2S3-CF sensor, optimized using DPV, exhibited an ultralow limit of detection of 0.003 ng/mL and a wide linear range from 0.01 ng/mL to 200 ng/mL, performance that is competitive with the most advanced sensors in the literature. Furthermore, the sensor demonstrated high selectivity against common mycotoxins and interferents, excellent reproducibility (RSD < 3.2%), and exceptional long-term stability, retaining over 95% of its signal after 30 days. The practical utility of the sensor was conclusively validated in real corn, wheat, and oat samples, which showed excellent recovery rates. This confirms the sensor’s robustness against complex matrix effects. This study establishes the in-situ grown Bi2S3-CF hybrid as a powerful, low-cost, and highly sensitive platform, addressing a critical need for rapid and reliable on-site screening of ZEA in the food safety industry. This work also highlights the broader potential of in-situ grown chalcogenide-carbon composites for a new generation of high-performance electrochemical sensors.
Acknowledgement:
Funding Statement: This work has been supported by 2025 Science and Technology Plan Project of Taizhou (Research on key technologies for constructing novel biosensors, Grant No. 25gyb22); 2024 Taizhou Vocational & Technical College Research Launch Fund (2024GCC06); General Project of Chongqing Natural Science Foundation (Grant No. CSTB2025NSCQ-GPX0105); Science and Technology Research Program of Chongqing municipal Education Commission (Grant No. KJZD-K202503902).
Author Contributions: Feifei Tong contributed to conceptualization, methodology, investigation, data curation, and writing—original draft. Junliang Han contributed to methodology, formal analysis, validation, and visualization. Chuansheng Tang contributed to conceptualization, supervision, project administration, funding acquisition, and writing—review & editing. Jie Yang contributed to investigation, resources, and validation. Shibo Luo contributed to investigation and data curation. Xinmeng Wu contributed to formal analysis and visualization. All authors reviewed and approved the final version of the manuscript.
Availability of Data and Materials: The data that support the findings of this study are available from the corresponding author upon reasonable request.
Ethics Approval: Not applicable.
Conflicts of Interest: The authors declare no conflicts of interest.
References
1. Yu J , Pedroso IR . Mycotoxins in cereal-based products and their impacts on the health of humans, livestock animals and pets. Toxins. 2023; 15: 480. doi:10.3390/toxins15080480. [Google Scholar] [CrossRef]
2. Ibrahimagić A , Durmišević J , Bečić S , Kovač I , Kasapović D . Detection, distribution and prevalence of toxigenic zearalenone in food for human and animal consumption in Bosnia and Herzegovina. Eur J Med Health Sci. 2025; 7: 37– 41. doi:10.24018/ejmed.2025.7.4.2348. [Google Scholar] [CrossRef]
3. Yu H , Zhang J , Chen Y , Zhu J . Zearalenone and its masked forms in cereals and cereal-derived products: A review of the characteristics, incidence, and fate in food processing. J Fungi. 2022; 8: 976. doi:10.3390/jof8090976. [Google Scholar] [CrossRef]
4. Chain EP on C in the F . Scientific Opinion on the risks for public health related to the presence of zearalenone in food. EFSA J. 2011; 9: 2197. doi:10.2903/j.efsa.2011.2197. [Google Scholar] [CrossRef]
5. Liao C-D , Chiueh L-C , Shih DY-C . Determination of zearalenone in cereals by high-performance liquid chromatography and liquid chromatography-electrospray tandem mass spectrometry. J Food Drug Anal. 2020; 17: 2289. doi:10.38212/2224-6614.2289. [Google Scholar] [CrossRef]
6. Nešić KD , Pisinov BP , Jakšić SM , Tasić AМ , Savić BM , Pavlović NJ . Comparison of elisa and HPLC methods for the detection of mycotoxins by analysing proficiency test results. Zb Matice Srp Za Prir Nauk. 2017; 2017( 133): 79– 93. doi:10.2298/ZMSPN1733079N. [Google Scholar] [CrossRef]
7. Singh J , Mehta A . Rapid and sensitive detection of mycotoxins by advanced and emerging analytical methods: A review. Food Sci Nutr. 2020; 8: 2183– 204. doi:10.1002/fsn3.1474. [Google Scholar] [CrossRef]
8. Jin L , Liu W , Xiao Z , Yang H , Yu H , Dong C , et al. Recent advances in electrochemiluminescence biosensors for mycotoxin assay. Biosensors. 2023; 13: 653. doi:10.3390/bios13060653. [Google Scholar] [CrossRef]
9. Zaman GS , Waleed I , Obeid RA , Khudair SA , Al-Kahdum SAA , Al-Majdi K , et al. Electrochemical determination of zearalenone in agricultural food samples using a flower like nanocomposite-modified electrode. Mater Chem Phys. 2023; 305: 127986. doi:10.1016/j.matchemphys.2023.127986. [Google Scholar] [CrossRef]
10. Zhao L , Zhou L , Dansou DM , Tang C , Zhang J , Qin Y , et al. Ultrasensitive analyses of zearalenone in grain samples with a catalytic oxidation platform involving gold nanomaterials. Food Chem. 2024; 23: 101666. doi:10.1016/j.fochx.2024.101666. [Google Scholar] [CrossRef]
11. Zare N , Karimi-Maleh H , Zhang Z , Fu L , Rouhi J , Zhong N , et al. Enhancing cancer biomarker identification: Precise monitoring of MUC1 using V2C/Au nanocomposite-amplified electrochemical biosensor. Carbon Lett. 2025; 35: 1691– 700. doi:10.1007/s42823-025-00887-6. [Google Scholar] [CrossRef]
12. Xu Y , Wan L , Zare N , Wang S-W , Lei Z . Cr2C mxene modification of an electrochemical platform allows for highly selective and sensitive detection of psma, a prostate cancer biomarker. J Nanostructure Chem. 2025; 15: 152517. doi:10.57647/jnsc.2025.1505.17. [Google Scholar] [CrossRef]
13. Rehman NÇ , Özdemir N , Boyacıoğlu H , Yola ML . A novel molecularly imprinted electrochemical sensor based on graphitic carbon nitride nanosheets decorated bovine serum albumin@MnO2 nanocomposite for zearalenone detection. J Food Compos Anal. 2024; 125: 105857. doi:10.1016/j.jfca.2023.105857. [Google Scholar] [CrossRef]
14. Kang M , Yao Y , Yuan B , Zhang S , Oderinde O , Zhang Z . A sensitive bimetallic copper/bismuth metal-organic frameworks-based aptasensors for zearalenone detection in foodstuffs. Food Chem. 2024; 437: 137827. doi:10.1016/j.foodchem.2023.137827. [Google Scholar] [CrossRef]
15. Mavioğlu Kaya M , Deveci HA , Kaya İ , Atar N , Yola ML . The electrochemical detection of Ochratoxin A in apple juice via MnCO3 nanostructures incorporated into carbon fibers containing a molecularly imprinting polymer. Biosensors. 2023; 13: 760. doi:10.3390/bios13080760. [Google Scholar] [CrossRef]
16. Zhang H , Kong Z , Gao X , Wang J , Tian L , Yuan Y , et al. Synthesis of nanostructured bismuth sulfide with controllable morphology for advanced lithium/sodium-ion storage. Langmuir. 2022; 38: 8657– 66. doi:10.1021/acs.langmuir.2c01078. [Google Scholar] [CrossRef]
17. Qu C , Li H , Zhou S , Li G , Wang C , Snyders R , et al. BI2S3-rgo-composite-based-electrochemical-sensor-for-ascorbic-acid-detection. Chemosensors. 2021; 9( 8): 190. doi:10.3390/chemosensors9080190. [Google Scholar] [CrossRef]
18. Li Y , Weese ME , Cryan MT , Ross AE . Amine-functionalized carbon-fiber microelectrodes for enhanced ATP detection with fast-scan cyclic voltammetry. Anal Methods. 2021; 13: 2320– 30. doi:10.1039/D1AY00089F. [Google Scholar] [CrossRef]
19. Zhang L , Li N , Jiu H , Zhang Q . Solvothermal synthesis of reduced graphene oxide-Bi2S3 nanorod composites with enhanced photocatalytic activity under visible light irradiation. J Mater Sci Mater Electron. 2016; 27: 2748– 53. doi:10.1007/s10854-015-4086-9. [Google Scholar] [CrossRef]
20. Kim JH , Ma A , Jung H , Kim HY , Choe HR , Kim YH , et al. In Situ growth of the Bi2S3 nanowire array on the Bi2MoO6 film for an improved photoelectrochemical performance. ACS Omega. 2019; 4: 17359– 65. doi:10.1021/acsomega.9b02111. [Google Scholar] [CrossRef]
21. Koç Y , Morali U , Erol S , Avci H . Investigation of electrochemical behavior of potassium ferricyanide/ferrocyanide redox probes on screen printed carbon electrode through cyclic voltammetry and electrochemical impedance spectroscopy. Turk J Chem. 2021; 45: 1895– 915. doi:10.3906/kim-2105-55. [Google Scholar] [CrossRef]
22. Guan G , Lin Z , Qian J , Wang F , Qu L , Zou B . Research Progress on the Application of Nanoenzyme Electrochemical Sensors for Detecting Zearalenone in Food. Nanomaterials. 2025; 15: 712. doi:10.3390/nano15100712. [Google Scholar] [CrossRef]
23. Memon AA , Patil SA , Sun KC , Mengal N , Arbab AA , Sahito IA , et al. Carbonous metallic framework of multi-walled carbon Nanotubes/Bi2S3 nanorods as heterostructure composite films for efficient quasi-solid state DSSCs. Electrochim Acta. 2018; 283: 997– 1005. doi:10.1016/j.electacta.2018.04.131. [Google Scholar] [CrossRef]
24. Ma R , Lei H , Han M , Hao J . Recent progress with bismuth sulfide for room-temperature gas sensing. Chemosensors. 2025; 13: 120. doi:10.3390/chemosensors13040120. [Google Scholar] [CrossRef]
25. Ranjbar M , Taher MA , Rajaei P . Preparation and characterization of bismuth sulfide (Bi2S3) nanostructures by ultrasonic method. J Ultrafine Grained Nanostructured Mater. 2014; 47: 15– 9. [Google Scholar]
26. Reynoso YR , Martinez-Ayala A , Pal M , Paraguay-Delgado F , Mathews NR . Bi2S3 nanoparticles by facile chemical synthesis: Role of pH on growth and physical properties. Adv Powder Technol. 2018; 29: 3561– 8. doi:10.1016/j.apt.2018.09.037. [Google Scholar] [CrossRef]
27. Malakooti R , Cademartiri L , Akçakir Y , Petrov S , Migliori A , Ozin GA . Shape-controlled Bi2S3 nanocrystals and their plasma polymerization into flexible films. Adv Mater. 2006; 18: 2189– 94. doi:10.1002/adma.200600460. [Google Scholar] [CrossRef]
28. Chang F , Yan W , Lei B , Zhang X , Chen H , Hu X , et al. In-situ constructing Bi2S3 nanocrystals-modified Bi12O17Cl2 nanosheets with features of rich oxygen vacancies and reinforced photocatalytic performance. Sep Purif Technol. 2020; 235: 116171. doi:10.1016/j.seppur.2019.116171. [Google Scholar] [CrossRef]
29. Pholauyphon W , Charoen-amornkitt P , Suzuki T , Tsushima S . Perspectives on accurately analyzing cyclic voltammograms for surface- and diffusion-controlled contributions. Electrochem Commun. 2024; 159: 107654. doi:10.1016/j.elecom.2023.107654. [Google Scholar] [CrossRef]
30. Chen Z , Yang M , Li Z , Liao W , Chen B , Yang T , et al. Highly sensitive and convenient aptasensor based on Au NPs@Ce-TpBpy COF for quantitative determination of zearalenone. RSC Adv. 2022; 12: 17312– 20. doi:10.1039/D2RA02093A. [Google Scholar] [CrossRef]
31. Huang S-J , Gokulkumar K , Mani G , Lee Y-Y , Kogularasu S , Chang-Chien G-P . Synthesis and characterization of Bi2S3-embedded carbon nanofibers as a novel electrochemical biosensor for the detection of mycotoxin zearalenone in food crops. Flat Chem. 2024; 45: 100652. doi:10.1016/j.flatc.2024.100652. [Google Scholar] [CrossRef]
32. Peymanfar R , Moradi F . Functionalized carbon microfibers (biomass-derived) ornamented by Bi2S3 nanoparticles: An investigation on their microwave, magnetic, and optical characteristics. Nanotechnology. 2020; 32: 065201. doi:10.1088/1361-6528/abc2ec. [Google Scholar] [CrossRef]
33. Afzali D , Fathirad F . Determination of zearalenone with a glassy carbon electrode modified with nanocomposite consisting of palladium nanoparticles and a conductive polymeric ionic liquid. Microchim Acta. 2016; 183: 2633– 8. doi:10.1007/s00604-016-1907-3. [Google Scholar] [CrossRef]
34. Qu C , Xin L , Yu S , Wei M . A homogeneous electrochemical aptasensor based on DNA assembly for zearalenone detection. J Chin Chem Soc. 2021; 68: 1998– 2005. doi:10.1002/jccs.202100136. [Google Scholar] [CrossRef]
35. Erdem A , Eksin E , Kesici E , Yaralı E , Kanat E . Single-use sensor technology for monitoring of zearalenone in foods: ZentoSens. Microchem J. 2019; 147: 37– 42. doi:10.1016/j.microc.2019.03.001. [Google Scholar] [CrossRef]
36. Liao Z , Guo W , Ning G , Wu Y , Wang Y , Ning G . A sensitive electrochemical aptasensor for zearalenone detection based on target-triggered branched hybridization chain reaction and exonuclease I–assisted recycling. Anal Bioanal Chem. 2023; 415: 4911– 21. doi:10.1007/s00216-023-04797-2. [Google Scholar] [CrossRef]
37. Wenrui Z , Fanxing M , Yanan Q , Fei C , Haitao Y , Minwei Z . Fabrication and specific functionalisation of carbon fibers for advanced flexible biosensors. Front Chem. 2020; 8: 582490. doi:10.3389/fchem.2020.582490. [Google Scholar] [CrossRef]
38. Salavati-Niasari M , Behfard Z , Amiri O , Khosravifard E , Hosseinpour-Mashkani SM . Hydrothermal Synthesis of Bismuth Sulfide (Bi2S3) nanorods: Bismuth(III) monosalicylate precursor in the presence of thioglycolic acid. J Clust Sci. 2013; 24: 349– 63. doi:10.1007/s10876-012-0520-9. [Google Scholar] [CrossRef]
Cite This Article
 Copyright © 2026 The Author(s). Published by Tech Science Press.
This work is licensed under a Creative Commons Attribution 4.0 International License , which permits unrestricted use, distribution, and reproduction in any medium, provided the original work is properly cited.
 Downloads
 Citation Tools