
 Submit a Paper
 Propose a Special lssue
 Open Access
ARTICLE

Impact of Lead Incorporation on the Crystallization Kinetics and Thermal Stability of Se87.5Te10Pb2.5
Department of General Studies, Yanbu Industrial College, Royal Commission for Jubail and Yanbu, Yanbu, Saudi Arabia
* Corresponding Authors: M. A. Al-Maghrabi. Email: ,
Chalcogenide Letters 2026, 23(2), 4 https://doi.org/10.32604/cl.2026.078794
Received 08 January 2026; Accepted 09 February 2026; Issue published 28 February 2026
 View Full Text
 Download PDF
Abstract
The present study investigates the influence of lead incorporation on the crystallization kinetics and thermal behavior of Se87.5Te10Pb2.5 glass prepared by the melt-quenching technique and characterized by differential scanning calorimetry over heating rates of 5–99 K·min−1. Nonisothermal kinetic parameters were evaluated using model-free isoconversional methods, namely the Friedman and Vyazovkin approaches, while the Matusita model was employed to gain insight into the crystallization dimensionality. Complementary isothermal simulations were used to support the kinetic interpretations. The apparent activation energy exhibits a systematic decrease with increasing temperature and crystallized fraction, suggesting a multi-stage crystallization process. At lower temperatures, crystallization is dominated by three-dimensional growth with instantaneous or diminishing nucleation, whereas higher temperatures favor a transition toward lower-dimensional growth. The evolution of the Avrami exponent indicates the coexistence of surface and bulk crystallization mechanisms, reflecting a gradual shift from nucleation-controlled to growth-controlled kinetics. Thermal metrics, including the glass transition temperature, the width of the supercooled liquid region, the Saad–Poulin s-parameter, the reduced glass transition temperature, and the Hruby number, exhibit a consistent increase with heating rate, reflecting kinetically induced delay against crystallization. Overall, the kinetic and thermal analyses provide a coherent description of the crystallization behavior of Se87.5Te10Pb2.5 glass under nonisothermal conditions, highlighting the role of Pb incorporation in modifying both crystallization pathways and apparent thermal stability demonstrates that Pb incorporation promotes structural relaxation and controlled crystallization, improving the thermal endurance of Se–Te–Pb glasses, which is relevant to thermal-stability considerations discussed in the context of optical and phase-change materials.Keywords
The synthesis of materials with tailored physical and chemical properties is essential for advancing modern technologies in optoelectronics, data storage, and thermoelectric energy conversion. Among various functional materials, selenium-based chalcogenide glasses (ChGs), particularly Se–Te alloys, have attracted considerable attention owing to their optical, electronic, and thermal characteristics. Their high photoconductivity and favorable carrier transport properties have motivated extensive research into photodetector and optoelectronic applications [1,2]. In addition, the ability of Se–Te–based glasses to undergo reversible amorphous–crystalline transformations have made them a subject of sustained interest in non-volatile phase-change memory research [3,4]. Furthermore, the relatively low thermal conductivity and tunable electronic structure of multicomponent Se–Te systems have been explored in the context of thermoelectric materials [5,6].
A distinctive feature of Se–Te chalcogenides is their ability to reversibly transform between amorphous and crystalline states, underpinning their application in phase-change and data-storage technologies. This reversible transition, coupled with inherent thermal stability, governs their functional performance and underscores the importance of crystallization kinetics, structural evolution, and thermal endurance. Despite these attractive features, Se–Te glasses suffer from several limitations that hinder their wider technological adoption, including limited thermal stability, relatively large optical band gaps, and restricted tunability of physical properties. Also, they exhibit low glass-transition and crystallization temperatures and are prone to aging and devitrification [5,7,8].
To overcome the intrinsic kinetic limitations of binary Se–Te glasses, a variety of metallic dopants have been introduced to modify the glass network and tailor crystallization behavior under nonisothermal conditions. Indium (In) incorporation has been shown to significantly influence crystallization kinetics by altering the local structural environment of the glass network. In-doped Se–Te glasses exhibit a reduction in the apparent activation energy accompanied by systematic shifts of the onset and peak crystallization temperatures toward higher values, reflecting increased kinetic resistance to devitrification during heating [9].
Similarly, zinc (Zn) and cadmium (Cd) additions in Se-rich compositions such as Se98Te2 markedly affect the crystallization mechanism and growth dimensionality. Detailed DSC-based kinetic analyses indicate that Cd-doped glasses predominantly exhibit three-dimensional nucleation and growth, characterized by Avrami exponents close to n ≈ 3, whereas Zn-doped compositions tend to favor lower-dimensional crystallization with n ≈ 2 [10]. These dopant-dependent variations are accompanied by systematic changes in activation energy and crystallization rate constants, reflecting the distinct roles of Zn and Cd in controlling atomic mobility, nucleation density, and growth kinetics. Further nonisothermal studies on Cd-containing Se–Te glasses confirm that cadmium promotes bulk crystallization with higher growth dimensionality while modifying the activation-energy landscape and kinetic stability parameters as a function of heating rate [11].
Silver (Ag) doping has also been reported to exert a pronounced influence on crystallization kinetics in Se–Te glasses. Kinetic analyses of Ag-containing compositions reveal the presence of overlapping crystallization processes with distinct activation energies and Avrami exponents, highlighting the complexity of nucleation and growth mechanisms induced by Ag incorporation [12]. Complementary investigations on Se0.75-xTe0.25Agx glasses and thick films demonstrate systematic variations in characteristic temperatures, thermal stability parameters, and kinetic constants with increasing Ag content, confirming the strong sensitivity of crystallization behavior to silver concentration [13].
Collectively, these studies demonstrate that metallic dopants such as In, Zn, Cd, and Ag primarily govern crystallization behavior in Se–Te-based glasses through kinetic control of nucleation mechanisms, growth dimensionality, and atomic mobility, rather than through simple thermodynamic stabilization of the amorphous phase. This kinetic modulation manifests as dopant-dependent changes in activation energy, Avrami exponent, and characteristic crystallization temperatures under nonisothermal heating conditions.
Lead (Pb) doping has similar gained attention for its pronounced influence on Se-Te systems. Kamboj et al. [14] found that the activation energy for crystallization initially decreases at low Pb concentrations due to network weakening but rises again at higher concentrations from crosslinking effects. In the same way, Khan et al. [15,16] reported a reduction in both activation energy and Avrami exponent with Pb incorporation, indicating a shift from bulk to surface nucleation and diminished thermal stability. Atyia and Farid [17] attributed this reduction in activation energy to the formation of weaker Se–Pb and Te–Pb bonds, which lower both growth dimensionality and thermal resistance. Joraid et al. [18] further demonstrated that Pb addition alters nucleation–growth dynamics, enhances structural rigidity, and modifies the dominant crystallization mechanism. Priyanka et al. [19] also reported composition-dependent changes in activation energy for Se79Te20Pb1 glasses, whereas Benjamin et al. [9] found that Pb-doped compositions exhibit slightly higher activation energies than base Se90Te10, although thermal stability decreased due to lower crystallization temperatures. Collectively, these studies demonstrate that Pb affects activation energy, nucleation mechanism, and thermal behavior.
Building on previous studies, this work examines the role of low-level Pb incorporation in controlling the crystallization kinetics and thermal behavior of Se–Te glasses. Although Pb is known to modify the Se–Te network, its influence on activation energy evolution and apparent thermal stability remains inconsistent in the literature, particularly at low concentrations. Moreover, increasing interest in Se–Te–based glasses with minimal Pb content, driven by practical and regulatory considerations, highlights the need to clarify Pb-induced kinetic effects within this constrained compositional regime.
Accordingly, Se87.5Te10Pb2.5 was selected as a Se-rich, low-Pb boundary composition that allows systematic assessment of Pb-driven network modification without pronounced phase separation. Methodologically, the study advances beyond earlier narrow-range DSC work by employing a wide heating-rate window (5–99 K·min−1) to resolve crystallization staging and thermal-delay effects, complemented by conversion-resolved isoconversional analysis and time-domain validation through isothermal crystallization simulations using AKTS software [20].
The Se87.5Te10Pb2.5 glass was synthesized from High-purity (99.999%) selenium, tellurium, and lead powders (Sigma-Aldrich Co.) using the conventional melt-quenching technique. The constituent elements were weighed according to stoichiometric ratios and sealed under vacuum (10−4 Torr) in a silica-glass ampoule with an inner diameter of 12 mm. The ampoule was heated in a rocking furnace and continuously agitated during melting to ensure chemical homogeneity. After complete melting, it was rapidly quenched in ice-cold water to obtain the glassy alloy. Differential scanning calorimetry (DSC) was performed using a Shimadzu DSC-60 instrument at heating rates, 7, 10, 15, 20, 30, 40, 50, 60, 70, 80, 90 and 99 K·min−1. The calorimeter with a temperature accuracy of ±0.1 K. was calibrated using a pure indium standard (Tm = 153.6°C, Hm = 28.55 J g−1), supplied by Shimadzu. Dry nitrogen was used as purge gas at flow rate of 35 mL min−1. Prior to DSC measurements, the samples were ground and sieved to minimize particle-size-dependent crystallization effects. Approximately 5 mg of the sample was evenly distributed at the bottom of a sealed aluminum pan, with an empty pan serving as a reference. The kinetics of the experimental DSC data were analyzed using the advanced AKTS-Thermokinetics software package (Version 4) [20], which applies isoconversional methods assuming the reaction rate at a given extent of conversion,
Fig. 1 presents the X-ray diffraction (XRD) pattern of the as-prepared Se87.5Te10Pb2.5 glass, characterized by the absence of sharp reflections and the presence of a broad diffuse halo centered at approximately 2θ ≈ 28–32°, accompanied by a weaker, broader feature at higher angles. Such diffraction features are typical of amorphous chalcogenide glasses and arise from short-range atomic ordering without long-range periodicity.
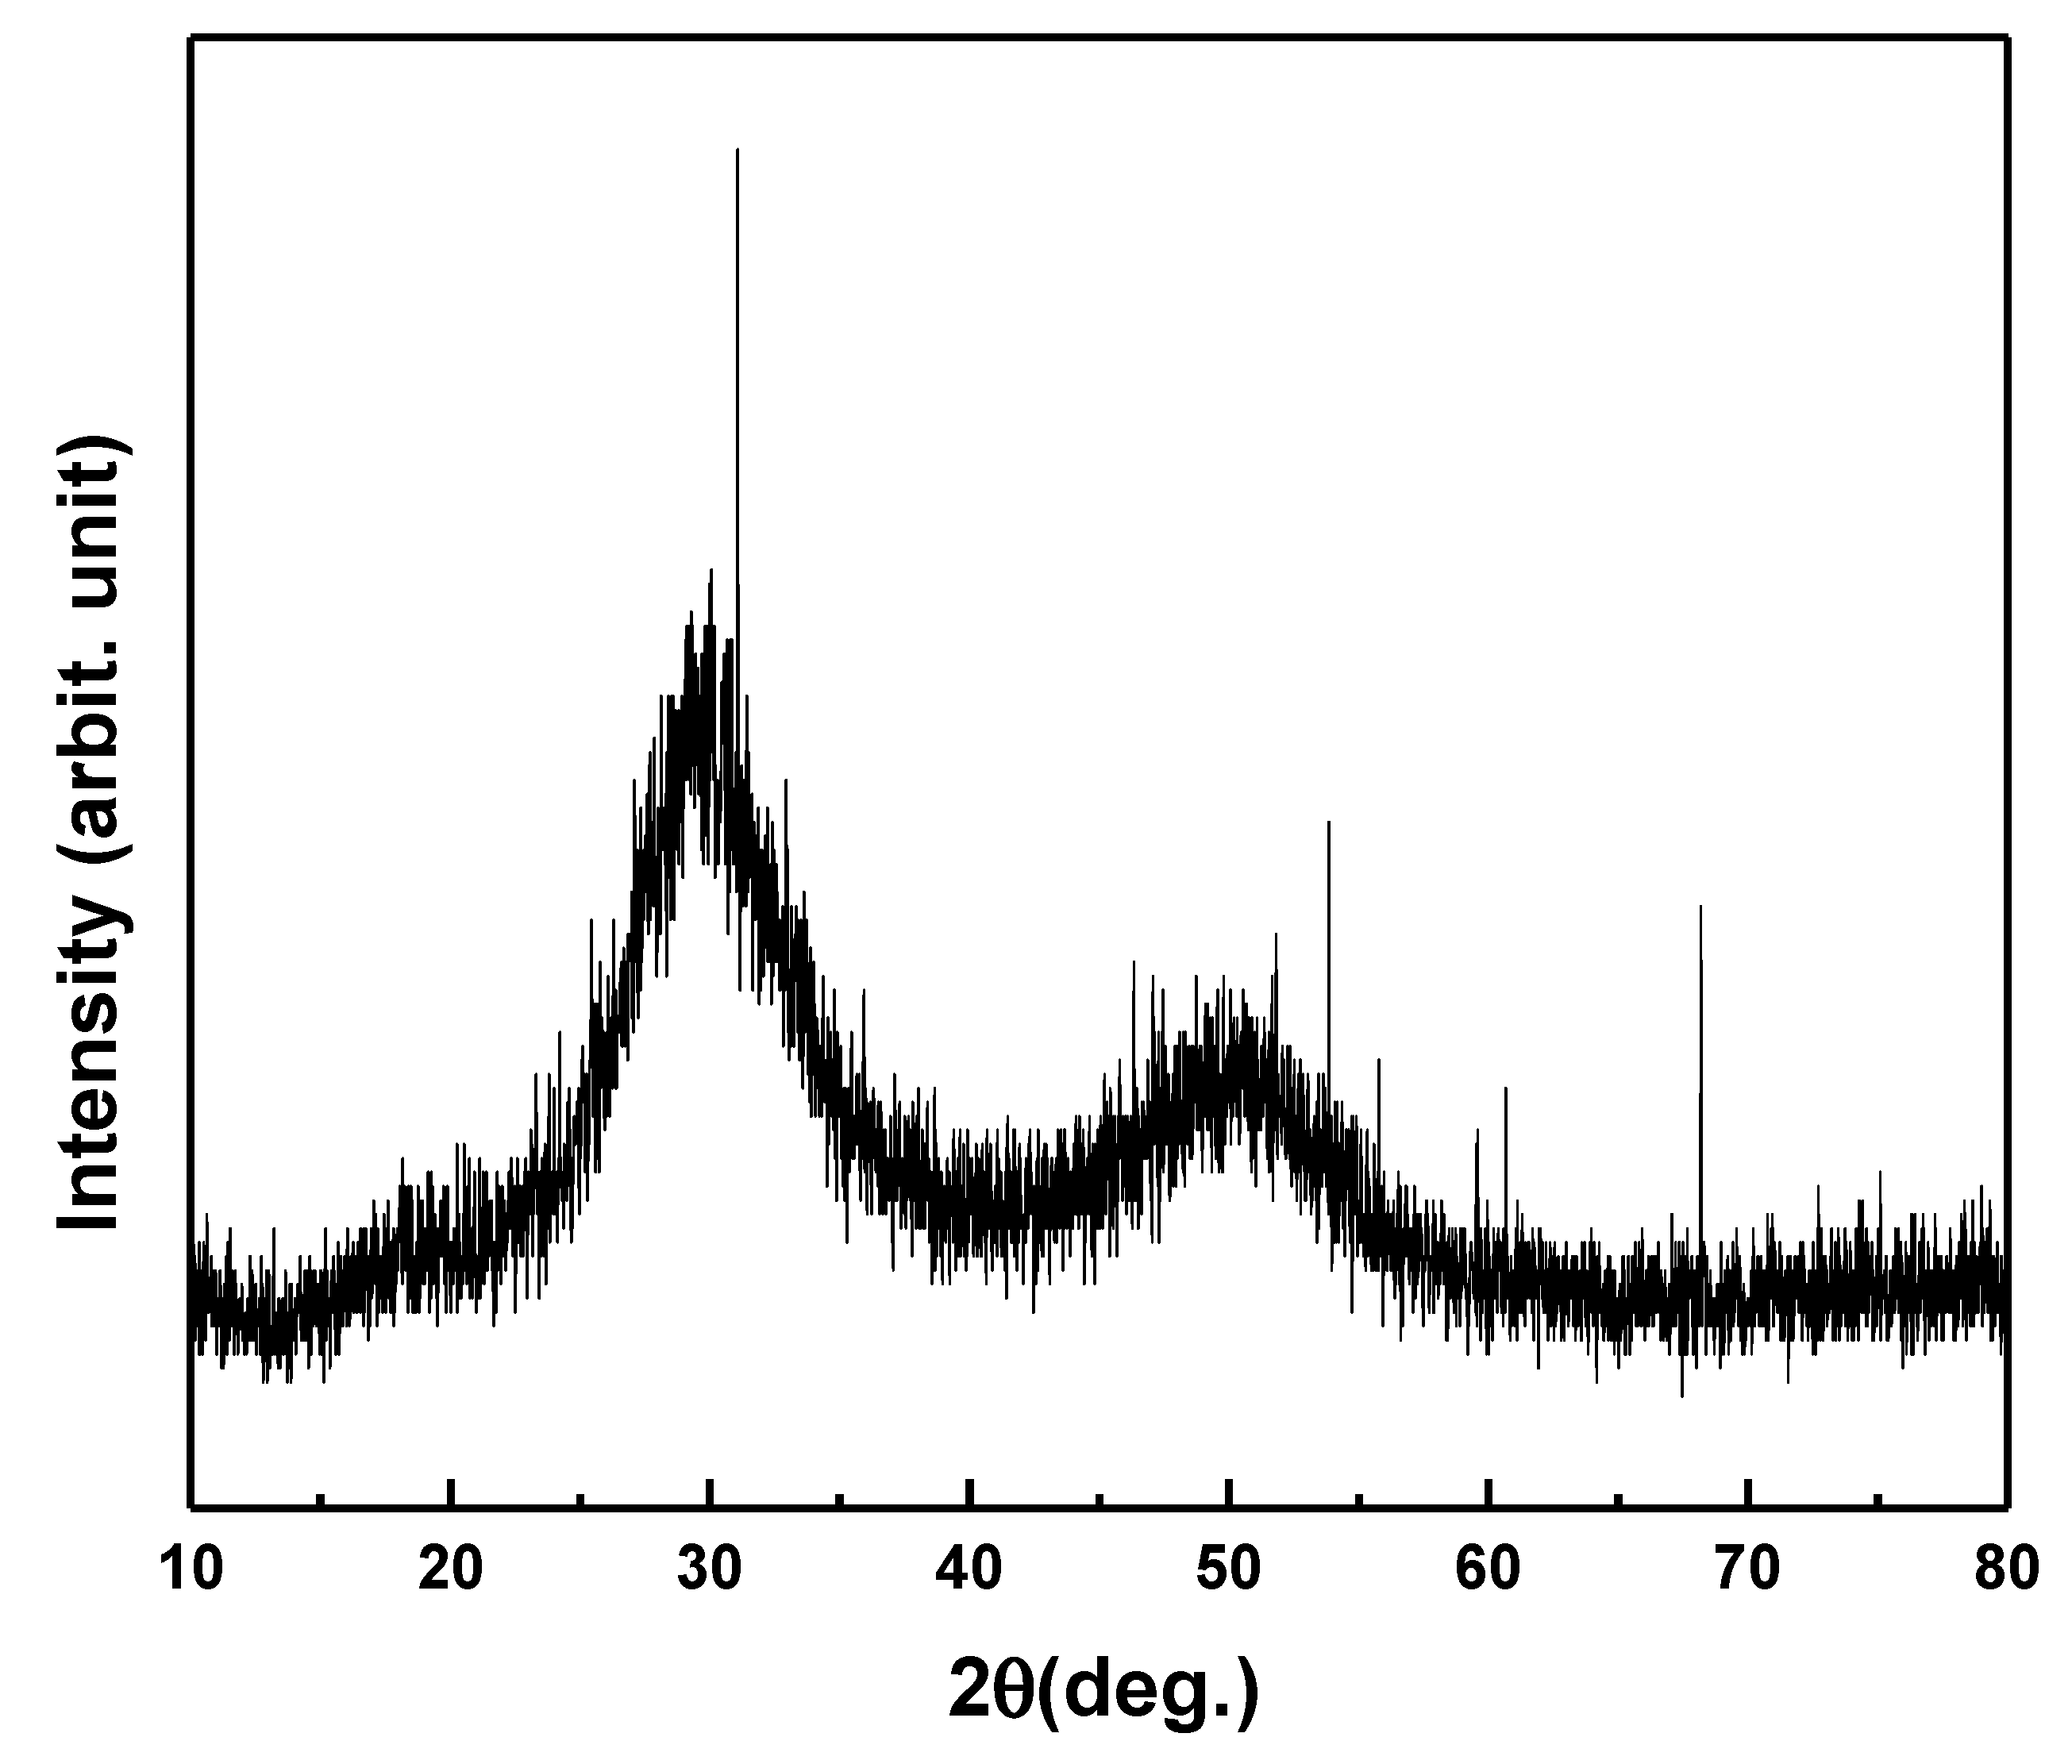
Figure 1: X-ray diffraction pattern of the as-prepared Se87.5Te10Pb2.5 glass.
Fig. 2 shows DSC curves of the Se87.5Te10Pb2.5 glass collected at a wide range of heating rates (5 to 99 K·min−1), depicting a single well-defined crystallization peak along with glass transition, and melting. Crystallization occurs around 370 to 480 K and the peak broadens with heating rate, reflecting a wider temperature range for the process. This broadening arises from thermal lag and sample temperature gradients, leading to overlapping nucleation and growth. Similar behavior has been reported for Se-Te-Pb glasses [9,18], where higher heating rates produced broader, higher-temperature peaks. Crystallization is a thermally activated process governed by nucleation and crystal growth, both of which require finite time for atomic rearrangement. At low heating rates, sufficient time is available for structural relaxation and nucleation at lower temperatures, whereas at higher heating rates the material rapidly traverses these temperature regions, shifting the onset of crystallization to higher temperatures. This kinetic trend arising from the interplay between atomic relaxation and thermal diffusion is evident in the onset of Fig. 2 and is typical of nonisothermal crystallization [18].
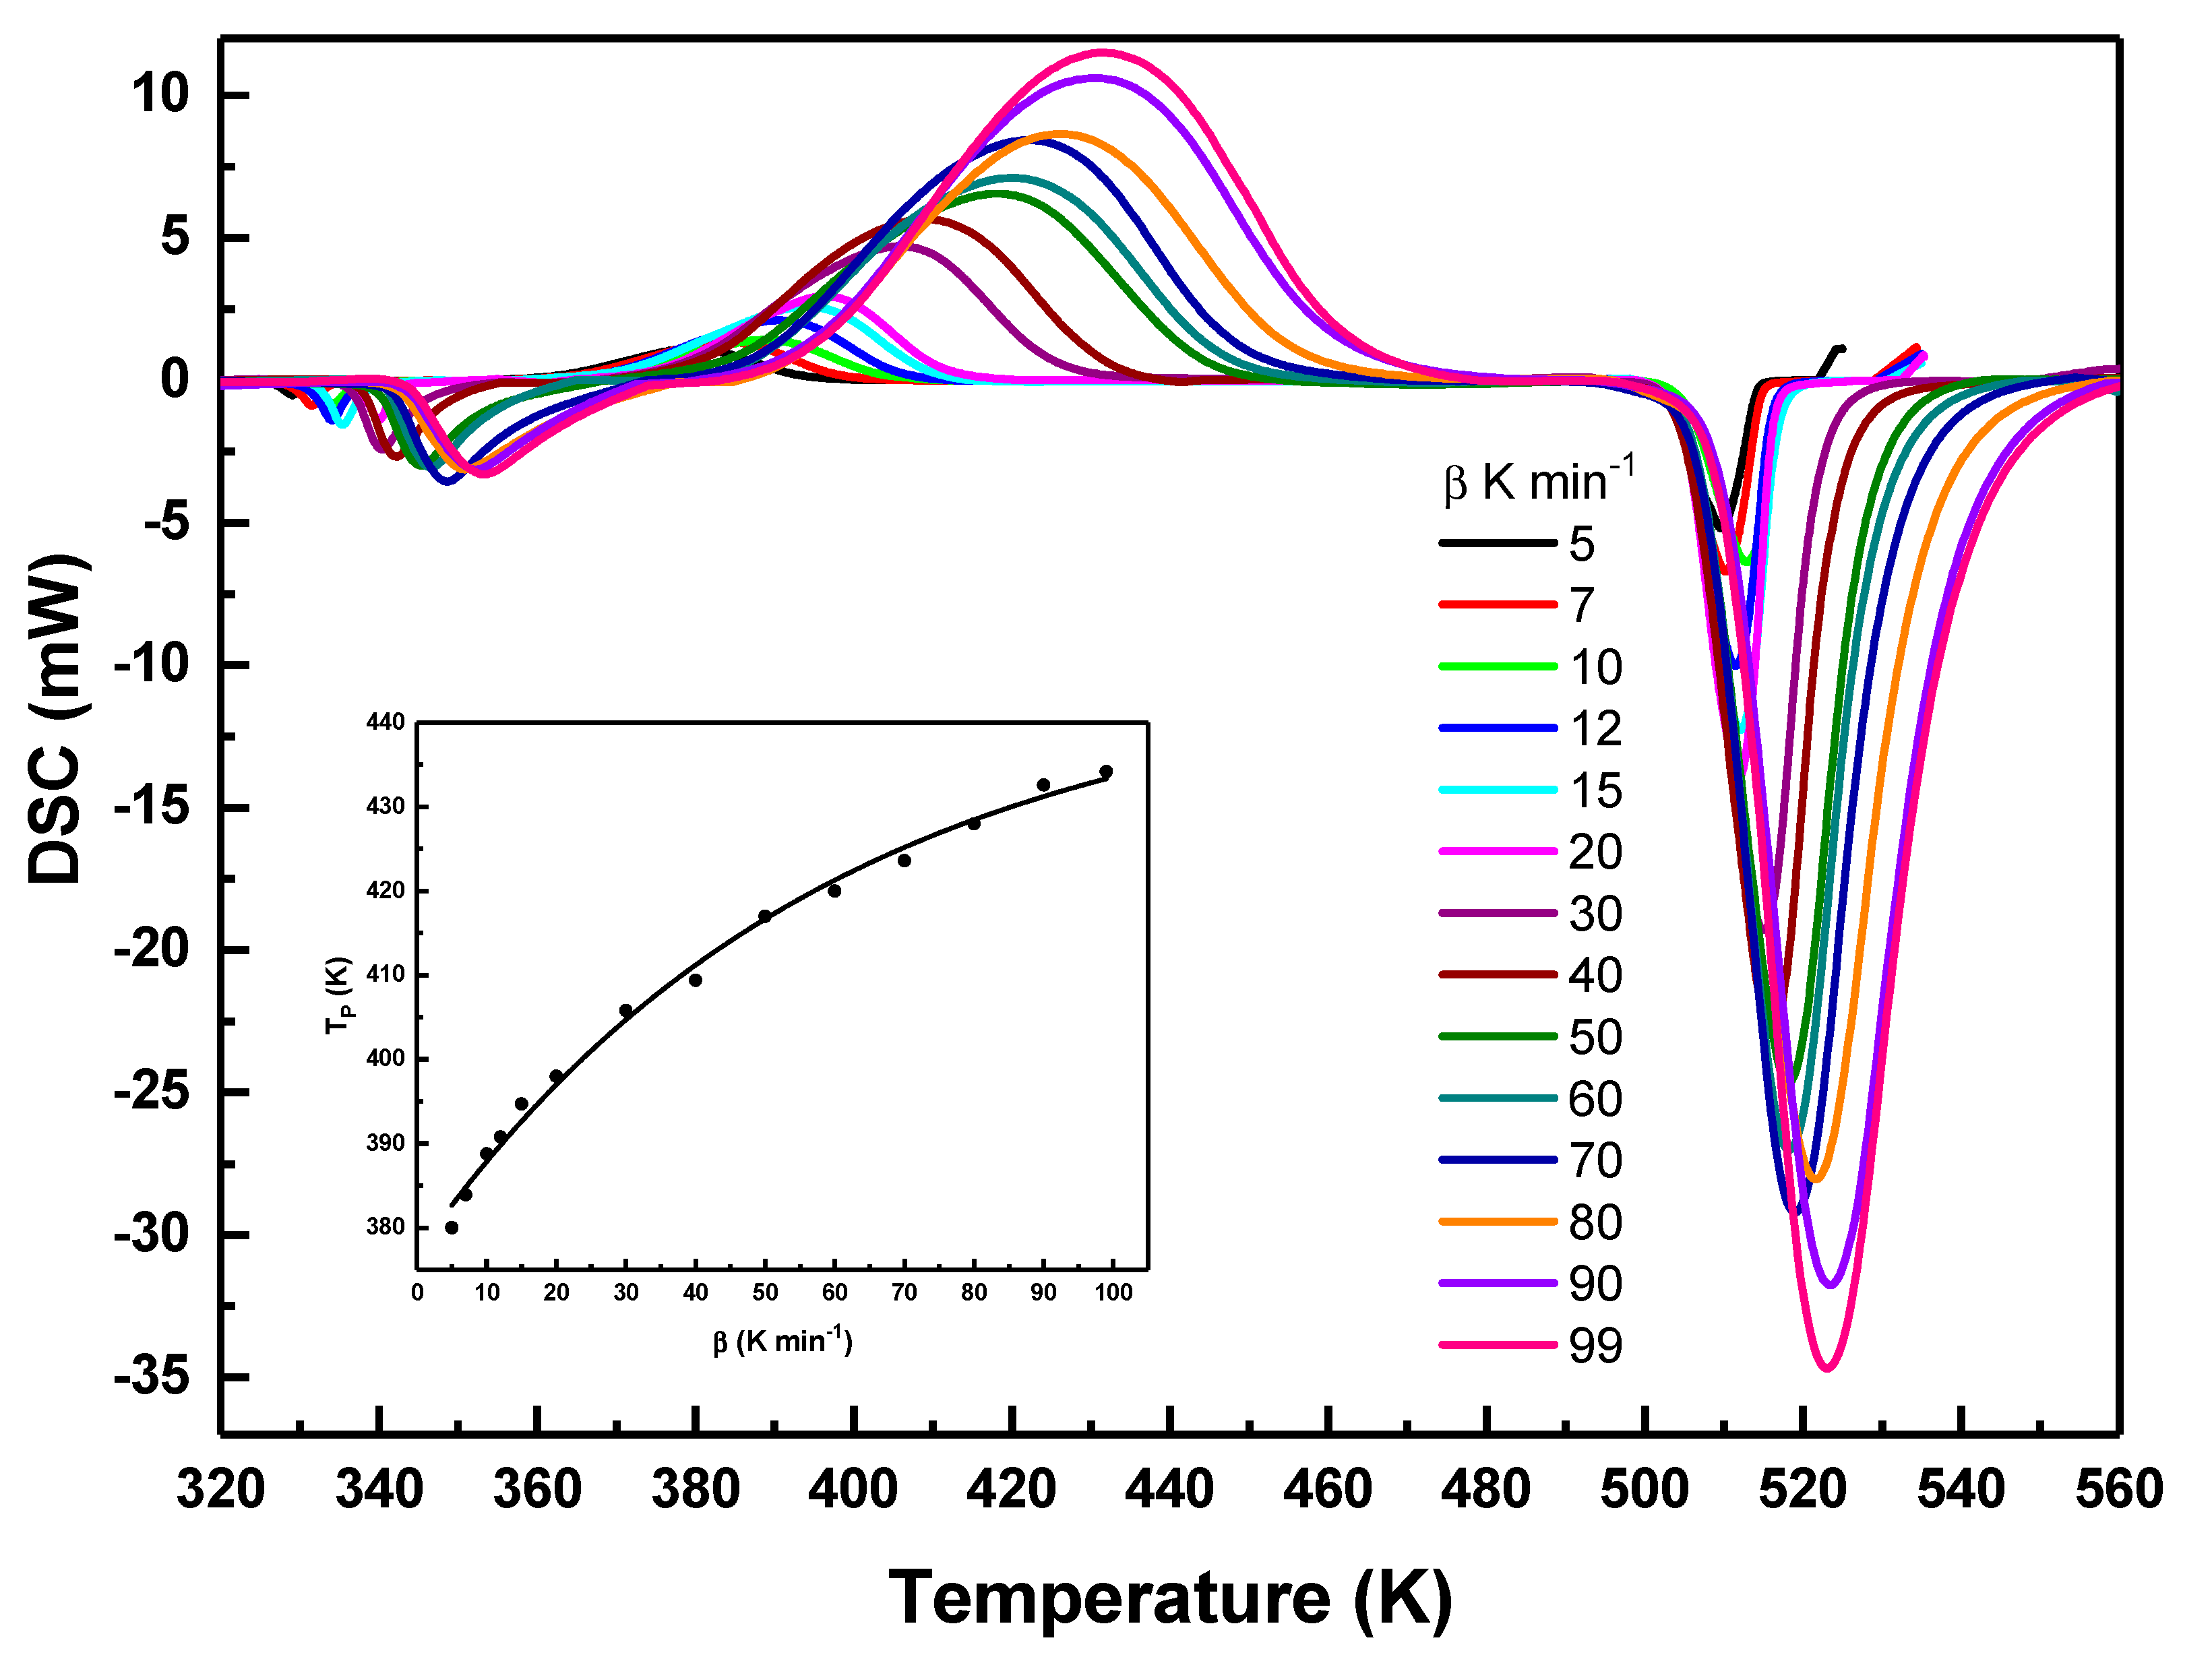
Figure 2: DSC curves of Se87.5Te10Pb2.5 glass recorded at different heating rates, showing the glass transition, crystallization, and melting events. The onset illustrates the dependence of the crystallization peak temperature on the heating rate.
The crystallization process under nonisothermal conditions is described by the following kinetic equation [21,22,23]:
Fig. 3a presents the extent of crystallization,
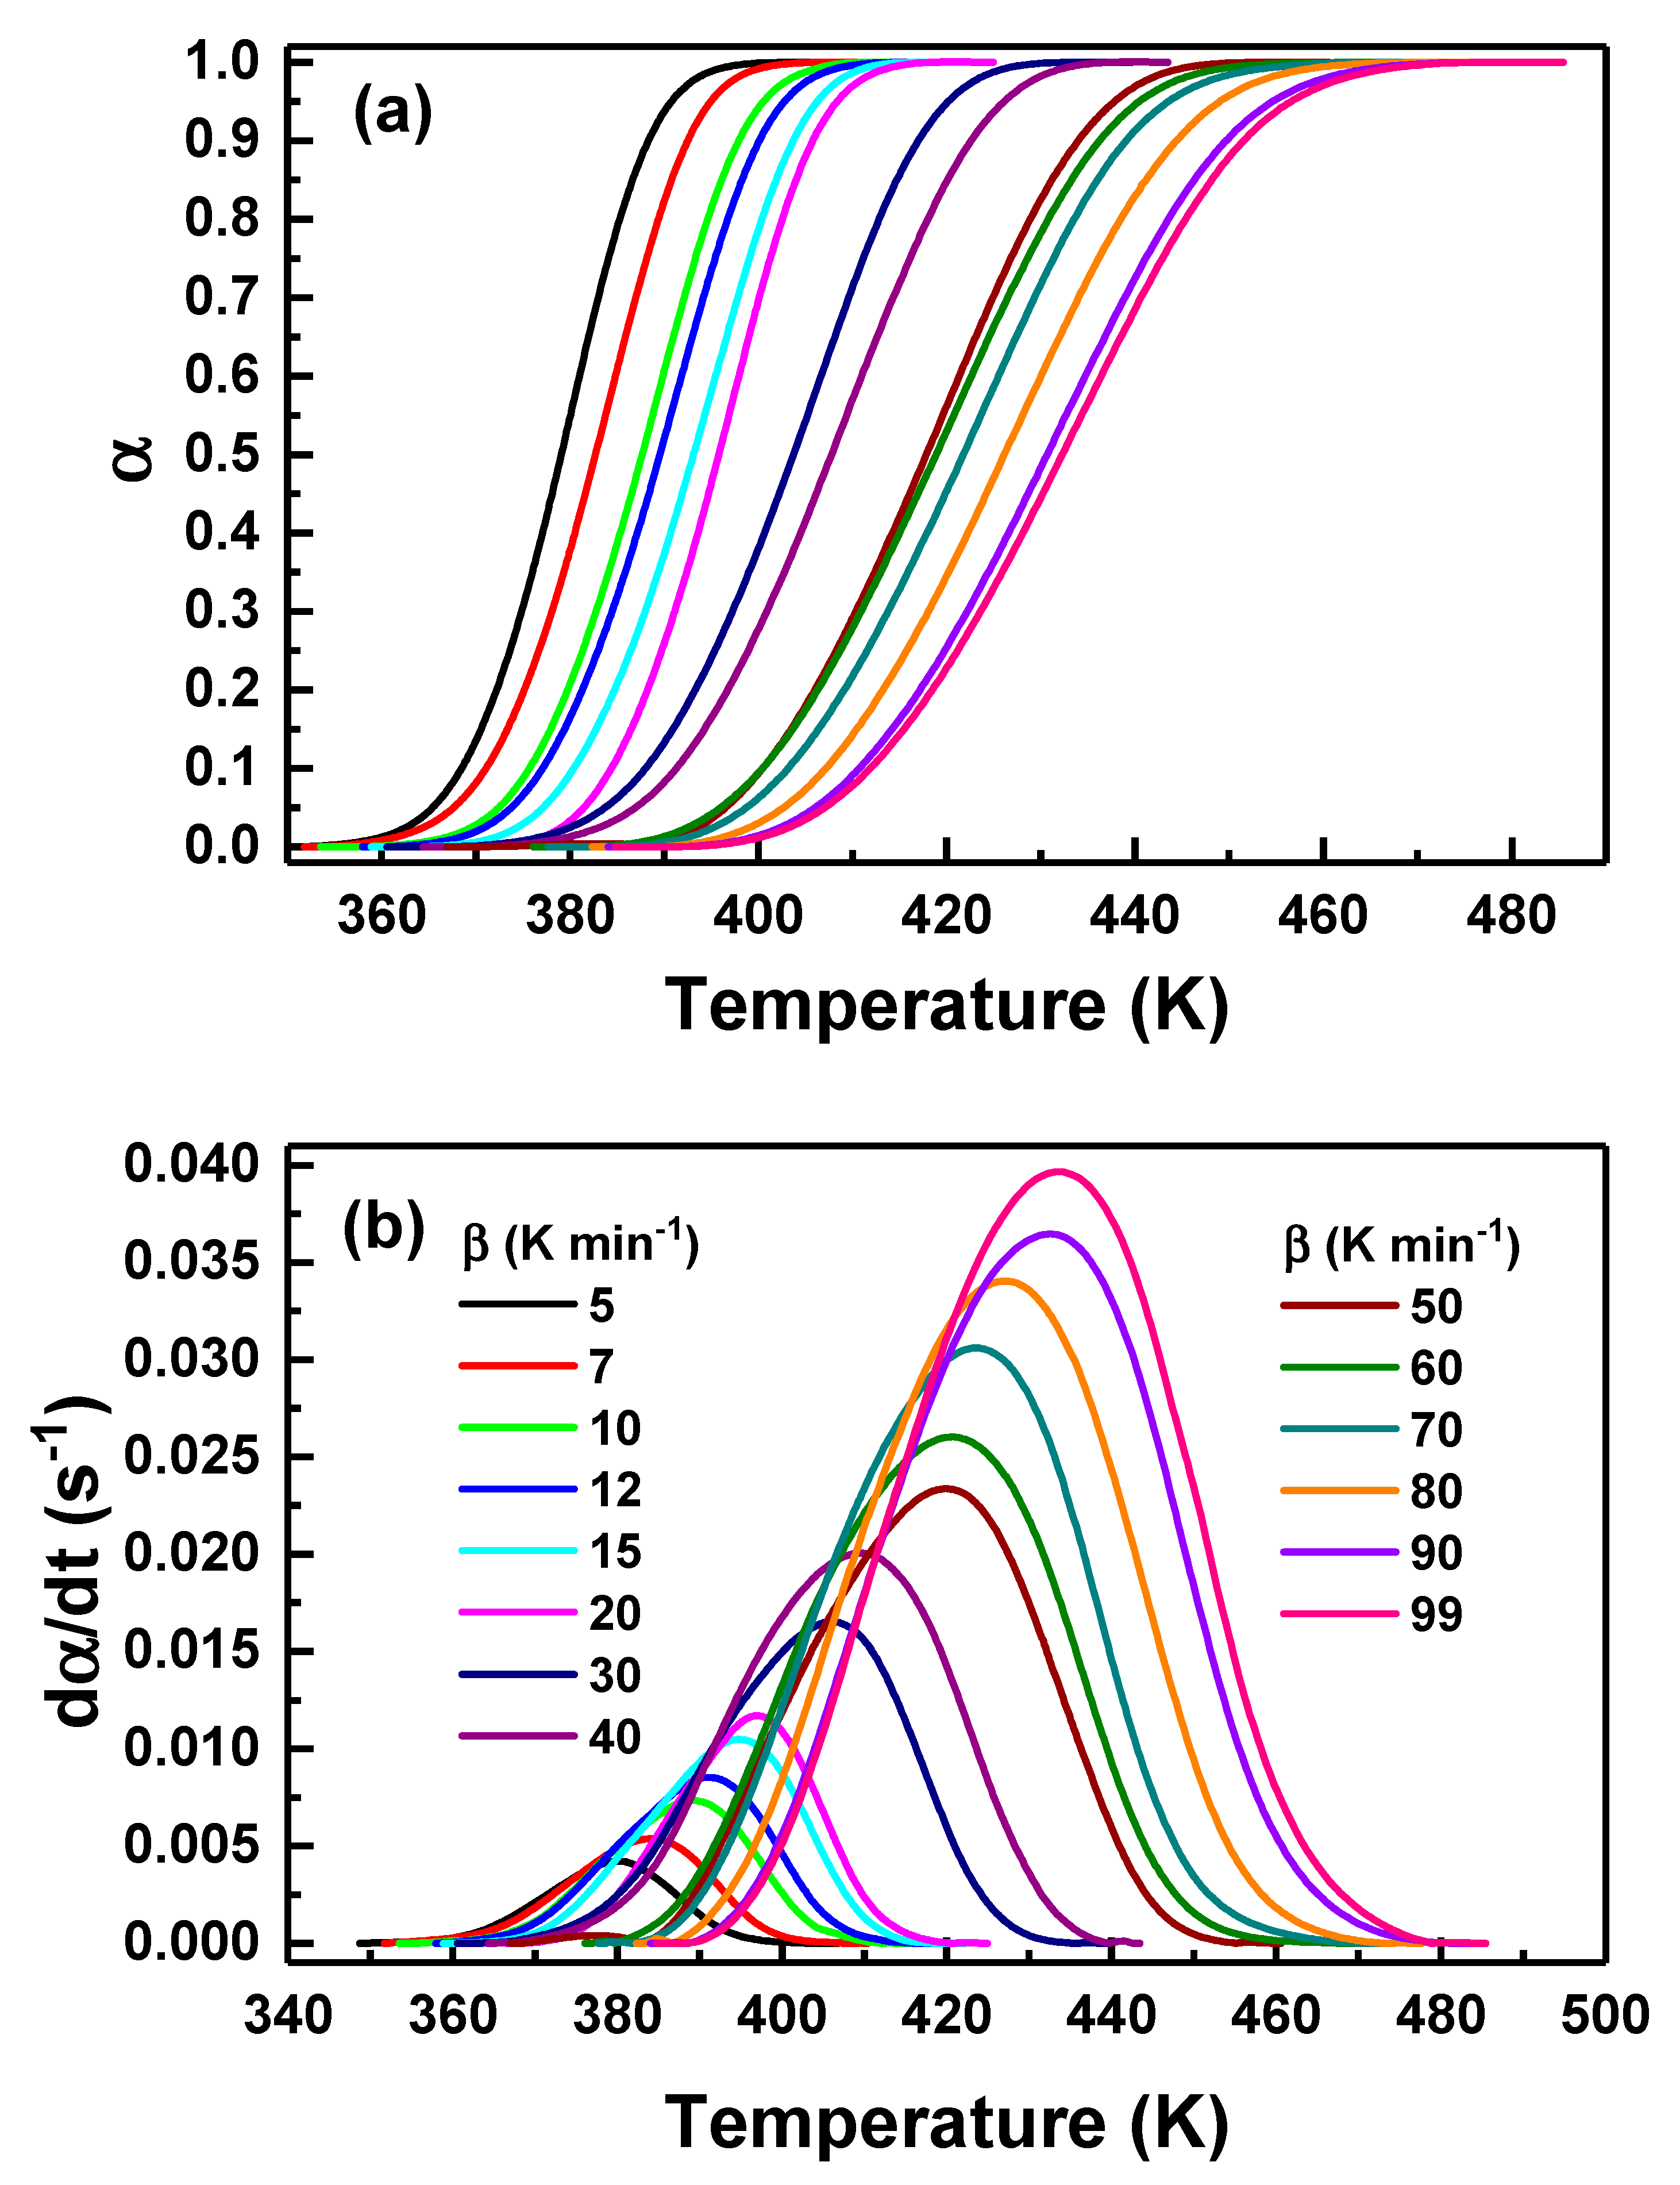
Figure 3: (a) Extent of crystallization vs. temperature for Se87.5Te10Pb2.5 glass recorded at various heating rates (5–99 K·min−1). (b) Corresponding crystallization rate vs. temperature at the same heating rates.
Fig. 3b displays the corresponding crystallization-rate curves obtained by numerically differentiating the
3.2 Crystallization Activation Energy
The Matusita method [24] is commonly used to analyze nonisothermal crystallization kinetics of amorphous materials by incorporating the effects of nucleation and growth dimensionality. The method is expressed as:
To determine the crystallization mechanism under nonisothermal conditions, the Matusita approach was adopted. In this framework, the kinetic exponents are extracted from linearized plots constructed from the DSC-derived conversion data across multiple heating rates and selected temperatures, allowing the Avrami-type exponent (and the associated growth characteristics) to be obtained consistently from the nonisothermal transformation behavior. The use of multiple heating rates improves the robustness of the extracted parameters by reducing sensitivity to a single thermal history and by capturing the systematic kinetic delay with increasing β. Specifically, the Avrami/Matusita exponent was obtained from the slope of the linear relationship between ln[−ln(1−α)] and ln β evaluated at fixed temperatures (selected to represent successive stages of the transformation), according to [26]:
The Avrami exponent, n, in the range 0–1 is commonly associated with surface-dominated crystallization, whereas n ≥ 1 is generally indicative of volume crystallization (n = 1, 2, or 3–4 for one-, two-, and three-dimensional growth, respectively) [27]. The variation of n with temperature for different heating rates is shown in Fig. 4. The obtained n values range from approximately 1.1 to 2.5 over the investigated temperature interval of 380–480 K. Lower n values observed at the early stages of crystallization suggest a predominance of interface-controlled growth, whereas the increase in n at higher temperatures is commonly associated with the activation of higher-dimensional growth modes and/or an enhanced contribution of nucleation processes. These results imply that the crystallization of the studied glass is not governed by a single mechanism, and that different nucleation and growth modes may be operative depending on the crystallization temperature. It should be noted that the absolute values of the growth dimensionality inferred from the Matusita formalism depend explicitly on the assumed nucleation mode through the relation between m and n. Therefore, the dimensional assignments discussed here should be regarded as effective kinetic descriptors rather than as unique mechanistic identifiers.
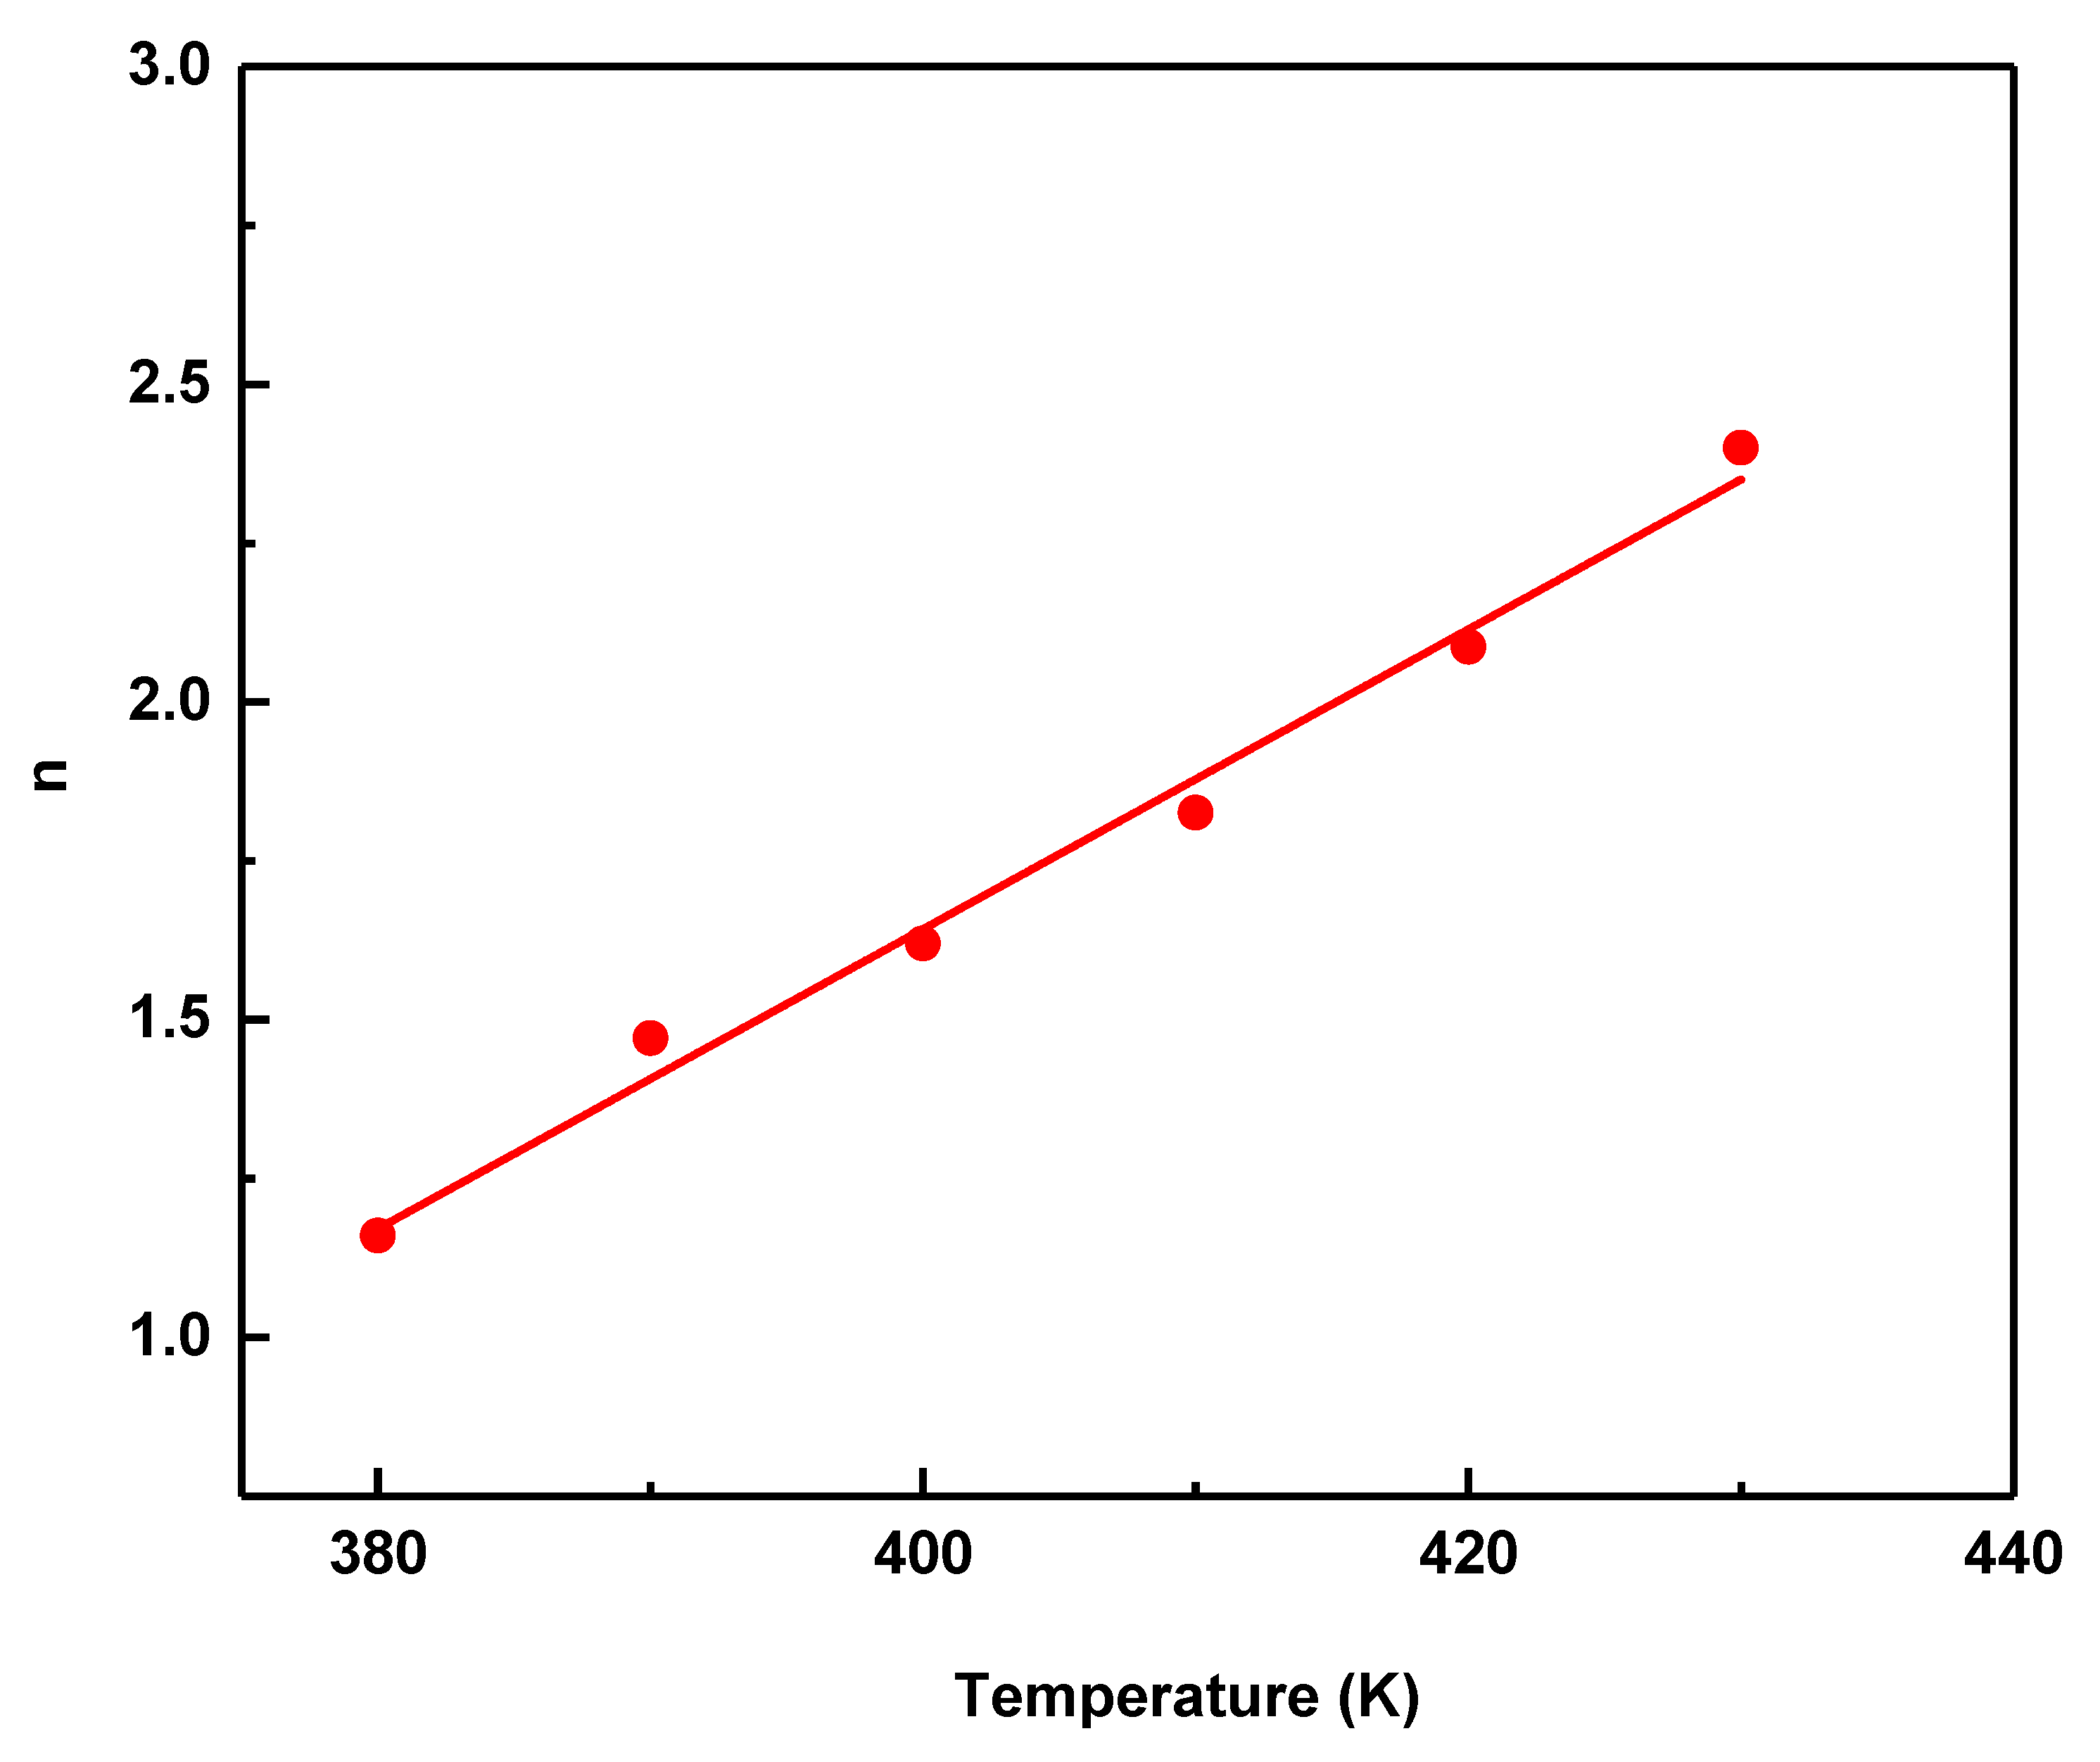
Figure 4: Variation of the Avrami exponent with temperature using the Matusita model. The selected temperatures correspond to fixed crystallization fractions (α = 0.1–0.9), representing successive transformation stages.
3.2.2 Friedman, and Vyazovkin Method
Under nonisothermal conditions, the extent of crystallization, α, and its rate, dα/dt, were evaluated as functions of temperature over a range of heating rates, providing a suitable dataset for model-free isoconversional analysis. In the present study, crystallization kinetics were analyzed using the differential Friedman method and the integral Vyazovkin method, both of which enable the determination of the apparent activation energy as a function of the crystallized fraction without assuming a predefined reaction model. The Friedman method, derived directly from the general rate equation, evaluates the activation energy at a fixed extent of conversion by linearizing the kinetic expression:
Accordingly, for a given value of α, a plot of
Across the entire conversion range, the activation energies derived from the Friedman method are slightly lower and exhibit a more pronounced curvature compared to those obtained using the Vyazovkin method. This behavior is expected, as the Friedman approach is differential in nature and relies directly on the crystallization rate, making it more sensitive to local kinetic variations and experimental noise. In contrast, the Vyazovkin method is based on an integral formulation evaluated over small conversion intervals and multiple heating rates, which generally yields smoother and more stable activation-energy profiles for complex solid-state transformations. Such differences between differential and integral isoconversional methods are well documented in the kinetic-analysis literature [28].
The relationship between activation energy and temperature is further illustrated in Fig. 5 (the top x-axis), which corresponds to the temperatures associated with the Friedman analysis. Interpreted in this form, the figure shows that the apparent activation energy decreases as crystallization progresses into higher-temperature regions. This trend is physically consistent with the crystallization behavior of chalcogenide glasses, where increasing temperature enhances atomic mobility and diffusion, thereby reducing the effective kinetic barrier controlling the transformation. Similar temperature-dependent reductions in activation energy have been observed in Pb-containing Se–Te and Se–Te–Ge–Pb glasses studied under nonisothermal conditions, where Pb incorporation was shown to modify the crystallization pathway and facilitate growth at elevated temperatures [9].
Within the framework of classical nucleation theory as formulated by Fisher and Turnbull [29], the crystallization rate is governed by the combined effects of atomic diffusion and nucleus formation, each associated with distinct energetic contributions. In this description, the pre-exponential factor reflects the intrinsic frequency of atomic rearrangements, while the apparent activation energy encompasses contributions from both diffusion-related barriers and the free-energy barrier for stable nucleus formation. At lower temperatures, the effective activation energy is dominated by the nucleation barrier, whereas at higher temperatures enhanced thermal activation reduces the influence of nucleation and promotes diffusion-controlled growth. As temperature increases, atomic mobility improves and the relative impact of the nucleation barrier diminishes, leading to a progressive reduction in the apparent activation energy. In Pb-containing Se–Te glasses, this interpretation is particularly relevant because Pb incorporation is known to facilitate heterogeneous nucleation, effectively lowering the nucleation barrier at later stages of crystallization. Consequently, as crystallization proceeds at progressively higher temperatures, the apparent activation energy decreases due to the combined effects of enhanced diffusion and reduced kinetic constraints on crystal growth. The behavior observed for Se87.5Te10Pb2.5 glass reflects this temperature-dependent interplay between competing nucleation and diffusion processes, where higher activation energies at early stages correspond to nucleation-dominated kinetics, while the subsequent reduction in activation energy indicates an increasing contribution from diffusion-assisted growth and structural rearrangement within the glass matrix.
In addition to the activation energy, Fig. 5 shows the evolution of the pre-exponential term extracted from the Friedman analysis. The gradual decrease of this term with increasing conversion mirrors the trend observed for E as a function of α. Such coupled behavior is commonly interpreted as a kinetic compensation effect, frequently reported in nonisothermal crystallization kinetics of chalcogenide and oxide glasses. This effect reflects progressive structural ordering during crystallization, in which the reduction in the effective energy barrier is accompanied by a decrease in the number of available atomic rearrangement pathways as the amorphous network transforms into a more rigid crystalline structure.
Overall, Fig. 5 demonstrates that crystallization is governed by conversion- and temperature-dependent kinetics. The close agreement between the Friedman and Vyazovkin trends, despite their methodological differences, reinforces the robustness of the extracted activation-energy profile and supports the interpretation of crystallization as a multistep process with evolving kinetic barriers rather than a single rate-controlled transformation [19].
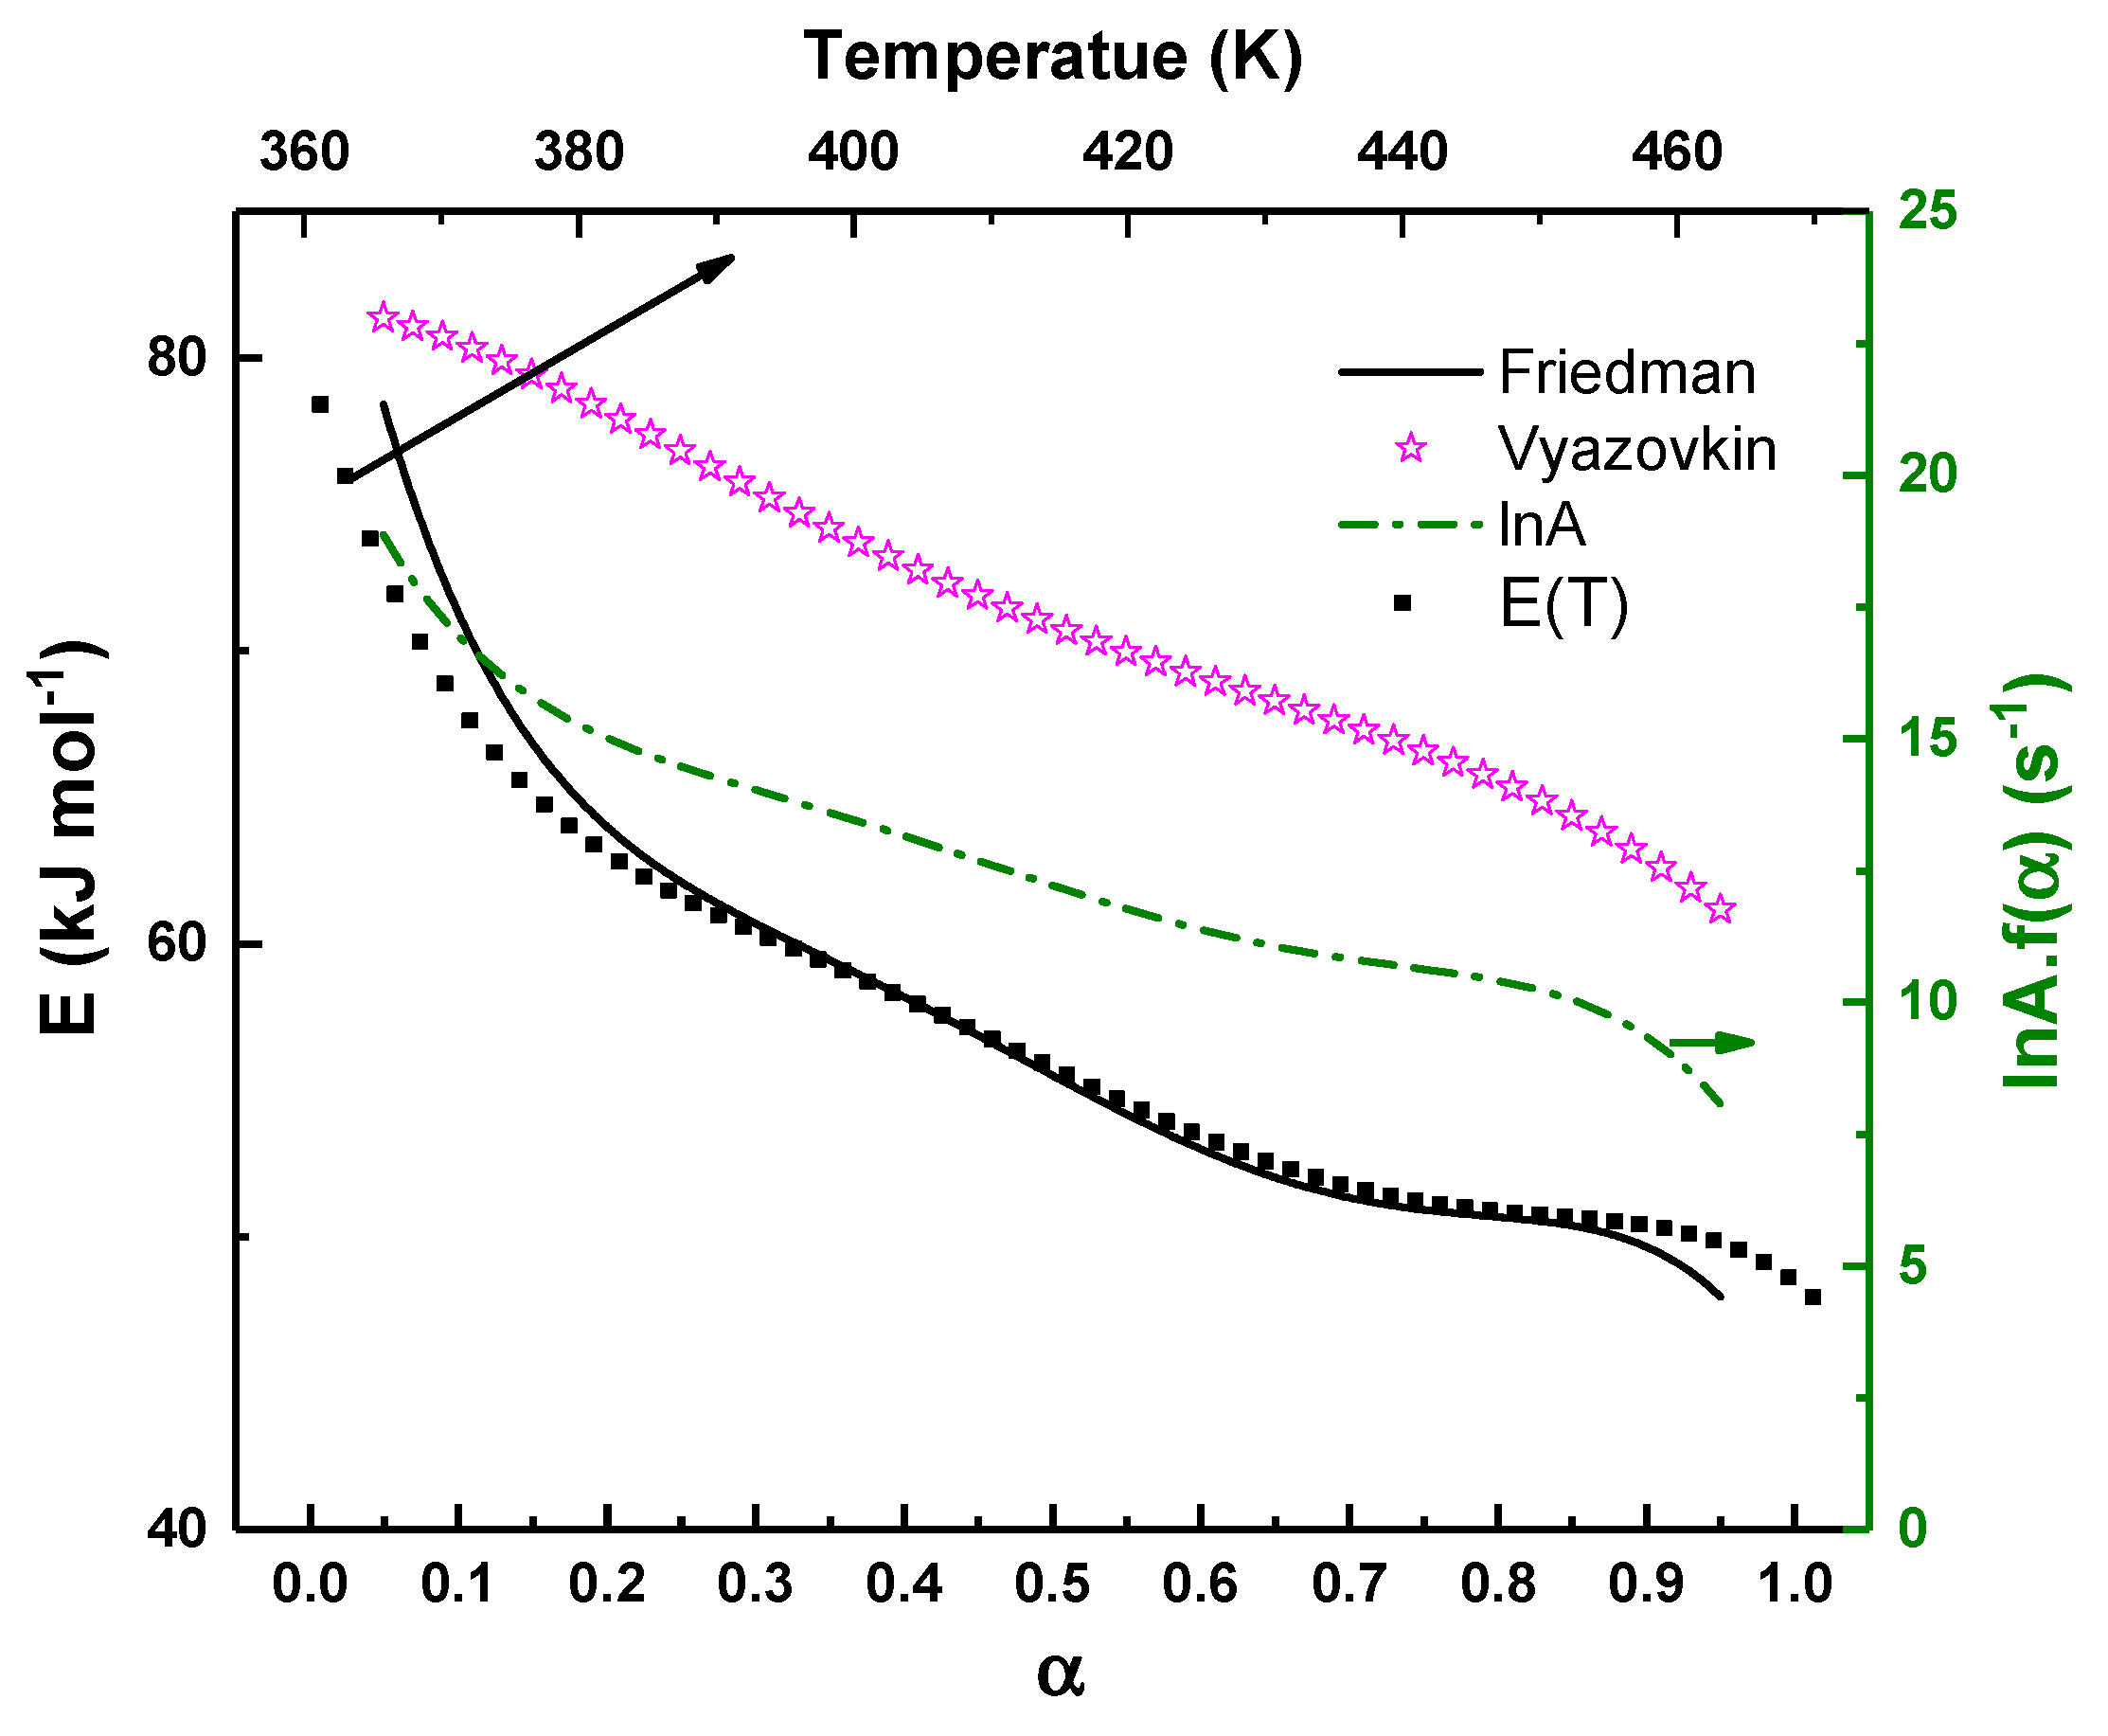
Figure 5: Variation of the activation energy (left axis) and the corresponding pre-exponential factor (right axis) as a function of the crystallized volume fraction, obtained using isoconversional methods. The top x-axis represents the temperature corresponding to the Friedman analysis, illustrating the relationship between activation energy and the crystallization temperature range.
3.3 Crystallization Kinetics under Predicted Isothermal Conditions
It should be emphasized that the following isothermal crystallization curves are predictive simulations derived from nonisothermal DSC data using AKTS software The AKTS software plays a powerful role in predicting thermal transformation behavior by employing kinetic parameters, namely the activation energy and pre-exponential factor derived from nonisothermal experimental data [26,30]. Once these parameters are established, the software enables accurate simulations of crystallization under arbitrary thermal programs T(t), including strictly isothermal conditions. Importantly, this predictive capability does not require the selection of a specific reaction model. Within the isoconversional framework, the product
This model-free predictive approach offers several important advantages. It provides reliable insight into long-term crystallization behavior and allows the optimization of thermal processing conditions without the need for time-consuming isothermal experiments [31]. Fig. 6 shows the predicted evolution of the crystallized fraction as a function of time under predictive isothermal conditions at temperatures ranging from 373 K to 453 K. The curves display the characteristic sigmoidal shape typical of thermally activated nucleation and growth processes. At lower temperatures, the transformation proceeds slowly, featuring extended induction periods and gradual progression toward completion (low slope). As the temperature increases, the curves shift markedly to shorter timescales, indicating a substantial acceleration in the crystallization kinetics (high slope). This behavior arises from enhanced atomic mobility and reduced energy barriers at elevated temperatures, which promotes faster nucleation and crystal growth.
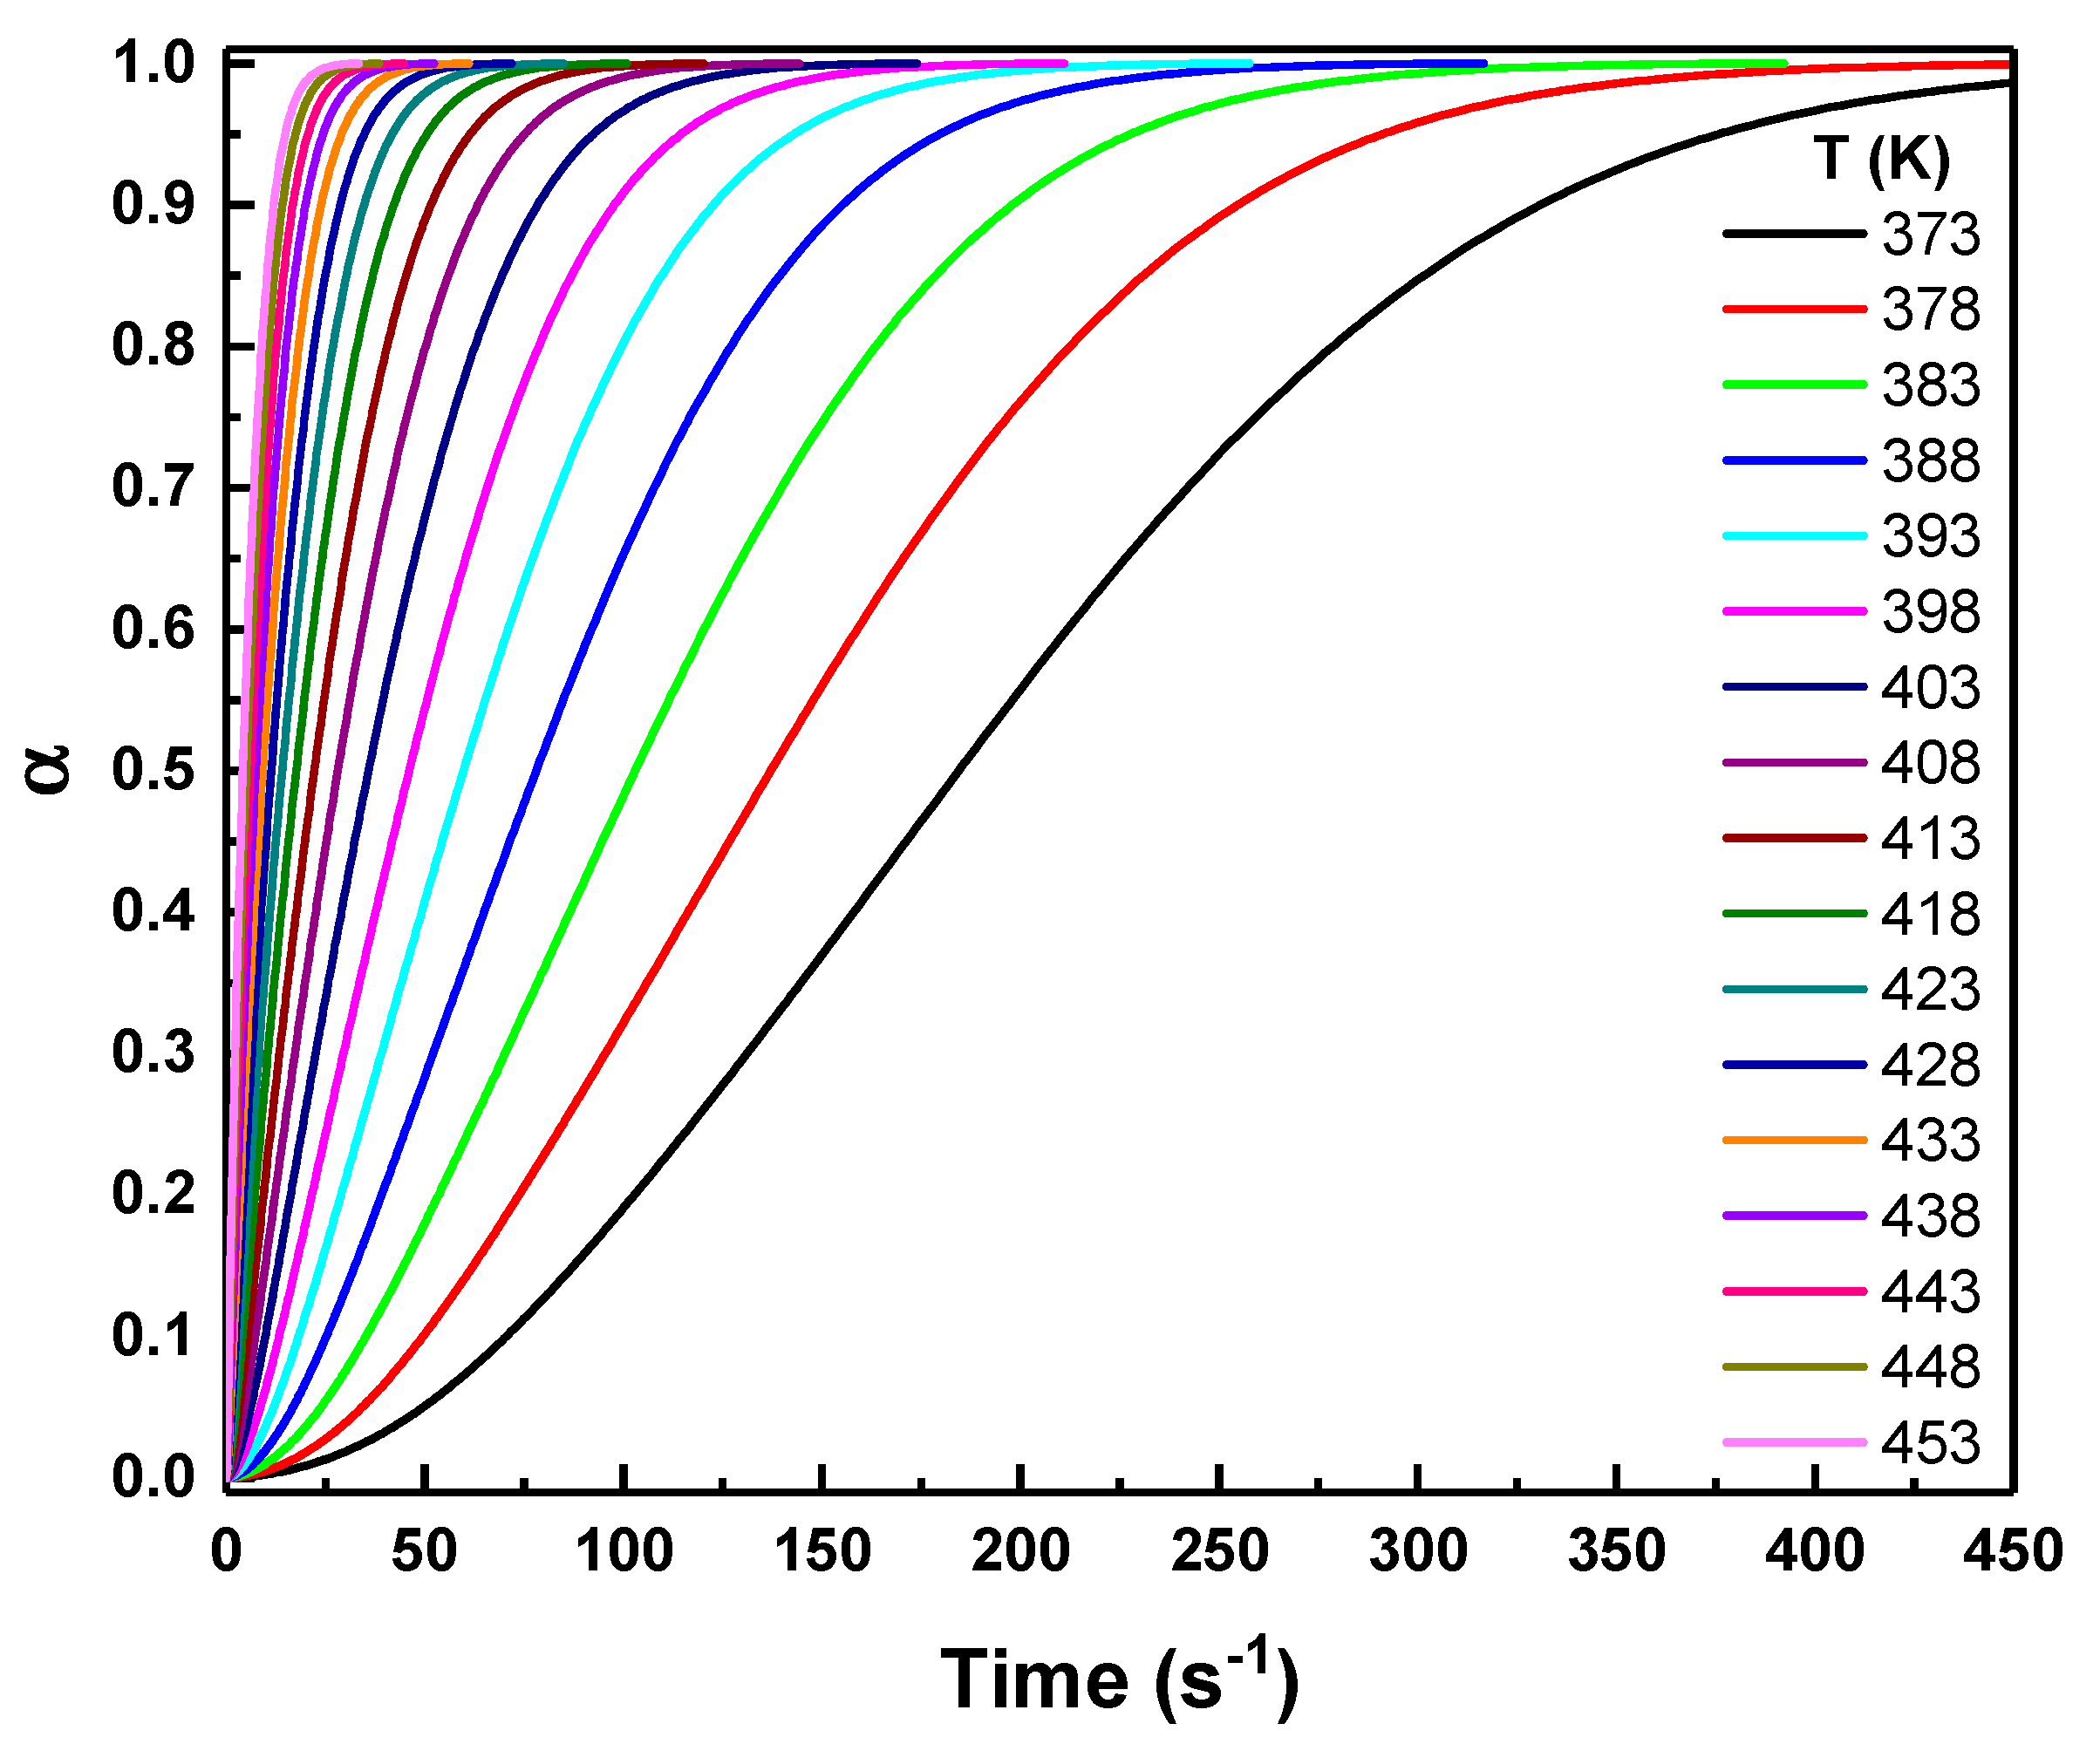
Figure 6: AKTS-predicted isothermal crystallization curves at selected temperatures ranging from 373 K to 453 K, simulated from nonisothermal DSC data.
The predicted isothermal conversion curves (Fig. 6) are utilized to determine the most appropriate crystallization reaction model at various temperatures. By evaluating the time required to reach a specific conversion level (commonly
This formulation provides a dimensionless framework for comparing experimental and theoretical conversion behavior under isothermal conditions. Here,
Table 1: Examples of common models used to describe solid-state reactions [21].
| Model Notation | Mechanism | ||
|---|---|---|---|
| A1.25 | Avrami-Erofeev, | ||
| A1.5 | Avrami-Erofeev, | ||
| A2 | Avrami-Erofeev, | ||
| A3 | Avrami-Erofeev, | ||
| A4 | Avrami-Erofeev, |
By plotting the normalized isothermal conversion data and fitting them to the various theoretical functions listed in Table 1, the dominant crystallization mechanism can be identified from the model that best reproduces the experimental trend. Each model reflects a specific combination of nucleation behavior and growth dimensionality. Therefore, when the experimentally reduced (normalized) curve shows close agreement with a particular functional form, it provides strong evidence that the corresponding crystallization mechanism governs the process at that isothermal temperature. As shown in Fig. 7, the degree of agreement between experimental and theoretical curves varies systematically with temperature. At lower isothermal temperatures, the experimental data exhibit an excellent fit with the A3 model (
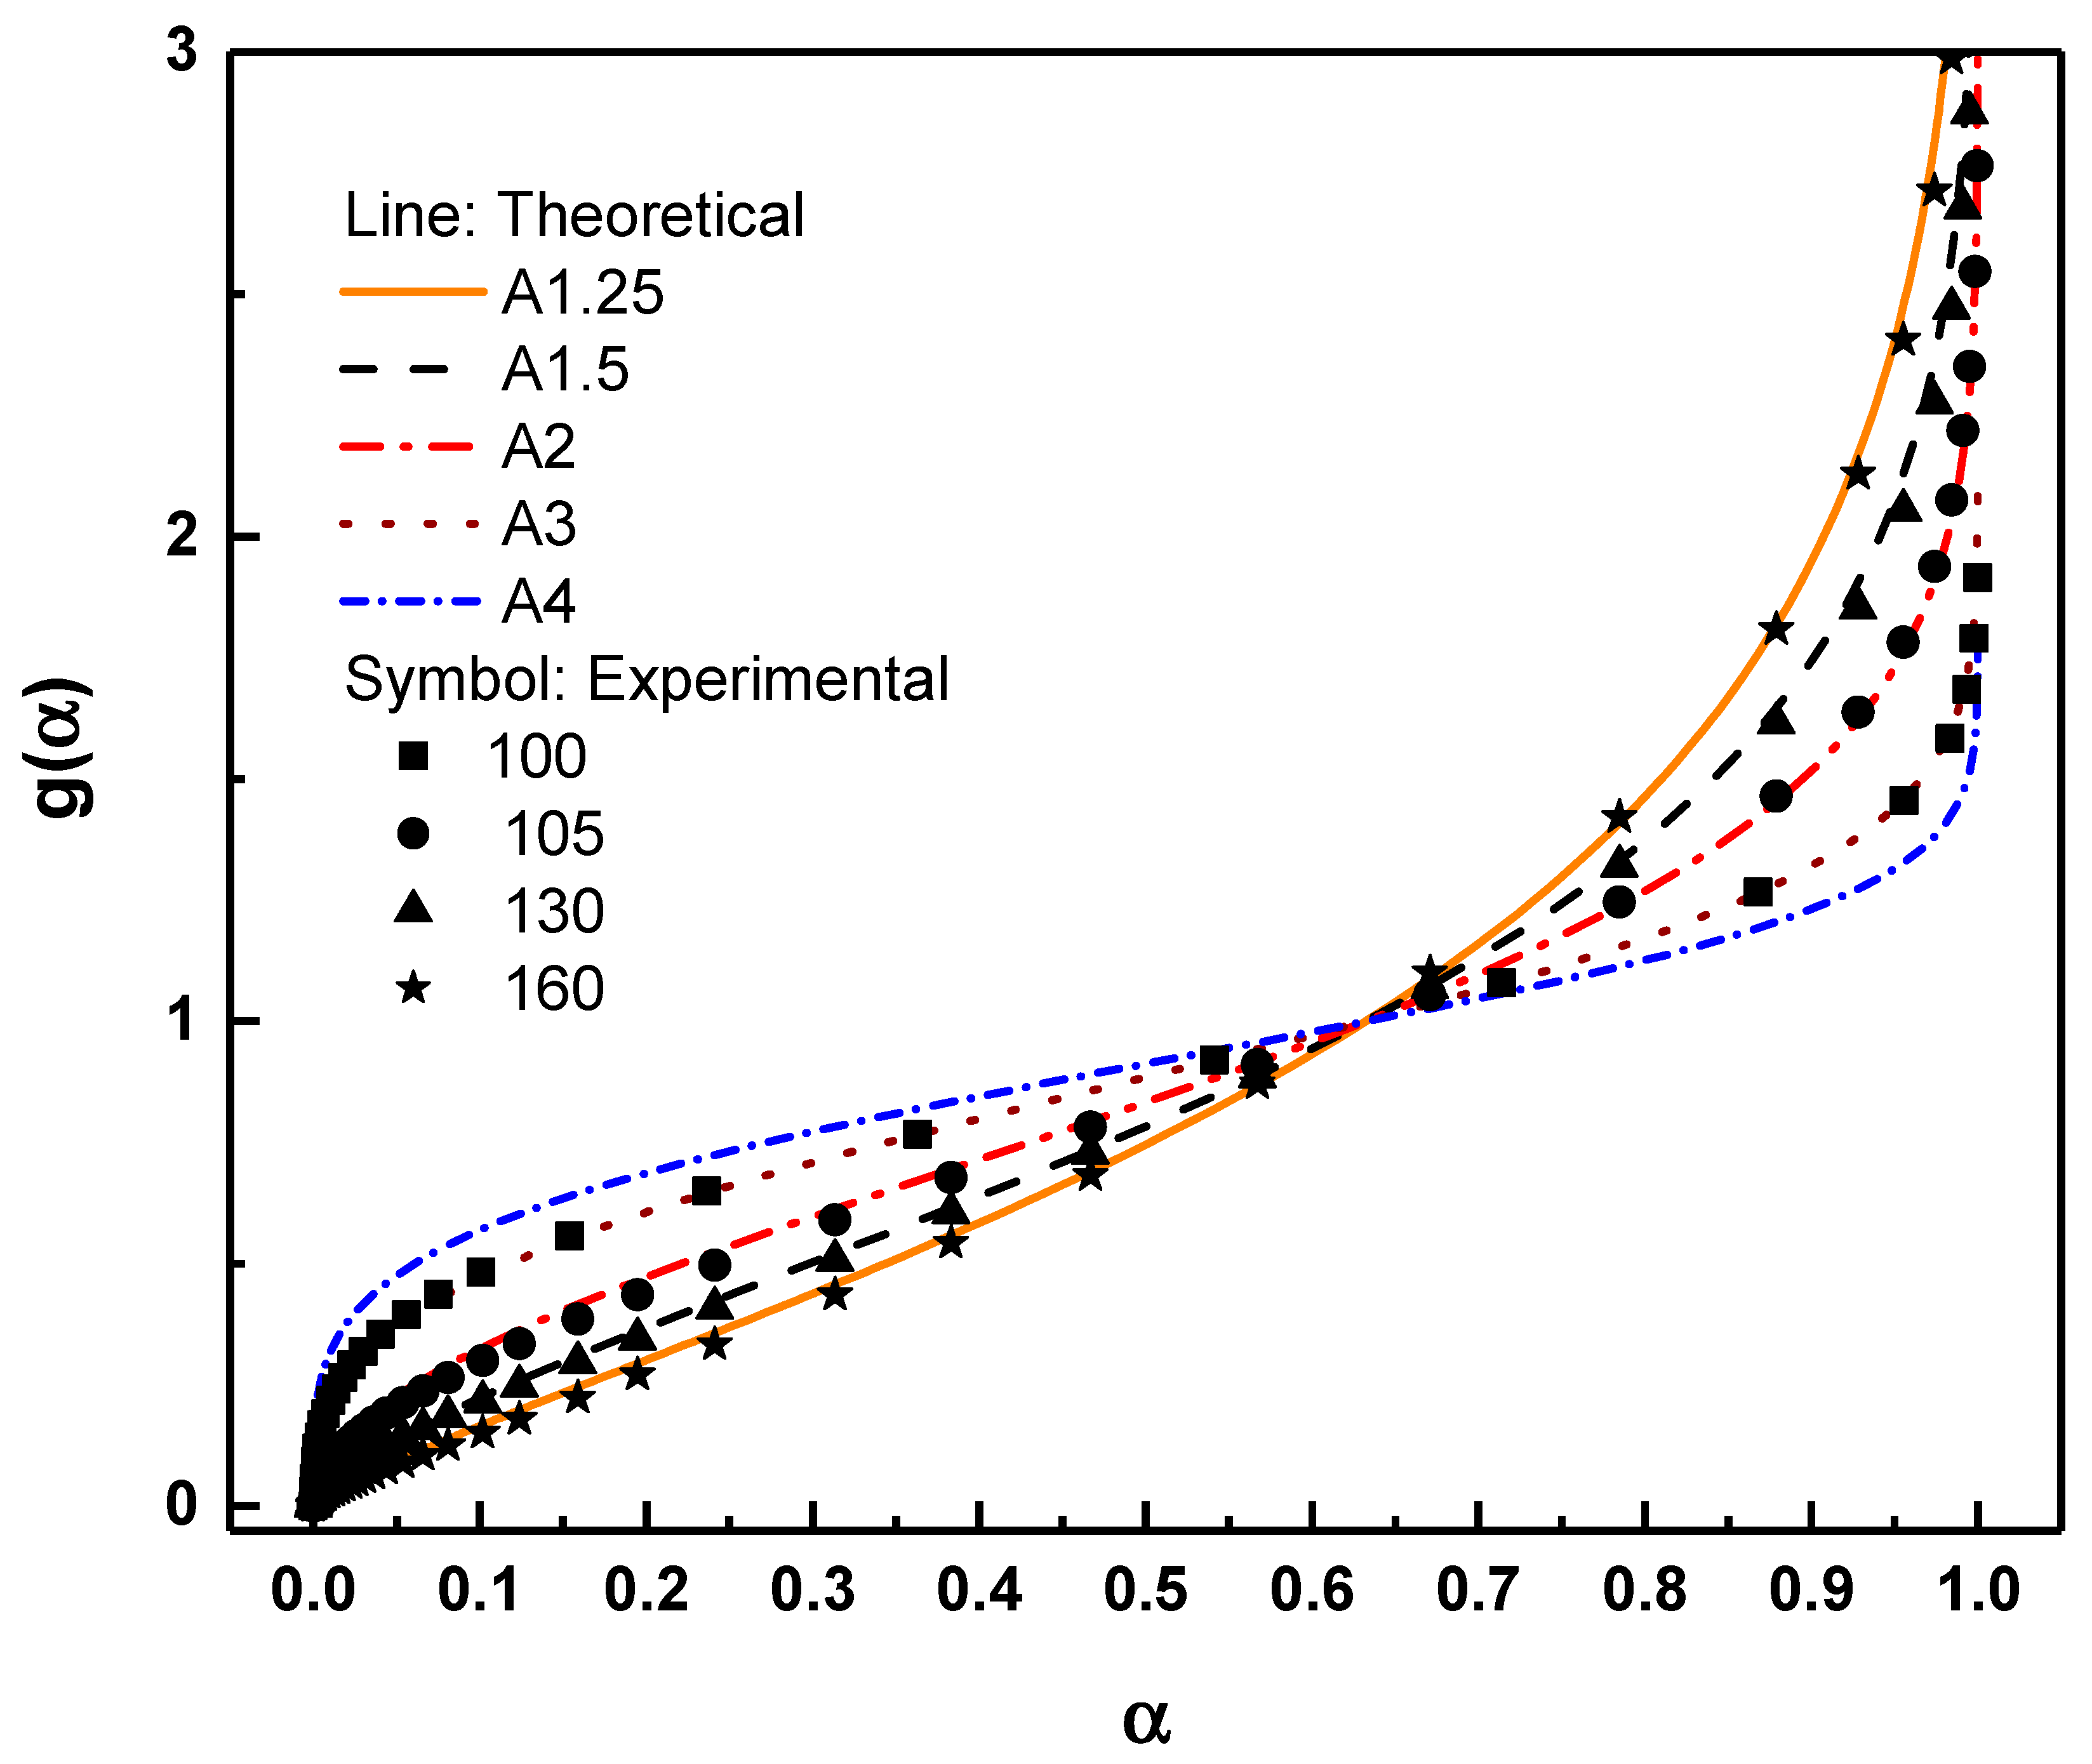
Figure 7: Comparison between the reduced experimental conversion data (symbols) and theoretical g(α) functions (lines) corresponding to Avrami–Erofeev models A1.25, A1.5, A2, and A3.
In nonisothermal experiments, the master plot method,
Experimentally, z(α) is given as [33]:
The above two equations can be normalized into the following form:
Fig. 8 presents the normalized master plots in the form of
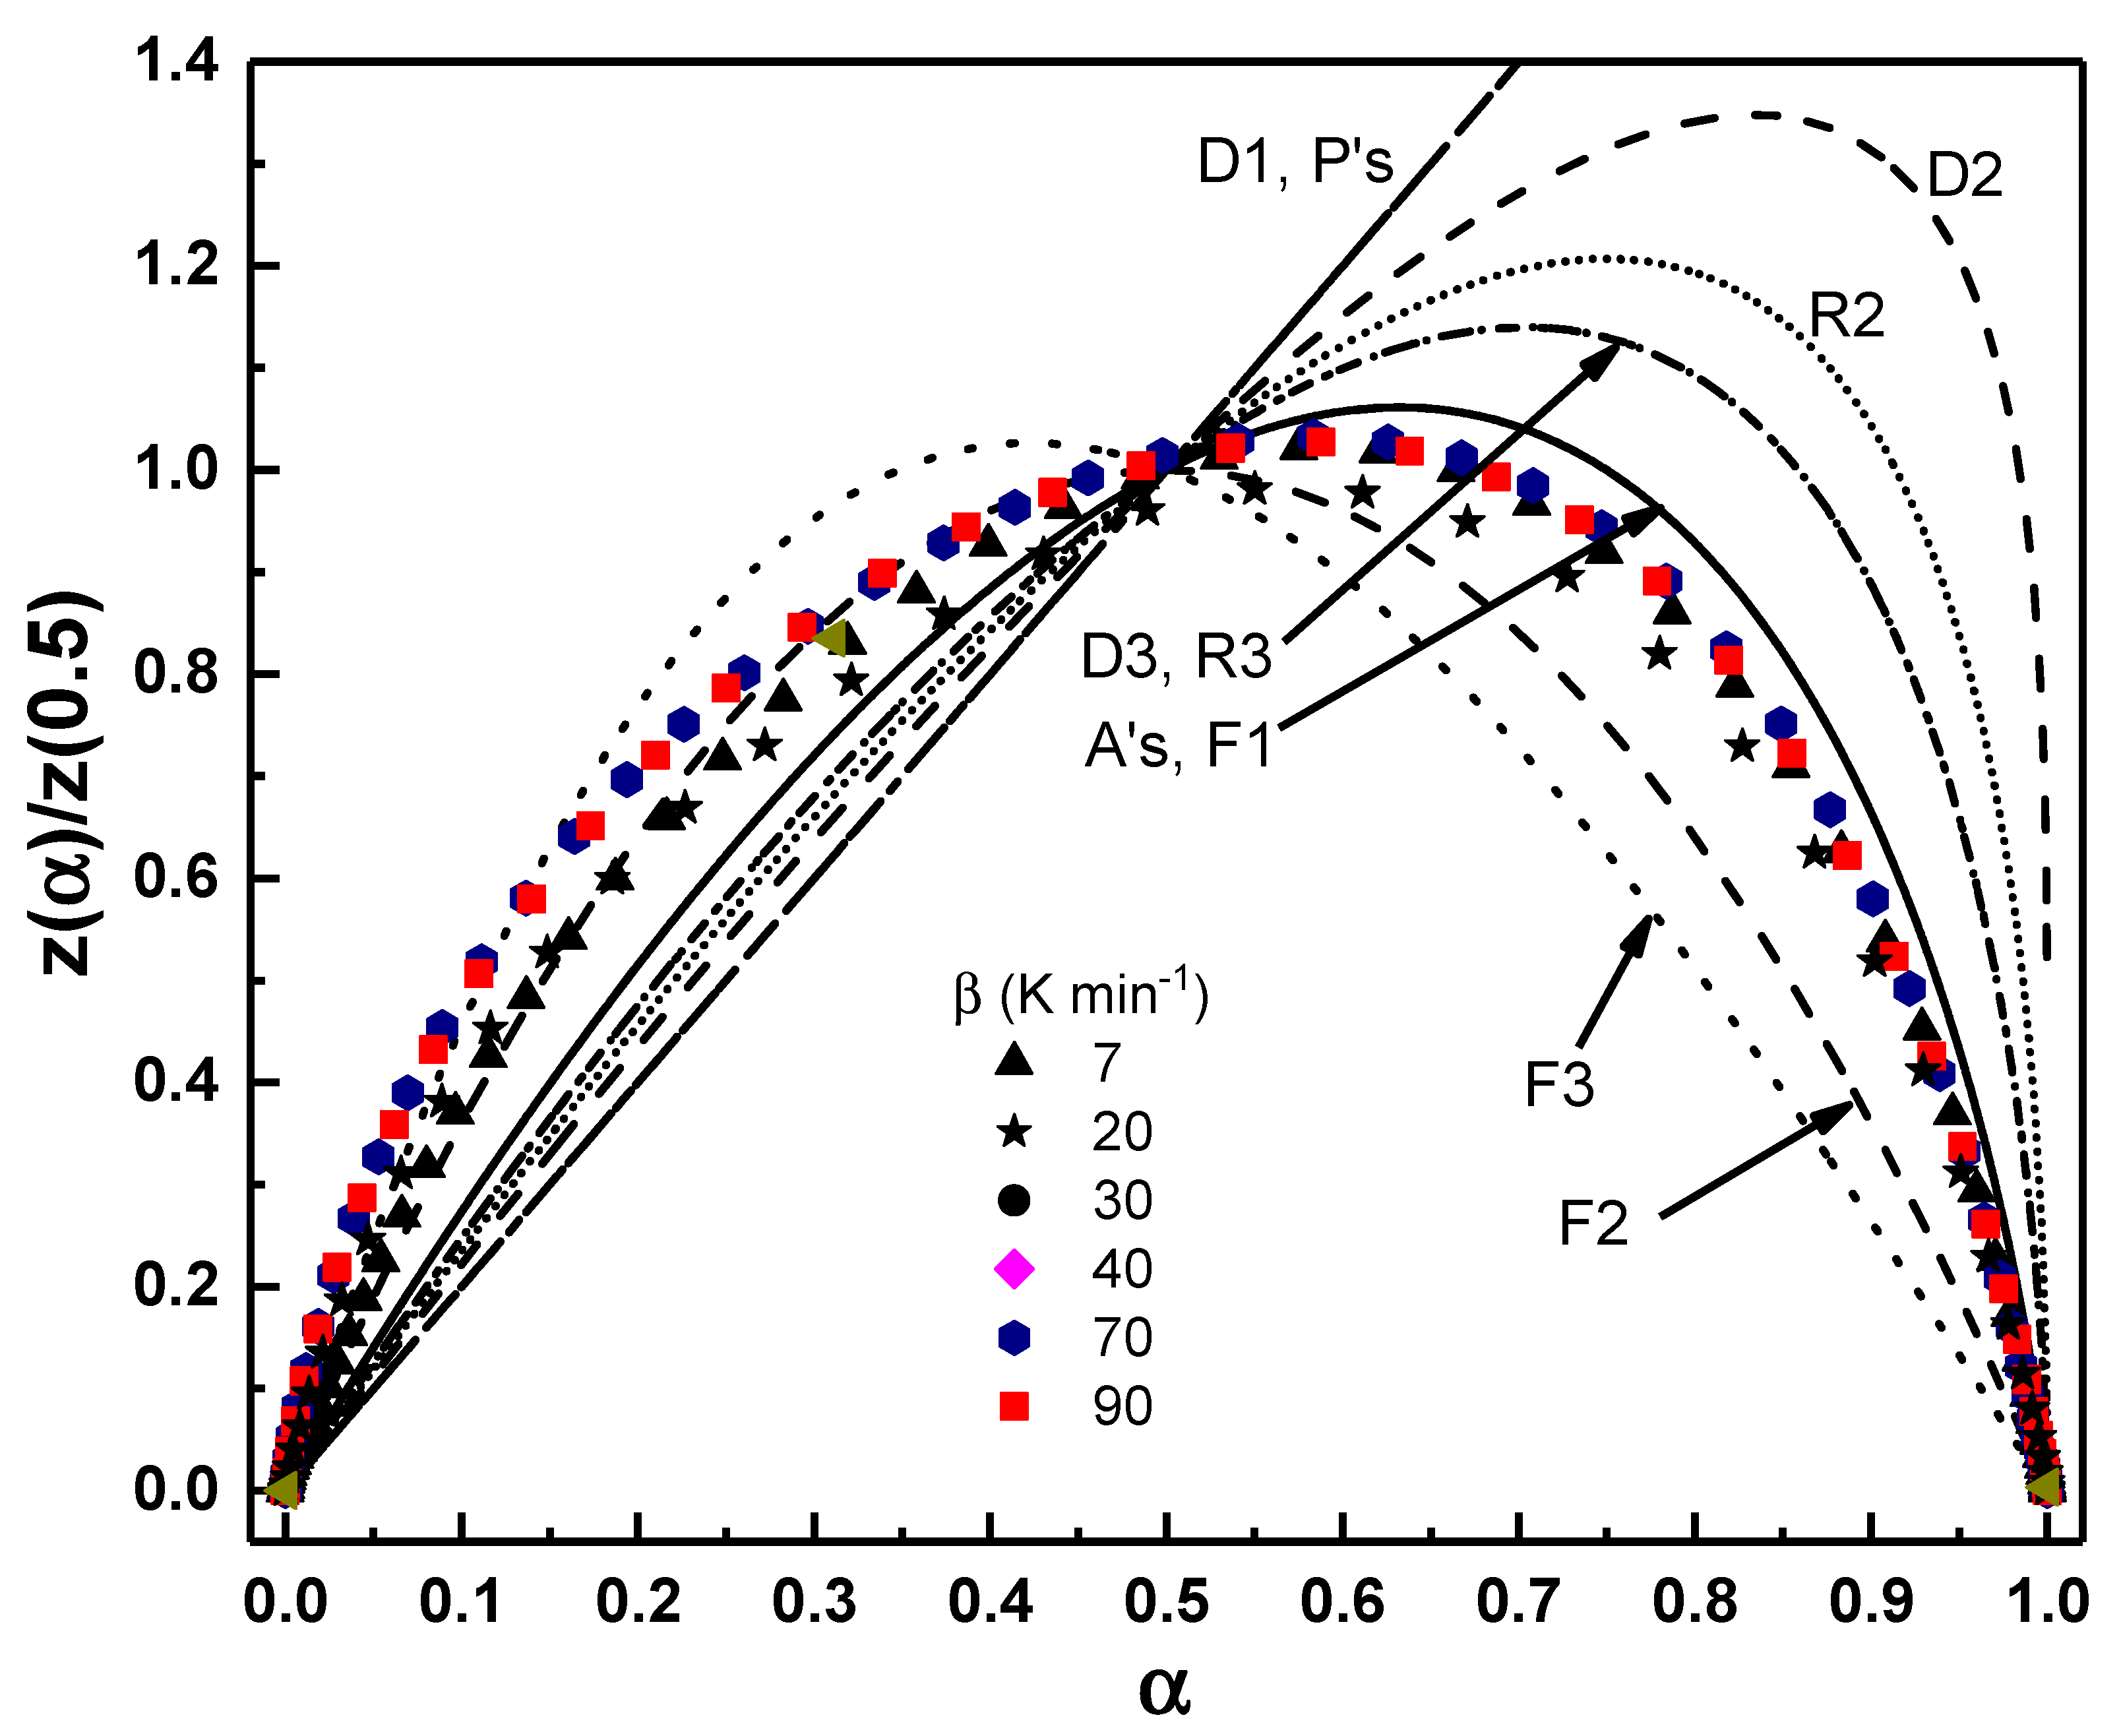
Figure 8: Comparison between theoretical and experimental z-master plots for the prediction of the solid-state reaction mechanism. The experimental data (symbols) are plotted against the theoretical master curves (solid and dashed lines) calculated using kinetic models.
Taken together, the two analyses provide complementary perspectives on the same crystallization pathway. Both the nonisothermal z-master plot and the isothermal model fitting highlight a two-stage mechanism: an early stage characterized by diffusion influence and a complex three-dimensional growth, followed by a later stage dominated by an Avrami-type interface-controlled crystallization with progressively simpler kinetics. The fact that the z-plot remains invariant across heating rates, while the isothermal fits reveal a temperature-dependent shift toward lower Avrami exponents, demonstrates a coherent mechanistic picture: the pathway is structurally robust, but the balance between diffusion, nucleation, and growth is modulated by thermal energy. These convergent findings reinforce the conclusion that the crystallization of Se–Te–Pb glasses follows a consistent two-regime mechanism, in agreement with earlier studies on related chalcogenide systems [34,35,36].
3.4 Evaluation of Thermal Behavior
The thermal metrics and glass-forming ability (GFA) of glassy materials are commonly assessed using empirical parameters derived from characteristic DSC temperatures, namely the glass transition temperature
Fig. 9 shows the heating-rate dependence of these thermal metrics. In Fig. 9a, the glass transition temperature increases from approximately 326 K at the lowest heating rate to about 343 K at the highest. This behavior reflects the well-known kinetic dependence of
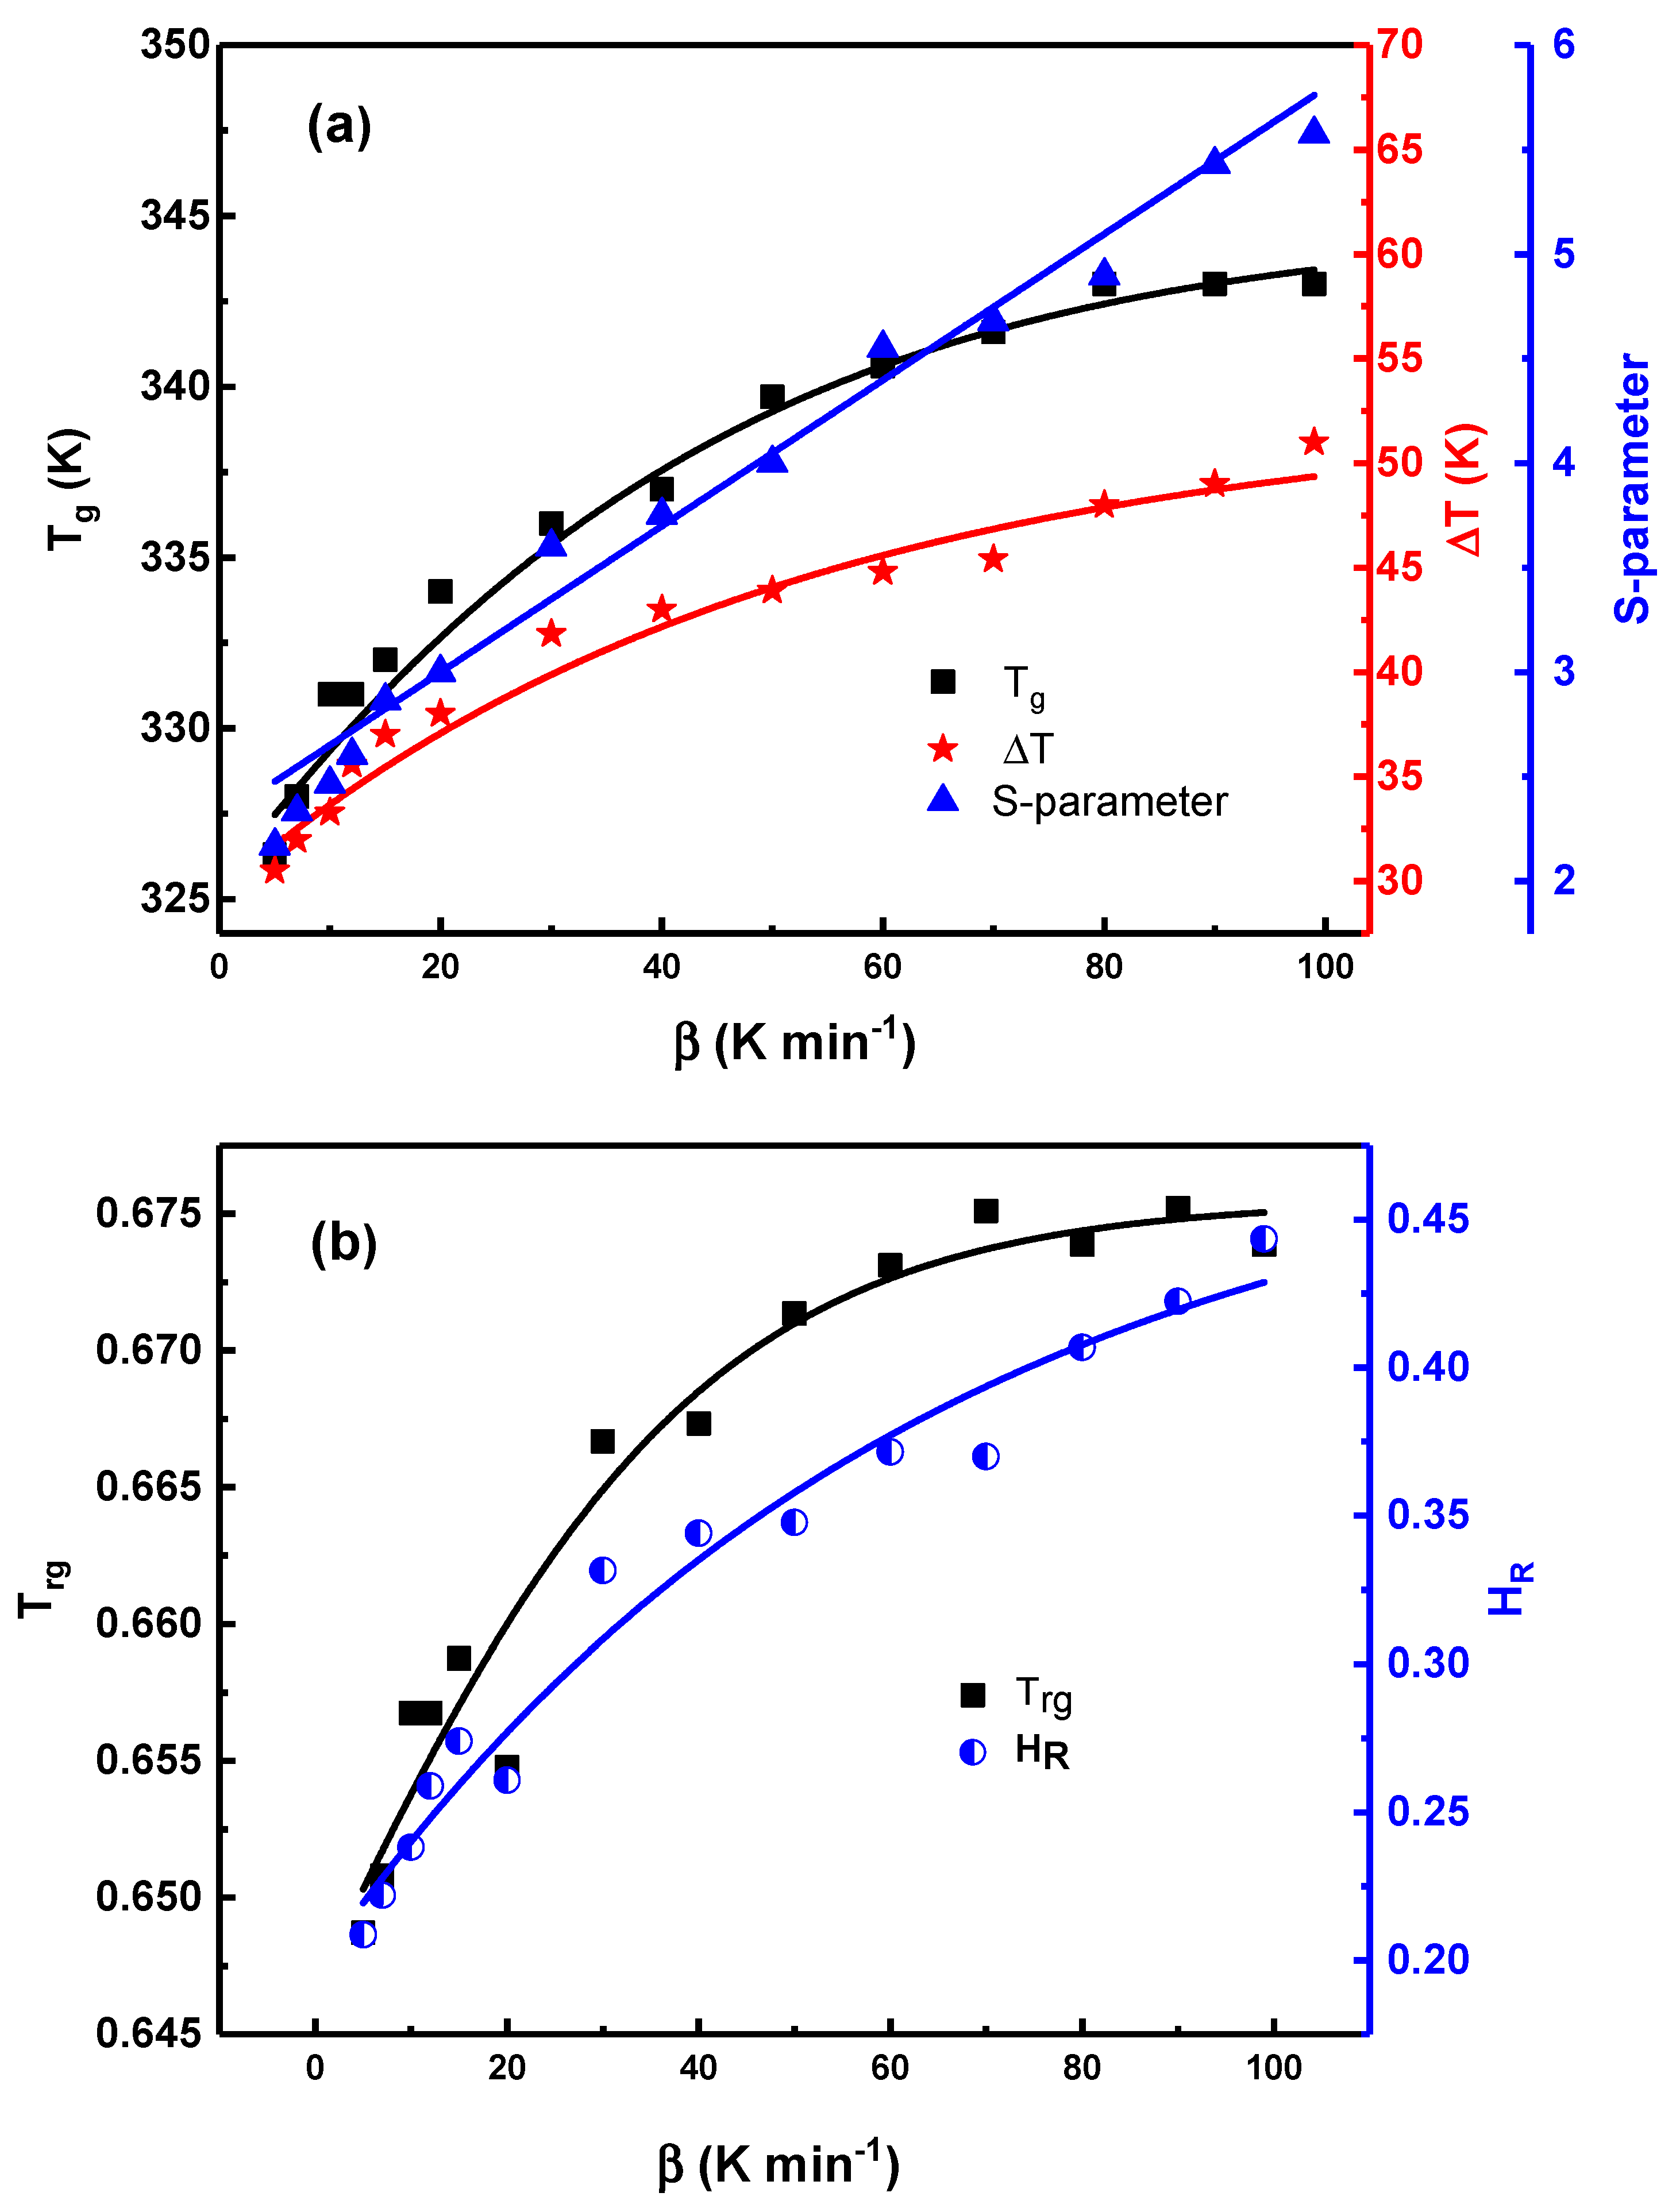
Figure 9: Variation of Tg and DT (left axis) and the
The supercooled liquid region
Fig. 9b shows that the reduced glass transition temperature
The obtained
Taken together, the thermal metrics in Fig. 9 demonstrate a clear rate-dependent postponement of crystallization onset as the heating rate increases. These parameters describe when crystallization begins under a given thermal protocol, whereas the activation energy obtained from kinetic analysis characterizes how crystallization proceeds once initiated. Delaying crystallization onset to higher temperatures places the system in a regime of enhanced atomic mobility, resulting in lower effective activation barriers during subsequent growth, consistent with isoconversional analyses and the Fisher–Turnbull framework [19,40].
While undoped Se–Te glasses exhibit a monotonic increase in thermal metrics such as
By contrast, the activation energy obtained from the kinetic analysis characterizes how crystallization proceeds once it has initiated, rather than when crystallization begins. The observed decrease in activation energy with increasing extent of crystallization, as revealed by the isoconversional analysis, is fully consistent with the thermal-metric trends discussed above. The rate-dependent postponement of crystallization onset to higher temperatures places the system in a regime of enhanced atomic mobility, so that once nucleation occurs, the subsequent transformation proceeds with a lower effective kinetic barrier.
Within the Fisher–Turnbull framework, initiation at elevated temperatures reduces the effective nucleation barrier and promotes diffusion-controlled growth. Consequently, crystallization evolves toward a growth-dominated regime in which the apparent activation energy decreases progressively with conversion. This behavior is characteristic of nonisothermal crystallization in chalcogenide glasses and has been widely reported for Se–Te–Pb systems, where isoconversional methods consistently show a monotonic decline of activation energy as crystallization advances, with only minor methodological variation between integral approaches [19].
In this context, the thermal metrics describe a rate-dependent delay of crystallization onset, whereas the activation-energy analysis captures the kinetic efficiency of the transformation after onset. The thermal and kinetic results therefore probe complementary stages of the same crystallization pathway and are mutually reinforcing rather than contradictory.
The crystallization behavior and thermal response of Se87.5Te10Pb2.5 glass were examined under nonisothermal conditions using DSC combined with model-free kinetic analysis. The conversion-dependent activation energy obtained from Friedman and Vyazovkin methods decreases with increasing temperature and crystallized fraction, indicating a multistep crystallization process. Avrami and Matusita analyses reveal a transition from predominantly three-dimensional growth at lower temperatures to lower-dimensional, diffusion-assisted growth at elevated temperatures. Thermal parameters derived from DSC, including the glass transition temperature, supercooled liquid region, Saad–Poulin parameter, reduced glass transition temperature, and Hruby number, increase systematically with heating rate, reflecting kinetically induced delays in crystallization onset rather than intrinsic thermodynamic stabilization. Pb incorporation preserves the fundamental kinetic behavior of Se–Te glasses while producing a composition-dependent upward shift in characteristic temperatures, consistent with Pb acting as a network modifier. Overall, the combined kinetic and thermal analyses clarify the role of low-level Pb incorporation in controlling crystallization pathways and apparent thermal stability in Se–Te glasses under practical heating conditions.
Acknowledgement:
Funding Statement: The author received no specific funding for this study.
Availability of Data and Materials: The author confirmed that the data supporting the findings of this study are available within the article.
Ethics Approval: Not applicable.
Conflicts of Interest: The author declares no conflicts of interest.
References
1. Chen Y, Song Z, Liang H, Guan X, Ma Y, Zou Y, et al. Amorphous tellurium–selenium alloy: A promising candidate material toward broadband optoelectronics. Laser Photonics Rev. 2025;19(23):e00586. doi:10.1002/lpor.202500586. [Google Scholar] [CrossRef]
2. Li R, Zhang X, Wang J, Liu Y, Chen Y. Flexible broadband photodiodes based on amorphous Te0.4Se0.6 alloy. ACS Photonics. 2024;11(6):2521–27. doi:10.1021/acsphotonics.4c00543. [Google Scholar] [CrossRef]
3. Tripathi D, Vyas HS, Kumar S, Panda SS, Hegde R. Recent developments in chalcogenide phase change material based nanophotonics. Nanotechnology. 2023;34:502001. doi:10.1088/1361-6528/acf1a7. [Google Scholar] [CrossRef]
4. Yamashita Y, Goto Y, Miura A, Moriyoshi C, Kuroiwa Y, Mizuguchi Y. n-Type thermoelectric metal chalcogenide (Ag,Pb,Bi)(S,Se,Te) designed by multi-site-type high-entropy alloying. Mater Res Lett. 2021;9:366–72. doi:10.1080/21663831.2021.1929533. [Google Scholar] [CrossRef]
5. Mondal R, Mondal S, Tudu P, Chatterjee P. Tunable band gap, CB and VB positions of multicomponent Se65−xTe20Ge15Snx chalcogenide glassy systems. Mater Chem Phys. 2023;296:127187. doi:10.1016/j.matchemphys.2022.127187. [Google Scholar] [CrossRef]
6. Mirzanezhad H, Hellier K, Teixeira M, Abbaszadeh S. Spectral performance of multilayer amorphous selenium and selenium–tellurium photodetectors. ACS Appl Opt Mater. 2025;3(3):646–55. doi:10.1021/acsaom.4c00475. [Google Scholar] [CrossRef]
7. Farid AS, Bhat AS, Majeed MRA, Abdullah H. Thermal kinetics and glass stability criteria of the Se70Te20Cd10 chalcogenide glass. Phase Transit. 2023;96(8):584–95. doi:10.1080/01411594.2023.2229932. [Google Scholar] [CrossRef]
8. Atyia HE. Non-isothermal crystallization kinetics, glass forming ability and thermal stability of Bi additive Se–Te–Ge alloys. J Therm Anal Calorim. 2025;150:13265–79. doi:10.1007/s10973-025-14555-4. [Google Scholar] [CrossRef]
9. Benjamin LK, Tabi CB, Matabana TK, Thobega M, Muiva CM. Non-isothermal crystallization kinetics of Se90−xTe10Mx chalcogenide glasses. Phys B. 2025;699:416865. doi:10.1016/j.physb.2024.416865. [Google Scholar] [CrossRef]
10. Shakra AM, Fadel M, Kalila AE. Effect of cadmium and zinc additives on transition temperatures and crystallization kinetics of Se98Te2 alloy. Indian J Phys. 2021;95:1939–47. doi:10.1007/s12648-020-01715-5. [Google Scholar] [CrossRef]
11. Abdel Rahim MA, El-Korashy A, Al-Ariki S. Crystallization studies on Se-Te-Cd chalcogenide glasses. Mater Trans. 2010;51:256–60. doi:10.2320/matertrans.MC200928. [Google Scholar] [CrossRef]
12. Hamad RA, Al-Garni SE, Al-Hazmi FS. Kinetic analysis of overlapping crystallization processes in Se88Te10Ag2 glass. J Therm Anal Calorim. 2023;148:6735–47. doi:10.1007/s10973-023-12331-w. [Google Scholar] [CrossRef]
13. Hussain Z, Khan SA, Mahmood K. Thermal stability and crystallization kinetics of Se0.75−ₓTe0.25Agₓ glasses and thick films. Chalcogenide Lett. 2024;21:65–75. doi:10.15251/cl.2024.211.65. [Google Scholar] [CrossRef]
14. Kamboj MS, Thangaraj R. Calorimetric studies of bulk Se–Te–Pb glassy system. Eur Phys J Appl Phys. 2003;24(1):33–6. doi:10.1051/epjap:2003052. [Google Scholar] [CrossRef]
15. Khan SA, Khan ZH, Zulfequar M, Husain M. Kinetics study of a-Se80Te20−xPbx using non-isothermal crystallization. Phys B. 2007;400(1–2):180–4. doi:10.1016/j.physb.2007.07.013. [Google Scholar] [CrossRef]
16. Khan SA. Optical characterization of nanocrystalline Se85Te10Pb5 thin films. Superlattices Microstruct. 2010;47(6):695–704. doi:10.1016/j.spmi.2010.03.007. [Google Scholar] [CrossRef]
17. Atyia HE, Farid AS. Non-isothermal crystallization kinetics of ternary Se90Te10−xPbx glasses. J Cryst Growth. 2016;436:125–33. doi:10.1016/j.jcrysgro.2015.12.004. [Google Scholar] [CrossRef]
18. Joraid AA, Alhosuini IMA. Effect of heating rate on the kinetics and mechanism of crystallization in amorphous Se85Te10Pb5 glasses. Thermochim Acta. 2015;595:28–34. doi:10.1016/j.tca.2014.09.002. [Google Scholar] [CrossRef]
19. Vashista P, Patial BS, Anjalia A, Tripathi SK, Thakur N. Iso-conversional study of crystallization activation energy of Se–Te–Pb glass using DSC. Indian J Pure Appl Phys. 2020;58:135–40. [Google Scholar]
20. Advanced Kinetics and Technology Solutions SA. AKTS-Thermokinetics User Manual. Siders, Switzerland: AKTS AG; 2020. [Google Scholar]
21. Vyazovkin S, Burnham AK, Favergeon L, Koga N, Moukhina E, Pérez-Maqueda LA, et al. ICTAC recommendations for analysis of multistep kinetics. Thermochim Acta. 2020;689:178597. doi:10.1016/j.tca.2020.178597. [Google Scholar] [CrossRef]
22. Koga N, Vyazovkin S, Burnham AK, Favergeon L, Muravyev NV, Pérez-Maqueda LV, et al. ICTAC recommendations for thermal decomposition kinetics. Thermochim Acta. 2023;719:179384. doi:10.1016/j.tca.2022.179384. [Google Scholar] [CrossRef]
23. Joraid AA, Al Marweny AA, Al Maghrabi MA. Particle size effects on crystallization kinetics of Se85Te10Sb5 glass. J Therm Anal Calorim. 2022;147:621–31. doi:10.1007/s10973-021-10790-7. [Google Scholar] [CrossRef]
24. Matusita K, Komatsu T, Yokota R. Kinetics of non-isothermal crystallization process in amorphous materials. J Mater Sci. 1984;19:291–6. doi:10.1007/BF02403137. [Google Scholar] [CrossRef]
25. Atayeva SU, Isayev AI, Mekhtiyeva SI, Garibova SN, Alekberova RI, Mammadov FN. Glass transition and crystallization of Se95Te5 chalcogenide glassy semiconductor. Chalcogenide Lett. 2024;21(4):355–63. doi:10.15251/CL.2024.214.355. [Google Scholar] [CrossRef]
26. Joraid AA, Alamri SN, Abu-Sehly AA. Model-free analysis of non-isothermal kinetics of selenium. J Non-Cryst Solids. 2008;354:3434–9. doi:10.1016/j.jnoncrysol.2008.02.002. [Google Scholar] [CrossRef]
27. Avrami M. Kinetics of phase change. I. General theory. J Chem Phys. 1940;8(2):110–7. doi:10.1063/1.1750631. [Google Scholar] [CrossRef]
28. Vyazovkin S. Advanced isoconversional method. J Therm Anal. 1997;49:1493–9. doi:10.1007/BF01983708. [Google Scholar] [CrossRef]
29. Turnbull D, Fisher JC. Rate of nucleation in condensed systems. J Chem Phys. 1949;17:71–3. doi:10.1063/1.1747055. [Google Scholar] [CrossRef]
30. Roduit B, Xia L, Folly P, Berger J, Mathieu A, Sarbach H, et al. Simulation of thermal behavior of energetic materials based on DSC and HFC signals. J Therm Anal Calorim. 2008;93:143–52. doi:10.1007/s10973-007-8864-3. [Google Scholar] [CrossRef]
31. Roduit B, Hartmann M, Folly P, Sarbach A, Dejeaifve A, Dobson R, et al. Kinetic analysis of solids of the quasi-autocatalytic decomposition type: SADT determination of low-temperature polymorph of AIBN. Thermochim Acta. 2018;665:119–26. doi:10.1016/j.tca.2018.05.015. [Google Scholar] [CrossRef]
32. Černošková E, Holubová J, Černošek Z. Crystallization kinetics of glassy As2Se3. J Therm Anal Calorim. 1999;58:367–75. doi:10.1023/A:1010175307204. [Google Scholar] [CrossRef]
33. Criado JM. Kinetic analysis of DTG data from master curves. Thermochim Acta. 1978;24:186–9. doi:10.1016/0040-6031(78)85151-X. [Google Scholar] [CrossRef]
34. Deepika K, Rathore KS, Saxena NS. Kinetic analysis of non-isothermal glass–crystal transformation in Ge–Sn–Se glasses. J Phys Condens Matter. 2012;24:215402. [Google Scholar]
35. Kamboj MS, Thangaraj R. Thermal investigations in bulk Se–Te–Bi glasses. J Ovonic Res. 2006;2:1–8. [Google Scholar]
36. Shelby JE. Introduction to glass science and technology. 2nd ed. Cambridge, UK: RSC; 2005. doi:10.1039/9781847551160. [Google Scholar] [CrossRef]
37. Dietzel A. Glass structure and glass properties. Glasstech Ber. 1968;41:1–8. [Google Scholar]
38. Saad M, Poulain M. Glass forming ability criterion. Mater Sci Forum. 1987;19–20:11–8. doi:10.4028/www.scientific.net/MSF.19-20.11 [Google Scholar] [CrossRef]
39. Hrubý A. Evaluation of glass-forming tendency by DTA. Czech J Phys. 1972;22:1187–93. doi:10.1007/BF01690134. [Google Scholar] [CrossRef]
40. Sarswat KK, Mehta N, Dahshan A. Thermodynamic approach to indium-enriched Se–Te–Sn alloys. Phys B. 2025;699:416854. doi:10.1016/j.physb.2024.416854. [Google Scholar] [CrossRef]
41. Schawe JEK. Correction of thermal inertia on scanning calorimetry. Thermochim Acta. 2025;751:180062. doi:10.1016/j.tca.2025.180062. [Google Scholar] [CrossRef]
42. Anjali, Patial BS, Choudhary V, Kapoor A, Devi S, Thakur N. Study of glass transition temperature in Se–Te–Pb glassy system using modified Gibbs–Di Marzio law. J Condensed Matter. 2025;3(2):163–7. doi:10.61343/jcm.v3i02.143. [Google Scholar] [CrossRef]
43. Lasocka M. Effect of heating rate on glass transition temperature of selenium. Mater Sci Eng. 1976;23:173–7. doi:10.1016/0025-5416(76)90189-0. [Google Scholar] [CrossRef]
44. Kissinger HE. Reaction kinetics in differential thermal analysis. Anal Chem. 1957;29:1702–6. doi:10.1021/ac60131a045. [Google Scholar] [CrossRef]
45. Kauzmann W. The nature of the glassy state. Chem Rev. 1948;43:219–56. doi:10.1021/cr60135a002. [Google Scholar] [CrossRef]
Cite This Article
 Copyright © 2026 The Author(s). Published by Tech Science Press.
This work is licensed under a Creative Commons Attribution 4.0 International License , which permits unrestricted use, distribution, and reproduction in any medium, provided the original work is properly cited.
 Downloads
 Citation Tools