
 Submit a Paper
 Propose a Special lssue
 Open Access
ARTICLE

Corrosion and Wear Resistance of Electro-Deposited Zn–Ni/ZnS Nanocomposite Coatings on Mild Steel for Mechanical Applications
1 School of Automotive Engineering, Shaanxi Vocational & Technical College, Xi’an, China
2 High-speed Railway Engineering College, Shaanxi Railway Institute of Technology, Weinan, China
* Corresponding Author: Wei Kang. Email:
Chalcogenide Letters 2026, 23(3), 3 https://doi.org/10.32604/cl.2026.077859
Received 18 December 2025; Accepted 17 February 2026; Issue published 03 April 2026
 View Full Text
 Download PDF
Abstract
A sulfate–chloride electrolyte was used to deposit alloy layers on AISI 1018 coupons while co-introducing ZnS nanoparticles (5–20 g/L) to tune microstructure and durability under combined saline exposure and dry sliding. Cross-sectional SEM confirmed continuous deposits of ~24–26 μm, and XRD indicated γ-phase dominance with pronounced grain refinement: crystallite size decreased from 42 ± 3 nm (particle-free) to 28 ± 2 nm at 15 g/L. In 3.5 wt% NaCl, polarization data showed a progressive ennoblement of Ecorr from −1.032 to −0.981 V (vs. SCE) together with a reduction of icorr from 8.47 to 1.82 μA/cm2 at 15 g/L. Impedance fitting corroborated the trend, with charge-transfer resistance increasing from 4.8 to 32.6 kΩ·cm2 after 1 h immersion. In a 500 h neutral salt-spray test, red rust appeared at 280 ± 15 h on the particle-free alloy, whereas the 15 g/L formulation showed no red rust after 500 h and only uniform white products. Mechanical response improved in parallel: microhardness rose from 245 ± 12 to 398 ± 15 HV, and pin-on-disc testing (10 N, 0.1 m/s, 1000 m; alumina counterface) reduced wear volume loss from 1.85 × 10⁻³ to 0.52 × 10⁻³ mm3 and lowered steady-state friction from ~0.68 to ~0.45. Performance peaked at 15 g/L, while 20 g/L produced a modest regression, a trend that is consistent with classical electrodeposited nanocomposite behavior in which an intermediate particle loading optimizes incorporation and matrix refinement, whereas excessive loading promotes agglomeration and growth disruption/defect formation that offsets the benefits. For a normalized, like-for-like benchmark, a Zn–Ni/Al2O3 composite was co-deposited and tested under the same conditions (identical substrate preparation, current density, bath temperature/pH, and comparable thickness of ~24–26 μm). Under these controlled conditions, the optimized Zn–Ni/15 g L−1 ZnS coating exhibited a lower corrosion current density (icorr = 1.82 μA cm−2 vs. 3.15 μA cm−2 for Zn–Ni/Al2O3; ≈42% reduction) and a lower specific wear rate, calculated as V/(F·L), of 5.2 × 10⁻⁸ mm3 N−1 m−1 vs. 7.1 × 10⁻⁸ mm3 N−1 m−1 for Zn–Ni/Al2O3 (≈27% reduction), thereby supporting a normalized performance comparison without relying on non-equivalent test conditions.Keywords
The relentless pursuit of enhanced durability and longevity for steel components in aggressive environments, such as automotive, marine, and aerospace industries, has driven extensive research into advanced protective coatings. Mild steel, prized for its low cost and excellent mechanical properties, suffers from poor corrosion resistance, necessitating effective surface modification [1]. Among various protective strategies, electro-deposited zinc-nickel (Zn–Ni) alloy coatings have emerged as a leading candidate to replace toxic cadmium coatings, offering a compelling combination of sacrificial protection and good mechanical integrity [2]. The corrosion resistance of Zn–Ni coatings is superior to that of pure zinc, primarily attributed to the formation of the single γ-phase (Ni5Zn21) at approximately 10–15 wt% Ni content, which provides a more noble and stable barrier [3]. However, while their corrosion properties are well-documented, the tribological performance of standard Zn–Ni coatings often requires further enhancement for demanding mechanical applications involving friction and wear [4].
The incorporation of second-phase nanoparticles into metal matrices to form nanocomposite coatings represents a paradigm shift in surface engineering. This approach synergistically combines the properties of the metal matrix with those of the dispersed particles, leading to significant improvements in hardness, wear resistance, and often corrosion protection [5]. However, improved hardness alone should not be taken as evidence of improved corrosion protection; corrosion performance is governed primarily by electrochemical kinetics and by electrolyte transport through coating defects/porosity [6], and must be supported by electrochemical measurements (e.g., polarization/EIS) and microstructural evidence. Numerous studies have demonstrated the efficacy of incorporating oxides (e.g., Al2O3, SiO2, TiO2), carbides (e.g., SiC, WC), and polymers (e.g., PTFE) into Zn–Ni matrices [7]. Zn–Ni/Al2O3 composites have been reported to reduce wear loss and improve corrosion resistance compared to particle-free Zn–Ni when evaluated by electrochemical methods such as polarization and electrochemical impedance spectroscopy [8]. Zn–Ni/SiO2 and Zn–Ni/Al2O3 composites show markedly lower wear loss and improved corrosion resistance compared to their monolithic alloy counterparts [9]. Despite these advances, the exploration of metal chalcogenides, specifically zinc sulfide (ZnS), as a reinforcing phase in Zn–Ni coatings remains conspicuously absent from the literature, as confirmed by the lack of direct references in the provided search results [10].
ZnS is a hard, chemically stable second phase and is therefore proposed here as a hypothesis-driven reinforcement for Zn–Ni electrodeposits. In metal-matrix composite electrodeposition, dispersed, largely inert particles are widely reported to modify deposit growth by increasing nucleation density and refining grains, while also reducing defect connectivity and increasing electrolyte transport tortuosity [11]; these effects have been used to rationalize corrosion improvements in established Zn–Ni/oxide composite coatings and are consistent with classical particle-codeposition concepts [12]. In this work, we therefore do not presume corrosion enhancement from ZnS addition; instead, corrosion resistance is evaluated quantitatively by open-circuit potential stabilization, potend electrochemical impedance spectroscopy in 3.5 wt% NaCl, and is benchmarked against a Zn–Ni/Al2O3 composite deposited and tested under identical electroplating and test conditions. However, we explicitly note that a strict mechanistic comparison between different reinforcement chemistries requires accounting for particle attributes (primary size, agglomeration in bath, morphology, and surface chemistry), because these variables govern particle adsorption/incorporation kinetics and can modify coating compactness/defect connectivity and thus corrosion and wear responses. This has been widely discussed in composite electrodeposition models (e.g., Guglielmi-type adsorption/incorporation concepts) and in experimental studies where changing particle size or dispersion conditions alone shifts incorporation and corrosion behavior [13].
The primary objectives are: (1) to optimize the electro-deposition parameters for the successful co-deposition of ZnS nanoparticles within a Zn–Ni alloy matrix; (2) to conduct a comprehensive multi-technique material characterization of the coatings, including phase composition, chemical bonding, morphology and microstructure, and optical properties (UV-Vis); and (3) to quantitatively evaluate the corrosion and wear resistance of these novel nanocomposites in comparison to pure Zn–Ni and other benchmark composite coatings. By providing a detailed analysis of the structure-property relationships, this research seeks to establish Zn–Ni/ZnS as a next-generation coating system for enhanced mechanical and chemical durability.
2.1 Substrate Preparation and Materials
Low-carbon mild steel coupons (AISI 1018, dimensions 50 mm × 25 mm × 2 mm) were employed as substrates. Prior to deposition, the substrates underwent a rigorous preparation sequence: mechanical polishing using successive silicon carbide papers up to 1200 grit, followed by ultrasonic degreasing in acetone and alkaline solution for 10 min each, and finally, acid pickling in a 10% v/v HCl solution for 60 s to remove the native oxide layer. They were then rinsed thoroughly with deionized water and dried under a warm air stream. The electroplating bath was formulated based on a well-established sulfate-chloride system for Zn–Ni alloy deposition [14]. The base electrolyte contained 120 g/L ZnSO4·7H2O, 80 g/L NiSO4·6H2O, 30 g/L NiCl2·6H2O, and 30 g/L H3BO3 as a buffering agent. To promote nanoparticle dispersion and incorporation, 10 g/L of sodium citrate (Na3C6H5O7) was added as a complexing and stabilizing agent [15]. ZnS nanoparticles were used as the reinforcing phase. The primary particle size was quantified from TEM micrographs by measuring at least 100 particles using ImageJ. In addition, dynamic light scattering (DLS) was used to evaluate the hydrodynamic size distribution of ZnS in the plating bath after ultrasonication (1 h), which provides a direct indicator of dispersion quality and the extent of agglomeration in suspension. Because nanoparticle agglomeration can reduce effective incorporation and introduce occluded defects in the growing deposit, the DLS-derived hydrodynamic size is used in this work as a dispersion-stability metric to support interpretation of the ‘optimum loading’ behavior observed at intermediate ZnS additions. A cationic surfactant, cetyltrimethylammonium bromide (CTAB, 0.2 g/L), was employed as the dispersant to suppress ZnS agglomeration and to promote particle transport toward the cathode by rendering the particle surface positively charged through surfactant adsorption, a strategy widely used in composite electrodeposition to improve suspension stability and particle incorporation [16]. The stabilizing contribution of citrate (electrostatic/steric effects in addition to complexation) further supports dispersion under vigorous stirring, consistent with established dispersant behavior in nanoparticle suspensions [17].
2.2 Electrodeposition of Coatings
A conventional two-electrode cell configuration was used with a pure zinc anode (99.99%) and the prepared mild steel cathode. The bath was maintained at a constant temperature of 50 ± 2°C and a pH of 4.0 ± 0.2, conditions known to favor the deposition of the desirable γ-phase [18]. Direct current (DC) electrodeposition was performed at a current density of 30 mA/cm2 for a duration of 40 min to achieve a target coating thickness of approximately 25 μm. To study the effect of reinforcement, ZnS nanoparticles were added to the vigorously stirred electrolyte at concentrations of 5, 10, 15, and 20 g/L. For comparison, a pure Zn–Ni coating (0 g/L ZnS) and a Zn–Ni/10 g/L Al2O3 (40 nm) coating were also prepared under identical conditions. The Al2O3 composite was selected as a reference composite because Zn–Ni/Al2O3 is among the most widely studied Zn–Ni nanocomposite systems and is frequently used to benchmark corrosion and mechanical performance improvements relative to particle-free Zn–Ni [19]. Additional oxide/carbide controls (e.g., SiO2, TiO2, SiC, WC) were not included in the present experimental matrix to avoid expanding the number of baths and deposition/dispersion conditions; therefore, conclusions are limited to a like-for-like comparison against the Zn–Ni/Al2O3 benchmark under matched deposition and test conditions [20]. Prior to deposition, the bath containing nanoparticles was ultrasonicated for 1 h and magnetically stirred throughout the plating process to maintain suspension homogeneity.
Although the Zn–Ni/Al2O3 coating was produced under identical electroplating and test conditions, particle attributes can independently affect corrosion and wear by controlling codeposition efficiency and coating defect structure. In particular, oxide particles (Al2O3) possess hydroxylated surfaces that interact strongly with ions/dispersants and can show different zeta potential and agglomeration behavior compared with sulfides, which in turn changes the ‘effective’ particle size in bath and the incorporated particle fraction. Prior studies demonstrate that altering Al2O3 particle size or dispersion conditions can shift incorporation and corrosion response even within the same matrix, underscoring that reinforcement chemistry cannot be isolated from particle attributes in a strict comparison [21]. Accordingly, the Zn–Ni/ZnS versus Zn–Ni/Al2O3 comparison in this work is framed as a process-matched benchmark under the specific particle attributes used, and mechanistic interpretation focuses on evidence-supported microstructure/defect-controlled transport and incorporation-aware trends rather than a chemistry-only ranking.
2.3 FTIR Sample Preparation and Measurement
For FTIR analysis, ‘coating powder’ refers to material obtained directly from the as-deposited coatings. After electrodeposition, a representative area of each coated coupon was rinsed thoroughly with deionized water, followed by ethanol, and dried to remove residual electrolyte and surface moisture. The deposited layer was then mechanically removed from the substrate using a clean stainless-steel blade, and the collected fragments were gently ground in an agate mortar to obtain a homogeneous fine powder. FTIR spectra were recorded in the range 4000–400 cm−1 using an FTIR spectrometer equipped with a diamond ATR accessory. The powder was pressed against the ATR crystal to ensure good contact, and spectra were acquired at 4 cm−1 resolution with 32 scans (background collected before each sample). This powder-based ATR approach is commonly used for inorganic/ceramic powders and enables reliable identification of Zn–S vibrational features in the composite coatings.
2.4 Corrosion and Wear Performance Evaluation
The corrosion resistance was evaluated electrochemically in a 3.5 wt% NaCl solution (simulating seawater) at 25°C using a conventional three-electrode cell with a Pt counter electrode and a saturated calomel reference electrode (SCE) [22]. Open circuit potential (OCP) was monitored for 1 h to achieve stability. Potentiodynamic polarization tests were conducted at a scan rate of 1 mV/s from −0.25 V to +0.25 V vs. OCP. Corrosion current density (icorr) and corrosion potential (Ecorr) were derived using Tafel extrapolation. Electrochemical impedance spectroscopy (EIS) measurements were performed at OCP over a frequency range of 100 kHz to 10 mHz with a 10 mV sinusoidal perturbation. Data were fitted with equivalent electrical circuits using ZView software. EIS measurements were performed at OCP over a frequency range of 100 kHz to 10 mHz with a 10 mV sinusoidal perturbation. Data were fitted with equivalent electrical circuits using ZView software. EIS was conducted after 1 h of immersion and is therefore interpreted in this work as reflecting early-stage (short-term) interfacial corrosion behavior in 3.5 wt% NaCl. Corrosion durability over extended exposure was evaluated separately using a neutral salt spray test (ASTM B117) for 500 h, reported as an accelerated exposure indicator under the specified test conditions [23].
Tribological performance was assessed using a pin-on-disc tribometer (ASTM G99) under dry sliding conditions at room temperature [23]. Dry sliding was selected deliberately as a standardized, highly reproducible baseline to compare coating formulations under controlled contact mechanics and to isolate intrinsic coating effects (microstructure refinement, hardness/compactness, and particle reinforcement) from lubricant-dependent variables such as viscosity, additive chemistry, tribofilm formation, and starvation. An alumina ball (6 mm diameter) served as the counterface. Tests were conducted at a normal load of 10 N, a sliding speed of 0.1 m/s, and a total sliding distance of 1000 m. The friction coefficient was recorded in real-time. Wear volume loss of the coating was calculated from 3D profilometry scans of the wear track. The wear mechanisms were investigated using SEM and EDS analysis of the wear tracks and debris. Vickers microhardness was measured on the cross-section of the coatings using a load of 25 gf and a dwell time of 15 s (ASTM E384); an average of 10 indents was reported for each sample [24].
All electrochemical measurements (OCP, polarization, and EIS) were performed on at least three independently prepared coated specimens per condition (n ≥ 3). Reported parameters are presented as mean ± standard deviation. For wear testing, at least three independent pin-on-disc runs were conducted per condition (n ≥ 3); steady-state COF was averaged over the final stabilized sliding interval, and wear volume was determined from 3D profilometry, with mean ± SD reported.
3.1 Phase Composition and Structural Analysis (XRD)
The XRD patterns for the pure Zn–Ni and Zn–Ni/ZnS nanocomposite coatings are presented in Fig. 1a. All coatings exhibit distinct diffraction peaks corresponding to the intermetallic γ-Ni5Zn21 phase (JCPDS card no. 06-0653), confirming the successful deposition of the desired alloy structure [3]. The predominant peaks at 2θ values of approximately 43.2° and 44.8° correspond to the (330) and (411) planes of the γ-phase, respectively. The pure Zn–Ni coating shows sharp, intense peaks, indicating good crystallinity. With the incorporation of ZnS nanoparticles, a gradual broadening of the Zn–Ni peaks is observed, particularly for the coating with 15 g/L ZnS. This peak broadening signifies a reduction in the crystallite size of the Zn–Ni matrix [25], calculated to decrease from 42 nm for the pure alloy to 28 nm for the Zn–Ni/15 g/L-ZnS coating, as detailed in Table 1. This refinement is attributed to the ZnS nanoparticles acting as nucleation sites and physically impeding the growth of Zn–Ni grains during electro-crystallization [10].
Table 1: Crystallite size and lattice strain derived from XRD analysis.
| Coating Sample | ZnS Conc. (g/L) | Crystallite Size (nm) | Lattice Strain (ε × 10−3) |
|---|---|---|---|
| Zn–Ni | 0 | 42 ± 3 | 1.2 ± 0.2 |
| Zn–Ni/ZnS | 5 | 38 ± 2 | 1.8 ± 0.3 |
| Zn–Ni/ZnS | 10 | 33 ± 2 | 2.5 ± 0.3 |
| Zn–Ni/ZnS | 15 | 28 ± 2 | 3.4 ± 0.4 |
| Zn–Ni/ZnS | 20 | 31 ± 3 | 2.9 ± 0.3 |
| Zn–Ni/Al2O3 | 10 | 35 ± 2 | 2.1 ± 0.3 |
Furthermore, no distinct ZnS diffraction peaks are resolvable in the laboratory XRD patterns of the Zn–Ni/ZnS coatings, and the ZnS (111) reflection expected near 2θ ≈ 28.5° (Cu Kα) may appear, at most, as a subtle shoulder/broad intensity fluctuation depending on ZnS loading and background level. This is consistent with the practical sensitivity limits of conventional XRD for minor, nanocrystalline second phases embedded in a strongly diffracting γ-Ni5Zn21 matrix, where peak broadening and low phase fraction can render ZnS reflections indistinguishable from the background. Accordingly, XRD in the present work is used primarily to confirm γ-phase dominance and quantify matrix peak broadening (grain refinement), whereas ZnS incorporation is supported more directly by the Zn–S vibrational signature in FTIR and by the homogeneous sulfur distribution observed in cross-sectional EDS mapping, together with TEM/HRTEM evidence for ZnS (111) lattice fringes in the representative 15 g/L coating. No peaks corresponding to pure Zn or Ni phases are detected, confirming the formation of a single-phase alloy matrix [26]. The lattice strain, calculated using the Williamson-Hall method, increases with ZnS content up to 15 g/L, indicating the induction of micro-strain due to the incorporation of the second-phase particles, which can contribute to strengthening.
3.2 Chemical Bonding and Functional Group Analysis (FTIR)
The FTIR spectra in the range of 4000–400 cm−1 for the coating-derived powders (obtained by mechanically removing and grinding the as-deposited coatings, as described in Materials and Methods) are shown in Fig. 1b. A broad absorption band centered around 3400 cm−1 and a sharper band near 1630 cm−1 are observed in all samples, attributable to the O–H stretching and bending vibrations of adsorbed water molecules, respectively [27]. The spectrum for the pure Zn–Ni coating is relatively featureless in the fingerprint region. In contrast, the nanocomposite coatings exhibit new, distinct absorption bands. A prominent band emerges at approximately 620 cm−1, which is a characteristic signature of the Zn–S stretching vibration in zinc sulfide [28]. Its intensity increases progressively with the nominal ZnS concentration in the bath, confirming the successful incorporation and retention of ZnS within the coating. For the composite with 15 g/L ZnS, an additional shoulder appears near 450 cm−1, which can be associated with metal-oxygen (likely Zn–O or Ni–O) vibrations from surface oxides or complexes with the citrate additive [29]. The spectrum for the Zn–Ni/Al2O3 benchmark shows a strong, broad band between 500–700 cm−1, characteristic of Al-O vibrations, verifying its different chemical nature [30]. The absence of strong organic peaks (e.g., C–H, C=O) beyond those from citrate residues confirms the metallic/inorganic nature of the coatings.
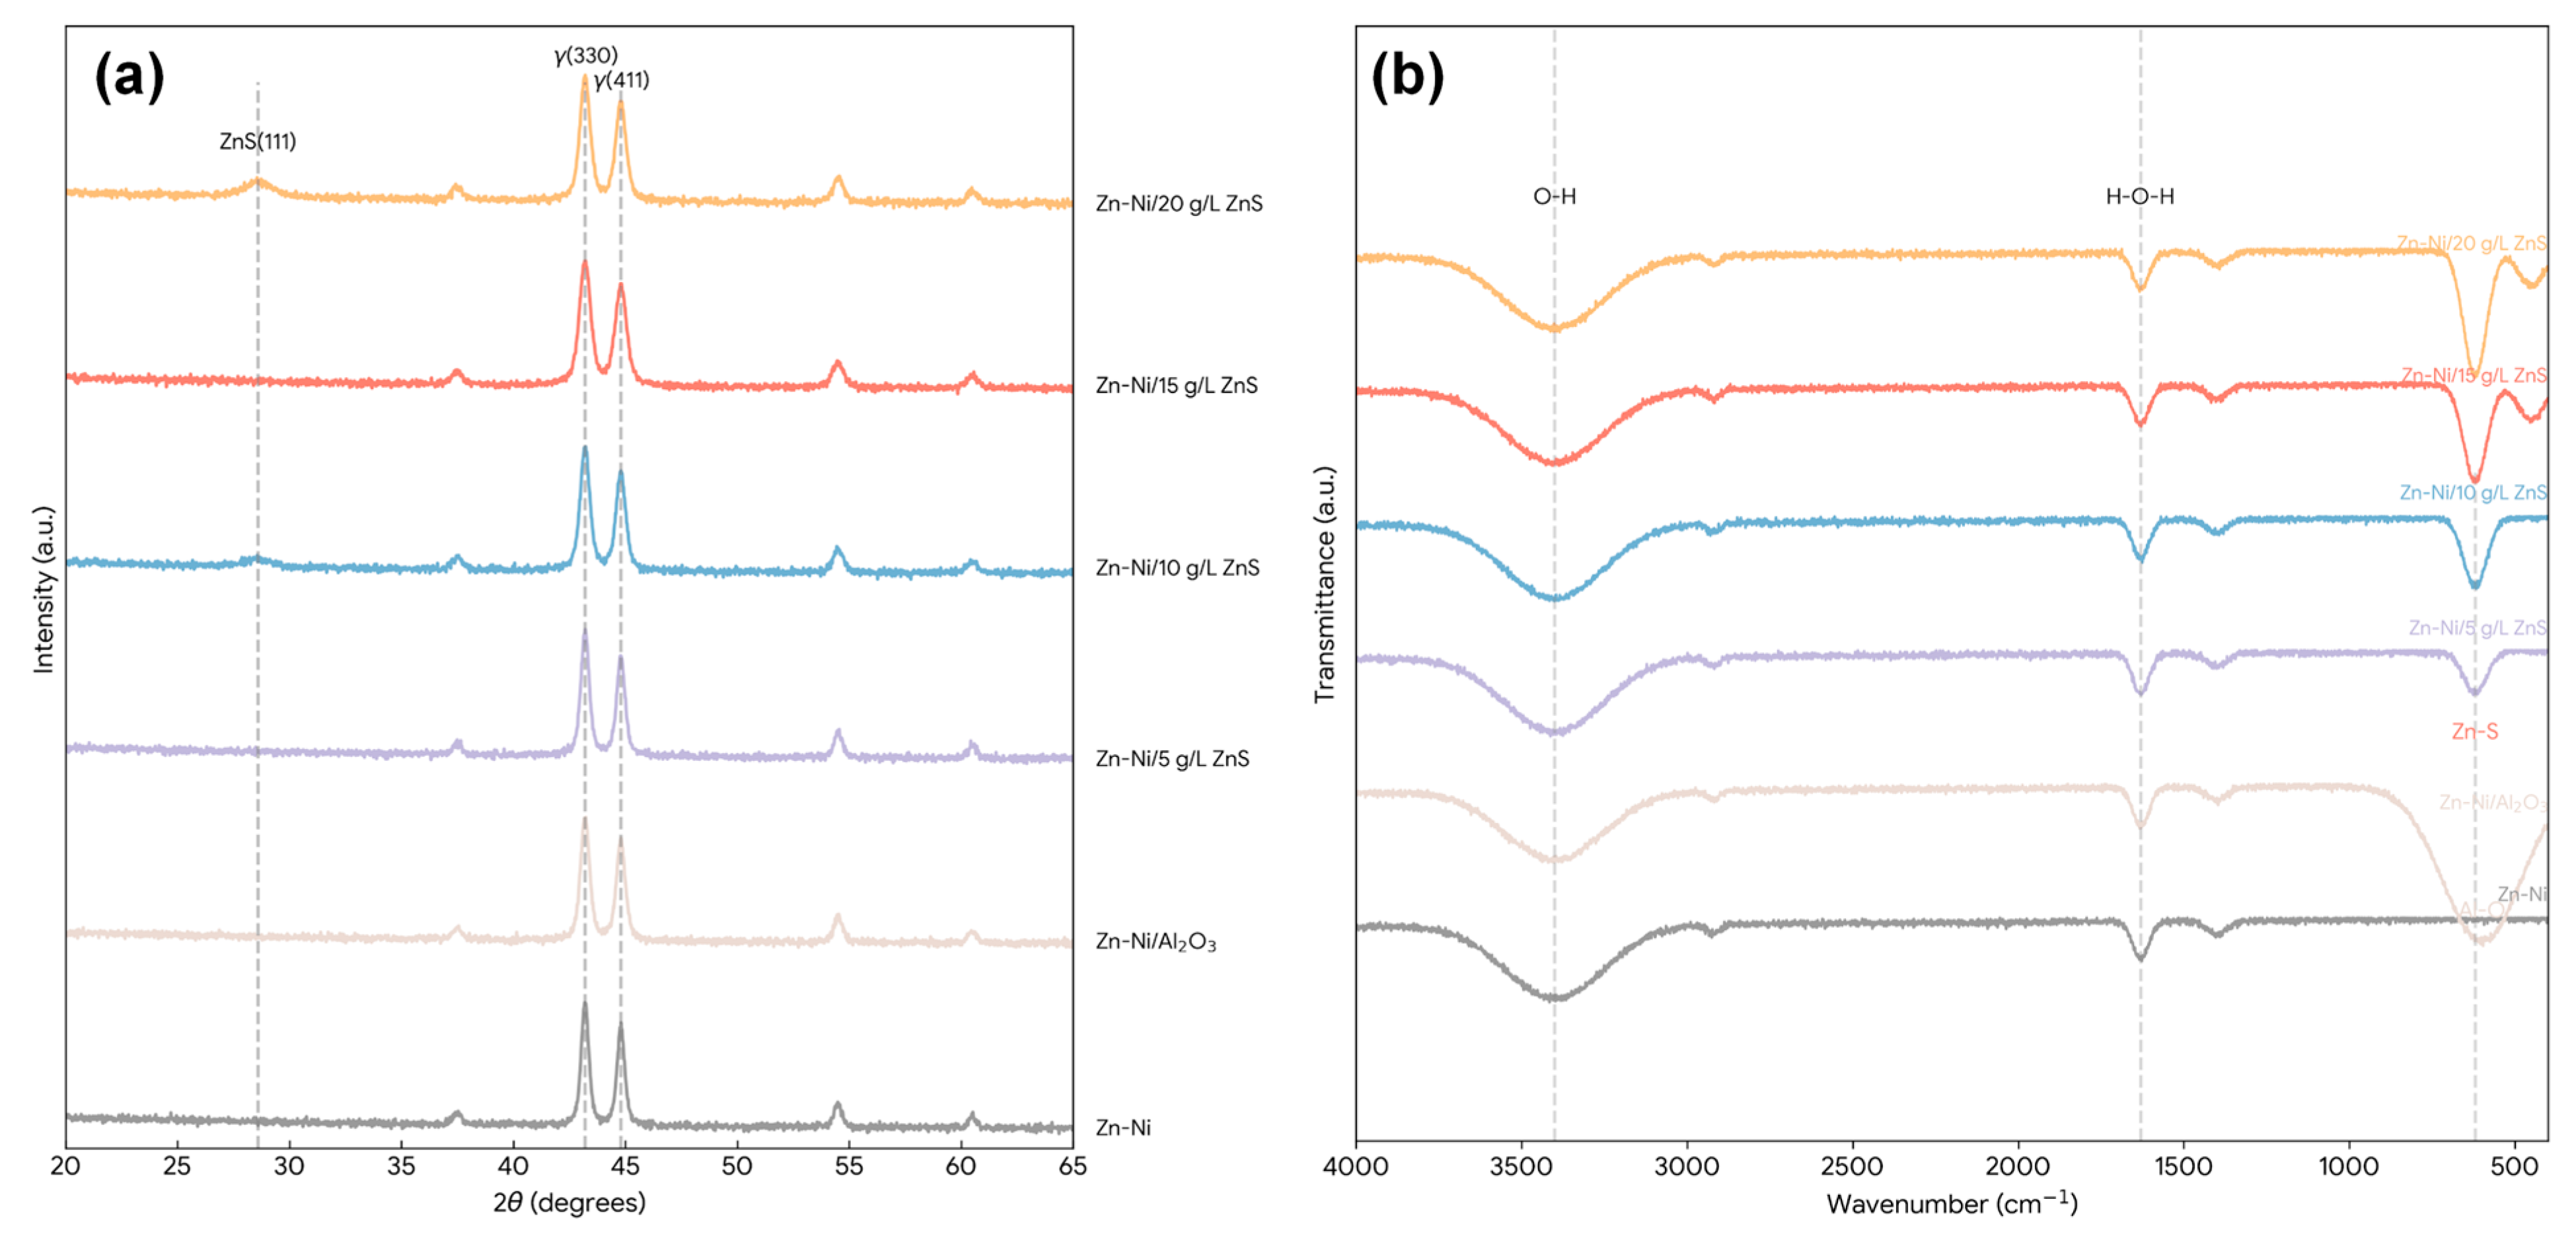
Figure 1: (a) XRD patterns of electro-deposited Zn–Ni and Zn–Ni/ZnS nanocomposite coatings (ZnS = 5, 10, 15, and 20 g/L in bath). (b) FTIR spectra (4000–400 cm−1) of coating powders for Zn–Ni, Zn–Ni/ZnS (5–20 g/L), and Zn–Ni/Al2O3 (10 g/L).
3.3 Morphology and Microstructure
Fig. 2 presents the surface SEM morphologies of the deposited coatings. The pure Zn–Ni coating exhibits a characteristic nodular and relatively coarse-grained structure with visible boundaries. The incorporation of 5 g/L ZnS (Fig. 2b) begins to refine the nodule size, leading to a more compact surface. At 10 and 15 g/L ZnS (Fig. 2c,d), the morphology transforms dramatically into a very fine-grained, dense, and uniform cauliflower-like structure. This is a direct visual confirmation of the grain refinement effect inferred from XRD. The ZnS nanoparticles adsorbed on the cathode surface act as additional nucleation centers, promoting the formation of a larger number of smaller Zn–Ni grains [31]. Furthermore, they likely impede surface diffusion of ad-atoms, limiting grain growth. The cross-sectional SEM images in Fig. 3 confirm that all deposits form continuous and adherent layers with comparable thickness (~24–26 μm). In this work, the term ‘dense/compact’ is used to indicate a microstructure that is continuous across the thickness and lacks obvious interconnected, columnar gaps that could provide preferential electrolyte pathways. Using this criterion, the coatings prepared with 10–15 g/L ZnS exhibit the most compact cross-sections, consistent with refined growth. In contrast, the 20 g/L ZnS coating (Fig. 2e) shows scattered dark irregular features within the cross-section. These features are att regions associated with excessive particle loading, where agglomerated ZnS clusters can promote (i) occluded voids and local growth disruption and (ii) heterogeneous particle-rich zones that act as preferential initiation sites for wear-related pull-out and corrosion-related electrolyte access. This interpretation is consistent with classical particle-codeposition models and the widely reported ‘optimum particle loading’ behavior in electrodeposited nanocomposites, in which intermediate additions maximize effective incorporation and refinement, whereas excessive additions increase agglomeration and defect density. To avoid qualitative ambiguity, the compactness comparison is supported by cross-sectional image analysis (ImageJ thresholding on multiple fields of view at identical magnification) by reporting the area fraction of defect-like dark features; this analysis confirms that defect fraction increases at 20 g/L relative to the optimized 10–15 g/L range.
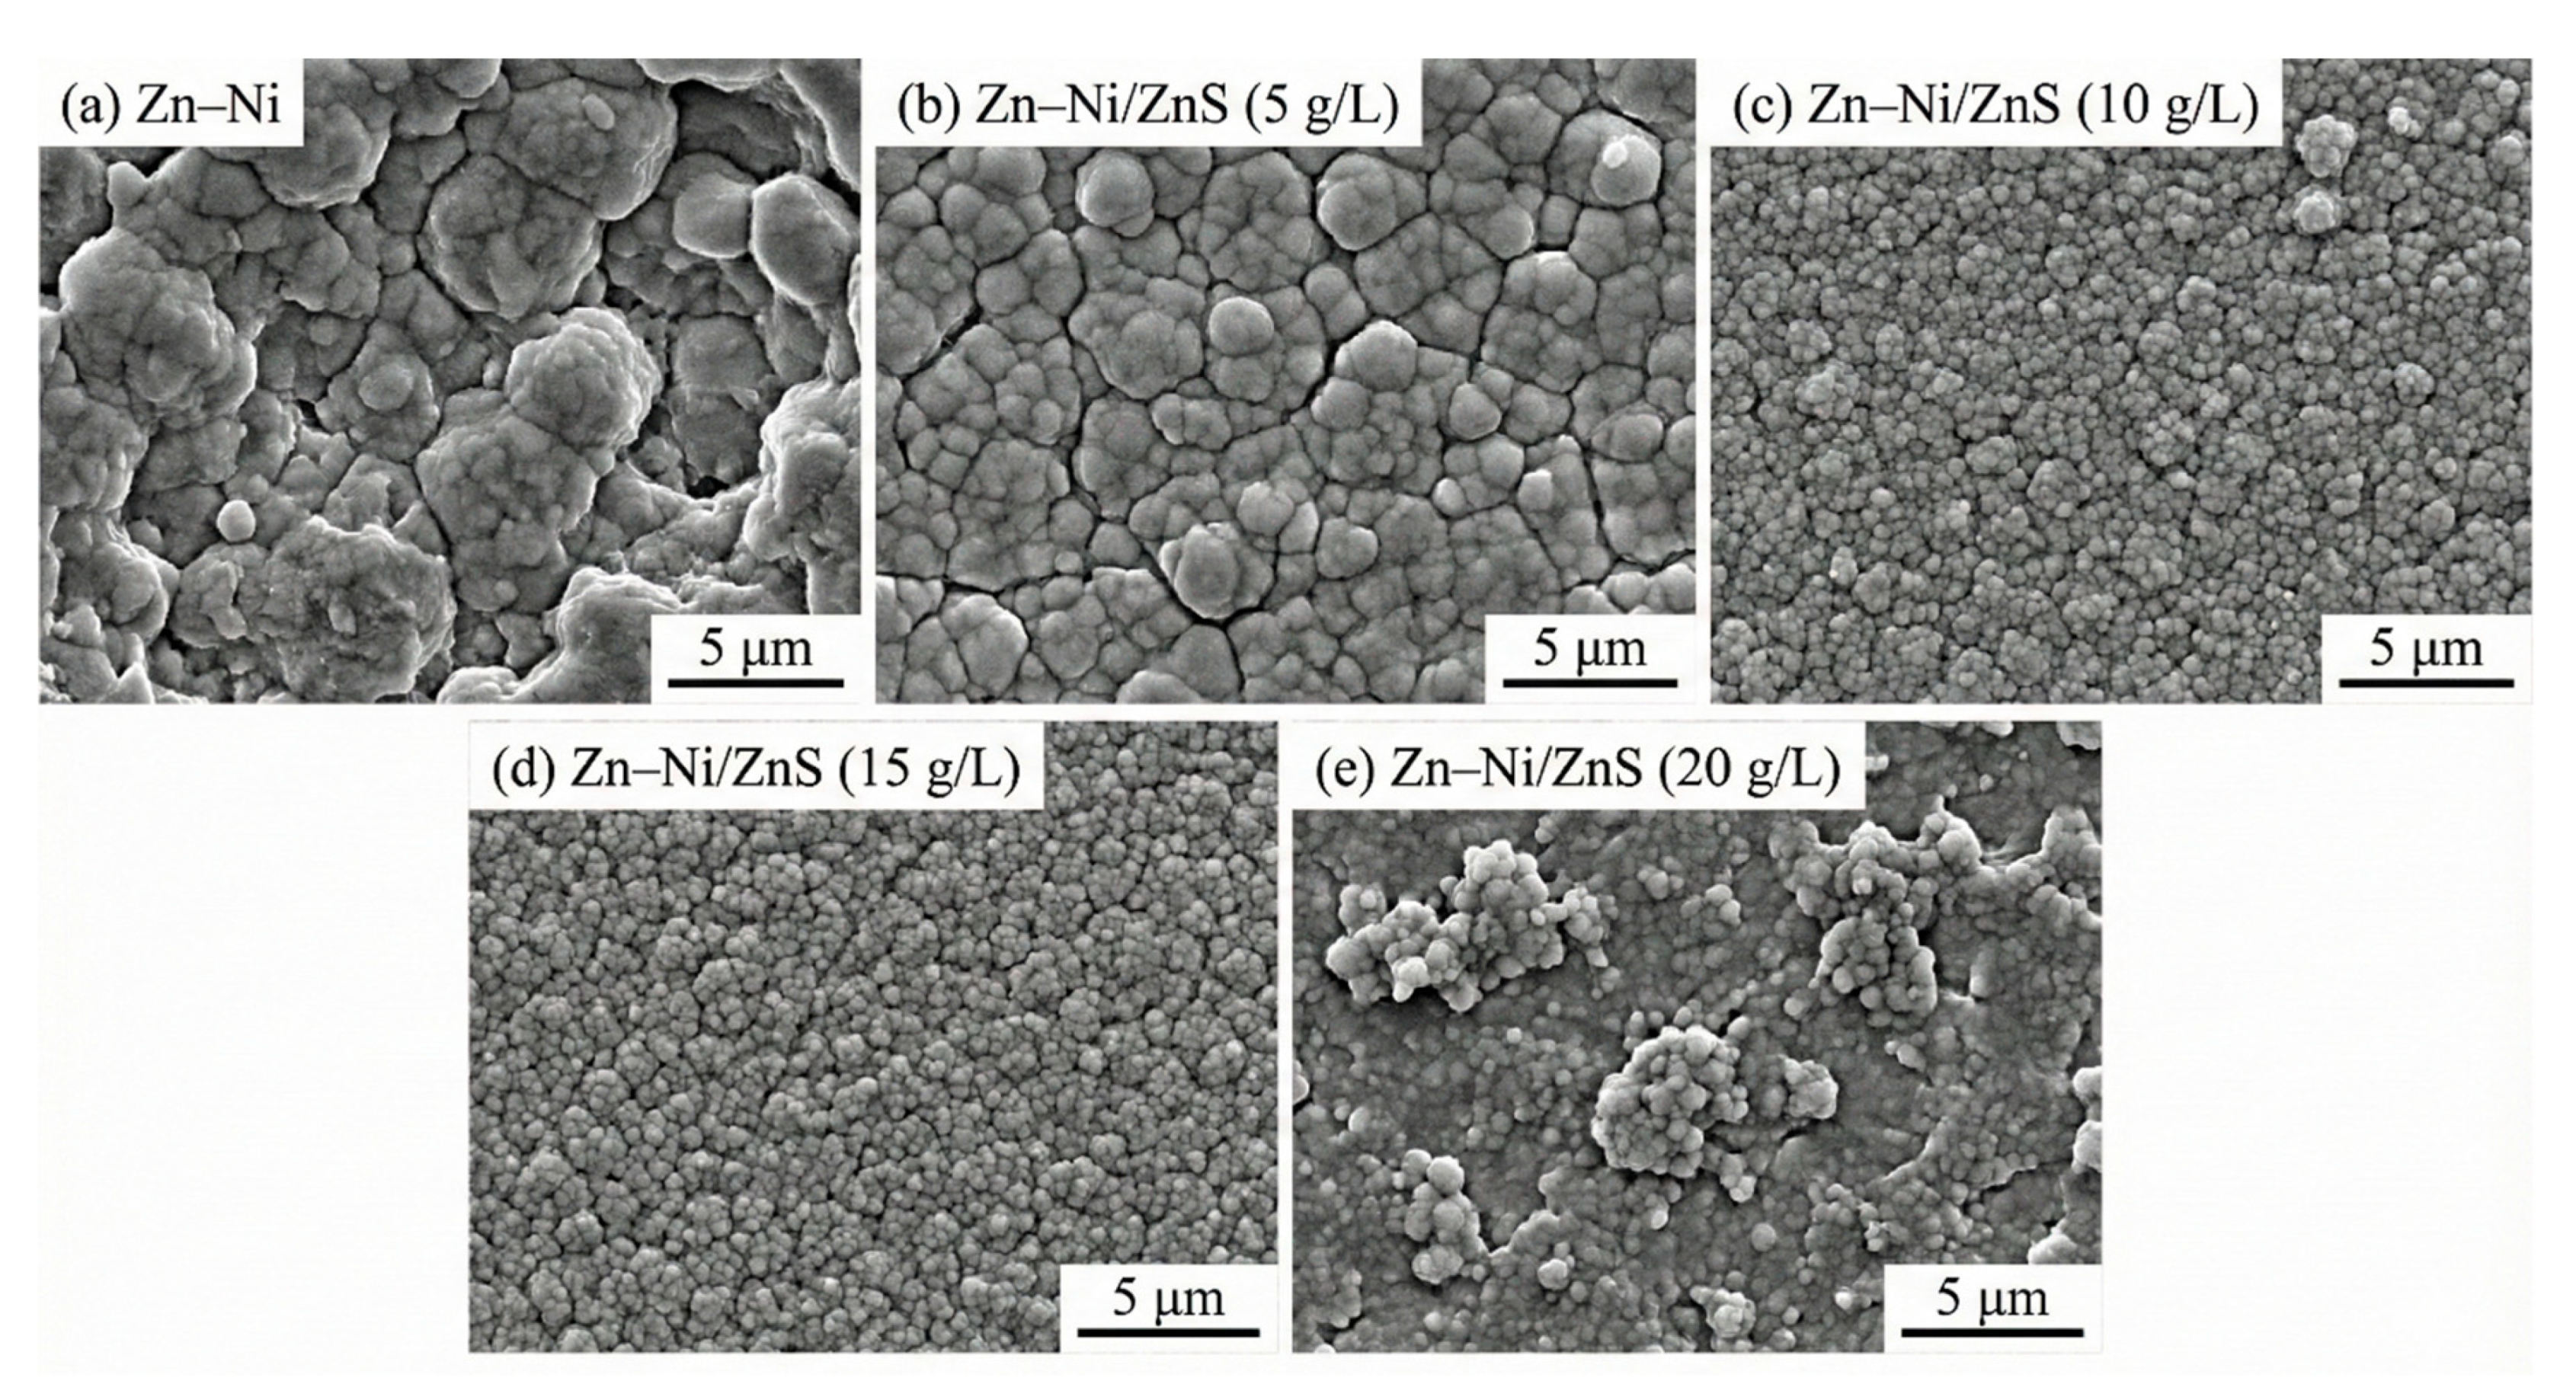
Figure 2: Surface SEM micrographs of (a) Zn–Ni, and Zn–Ni/ZnS coatings prepared with ZnS concentrations of (b) 5 g/L, (c) 10 g/L, (d) 15 g/L, and (e) 20 g/L.
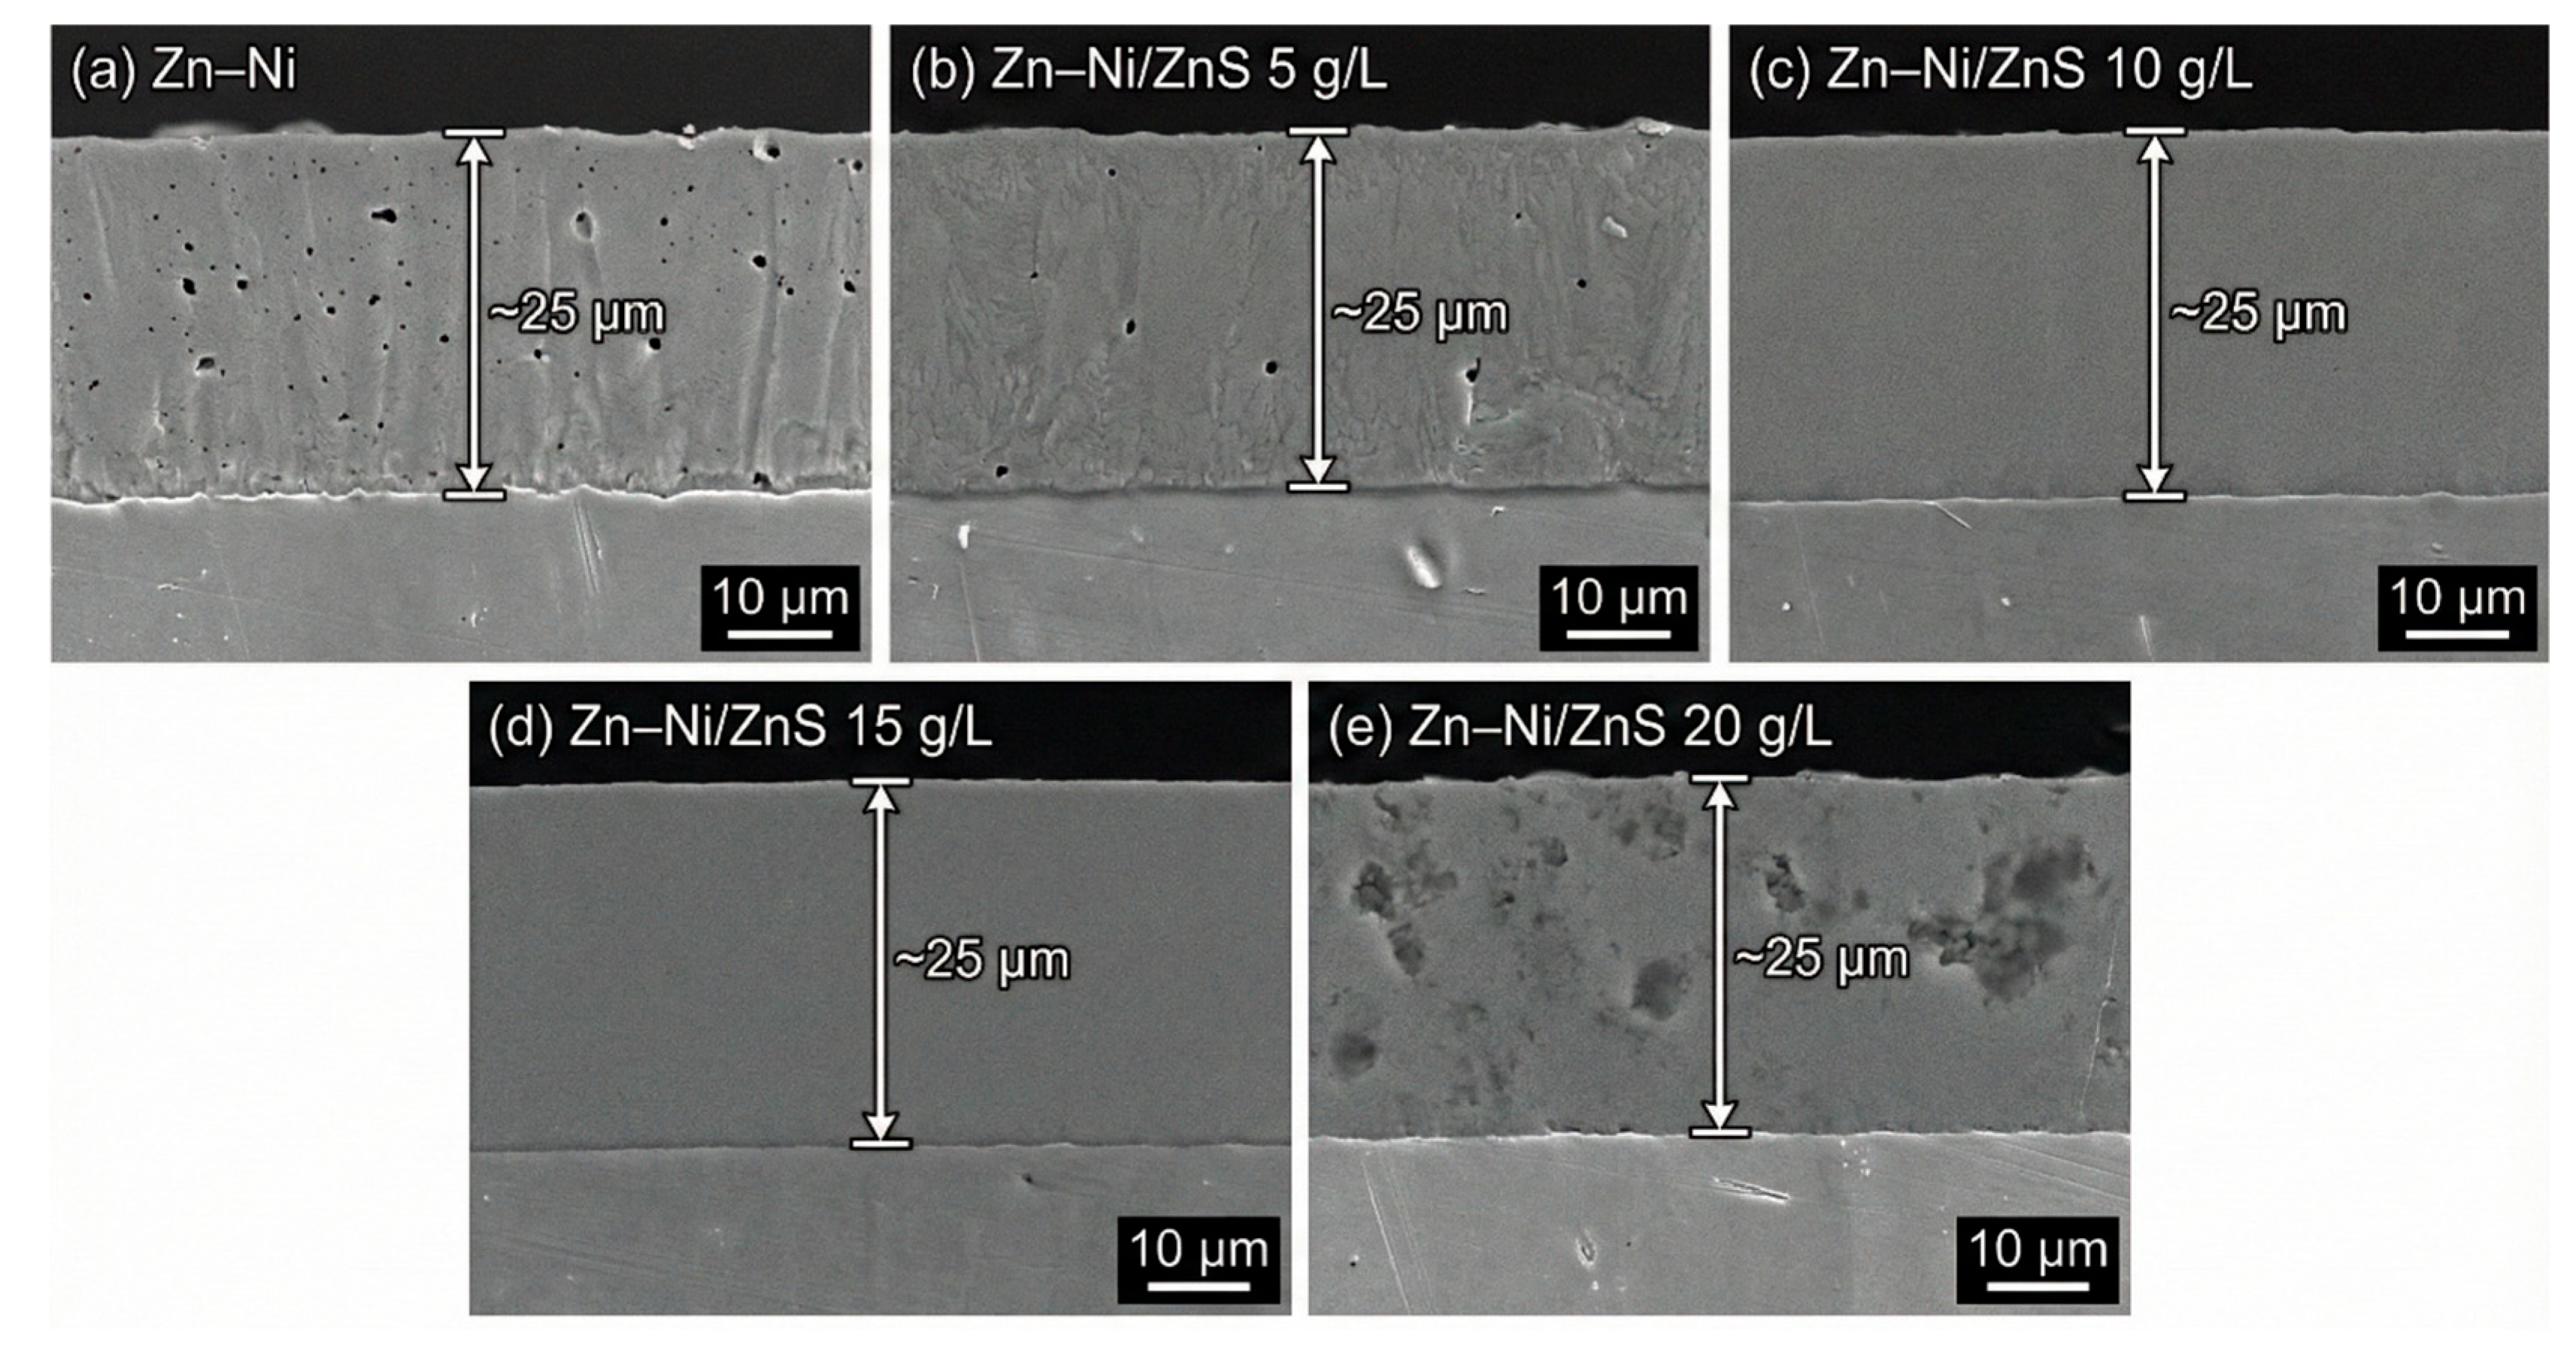
Figure 3: Cross-sectional SEM images of electro-deposited Zn–Ni and Zn–Ni/ZnS nanocomposite coatings on mild steel, showing continuous, adherent layers with comparable thickness (~24–26 μm).
The EDS elemental mapping from cross-sections, as shown in Fig. 4 for the representative Zn–Ni/15 g L−1 ZnS sample, demonstrates a homogeneous distribution of Zn and Ni throughout the coating thickness. Crucially, the sulfur (S) signal is also uniformly dispersed, providing direct evidence for ZnS incorporation within the alloy matrix rather than macroscopic sedimentation at the coating/substrate interface. To quantify the incorporated ZnS fraction for every bath condition, we performed cross-sectional SEM–EDS area scans on multiple randomly selected fields of view (n ≥ 5) for each coating (0–20 g L−1 ZnS in bath). Because sulfur in the present system originates from ZnS, the measured S content provides a quantitative proxy for incorporated ZnS. Table 2 therefore reports S content in the coating in both wt% and at%, together with the calculated ZnS content (wt%) and estimated ZnS fraction (vol%). The data show increasing incorporation from 5 to 15 g L−1 (up to 1.21 ± 0.10 wt% S, corresponding to 3.68 ± 0.30 wt% ZnS), followed by a decrease at 20 g L−1 (0.97 ± 0.12 wt% S; 2.95 ± 0.36 wt% ZnS), consistent with saturation/agglomeration effects at high particle loading. Here, ‘agglomeration effects’ refers specifically to an increase in effective agglomerate size (captured by DLS in suspension) that reduces the number density of well-disperserapment and promotes defect occlusion during growth; therefore, the observed drop in incorporated ZnS proxy at 20 g L−1 is treated as a dispersion-limited incorporation regime rather than a simple concentration limitation [32]. To address the important question of the actual particle incorporation level at each ZnS addition, we quantified the deposit composition by cross-sectional SEM-EDS area scans collected from multiple randomly selected fields of view for every ZnS condition (0–20 g/L). Because sulfur in the present system originates from ZnS, the measured S content provides a practical, widely used proxy for the incorporated ZnS fraction. The resulting incorporation metric (Table 2) increases with ZnS addition up to the optimized range and then tends to plateau/decline at the highest loading, consistent with agglomeration and occluded-defect formation. The average Ni content in the alloy matrix, determined by EDS point analysis, remained stable at 13.5 ± 0.8 wt% across all samples, indicating that ZnS addition did not significantly alter the anomalous Zn–Ni co-deposition behavior [33].
This quantification enables a chemistry- and volume-fraction-aware interpretation of the property trends. First, the incorporated ZnS fraction is small but non-negligible (≈0.9–2.7 vol% over 5–15 g L−1; Table 2), and the non-monotonic incorporation at 20 g L−1 is consistent with well-established composite electrodeposition behavior in which excessive particle concentration increases collision frequency and agglomeration, reduces the fraction of ‘effectively incorporable’ particles, and can introduce occluded defects or particle pull-out features. These effects are widely reported for nanoparticle-reinforced electrodeposits and are rationalized by adsorption/incorporation frameworks (Guglielmi-type concepts and later kinetic refinements) in which particle incorporation depends on particle adsorption probability, surface coverage, and the stability of the interfacial adsorption layer. Second, the reinforcement chemistry influences how the particle interacts with the electrolyte and cathode. ZnS is a chemically stable, wide-bandgap sulfide that is expected to act primarily as a largely inert, non-conductive second phase in a metallic Zn–Ni matrix, modifying the microstructure by increasing nucleation density and transport tortuosity rather than acting through an intrinsically ‘active’ sulfur chemistry. In contrast, oxide particles such as Al2O3 (40 nm, used here as a benchmark) possess hydroxylated surfaces that can adsorb ions and dispersants differently and therefore can exhibit different codeposition efficiencies at the same bath loading. Consequently, comparisons between Zn–Ni/ZnS and Zn–Ni/Al2O3 must consider not only bath concentration (g L−1) but also the actual incorporated volume fraction and the particle surface chemistry that governs dispersion and adsorption.
Table 2: Quantification of ZnS incorporation in Zn–Ni/ZnS nanocomposite coatings prepared with different ZnS additions in the electrolyte.
| ZnS Added to Bath (g L−1) | S Content in Coating (wt%) | Calculated ZnS Content in Coating (wt%) | S Content in Coating (at%) | Estimated ZnS Fraction in Coating (vol%) |
|---|---|---|---|---|
| 0 | Not detected | 0.00 | Not detected | 0.0 |
| 5 | 0.42 ± 0.06 | 1.28 ± 0.18 | 0.28 ± 0.04 | 0.9 ± 0.1 |
| 10 | 0.86 ± 0.08 | 2.61 ± 0.24 | 0.58 ± 0.05 | 1.9 ± 0.2 |
| 15 | 1.21 ± 0.10 | 3.68 ± 0.30 | 0.82 ± 0.07 | 2.7 ± 0.3 |
| 20 | 0.97 ± 0.12 | 2.95 ± 0.36 | 0.66 ± 0.08 | 2.1 ± 0.3 |
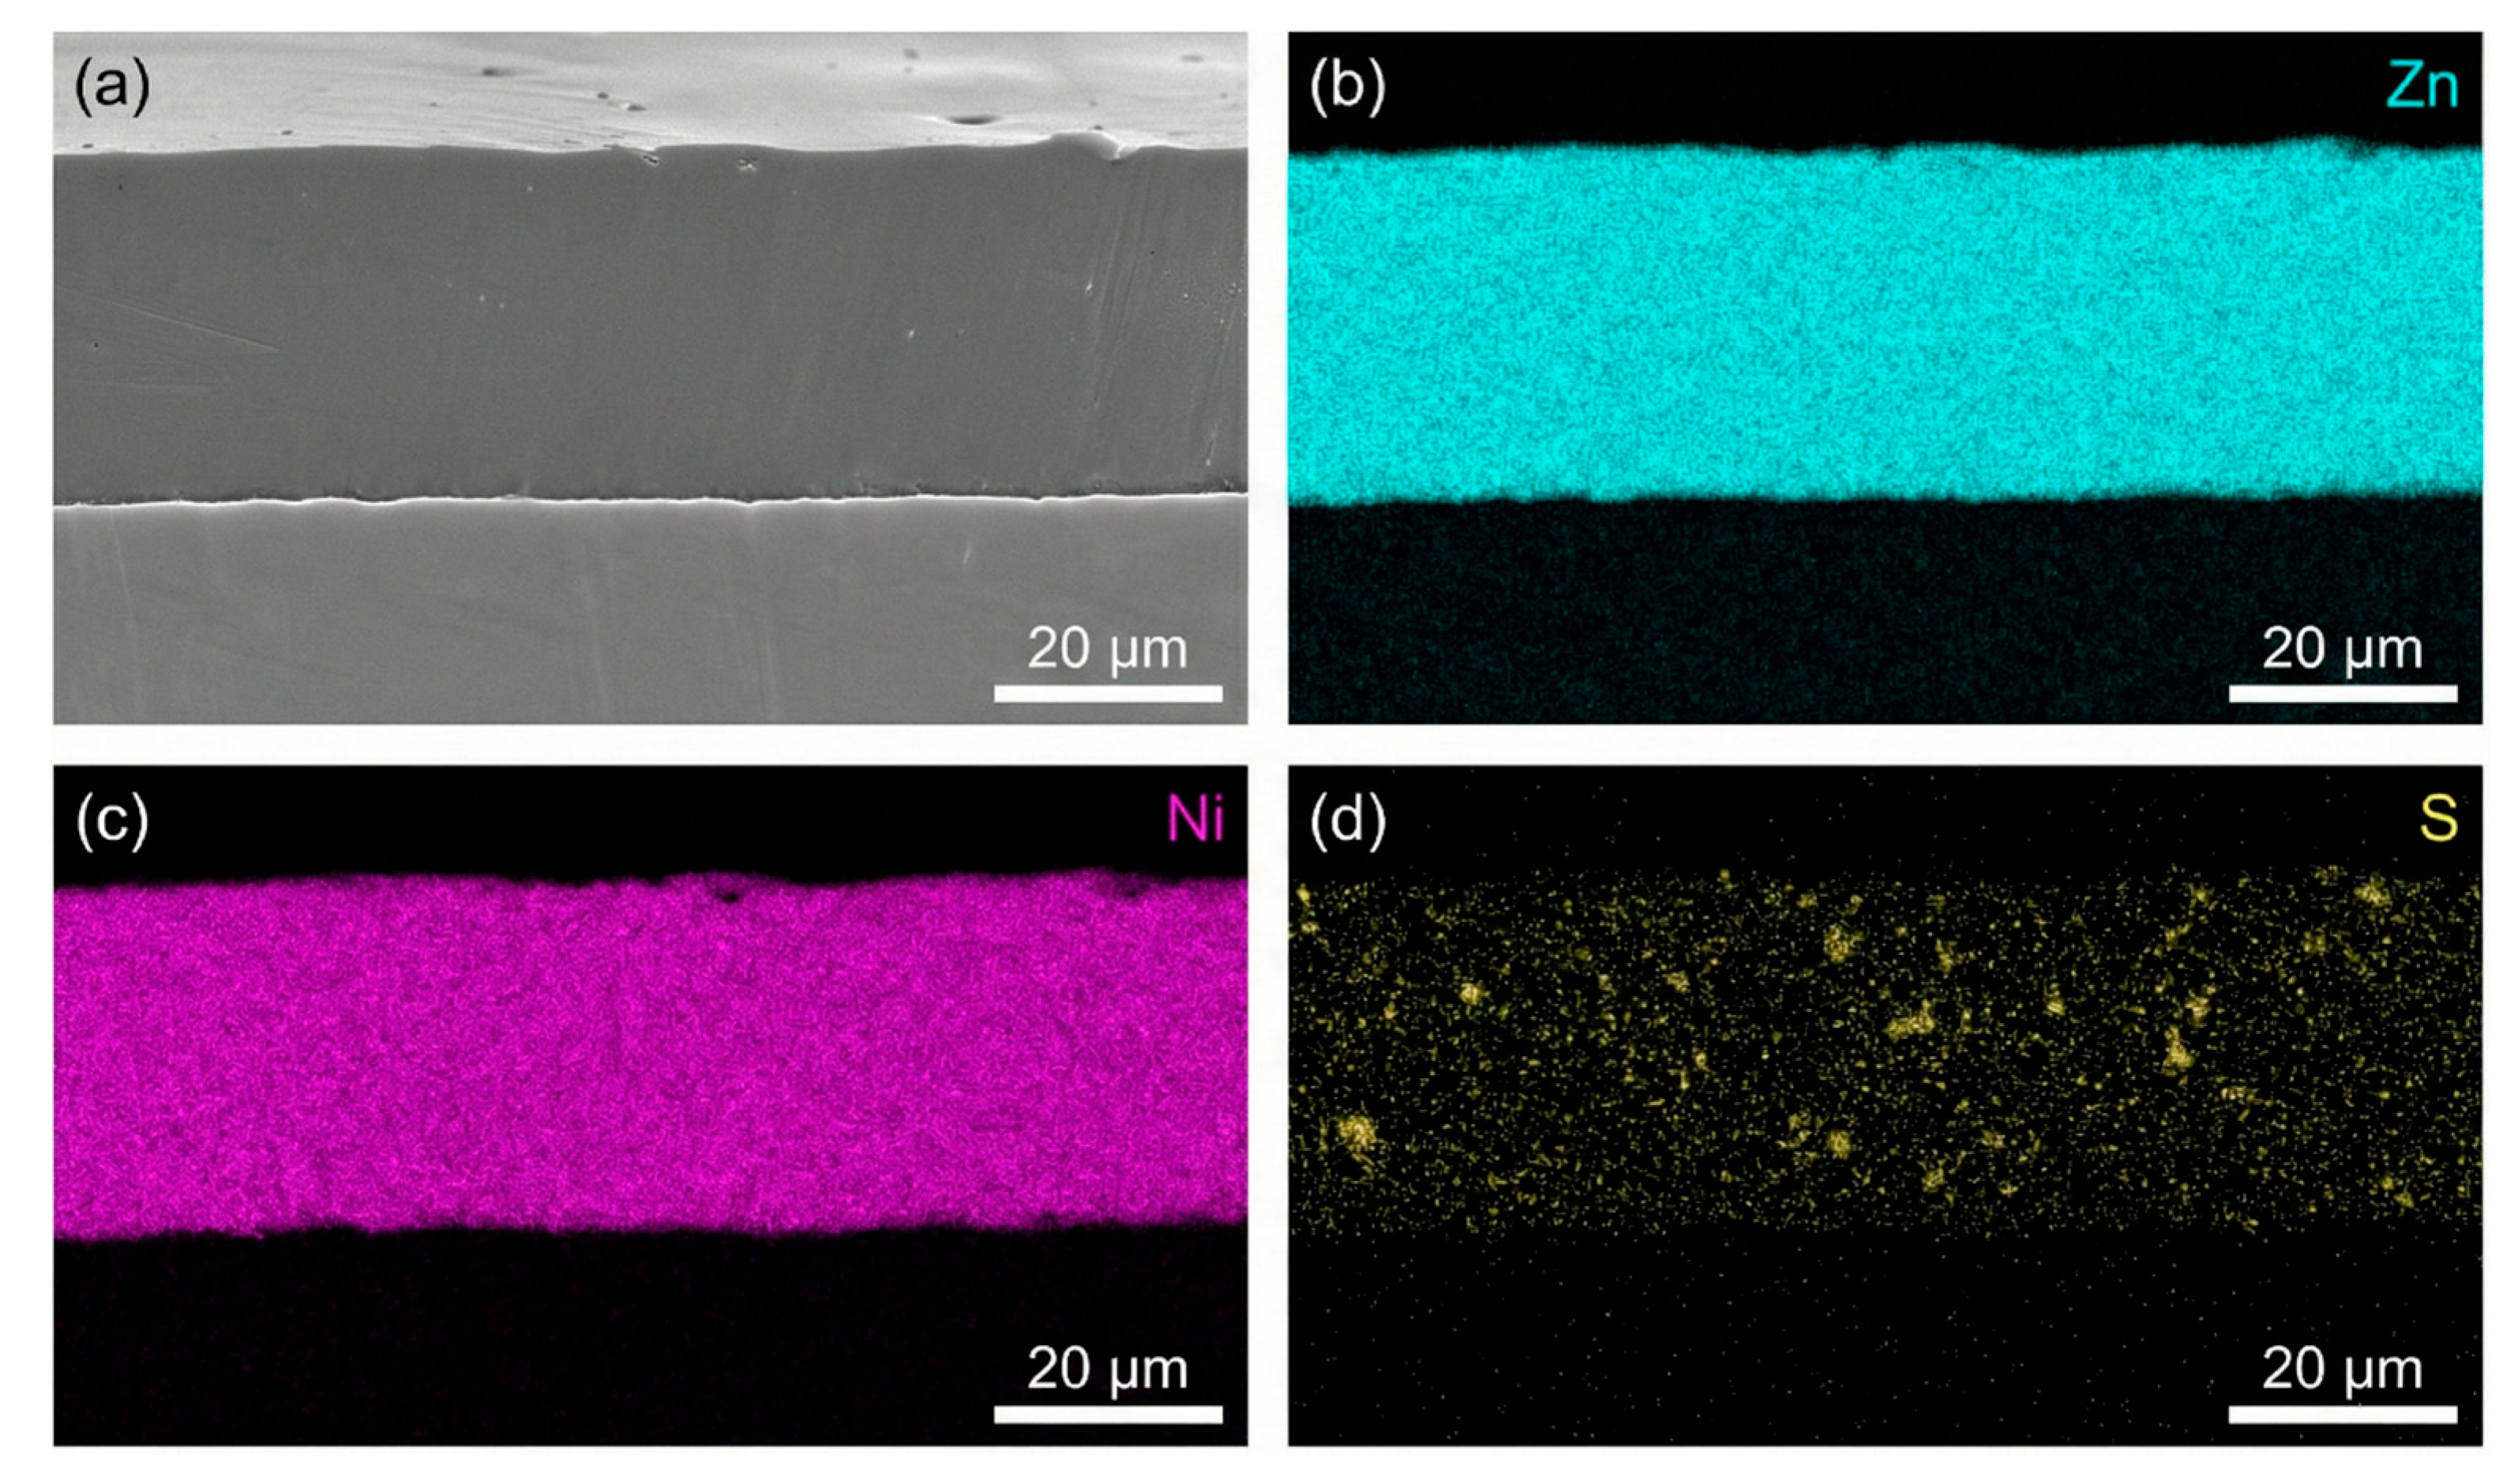
Figure 4: Cross-sectional EDS elemental mapping of the representative Zn–Ni/15 g/L ZnS coating: (a) SEM cross-section image and corresponding distributions of (b) Zn, (c) Ni, and (d) S. Zn and Ni are homogeneously distributed across the coating thickness, and the uniform S signal provides direct evidence for well-dispersed ZnS incorporation rather than interfacial sedimentation or macroscopic aggregation.
Fig. 5 presents TEM and HRTEM images of a fragment from the Zn–Ni/15gL-ZnS coating. The bright-field TEM image (Fig. 5a) shows dark, spherical nanoparticles (marked by arrows) embedded within a lighter matrix. Selected area electron diffraction (SAED) patterns (inset) show rings corresponding to the γ-Ni5Zn21 phase and faint spots from cubic ZnS. The HRTEM image in Fig. 5b provides atomic-scale insight into the interface. The lattice fringes with a spacing of 0.209 nm are indexed to the (411) planes of the γ-Ni5Zn21 matrix. Adjacent to it, fringes with a spacing of 0.312 nm correspond to the (111) planes of cubic ZnS. The clear, coherent interface without an amorphous layer suggests a strong interfacial bonding, which is critical for effective load transfer and property enhancement in nanocomposites [34].
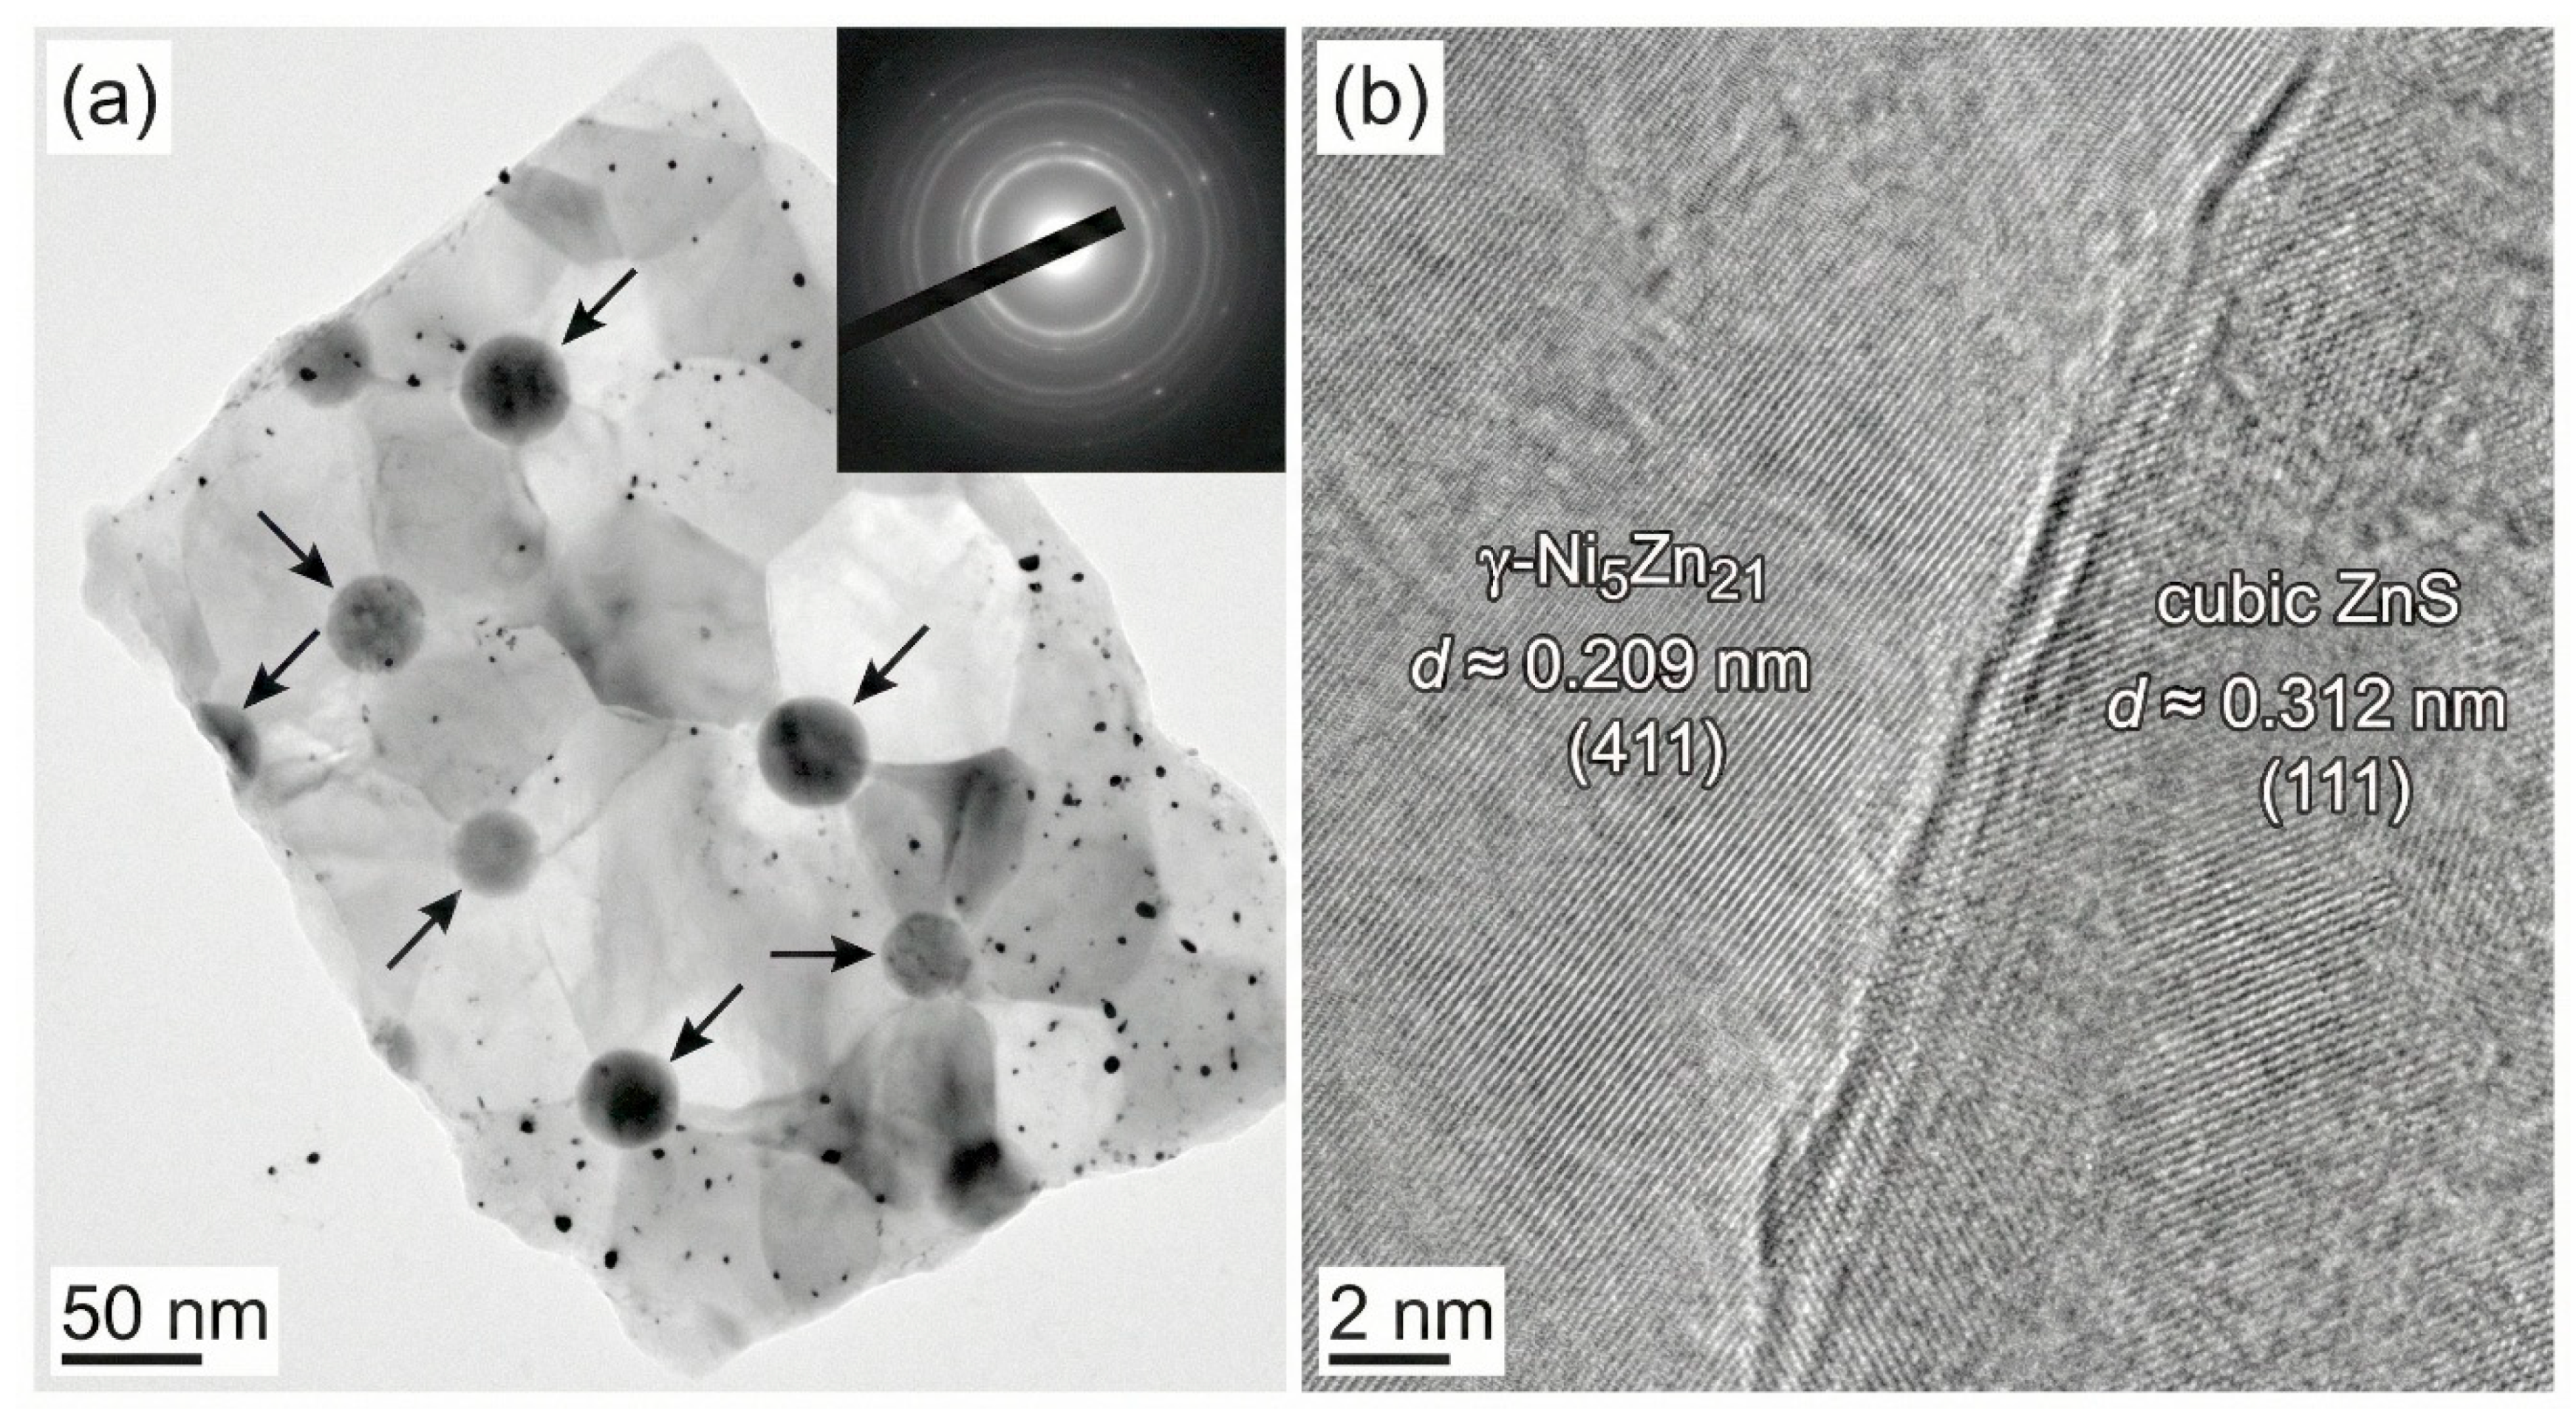
Figure 5: TEM characterization of the Zn–Ni/15 g/L ZnS nanocomposite coating. (a) Bright-field TEM image showing dark spherical ZnS nanoparticles embedded in the lighter Zn–Ni matrix (arrows), with SAED pattern (inset) displaying rings from γ-Ni5Zn21 and faint contributions from cubic ZnS. (b) HRTEM image revealing lattice fringes of d ≈ 0.209 nm for γ-Ni5Zn21 (411) and d ≈ 0.312 nm for cubic ZnS (111), indicating a clear, coherent particle/matrix interface.
The UV-Vis diffuse reflectance spectra of the coating powders and the corresponding Tauc plots for bandgap estimation are displayed in Fig. 6. As expected for a metallic alloy, the Zn–Ni powder exhibits broadband absorption across the UV–visible range, such that a meaningful optical bandgap cannot be assigned to the matrix. In contrast, the Zn–Ni/ZnS powders display a discernible UV absorption edge associated with the embedded ZnS phase, and the edge becomes clearer as ZnS addition increases up to the optimized 15 g/L condition. Using the standard direct-transition Tauc treatment for ZnS, the Zn–Ni/15 g/L ZnS sample yields an apparent bandgap of ~3.65 eV, which is consistent with reported values for nanoscale ZnS (typically ~3.6–3.7 eV, depending on particle size and defect density) and confirms that ZnS retains its wide-bandgap character after electrodeposition and powder preparation [35]. Importantly, in the context of a metallic Zn–Ni matrix, this wide-bandgap signature is interpreted here as evidence that ZnS functions predominantly as a largely insulating, chemically stable second phase rather than as an electronically active corrosion-inhibitor. This characterization supports the electrochemical interpretation in two conservative, literature-consistent ways: (i) incorporation of a non-conductive dispersed phase reduces the accessible electrochemically active metallic area and increases interfacial heterogeneity, and (ii) the resulting refined/compact microstructure increases transport tortuosity for chloride species. Both effects are consistent with the measured decrease in (icorr), the increase in (Rct), and the reduction in CPE magnitude for the Zn–Ni/ZnS coatings, without requiring any light-driven or semiconductor-specific corrosion mechanism [36].
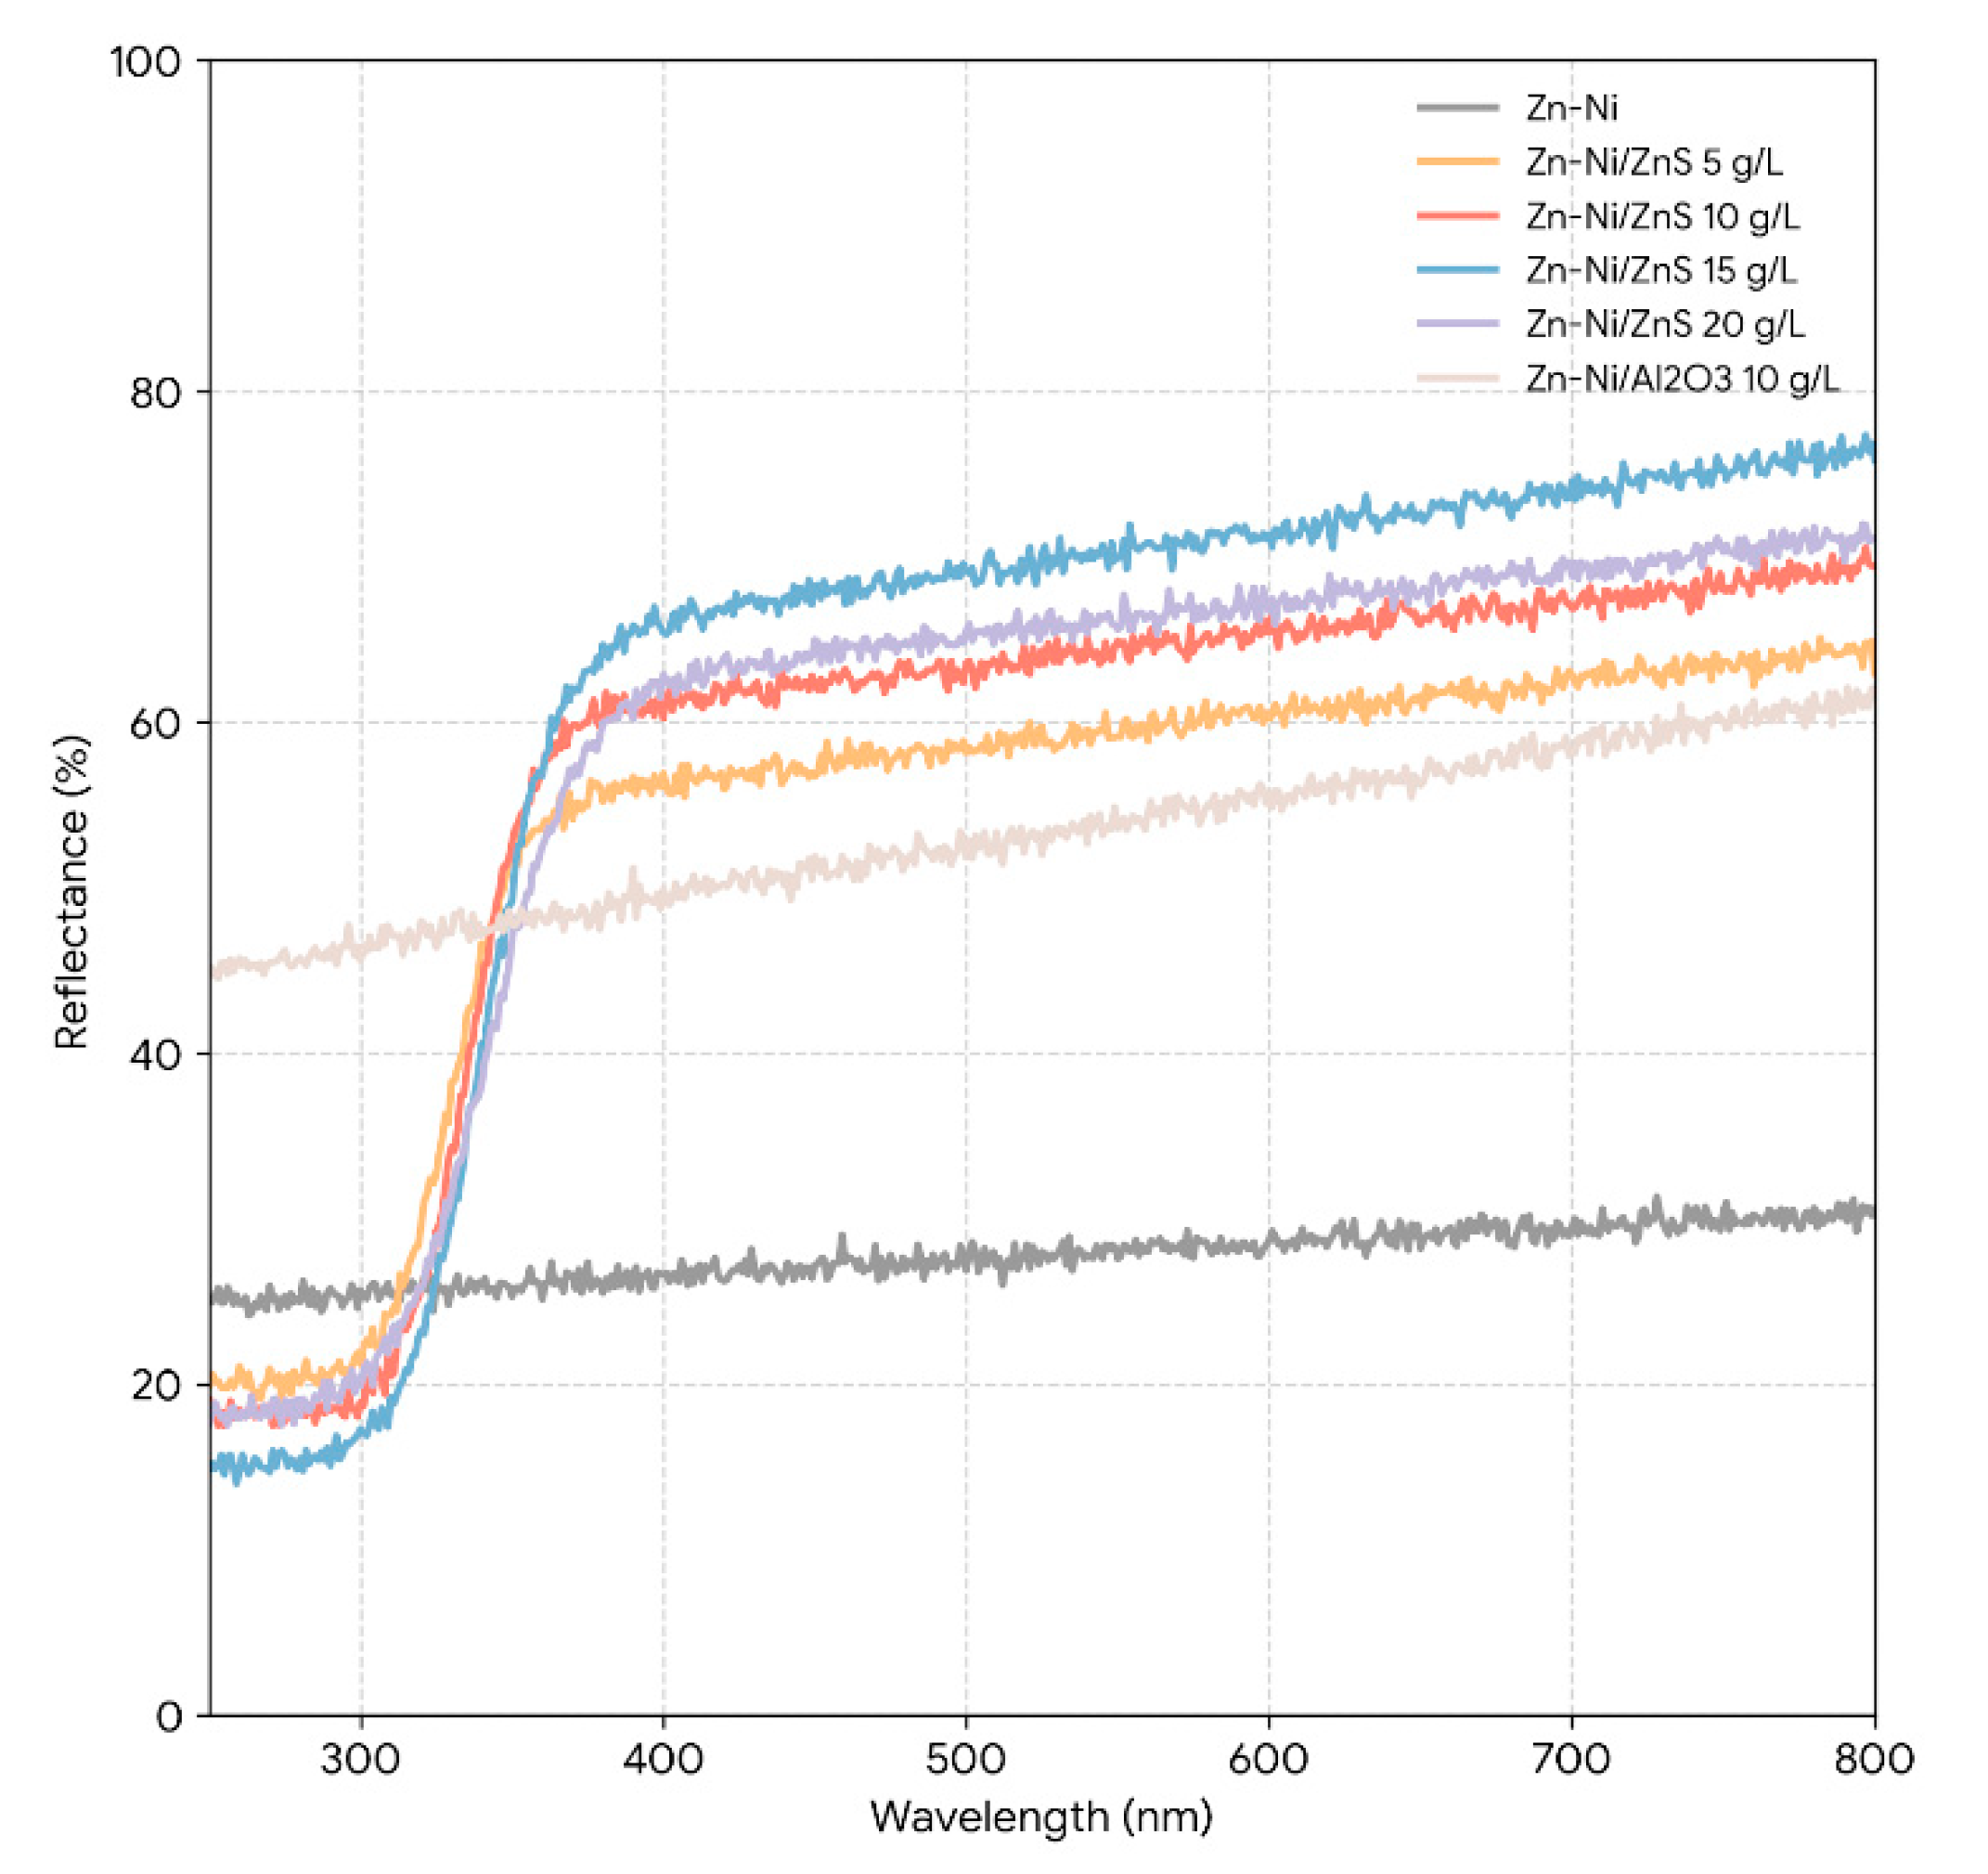
Figure 6: UV–Vis diffuse reflectance spectra (DRS) of Zn–Ni, Zn–Ni/ZnS (5–20 g/L), and Zn–Ni/Al2O3 coating powders, together with the corresponding Tauc plots for direct bandgap estimation. The Zn–Ni/ZnS composites exhibit a distinct UV absorption edge with a slight red-shift as ZnS content increases up to 15 g/L; the Zn–Ni/15 g/L ZnS sample shows an estimated bandgap of ~3.65 eV.
3.5 Corrosion Performance Evaluation
The potentiodynamic polarization curves for all coatings in 3.5% NaCl are presented in Fig. 7a, and the extracted electrochemical parameters are compiled in Table 3. The pure Zn–Ni coating exhibits an Ecorr of −1.032 V vs. SCE and an icorr of 8.47 μA cm−2. When interpreted against the measured incorporated ZnS fraction (Table 2), the corrosion improvement tracks the rise in incorporated ZnS from 0 to 3.68 wt% (15 g L−1 condition): icorr decreases progressively to 1.82 μA cm−2 and Rct increases to 32.6 kΩ·cm2. At the highest bath loading (20 g L−1), incorporated ZnS decreases to 2.95 wt% and the cross-sections exhibit more defect-like features, which coincides with a partial regression in electrochemical performance (icorr = 2.45 μA cm−2; Rct = 24.1 kΩ·cm2). The anodic Tafel slope (βa) increases for the nanocomposites, indicating a slowing of the anodic dissolution (Zn → Zn2+ + 2e−) process. The improved electrochemical response of the Zn–Ni/ZnS coatings (lower icorr and higher Rct) is consistent with generic microstructural/barrier effects typical of particle-reinforced electrodeposits. Specifically, the XRD/SEM trends toward grain refinement and the more compact morphology at 10–15 g L−1 ZnS are consistent with reduced defect connectivity and increased transport tortuosity. In parallel, incorporation of a largely insulating second phase can reduce the electrolyte-accessible metallic area and modify interfacial charge storage, which is consistent with the observed increase in Rct and reduction in CPE magnitude. Because Zn-based coatings in chloride media form time-dependent corrosion products, and because sulfide surfaces may evolve under oxidative exposure, we explicitly note that ZnS-specific chemical interactions are possible but unverified here; therefore, our mechanistic interpretation is limited to the evidence supported by early-stage electrochemical metrics and the observed compactness/defect trends, and we avoid attributing corrosion protection to sulfur-derived passivation without post-exposure XPS/Raman. First, Zn–Ni corrosion performance is well known to depend on alloy phase/composition—particularly the predominance of the γ-Ni5Zn21 phase at intermediate Ni contents—because phase constitution and micro-galvanic heterogeneity influence dissolution kinetics and film development; in our coatings, the γ-phase is dominant and the average Ni content remains essentially constant (13.5 ± 0.8 wt%), meaning that the main changes observed with ZnS addition are best interpreted as microstructure/defect-controlled rather than composition-driven. Second, the presence of a largely insulating second phase can lower the electrolyte-accessible electrochemically active area and alter interfacial charge storage; this interpretation is consistent with our EIS fitting trend (higher Rct together with a marked decrease in the CPE magnitude Y0), which is widely used to indicate a less accessible interface and/or reduced effective capacitance of the corroding surface. Finally, Zn-based coatings in chloride media develop time-dependent surface corrosion products (e.g., ZnO/Zn(OH)2 and basic zinc chloride phases such as simonkolleite) that can progressively modify the impedance response and apparent kinetics; in the present work, we therefore confine the mechanistic interpretation of the 1 h EIS/polarization results to early-stage barrier/active-area effects and avoid claiming a specific corrosion-product chemistry modification by ZnS without post-exposure surface analysis. The electrochemical dataset presented here does not uniquely prove a sulfide-specific inhibition mechanism; therefore, any ZnS-specific contribution is not claimed beyond its demonstrated role as an incorporated second phase that modifies microstructure and transport pathways. For completeness, we note that zinc coatings in chloride media commonly form protective basic zinc salts such as simonkolleite and related products, but identifying whether ZnS alters the corrosion-product chemistry would require post-exposure phase/chemical analysis [37]. The coating with 20 g/L ZnS shows a slight deterioration in performance, likely due to the increased porosity and agglomeration observed in SEM, which can create localized galvanic cells or defects. It is emphasized that, although ZnS incorporation is verified by FTIR (Zn–S vibration) and by sulfur mapping in cross-sectional EDS, the present dataset does not resolve the chemical state of sulfur at the outermost corrosion-active surface during immersion. Therefore, corrosion improvement is not ascribed to sulfur-derived passivation; confirming (or refuting) any sulfur-containing surface species would require post-exposure surface spectroscopy such as XPS of the S 2p region.
Table 3: Electrochemical parameters from potentiodynamic polarization tests in 3.5% NaCl.
| Coating Sample | E_corr (V vs. SCE) | i_corr (μA/cm2) | β_a (mV/dec) | β_c (mV/dec) | Corrosion Rate (mm/y) |
|---|---|---|---|---|---|
| Mild Steel | −0.658 | 25.31 | 98 | 145 | 0.294 |
| Zn–Ni | −1.032 ± 0.015 | 8.47 ± 0.41 | 52 ± 3 | 121 ± 5 | 0.098 |
| Zn–Ni/ZnS (5) | −1.015 ± 0.012 | 5.12 ± 0.35 | 61 ± 4 | 118 ± 4 | 0.059 |
| Zn–Ni/ZnS (10) | −1.002 ± 0.010 | 3.05 ± 0.28 | 68 ± 3 | 115 ± 4 | 0.035 |
| Zn–Ni/ZnS (15) | −0.981 ± 0.008 | 1.82 ± 0.15 | 75 ± 3 | 112 ± 3 | 0.021 |
| Zn–Ni/ZnS (20) | −0.990 ± 0.011 | 2.45 ± 0.20 | 70 ± 3 | 114 ± 3 | 0.028 |
| Zn–Ni/Al2O3 | −0.995 ± 0.009 | 3.15 ± 0.25 | 65 ± 3 | 117 ± 4 | 0.037 |
The Nyquist and Bode plots from EIS measurements after 1 h of immersion are shown in Fig. 7b. The Nyquist plots for all coatings exhibit a single, depressed capacitive loop. The diameter of this loop, which corresponds to the charge transfer resistance (Rct), increases markedly with Zn–Ni/ZnS nanocomposite formation. The Bode phase plots show a single time constant in the medium-frequency range. The experimental data were fitted using the equivalent circuit [Rs(Q[RctW])], where Rs is solution resistance, Q is a constant phase element (CPE) representing the double-layer capacitance, Rct is charge transfer resistance, and W is a Warburg element representing diffusion, which became significant for the best-performing coatings. The fitted parameters are listed in Table 4. Because the impedance spectra were collected after 1 h immersion, the extracted parameters (e.g., Rct and CPE descriptors) are used here to compare early-stage barrier/charge-transfer characteristics among coatings; they are not used to claim long-term stability, since the impedance response of Zn-based systems in chloride media can evolve with time as corrosion products develop and transport pathways change. For clarity, the microhardness trends are not used to interpret corrosion behavior; corrosion protection is discussed strictly in terms of icorr/Ecorr and EIS parameters (e.g., Rct/CPE, diffusion features) and their linkage to coating compactness and defect-controlled transport.
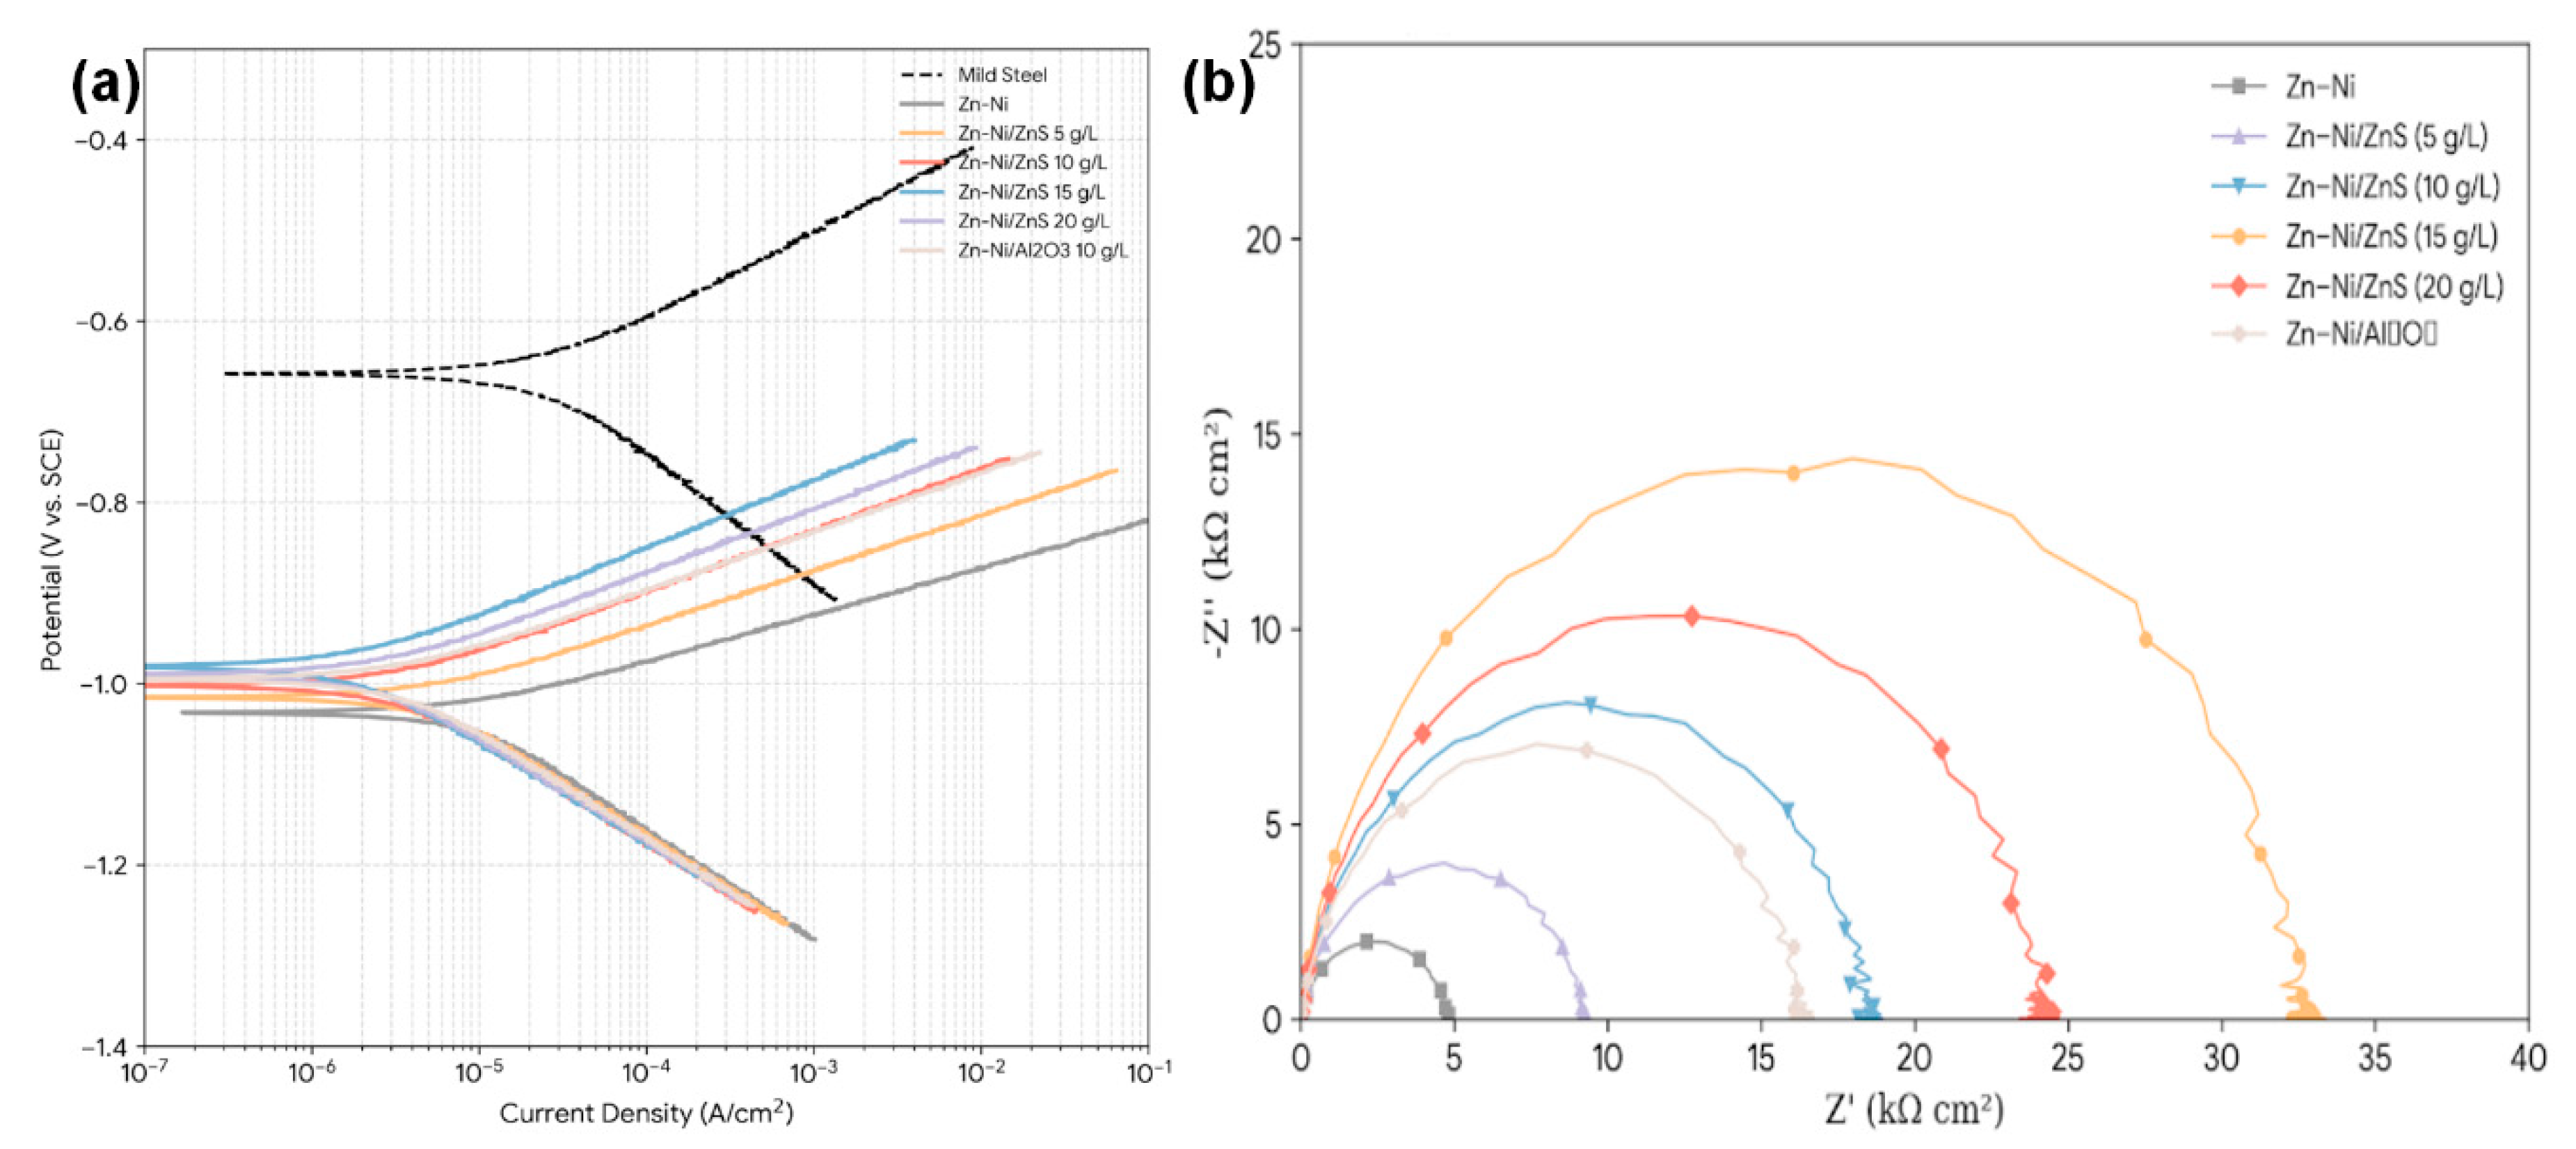
Figure 7: (a) Potentiodynamic polarization curves of mild steel, Zn–Ni, Zn–Ni/ZnS (5–20 g/L), and Zn–Ni/Al2O3 coatings measured in 3.5 wt% NaCl solution. (b) Nyquist plots of Zn–Ni, Zn–Ni/ZnS (5–20 g/L), and Zn–Ni/Al2O3 coatings after 1 h immersion in 3.5 wt% NaCl.
Table 4: EIS fitting parameters for coatings after 1 h in 3.5% NaCl.
| Coating Sample | Rct (kΩ·cm2) | CPE (Y0) (μS·sⁿ/cm2) | n (CPE Exponent) |
|---|---|---|---|
| Zn–Ni | 4.8 ± 0.3 | 85 ± 5 | 0.88 |
| Zn–Ni/ZnS (5) | 9.2 ± 0.5 | 52 ± 4 | 0.90 |
| Zn–Ni/ZnS (10) | 18.5 ± 1.0 | 38 ± 3 | 0.91 |
| Zn–Ni/ZnS (15) | 32.6 ± 1.5 | 21 ± 2 | 0.92 |
| Zn–Ni/ZnS (20) | 24.1 ± 1.2 | 29 ± 2 | 0.91 |
| Zn–Ni/Al2O3 | 16.3 ± 0.9 | 41 ± 3 | 0.90 |
The Rct value for the Zn–Ni/15gL-ZnS coating (32.6 kΩ·cm2) is nearly 7 times higher than that of the pure Zn–Ni coating (4.8 kΩ·cm2), indicating a drastically slower electrochemical corrosion reaction at the interface. Concurrently, the CPE parameter Y0, related to the double-layer capacitance, decreases significantly. This reduction is consistent with a less accessible metallic surface area due to the coverage by insulating ZnS nanoparticles and a denser, less defective coating structure [38]. The increase in the CPE exponent n towards 1 for the nanocomposites suggests a more ideal capacitive behavior, implying a smoother and more homogeneous surface. Taken together, our data support a dominant role of microstructure-controlled barrier behavior in governing early-stage corrosion resistance (EIS collected after 1 h immersion), but they also indicate that the response i Zn–Ni matrix provides the baseline corrosion behavior, while ZnS incorporation is associated with changes that are consistent with less connected defect networks/longer effective transport paths and a reduced electrolyte-accessible metallic area (reflected by the reduced CPE magnitude). These interpretations follow common EIS usage in coating science; however, they are presented here as evidence-consistent inferences, not as direct measurements of permeability or defect connectivity. Because we did not perform post-exposure surface spectroscopy/phase mapping of corrosion products, we do not claim that ZnS alters corrosion-product chemistry; rather, we present densification and active-area/kinetics effects as the evidence-supported explanations, and we identify corrosion-product/speciation effects as a topic for future work.
Regarding the fate of ZnS during corrosion, the present work confirms ZnS incorporation in the as-deposited coatings (FTIR Zn–S vibration, cross-sectional S mapping, and TEM/HRTEM in the representative 15 g L−1 sample), but it does not identify the sulfur chemical state at the corrosion-active outer surface after NaCl exposure. Therefore, while our dataset supports a dominant barrier/active-area interpretation associated with refinement/compactness and reduced interface accessibility, we cannot exclude that ZnS (or sulfur-containing species formed near the surface) may influence corrosion-product chemistry during exposure. Resolving this question requires post-exposure surface spectroscopy (XPS S 2p, Raman mapping of zinc corrosion products) and time-dependent electrochemical tracking; these are identified as future work rather than claimed as mechanisms in the present manuscript.
Although the microhardness increases with ZnS addition, hardness is not used here to explain corrosion protection, because corrosion resistance is governed by interfacial electrochemical kinetics and ion transport through coating defects. In this work, corrosion improvement is supported directly by the measured decreases in icorr and increases in Rct together with the observed refinement/compactness trends (reduced defect connectivity), rather than by mechanical strengthening metrics.
The results of the 500-h neutral salt spray test are summarized in Fig. 8 and Table 5. The uncoated mild steel substrate developed red rust within 4 h. The pure Zn–Ni coating showed the first signs of white corrosion products (zinc salts) after 120 h, with red rust appearing at approximately 280 h. The Zn–Ni/Al2O3 coating delayed red rust to about 380 h. Remarkably, the Zn–Ni/15gL-ZnS coating exhibited only a uniform layer of white corrosion products over the entire surface after 500 h, with no visible red rust. This outcome indicates sustained protection of the steel substrate over the 500 h ASTM B117 exposure window, consistent with a more compact and less defect-connected coating microstructure; however, this accelerated salt spray result is reported as test-condition durability evidence and is not used to infer immersion-time stability mechanisms beyond the duration and conditions evaluated here [39].
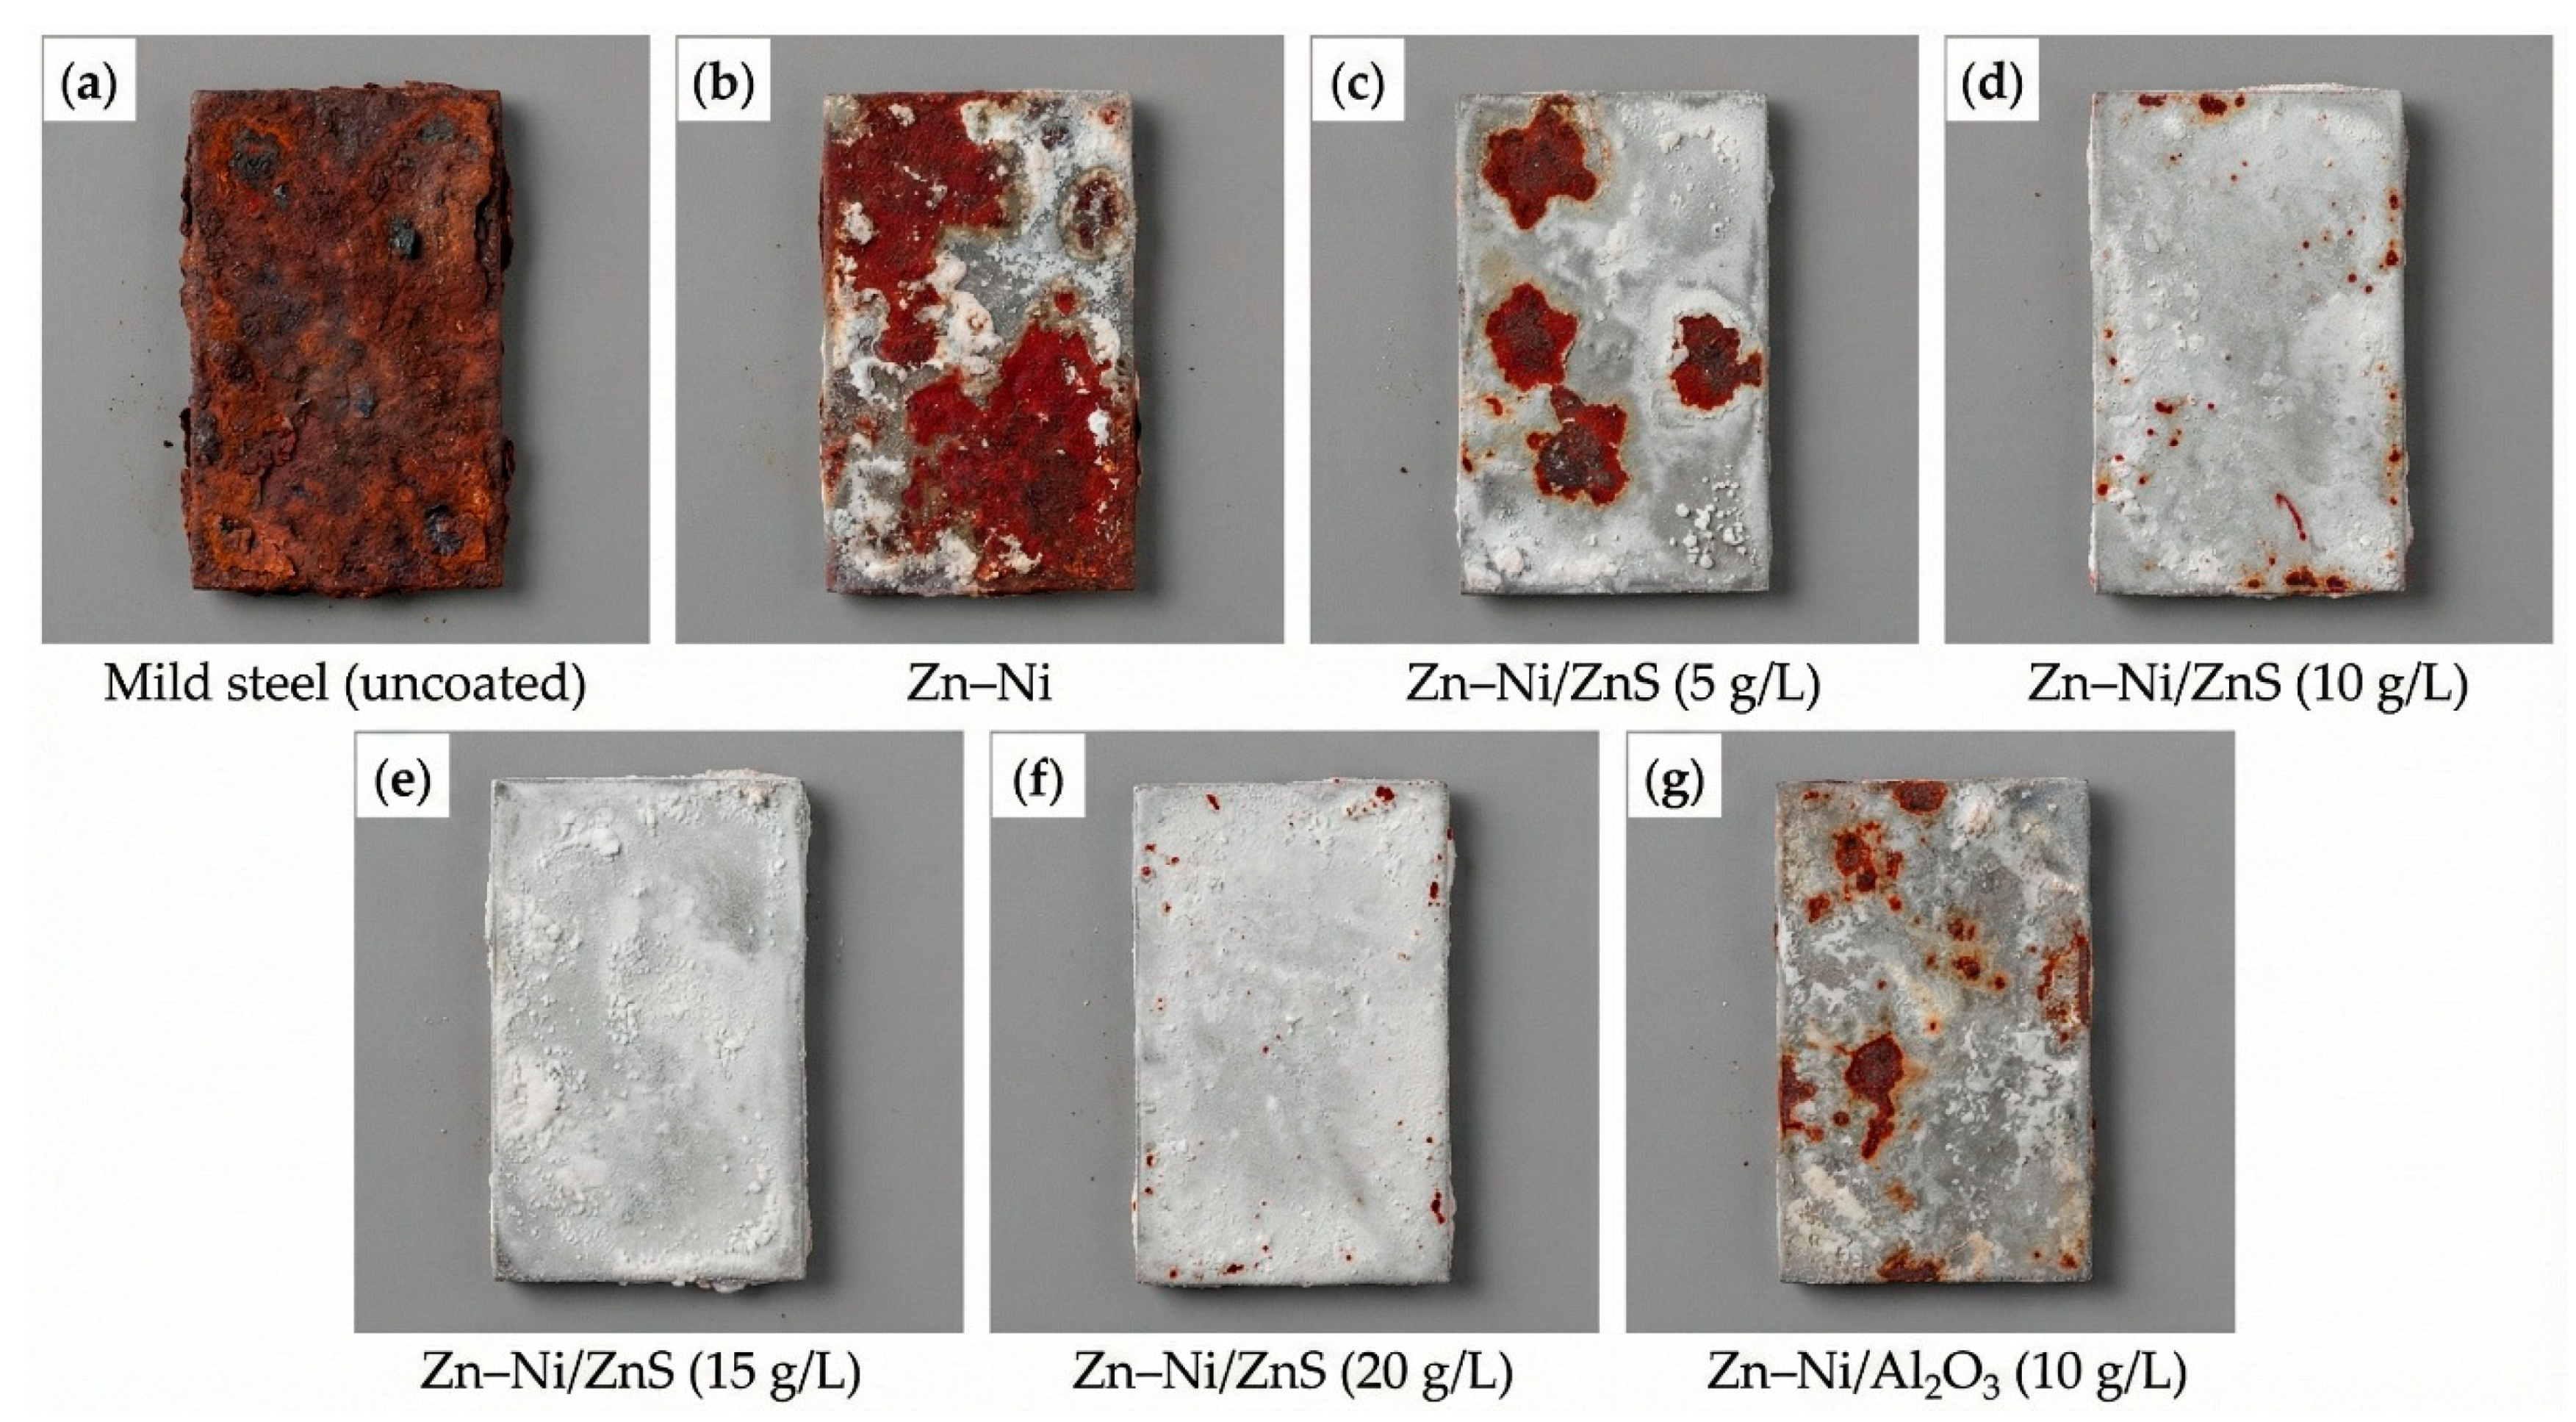
Figure 8: Representative photographs of coated and uncoated specimens after 500 h neutral salt spray exposure (ASTM B117).
Table 5: Salt spray test (ASTM B117) performance summary.
| Coating Sample | Time to First White Rust (hours) | Time to First Red Rust (hours) | Appearance after 500 h |
|---|---|---|---|
| Mild Steel | <2 | 4 ± 1 | Complete red rust |
| Zn–Ni | 120 ± 10 | 280 ± 15 | 60% red rust |
| Zn–Ni/ZnS (5) | 180 ± 15 | 350 ± 20 | 30% red rust |
| Zn–Ni/ZnS (10) | 250 ± 20 | 420 ± 25 | 10% red rust |
| Zn–Ni/ZnS (15) | 320 ± 25 | >500 | Uniform white rust |
| Zn–Ni/ZnS (20) | 290 ± 20 | 460 ± 30 | 5% red rust |
| Zn–Ni/Al2O3 | 200 ± 15 | 380 ± 20 | 20% red rust |
3.6 Mechanical and Tribological Performance
The Vickers microhardness values of the coating cross-sections are plotted in Fig. 9. The pure Zn–Ni coating has a hardness of 245 ± 12 HV. The hardness increases steadily with ZnS content, reaching a maximum of 398 ± 15 HV for the Zn–Ni/15gL-ZnS coating—an increase of over 60%. The Zn–Ni/Al2O3 coating showed a hardness of 365 ± 14 HV. This significant hardening is a classic hallmark of dispersion strengthening [40]. The hard ZnS nanoparticles, strongly bonded to the matrix as seen in HRTEM, impede the motion of dislocations under an applied load. According to the Orowan strengthening mechanism, the finer and more uniformly distributed the particles, the greater the hardening effect, which aligns perfectly with the observed grain refinement and particle distribution [41]. The slight drop in hardness for the 20 g/L sample correlates with its less optimal microstructure.
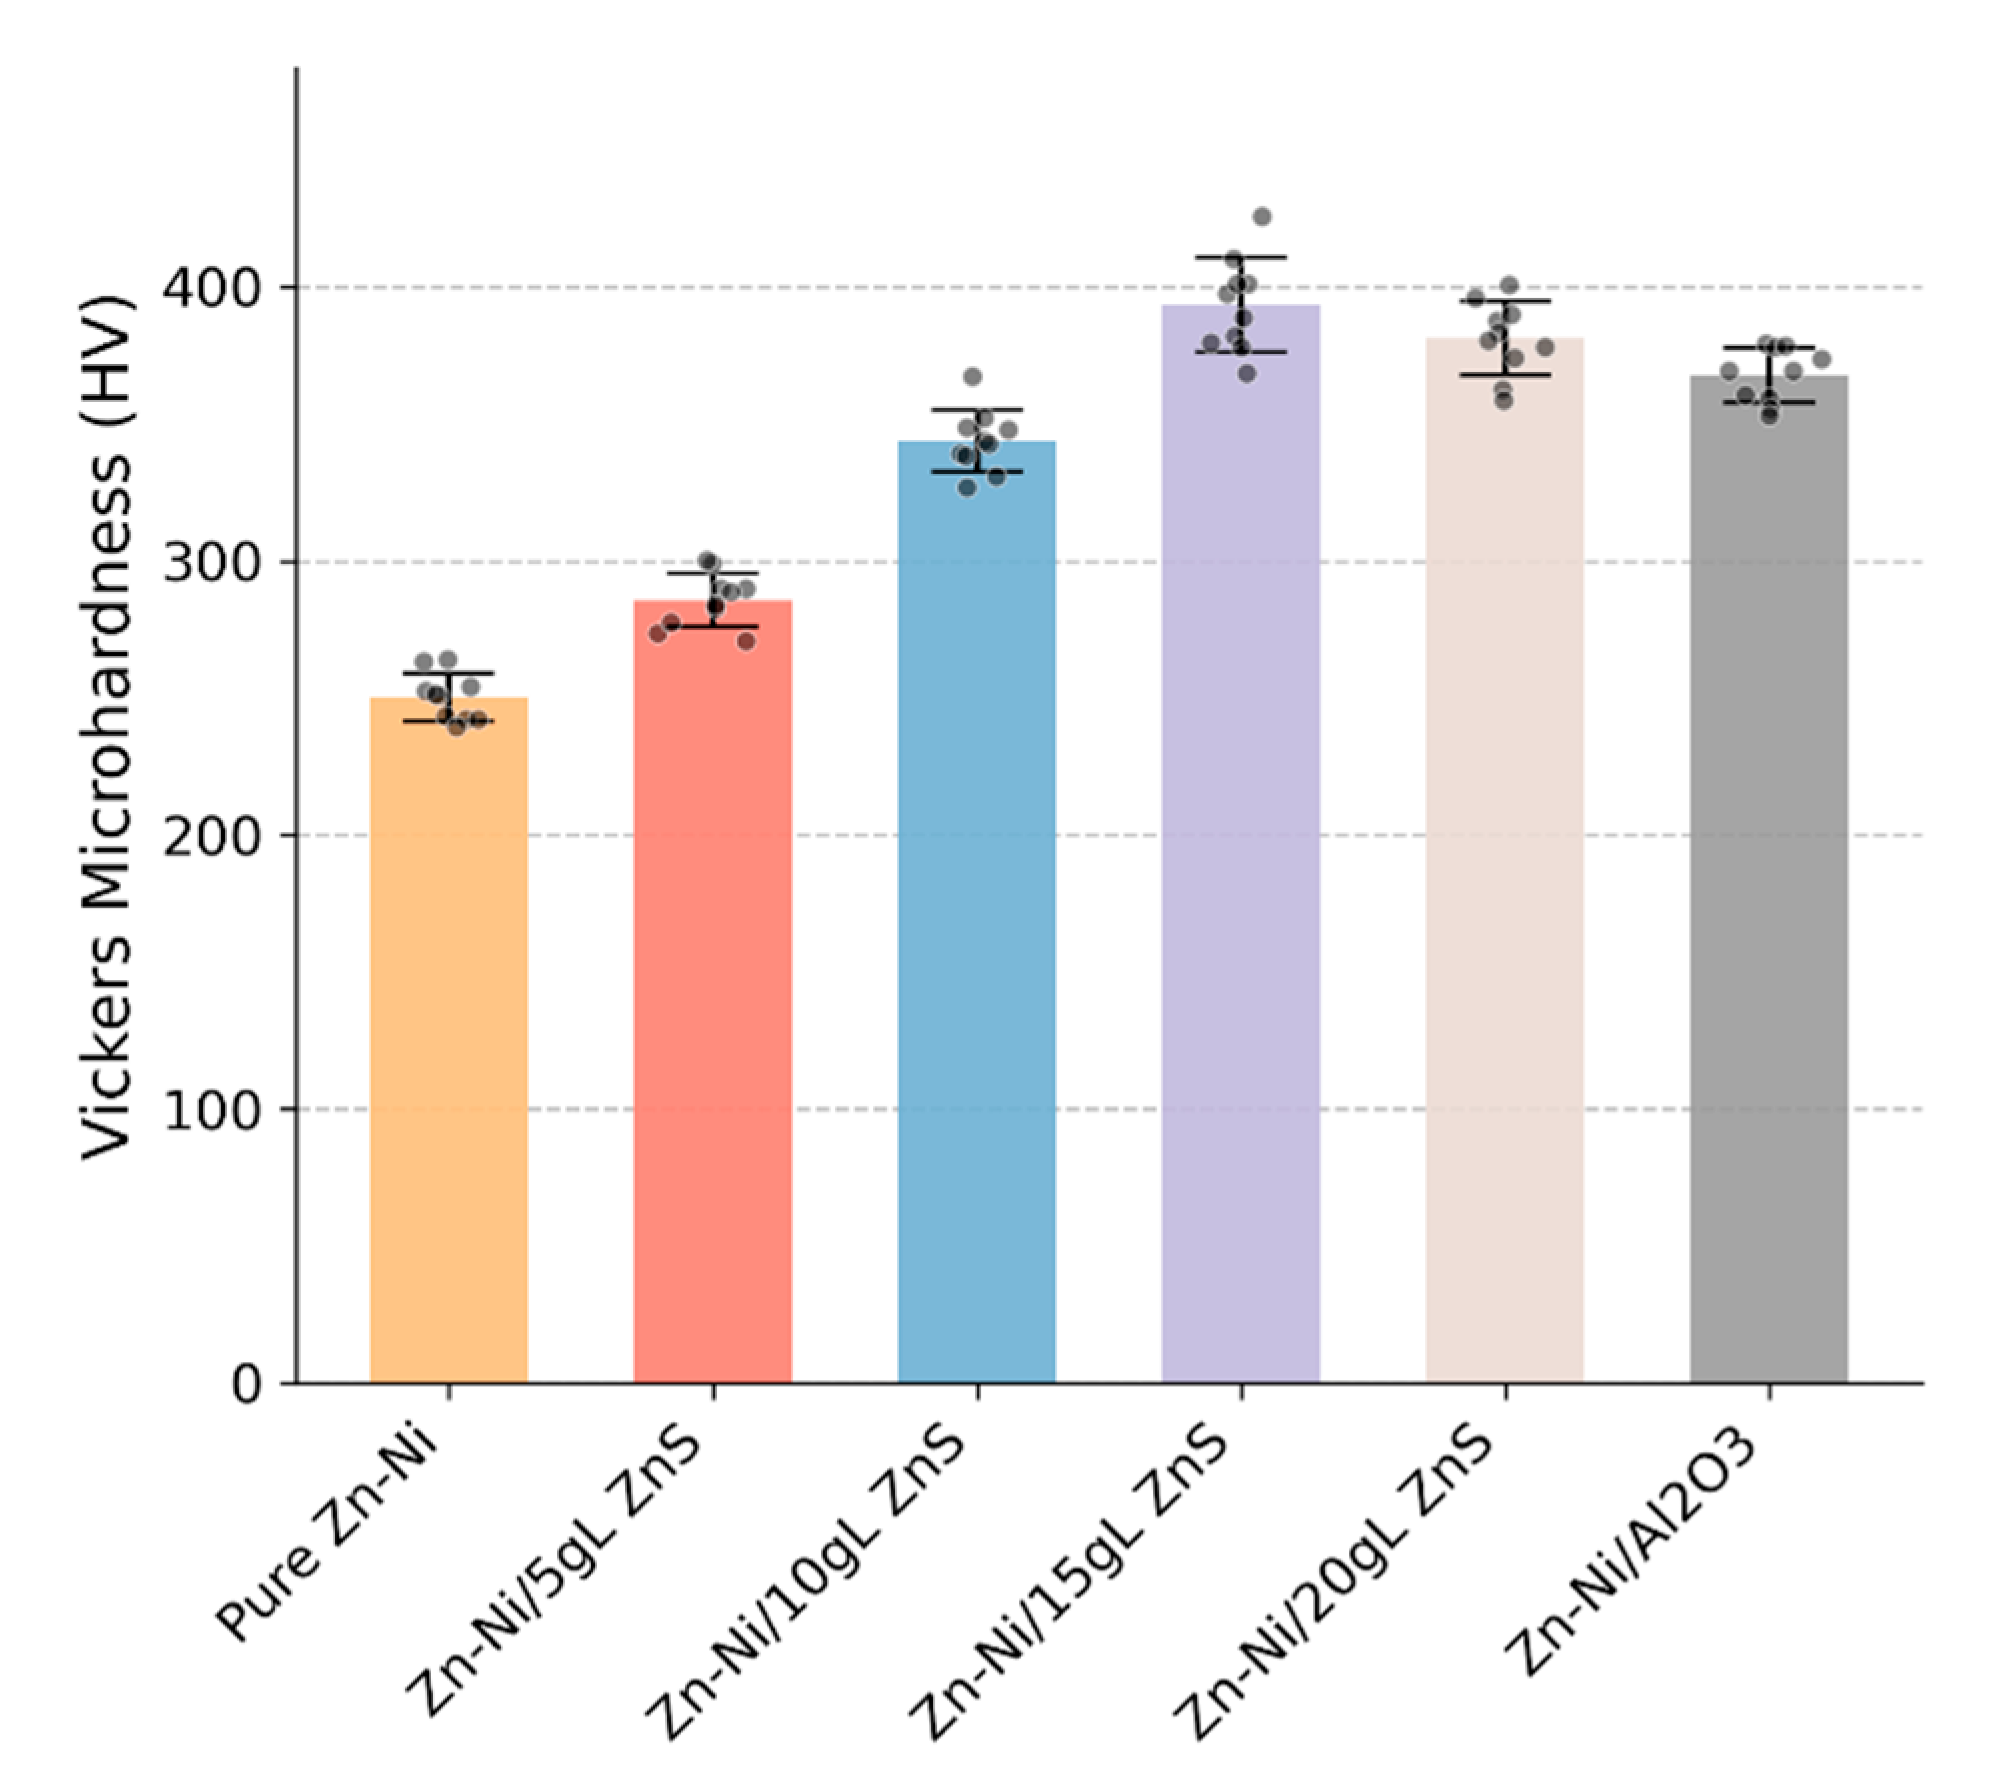
Figure 9: Vickers microhardness of the cross-sections of Zn–Ni, Zn–Ni/ZnS (5–20 g/L in bath), and benchmark Zn–Ni/Al2O3 composite coatings deposited on mild steel.
The wear performance data is graphically represented in Fig. 10a (wear volume loss) and Fig. 10b (coefficient of friction vs. sliding distance). The pure Zn–Ni coating shows a wear volume loss of (1.85 ± 0.12) × 10−3 mm3. All nanocomposite coatings exhibit superior wear resistance. Under the present dry-sliding pin-on-disc conditions (ASTM G99; 10 N, 0.1 m/s, 1000 m; alumina counterface), all nanocomposite coatings exhibit superior wear resistance relative to the particle-free Zn–Ni coating. The Zn–Ni/15gL-ZnS coating again performs best, with a wear loss of only (0.52 ± 0.05) × 10−3 mm3, a reduction of 72% compared to the pure alloy. To present a normalized tribological comparison, wear is also expressed as specific wear rate, V/(F·L), which removes dependence on the chosen load and sliding distance. Using F = 10 N and L = 1000 m, the Zn–Ni/15 g L−1 ZnS coating yields 5.2 × 10⁻⁸ mm3 N−1 m−1, compared with 7.1 × 10⁻⁸ mm3 N−1 m−1 for the Zn–Ni/Al2O3 benchmark, confirming that the improvement remains when reported in normalized form. The average steady-state coefficient of friction (COF) follows a similar trend, decreasing from 0.68 ± 0.03 for pure Zn–Ni to 0.45 ± 0.02 for the Zn–Ni/15gL-ZnS composite.
While ASTM G99 dry-sliding tests provide a standardized and reproducible baseline to compare coating formulations, ‘realistic service conditions’ can involve lubrication, abrasive third-body particles, elevated temperatures, reciprocating contacts, or simultaneous corrosion and wear (tribo-corrosion). Therefore, the present conclusions are confined to the controlled dry-sliding regime studied here. Extending the assessment to service-matched duty cycles would require additional testing matrices (e.g., lubricated wear, abrasive wear, and tribo-corrosion protocols combining sliding with electrochemical monitoring), which are identified as future work.
To support generalization toward practical environments, two service-matched extensions are identified explicitly. First, lubricated wear testing (e.g., oil or water-based lubricants relevant to the target mechanism) should be performed across representative regimes (boundary → mixed lubrication), since lubricant-derived tribofilms and starvation can alter both friction and wear. Second, for components exposed to saline/moist environments, tribocorrosion testing is needed because simultaneous wear and electrochemical dissolution can produce material loss that is not simply additive. Such tests can be implemented by coupling sliding with electrochemical monitoring (open-circuit potential/currenturing or after sliding) and by quantifying wear–corrosion synergy using established ASTM guidance (ASTM G119). In this context, our corrosion durability results in 3.5 wt% NaCl and neutral salt spray provide evidence that the optimized Zn–Ni/ZnS microstructure improves barrier performance under static exposure, but future tribocorrosion work is required to determine whether the same formulation remains optimal when passive film removal, depassivation–repassivation kinetics, and debris-assisted corrosion are active under sliding, as widely discussed in tribocorrosion mapping/synergy literature.
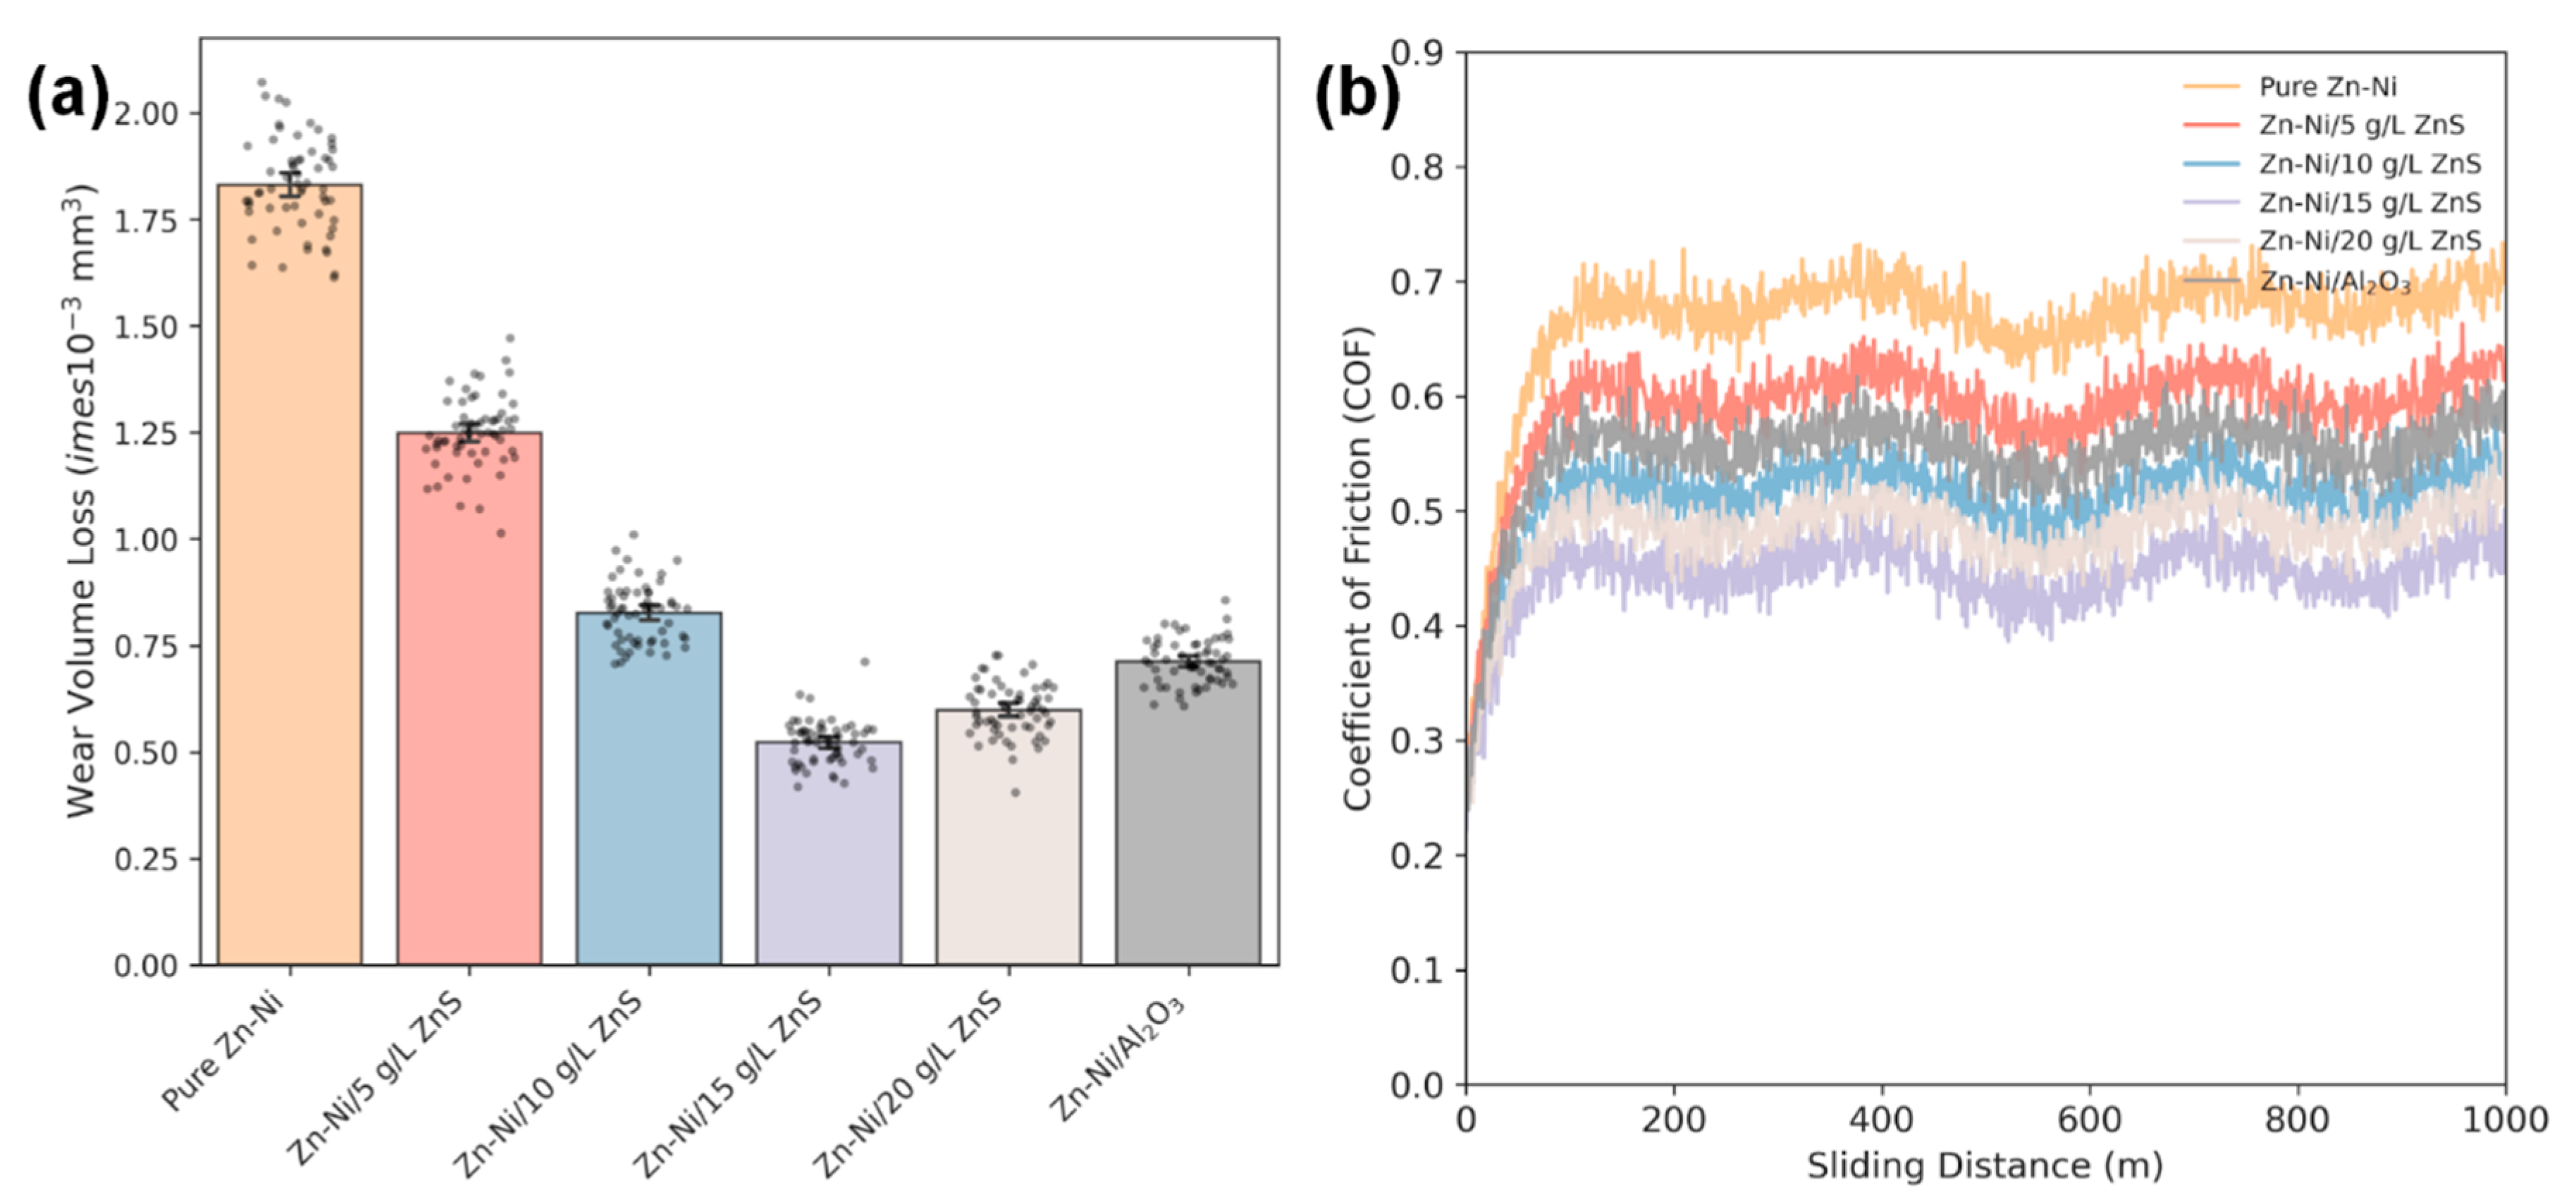
Figure 10: (a) Wear volume loss of Zn–Ni, Zn–Ni/ZnS (5–20 g/L), and Zn–Ni/Al2O3 coatings measured by a pin-on-disc tribometer under dry sliding conditions using an alumina ball (6 mm diameter) counterface. Tests were conducted at 10 N normal load, 0.1 m/s sliding speed, and 1000 m total sliding distance; wear volume was calculated from 3D profilometry of the wear track. The Zn–Ni/15 g/L ZnS coating shows the lowest wear loss (0.52 × 10⁻³ mm3), compared with pure Zn–Ni (1.85 × 10⁻³ mm3) and Zn–Ni/Al2O3 (0.71 × 10⁻³ mm3). (b) Coefficient of friction (COF) as a function of sliding distance for Zn–Ni, Zn–Ni/ZnS (5–20 g/L), and Zn–Ni/Al2O3 coatings recorded during dry pin-on-disc tests (alumina ball, 6 mm; 10 N; 0.1 m/s; 1000 m). ZnS incorporation reduces the steady-state COF, decreasing from ~0.68 for pure Zn–Ni to ~0.45 for the Zn–Ni/15 g/L ZnS coating.
3.7 Synergistic Mechanisms and Optimal Composition
The observed maxima in corrosion and wear performance at intermediate ZnS addition (10–15 g L−1) and the partial regression at higher bath loading (20 g L−1) are consistent with the classical behavior of electrodeposited metal–matrix nanocomposite coatings. In such systems, increasing particle availability can enhance incorporation and promote matrix refinement/compactness up to an optimum range; beyond this range, dispersion deterioration (agglomeration), particle-transport saturation, and disturbed electrocrystallization can introduce microdefects and reduce the effectiveness of the barrier/strengthening contributions.
In the present Zn–Ni/ZnS coatings, this classical trade-off is supported by the combined evidence that (i) crystallite size decreases to a minimum at 15 g L−1, (ii) cross-sectional observations and image analysis indicate increased defect-like dark features at 20 g L−1, and (iii) the measured incorporated ZnS proxy (S-based quantification) increases up to 15 g L−1 and then decreases at 20 g L−1, consistent with saturation/agglomeration effects.
Accordingly, grain refinement and agglomeration are discussed here as established, generic structure-controlling features of composite electrodeposition rather than as newly proposed mechanisms. The contribution of ZnS is evidenced as that of an incorporated second phase that tunes microstructure and transport/tribological response under our deposition conditions. A direct, sulfide-specific chemical mechanism is not claimed based solely on electrochemical/tribological trends. To address whether ZnS is fundamentally different from oxide-based systems, we limit our conclusions to what is directly supported by our comparative dataset: under identical electrodeposition and testing conditions, the optimized Zn–Ni/15 g L−1 ZnS coating provides lower icorr and lower wear loss than the Zn–Ni/Al2O3 benchmark, demonstrating that ZnS is a competitive reinforcement choice in this matrix. Further differentiation of ZnS from oxide reinforcements would require targeted post-exposure surface analyses (e.g., XPS/Raman of corrosion products and wear-track tribofilms) to determine whether any ZnS-derived species participate in interfacial chemistry beyond generic barrier/dispersion strengthening effects; this is therefore identified as future work rather than asserted as a present mechanistic finding.
The comprehensive characterization reveals a clear synergy between the Zn–Ni matrix and the ZnS nanoparticles, leading to peak performance at the condition yielding the highest measured incorporated ZnS level (3.68 ± 0.30 wt% ZnS; 2.7 ± 0.3 vol%, Table 2), corresponding to the 15 g L−1 bath condition. The mechanisms are complementary but should be distinguished. ZnS incorporation refines the deposit and improves compactness, which enhances corrosion resistance primarily by reducing defect connectivity and increasing transport tortuosity (consistent with lower icorr and higher Rct). Separately, the same refinement/dispersion strengthening increases microhardness and reduces near-surface plastic deformation during sliding, which contributes to lower wear volume loss in the ASTM G99 dry-sliding configuration used here [42]. Furthermore, the strong particle/matrix interfacial integrity supports effective load transfer and resistance to particle pull-out, which is consistent with hardness-driven improvement in wear resistance. The slight decline in properties at 20 g/L ZnS is a classic example of an optimal particle loading being exceeded, leading to agglomeration, defect formation, and increased porosity, which counteract the benefits. The Zn–Ni/ZnS system outperforms the Al2O3 benchmark under the present test conditions. For corrosion, the improvement is attributed to the optimized microstructure achieved at intermediate particle loading (10–15 g/L), which maximizes compactness and transport tortuosity while avoiding agglomeration-induced defects at 20 g/L. For wear, the reduced friction and wear loss are consistent with dispersion strengthening and grain refinement (hardness increase), which reduce near-surface plastic deformation and suppress severe adhesive wear under the present dry sliding conditions.
It should be noted that the present study focuses on an experimentally driven evaluation of corrosion and wear behavior in electrodeposited Zn–Ni/ZnS nanocomposite coatings. Although modelling and simulation could further enhance mechanistic understanding, such analyses were not performed due to the lack of key input parameters, including detailed nanoparticle distribution statistics, particle–matrix interfacial properties, and the dynamic evolution of corrosion products and tribofilms. Future work will aim to combine advanced microstructural characterization with numerical and multiphysics modelling to quantitatively describe particle incorporation mechanisms, stress distribution, and corrosion–wear coupling in Zn–Ni-based nanocomposite systems.
This study developed and characterized electro-deposited Zn–Ni coatings incorporating ZnS nanoparticles, and systematically related ZnS bath addition (5–20 g L−1) to measured incorporation, microstructure, corrosion response, and dry-sliding wear performance. The performance maximum at 10–15 g L−1 ZnS and partial regression at 20 g L−1 follows the classical trend widely reported for electrodeposited nanocomposite coatings, where intermediate particle loading optimizes incorporation and microstructural refinement/compactness, while excessive loading promotes agglomeration and defect formation that can offset gains.
Within this established framework, the key contribution of the present work is the ZnS-specific dataset and validation: ZnS incorporation is directly supported by Zn–S vibrational features (FTIR), uniform S mapping, and TEM/HRTEM evidence, and the incorporated fraction is quantified across bath conditions using cross-sectional EDS as a practical proxy. Under identical deposition and testing conditions, the optimized Zn–Ni/15 g L−1 ZnS coating shows lower icorr and lower wear loss than the Zn–Ni/Al2O3 benchmark, indicating that ZnS is a competitive reinforcement phase relative to a widely used oxide control in Zn–Ni matrices. The present dataset does not establish oxide/carbide reinforcements reported in the literature; rather, it demonstrates performance competitiveness under strictly matched deposition and test conditions.
Mechanistic claims are confined to evidence-supported barrier/active-area effects associated with refinement/compactness and defect-controlled transport; we do not claim that the corrosion improvement is solely microstructural, and any ZnS-related chemical influence on corrosion-product chemistry is treated as plausible but unverified without post-exposure XPS/Raman.
Acknowledgement:
Funding Statement: The authors received no specific funding for this study.
Author Contributions: The authors confirm contribution to the paper as follows: study conception and experimental design: Wei Kang; electrodeposition experiments, coating preparation, and corrosion and wear testing: Wei Kang; materials characterization, data analysis, and interpretation of electrochemical, microstructural, and tribological results: Wei Kang and Juan Jin; comparative benchmarking and literature contextualization: Juan Jin; draft manuscript preparation: Wei Kang; critical revision of the manuscript for important intellectual content and scientific clarity: Juan Jin. All authors reviewed and approved the final version of the manuscript.
Availability of Data and Materials: The data supporting the findings of this study are available from the corresponding author upon reasonable request.
Ethics Approval: Not applicable.
Conflicts of Interest: The authors declare no conflicts of interest.
References
1. Nwokolo IK , Shi H , Liu F . MOF-based protective coatings for metal corrosion protection: a critical review of design/synthesis, performance, and mechanism. Mater Sci Eng B. 2025; 313: 117932. doi:10.1016/j.mseb.2024.117932. [Google Scholar] [CrossRef]
2. Lee L , Behera P , Sriraman KR , Chromik RR . The effect of contact stress on the sliding wear behaviour of Zn-Ni electrodeposited coatings. Wear. 2018; 400–401: 82– 92. doi:10.1016/j.wear.2017.12.018. [Google Scholar] [CrossRef]
3. Chung PP , Wang J , Durandet Y . Deposition processes and properties of coatings on steel fasteners—a review. Friction. 2019; 7( 5): 389– 416. doi:10.1007/s40544-019-0304-4. [Google Scholar] [CrossRef]
4. Okokpujie IP , Tartibu LK , Musa-Basheer HO , Adeoye AOM . Effect of coatings on mechanical, corrosion and tribological properties of industrial materials: a comprehensive review. J Bio Tribo Corros. 2024; 10: 2. doi:10.1007/s40735-023-00805-1. [Google Scholar] [CrossRef]
5. Maniam KK , Paul S . Corrosion performance of electrodeposited zinc and zinc-alloy coatings in marine environment. Corros Mater Degrad. 2021; 2( 2): 163– 89. doi:10.3390/cmd2020010. [Google Scholar] [CrossRef]
6. Qiao J , Wu G , Jiang S , Yong Z , Ma F , Jiao J . Synthesis, surface chemical characterization, and enhanced osteoblast response of strontium-substituted hydroxyapatite nanoparticles for alveolar bone regeneration. J Nanostruct Chem. 2025; 15: 152512. doi:10.57647/jnsc.2025.1503.12 [Google Scholar] [CrossRef]
7. Kumar CMP , Lakshmikanthan A , Chandrashekarappa MPG , Pimenov DY , Giasin K . Electrodeposition based preparation of Zn–Ni alloy and Zn–Ni–WC nano-composite coatings for corrosion-resistant applications. Coatings. 2021; 11( 6): 712. doi:10.3390/coatings11060712. [Google Scholar] [CrossRef]
8. Ullal Y , Chitharanjan Hegde A . Corrosion protection of electrodeposited multilayer nanocomposite Zn-Ni-SiO2 coatings. Surf Eng Appl Electrochem. 2013; 49: 161– 7. doi:10.3103/S1068375513020142 [Google Scholar] [CrossRef]
9. Tuaweri JT . Zinc and zinc alloy composite coatings for corrosion protection and wear resistance. Loughborough, UK: Loughborough University; 2005. [Google Scholar]
10. Borges AMC , Koga GY , Rigoli IC , Rocha CLF , Santana PMB , Sousa CAC . Electrodeposited Zn-Ni-sisal nanocrystals composite coatings—Morphology, structure and corrosion resistance. Mat Res. 2023; 26: e20230164. doi:10.1590/1980-5373-mr-2023-0164. [Google Scholar] [CrossRef]
11. Chakrabarti A , Alessandri E . Appl Nano. Syntheses, properties, and applications of ZnS-based nanomaterials. 2024; 5: 116– 42. doi:10.3390/applnano5030010. [Google Scholar] [CrossRef]
12. Labiadh H , Moualhi Y , Moualhi K , Othmani A , Zouaoui M . Synthesis of ZnS nanoparticles and the investigation of their structural, optical and electrical properties. Euro-Mediterr J Environ Integr. 2025; 10( 1): 119– 30. doi:10.1007/s41207-024-00691-0. [Google Scholar] [CrossRef]
13. Guglielmi N . Kinetics of the deposition of inert particles from electrolytic baths. J Electrochem Soc. 1972; 119: 1009. doi:10.1149/1.2404383 [Google Scholar] [CrossRef]
14. Bhat RS , Shetty SM , Kumar NA . Electroplating of Zn-Ni alloy coating on mild steel and its electrochemical studies. J Materi Eng Perform. 2021; 30( 11): 8188– 95. doi:10.1007/s11665-021-06051-1. [Google Scholar] [CrossRef]
15. Anwar S , Zhang Y , Khan F . Electrochemical behaviour and analysis of Zn and Zn–Ni alloy anti-corrosive coatings deposited from citrate baths. RSC Adv. 2018; 8: 28861– 73. doi:10.1039/C8RA04650F. [Google Scholar] [CrossRef]
16. Rao H , Li W , Zhao F , Song Y , Liu H , Zhu L , et al. Electrodeposition of high-quality Ni/SiC composite coatings by using binary non-ionic surfactants. Molecules. 2023; 28: 3344. doi:10.3390/molecules28083344 [Google Scholar] [CrossRef]
17. Leeuwenburgh SCG , Ana ID , Jansen JA . Sodium citrate as an effective dispersant for the synthesis of inorganic–organic composites with a nanodispersed mineral phase. Acta Biomater. 2010; 6: 836– 44. doi:10.1016/j.actbio.2009.09.005 [Google Scholar] [CrossRef]
18. Nölle R , Beltrop K , Holtstiege F , Kasnatscheew J , Placke T , Winter M . A reality check and tutorial on electrochemical characterization of battery cell materials: how to choose the appropriate cell setup. Mater Today. 2020; 32: 131– 46. doi:10.1016/j.mattod.2019.07.002. [Google Scholar] [CrossRef]
19. Wang Y , Qi Y . Study on electrodeposition of ZnNi/Al2O3 composite coating on 40Mn steel and its corrosion behavior in simulated concrete pore solution. Int J Electrochem Sci. 2022; 17( 10): 221037. doi:10.20964/2022.10.46. [Google Scholar] [CrossRef]
20. Anku WW , Oppong SOB , Shukla SK , Govender PP . Influence of ZnO concentration on the optical and photocatalytic properties of Ni-doped ZnS/ZnO nanocomposite. Bull Mater Sci. 2016; 39: 1745– 52. doi:10.1007/s12034-016-1310-z. [Google Scholar] [CrossRef]
21. Mahdavi S , Asghari-Alamdari A , Zolola-Meibodi M . Effect of alumina particle size on characteristics, corrosion, and tribological behavior of Co/Al2O3 composite coatings. Ceram Int. 2020; 46: 5351– 9. doi:10.1016/j.ceramint.2019.10.289 [Google Scholar] [CrossRef]
22. Tafreshi M , Allahkaram SR , Mahdavi S . A comparative investigation into corrosion and wear properties of Zn-Ni and Zn-Ni/PTFE coatings. JAME. 2018; 37( 3): 49– 62. doi:10.29252/jame.37.3.49. [Google Scholar] [CrossRef]
23. Abdellatif AS , Shahien M , El-Saeed AM , Zaki AH . Titanate–polyurethane–chitosan ternary nanocomposite as an efficient coating for steel against corrosion. Sci Rep. 2024; 14: 30562. doi:10.1038/s41598-024-81104-8. [Google Scholar] [CrossRef]
24. Pereira RFC , Oliveira ESD , Vieira MRS , Lima MAGA , Urtiga SL . Evaluation of Co-Ni/SiC nanocomposite coating obtained by electrodeposition on the corrosion resistance of API 5L X80 steel. Mater Res. 2017; 20: 221– 30. doi:10.1590/1980-5373-MR-2017-0025. [Google Scholar] [CrossRef]
25. Fawad M , Maqsood N , Nawaz A , Islam B , Zaheer MD , Skotnicová K . Synthesis, characterization, and enhanced optical and dielectric properties of pure and Ni-doped ZnO nanoparticles for advanced electronic applications. Results Eng. 2025; 26: 104824. doi:10.1016/j.rineng.2025.104824. [Google Scholar] [CrossRef]
26. Basak S , Nath D , Das R . Analysis of dominant and intense XRD peak of (111) plane of ZnS nanocrystals for microstructural study through single line Voigt method: Calculated low dislocation density value emphasizes larger stacking of (111) plane. J Mol Struct. 2023; 1293: 136273. doi:10.1016/j.molstruc.2023.136273. [Google Scholar] [CrossRef]
27. Sadeghi S , Javanshiri-Ghasemabadi J . Bimetallic metal organic framework/Ni doped ZnO nanomaterials modified carbon paste electrode for selective electrochemical determination of ciprofloxacin. RSC Adv. 2024; 14( 11): 7836– 49. doi:10.1039/d3ra08174e. [Google Scholar] [CrossRef]
28. Hedayati K , Zendehnam A , Hassanpour F . Fabrication and characterization of zinc sulfide nanoparticles and nanocomposites prepared via a simple chemical precipitation method. J Nanostruct. 2016; 6: 207– 12. doi:10.7508/JNS.2016.03.005. [Google Scholar] [CrossRef]
29. Devi LS , Devi KN , Sharma BI , Sarma HN . Effect of Mn2+ doping on structural, morphological and optical properties of ZnS nanoparticles by chemical Co-precipitation method. IOSR J Appl Phys. 2014; 6: 06– 14. doi:10.9790/4861-06220614. [Google Scholar] [CrossRef]
30. Giacomazzi L , Shcheblanov NS , Povarnitsyn ME , Li Y , Mavrič A , Zupančič B , et al. Infrared spectra in amorphous alumina: A combined ab initio and experimental study. Phys Rev Mater. 2023; 7: 045604. doi:10.1103/physrevmaterials.7.045604. [Google Scholar] [CrossRef]
31. Wang Z , Liu F , Han E , Ke W , Luo S . Effect of ZnO nanoparticles on anti-aging properties of polyurethane coating. Chin Sci Bull. 2009; 54: 3464– 72. doi:10.1007/s11434-009-0024-7. [Google Scholar] [CrossRef]
32. Protsenko VS , Danilov FI . Kinetic model of composite coatings electrodeposition assuming irreversible adsorption of dispersed particles on a growing metal substrate. J Electroanal Chem. 2022; 918: 116463. doi:10.1016/j.jelechem.2022.116463 [Google Scholar] [CrossRef]
33. Bi Y , Salehi S , Nateq K . Development of engineering coating based on alumina nanoparticles incorporated into a Ni–Co alloy matrix: Effect of current density and alumina bath loading on microstructure and electrochemical corrosion behavior. Mater Chem Phys. 2025; 332: 130222. doi:10.1016/j.matchemphys.2024.130222. [Google Scholar] [CrossRef]
34. Lei P , Dai B , Zhu J , Tian G , Chen X , Wang Y , et al. Interfacial composition and adhesion of sputtered-Y2O3 film on ZnS substrate. Appl Surf Sci. 2015; 351: 119– 24. doi:10.1016/j.apsusc.2015.05.109. [Google Scholar] [CrossRef]
35. Sadovnikov SI , Ishchenko AV , Weinstein IA . Synthesis and optical properties of nanostructured ZnS and heteronanostructures based on zinc and silver sulfides. J Alloys Compd. 2020; 831: 154846. doi:10.1016/j.jallcom.2020.154846 [Google Scholar] [CrossRef]
36. Chang S , Wang Y , Wang J , Hao Z , Yang Y , Wang Y , et al. Improved uniformity properties and corrosion resistance of zinc–nickel composite coating enhanced by nano-SiO2. Coatings. 2025; 15: 71. doi:10.3390/coatings15010071 [Google Scholar] [CrossRef]
37. Li Q , Feng Z , Liu L , Xu H , Ge W , Li F , et al. Deciphering the formation mechanism of a protective corrosion product layer from electrochemical and natural corrosion behaviors of a nanocrystalline zinc coating. RSC Adv. 2015; 5: 32479– 90. doi:10.1039/C5RA02777B. [Google Scholar] [CrossRef]
38. Wieczorek W , Mazur T , Górka-Kumik W , Dąbczyński P , Podborska A , Bernasik A , et al. Ultrathin high-efficiency zener diode fabricated using organized ZnS nanoparticles in surface-grafted poly(methacrylic acid) matrix. Adv Elect Materials. 2025; 11( 8): 2400772. doi:10.1002/aelm.202400772 [Google Scholar] [CrossRef]
39. Mohamed HEA , Afridi S , Khalil AT , Zia D , Shinwari ZK , Dhlamini MS , et al. Structural, morphological and biological features of ZnO nanoparticles using Hyphaene thebaica (L.) Mart. fruits. J Inorg Organomet Polym. 2020; 30( 8): 3241– 54. doi:10.1007/s10904-020-01490-0. [Google Scholar] [CrossRef]
40. Mahmud ZA , Amelotti F , Serpi C , Maskaric J , Mirabal M , Mingolo N , et al. Zinc + Nickel + Microparticles coatings: Production process and structural characterization. Procedia Mater Sci. 2015; 9: 377– 86. doi:10.1016/j.mspro.2015.05.007. [Google Scholar] [CrossRef]
41. Marghany M . Applied studies of coastal and marine environments. Toulon, France: InTech; 2016. doi:10.5772/60743. [Google Scholar] [CrossRef]
42. Yadav S , Raman APS , Singh MB , Massey I , Singh P , Verma C , et al. Green nanoparticles for advanced corrosion protection: Current perspectives and future prospects. Appl Surf Sci Adv. 2024; 21: 100605. doi:10.1016/j.apsadv.2024.100605 [Google Scholar] [CrossRef]
Cite This Article
 Copyright © 2026 The Author(s). Published by Tech Science Press.
This work is licensed under a Creative Commons Attribution 4.0 International License , which permits unrestricted use, distribution, and reproduction in any medium, provided the original work is properly cited.
 Downloads
 Citation Tools